Consensus designs and thermal stability determinants of a human glutamate transporter
- Institut Pasteur, France
- UMR 3528, CNRS, Institut Pasteur, France
- USR 2000, CNRS, Institut Pasteur, France
Figures
Figure 1 with 1 supplement
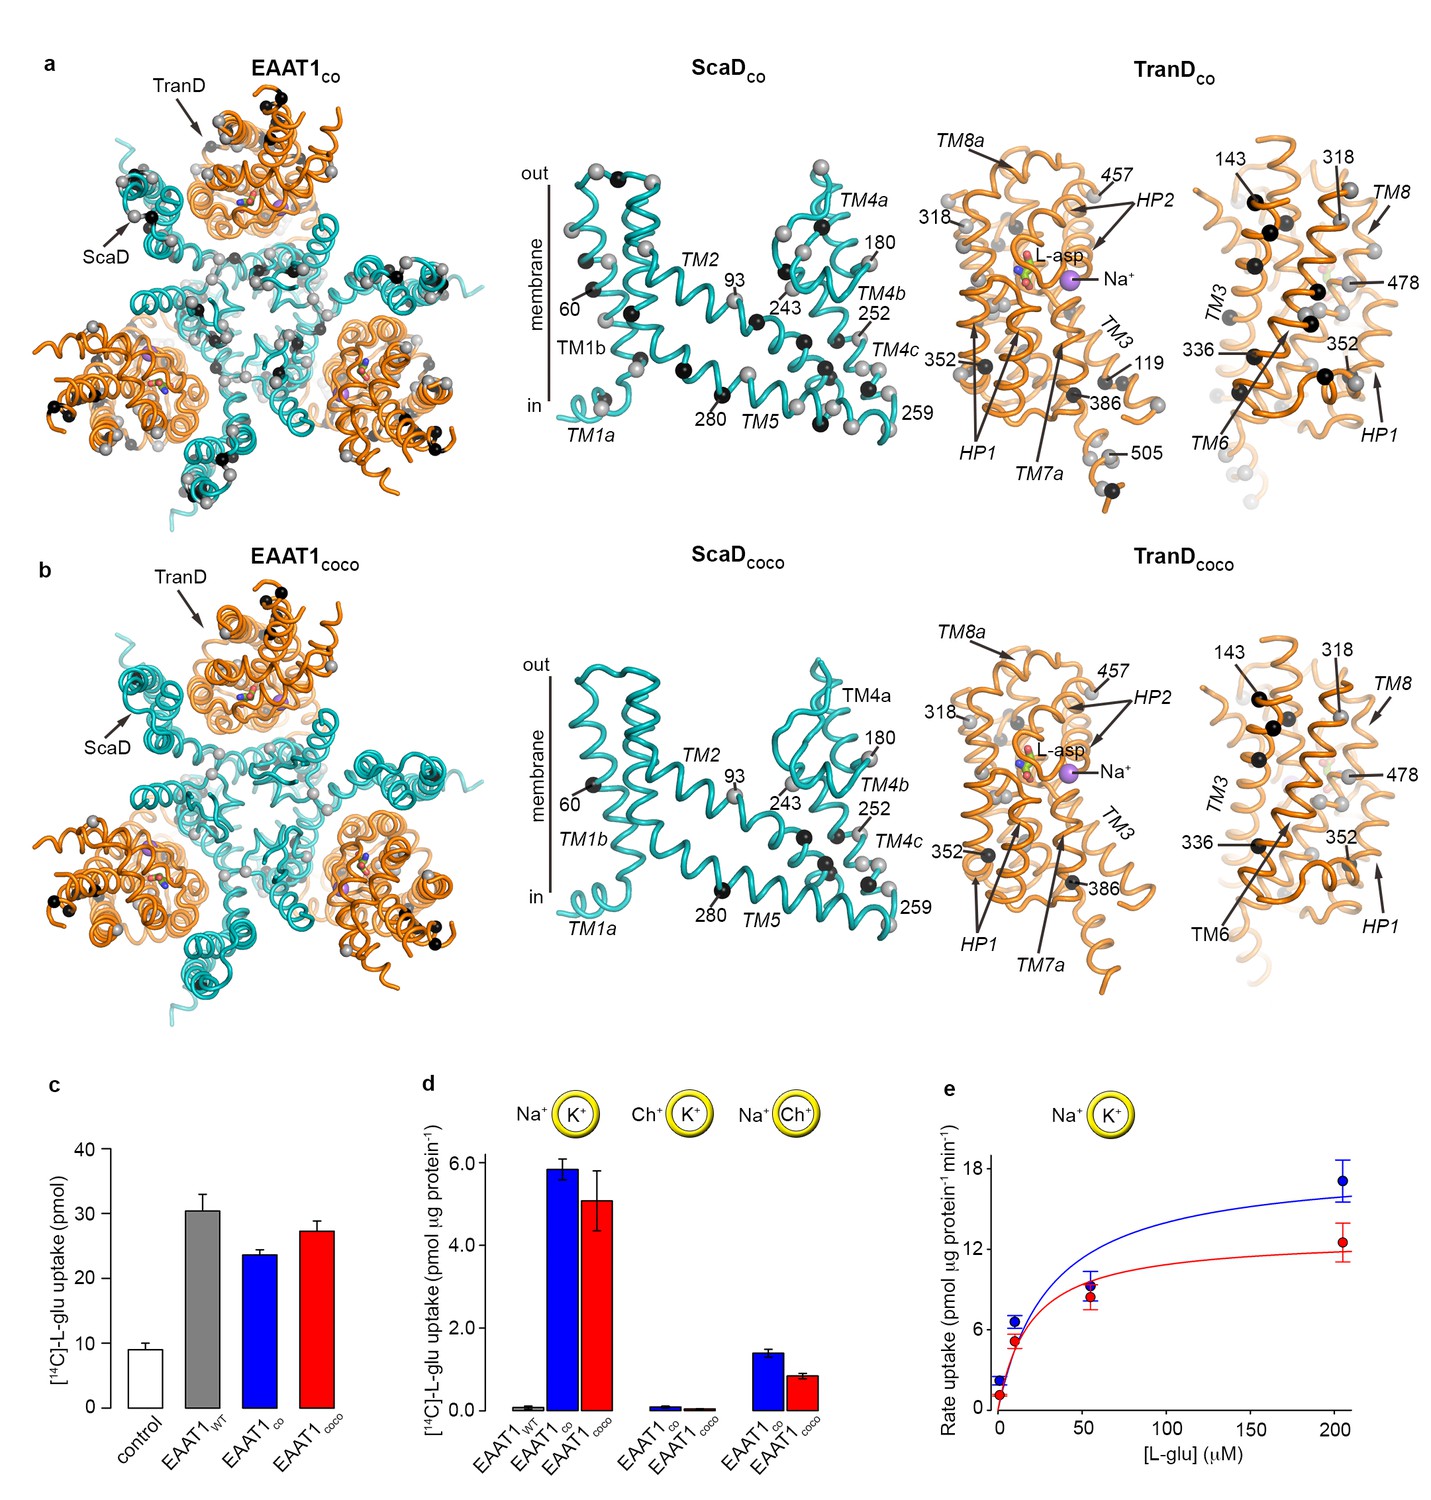
| EAAT1 consensus mutants.
(a-b) Residues exchanged for consensus amino acids in EAAT1CO (a) and EAAT1COCO (b) are mapped into the structure of the EAAT1CRYST (PDB 5LLM) trimer viewed from the extracellular medium (left panel), as well as the scaffold (cyan) and the transport (orange) domains viewed from the membrane. These domains are depicted separately for clarity of display, including two views of the transport domain separated ~ 180° from each other, showing its interface with the scaffold domain (left) and the membrane (right), respectively. Spheres correspond to the alpha carbon atoms of residues that were exchanged by conservative (grey) and non-conservative (black) consensus mutations. (c–d), Radioactive L-glutamate uptake in HEK293 cells expressing the transporters (c), including control cells transfected with a vector lacking EAAT1 genes, and in liposomes with purified reconstituted transporters (d). EAAT1WT data in (d) was originally published in ref. (29). Yellow circles depict the liposomal bilayer separating sodium- (Na+), potassium- (K+), and choline-based (Ch+) solutions. (e), Rate of L-glutamate uptake by purified EAAT1CO (blue) and EAAT1COCO (red) reconstituted in liposomes, as a function of L-glutamate concentration. Solid lines indicate Michaelis-Menten fits to the data with Km values 30.7 ± 25.6 and 18.8 ± 8.3 μM, and Vmax values 18.3 ± 4.3 and 12.8 ± 1.4 pmol μg−1 min−1 for EAAT1CO (blue) and EAAT1COCO (red), respectively. Plots in c–e) depict an average of at least three independent experiments performed with duplicate measurements, and error bars represent s.e.m.
Figure 1—figure supplement 1
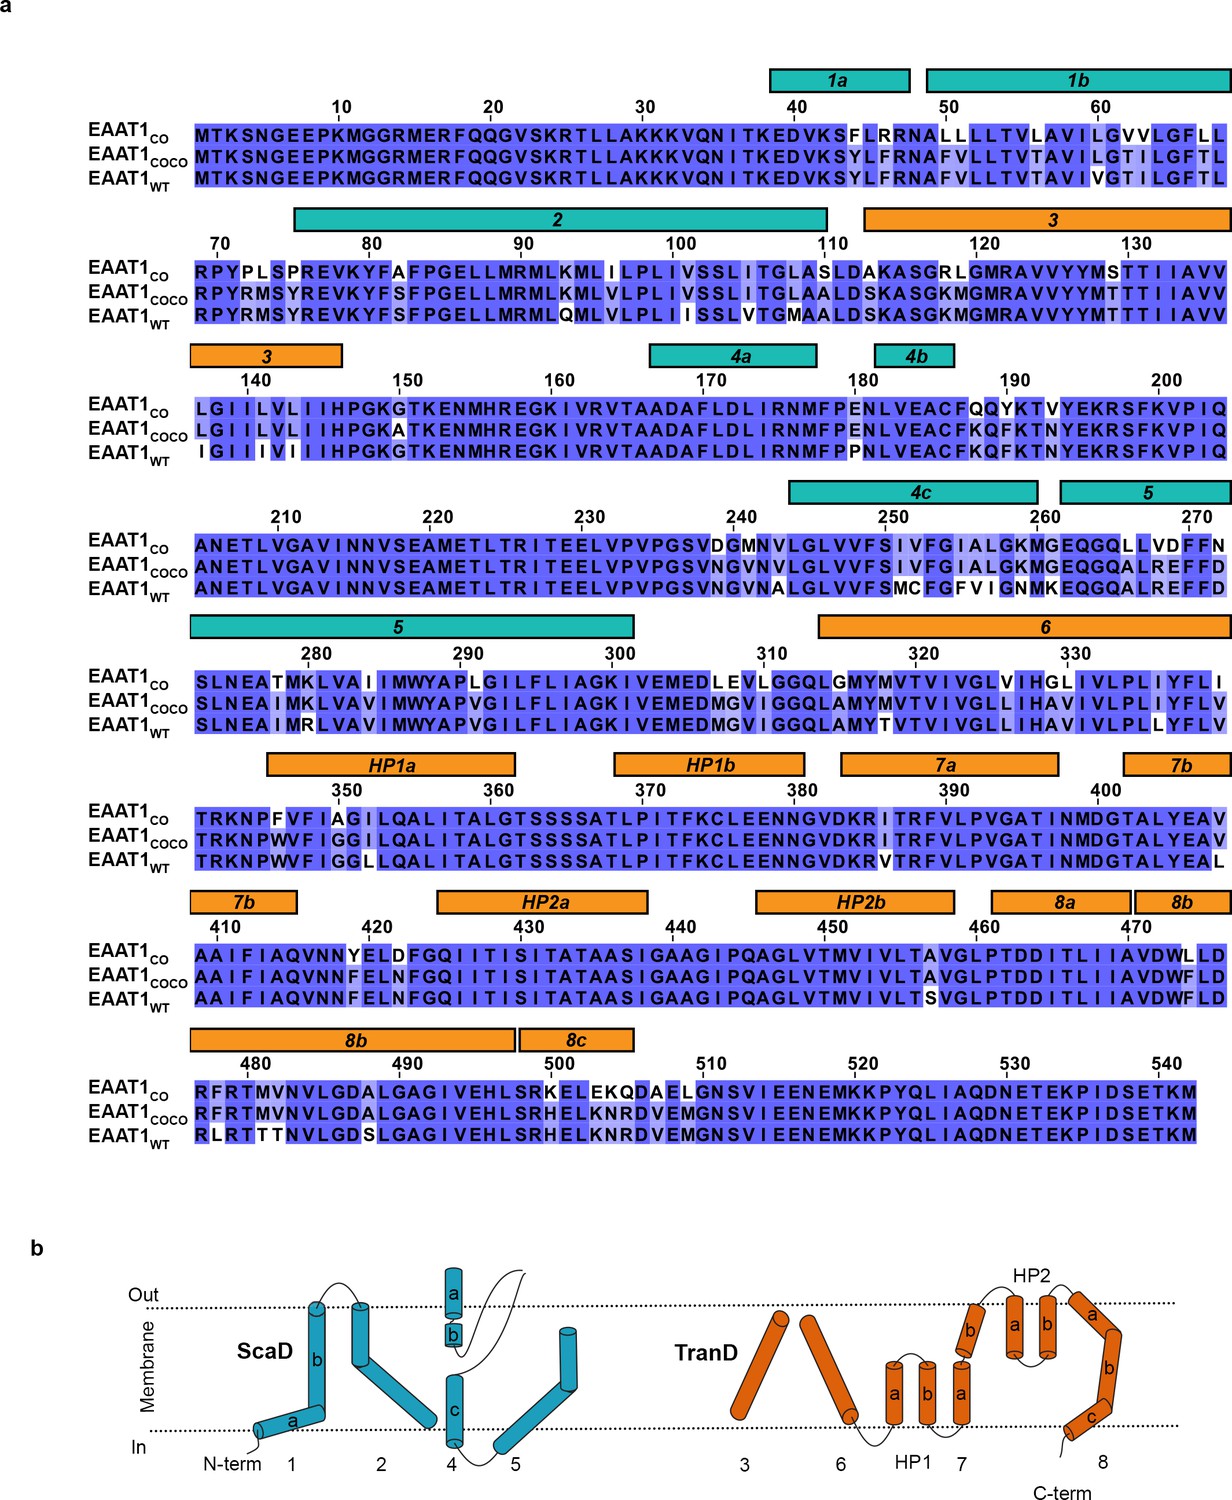
| Amino acid alignment EAAT1 constructs.
(a), Amino acid sequences of EAAT1CO, EAAT1COCO, and EAAT1WT are compared. The rectangles above the sequences highlight the transmembrane helices observed in the crystal structure of EAAT1CRYST (PDB 5LLM) that form the transport (orange) and scaffold (cyan) domains, respectively. (b) Topology organization diagram of EAAT1 transporters following the same color code as above.
Figure 2 with 5 supplements
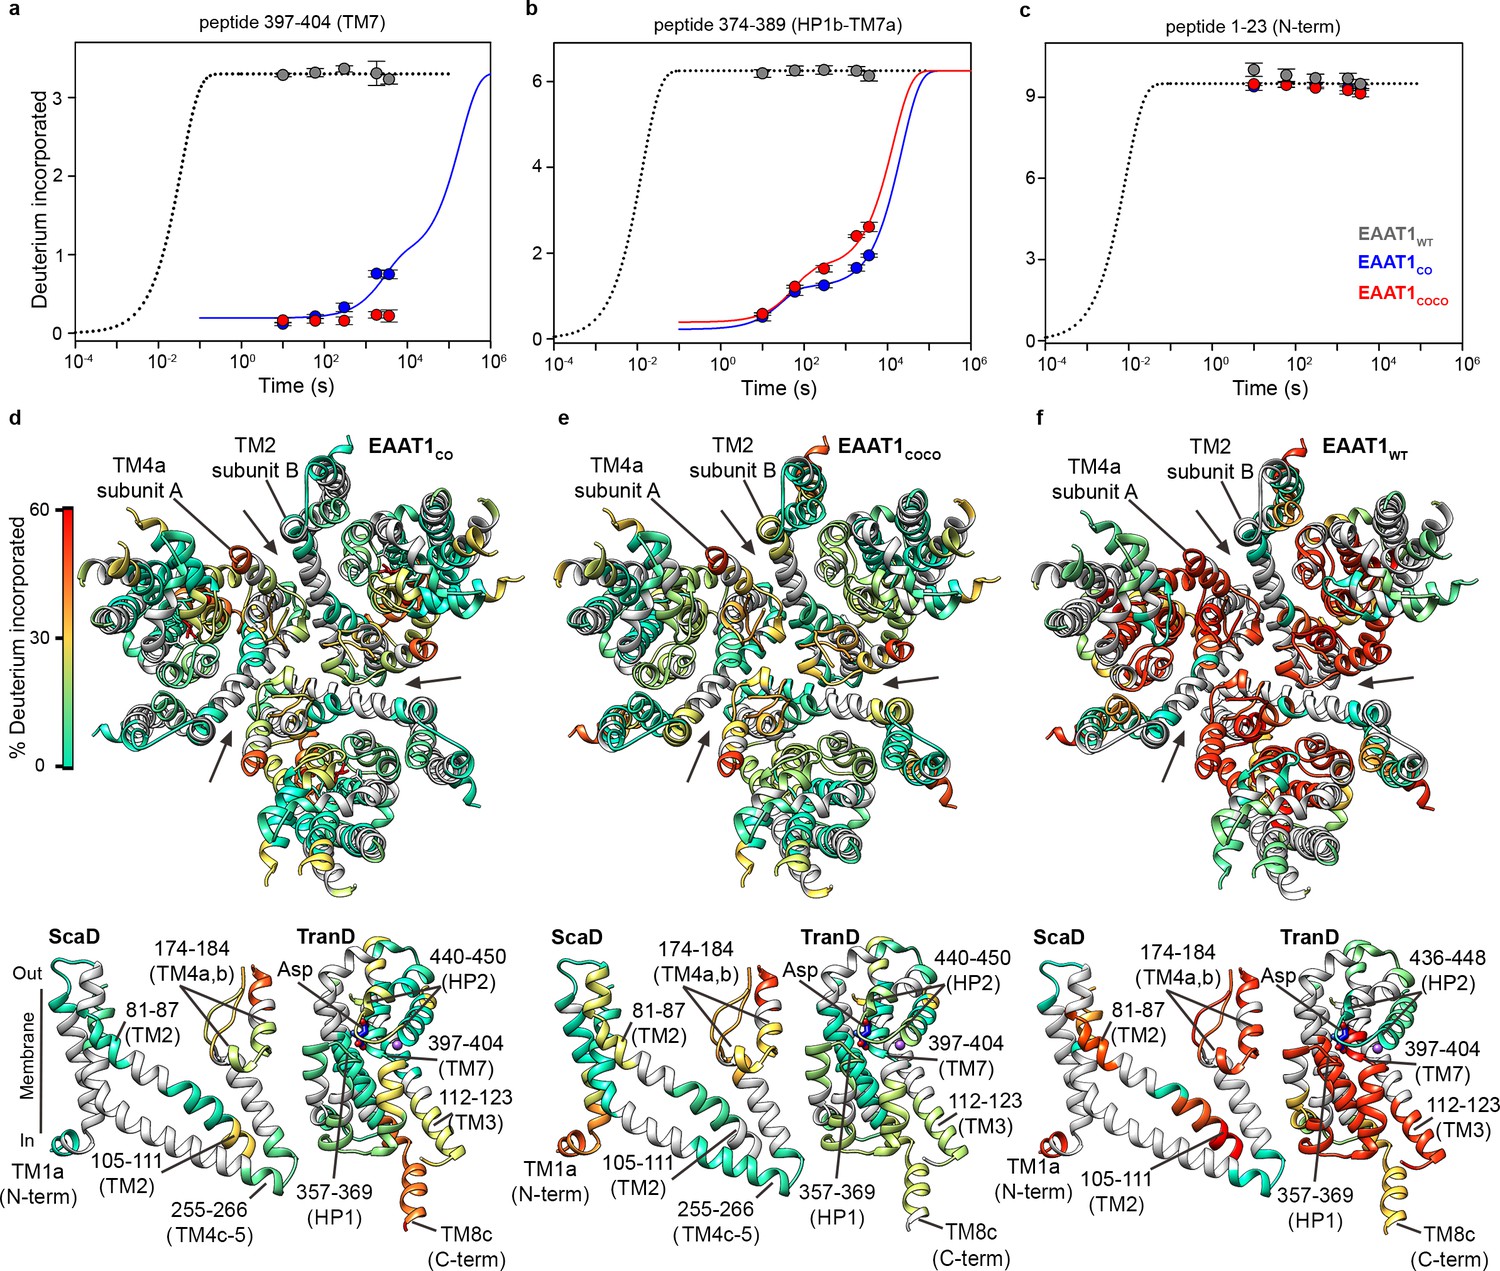
| Deuterium exchange at 20°C.
(a-c) Deuterium uptake kinetics at 20°C of examples peptides from EAAT1WT (grey), EAAT1CO (blue), and EAAT1COCO (red), respectively, covering both helical and unstructured regions of the transporters. Solid lines represent double-exponential fits to the data, and dotted lines the expected deuterium kinetics of unfolded and solvent exposed peptides (see ‘HDX kinetic analysis’ in Methods). Plots in (a–c) depict an average of three independent experiments, and error bars represent s.e.m. (d-f) Deuterium incorporation after 1 hr at 20°C in EAAT1CO (d), EAAT1COCO (e), and EAAT1WT (f) mapped into the structure of the EAAT1CRYTS (PDB 5LLM) trimer viewed from the extracellular medium (upper panel), as well as the scaffold (ScaD) and the transport (TranD) domains viewed from the membrane (lower panel), respectively. These domains are depicted separately for clarity of display, and black lines indicate the approximate position of some peptides in the structure, and the substrate (Asp). In the trimeric depiction, arrows point to the interface between protomers. Deuterium incorporation was calculated as an average of three independent experiments, and normalized to the maximal theoretical incorporation based on the number of backbone amide available for exchange in each peptide. The color code representing deuterium incorporation is depicted in a scale bar (d).
Figure 2—figure supplement 1

| Deuterium exchange behavior of EAAT1CO.
(a) Sequence coverage of EAAT1COCO obtained after 2 min pepsin digestion. Each bar below the protein sequence corresponds to a unique peptide identified by data independent MS/MS acquisition. A total of 49 peptides (colored in blue) covering 69.5% of the EAAT1CO sequence were selected for data extraction. Two extra N-terminal residues (GP) remaining after PreScission cleavage are also reported. (b) HDX-MS profile of EAAT1CO. The relative fractional uptake values determined for each peptide and at each time point are plotted as a function of peptide position in the protein sequence. The color code of the MS data acquired from 10 s up to 1 hr is indicated in the upper part of the panel. Each point corresponds to the average fractional uptake value obtained from three independent replicates. Small color bars indicate helical regions of the TranD (orange) and ScaD (blue).
Figure 2—figure supplement 2

| Deuterium exchange behavior of EATTCOCO.
(a) Sequence coverage of EAAT1COCO obtained after 2 min pepsin digestion. Each bar below the protein sequence corresponds to a unique peptide identified by data independent MS/MS acquisition. A total of 53 peptides (colored in blue) covering 78.3% of the EAAT1COCO sequence were selected for data extraction. The two extra N-terminal residues (GP) remaining after PreScission cleavage are also reported. (b) HDX-MS profile of EAAT1COCO. The relative fractional uptake values determined for each peptide and at each time point are plotted as a function of peptide position in the protein sequence. The color code of the MS data acquired from 10 s up to 1 hr is indicated in the upper part of the panel. Each point corresponds to the average fractional uptake value obtained from three independent replicates. Small color bars indicate the helical region of the TranD (orange) and ScaD (blue).
Figure 2—figure supplement 3
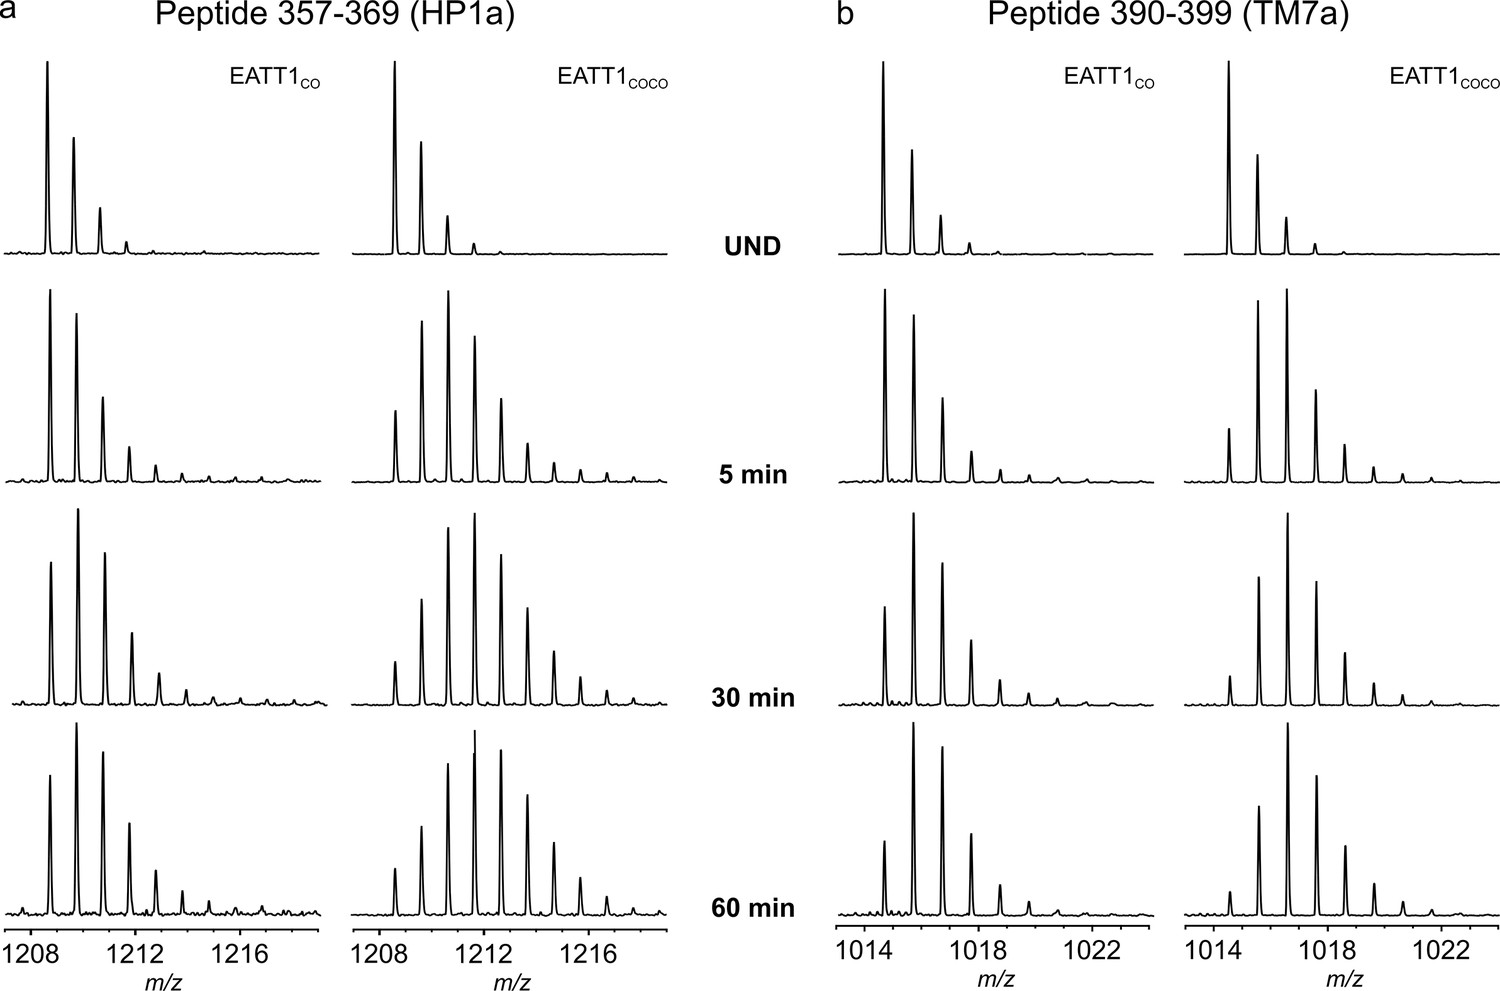
| Examples of representative unimodal m/z envelopes (EX2 kinetics) observed in EAAT1CO and EAAT1COCO.
(a-b) Raw MS data of example peptides 357–369 (a) and 390–399 (b) in EAAT1CO (left column) and EAAT1COCO (right column). The top mass spectra represent the isotopic distribution of the undeuterated (UND) peptides. One unique isotopic distribution is observed during the time course of the experiment indicative of EX2 kinetic.
Figure 2—figure supplement 4
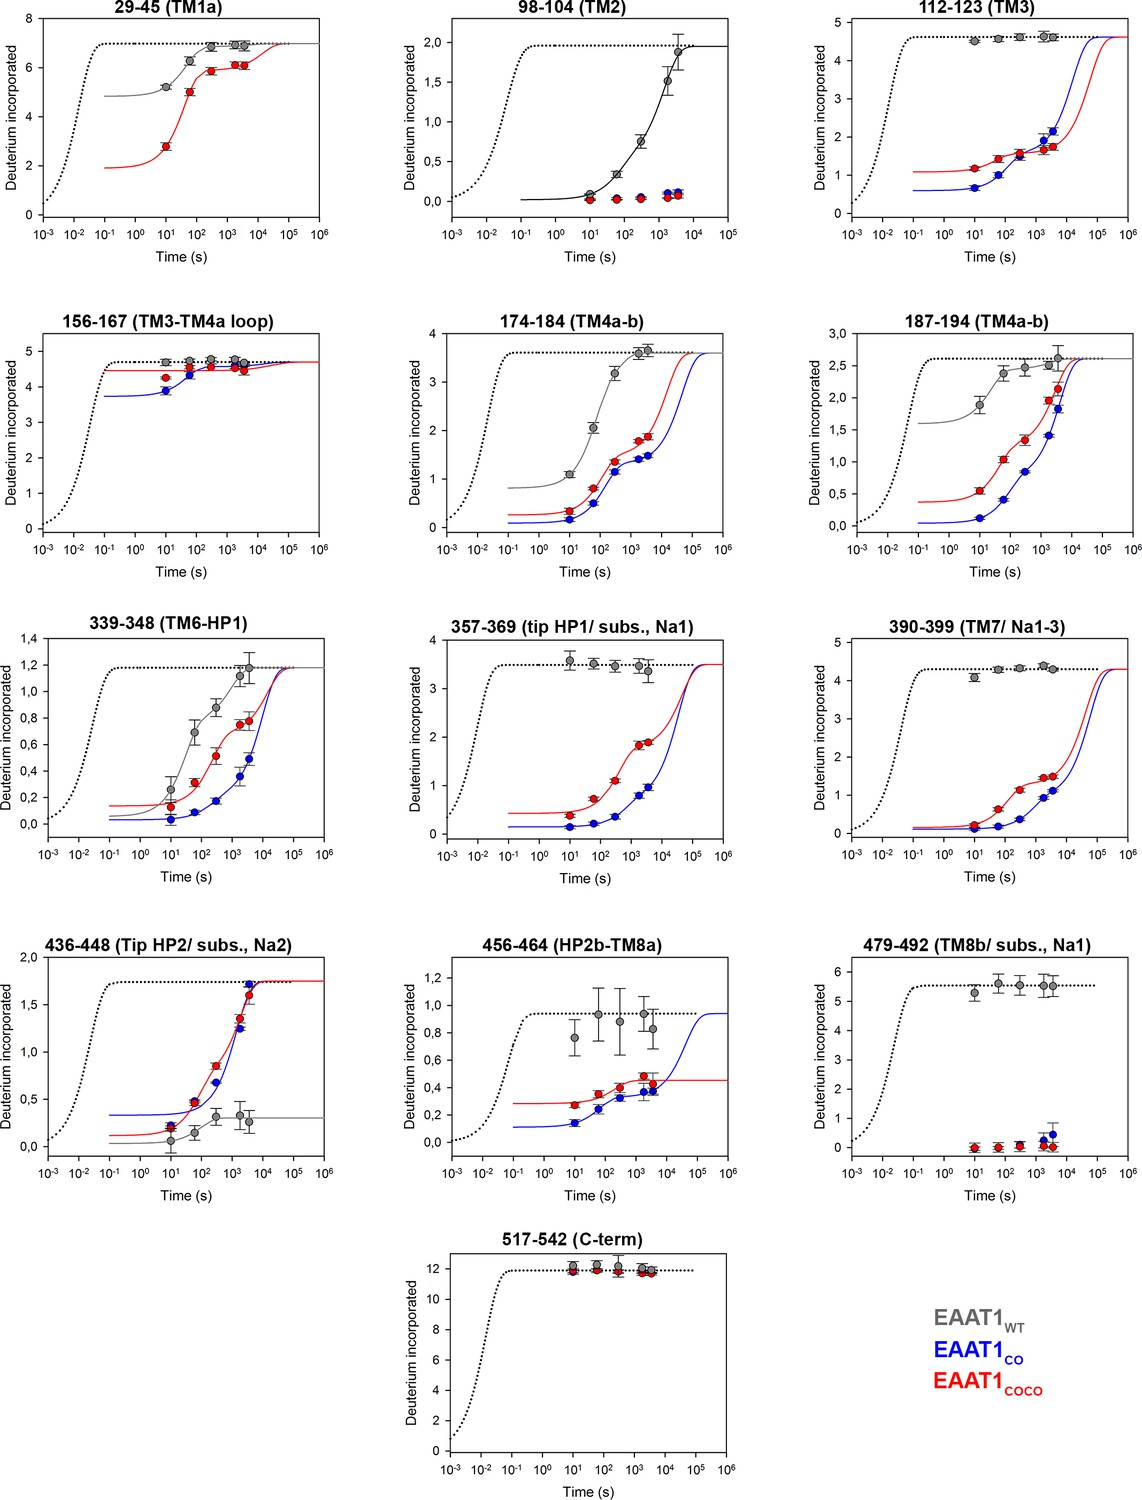
| Deuterium uptake kinetics in EAAT1WT, EAAT1CO, and EAAT1COCO.
Deuterium uptake kinetic plots at 20°C of example peptides from EAAT1WT (grey), EAAT1CO (blue), and EAAT1COCO (red), respectively, covering both helical and unstructured regions of the transporters. Solid lines represent double exponential fits to the data, and dotted lines the expected deuterium kinetics of unfolded and solvent exposed peptides (see methods). Labels at the top of the plots indicate the positions of residues in the sequence as well as the regions of the transporter covered by the peptides and their involvement in substrate (subst.) and sodium 1 – 3 (Na1-3) coordination (in brackets), respectively. Plots depict an average of three independent experiments, and error bars represent s.e.m.
Figure 2—figure supplement 5

| Deuterium exchange behavior of EAAT1WT.
(a) Sequence coverage of EAAT1WT obtained after 2 min pepsin digestion. Each bar below the protein sequence corresponds to a unique peptide identified by data independent MS/MS acquisition. A total of 48 peptides (colored in blue) covering 74.8% of the EAAT1WT sequence were selected for data extraction. The two extra N-terminal residues (GP) remaining after PreScission cleavage are also reported. (b) HDX-MS profile of EAAT1WT. The relative fractional uptake values determined for each peptide and at each time point are plotted as a function of peptide position in the protein sequence. The color code of the MS data acquired from 10 s up to 1 hr is indicated in the upper part of the panel. Each point corresponds to the average fractional uptake value obtained from three independent replicates. Small color bars indicate the helical region of the TranD (orange) and ScaD (blue).
Figure 3 with 1 supplement

| Subunit dissociation by SEC.
(a-c) Size-exclusion chromatograms of purified EAAT1CO (a), EAAT1COCO (b), and the chimeric transporter EAAT1-ScaDCO-TranDCOCO (c), respectively, pre-heated at different temperatures. The chromatograms at all temperatures were normalized to the peak fluorescence value observed at 4°C, and show how the trimeric form of the transporters that elutes at ~3.0 ml unfolds into lower oligomeric state(s), most likely monomers that elute at ~3.5 ml. (d-f) Thermal unfolding curves depicting the change in fractional area of the chromatographic peak corresponding to the trimeric transporters (black symbols), as a function of the pre-pulse temperature in EAAT1CO (d), EAAT1COCO (e), and EAAT1-ScaDCO-TranDCOCO (f), respectively. Solid lines indicate fits of a Hill-like equation (see methods) to the data with T50-SEC values 49.06 ± 0.1, 38.4 ± 0.4°C and 45.6 ± 0.4°C, and H values −21.0 ± 0.3,–9.3 ± 0.7, and −18.3 ± 5.3 for EAAT1CO, EAAT1COCO, and EAAT1-ScaDCO-TranDCOCO, respectively. The total area under the chromatogram at each temperature, normalized to that at 4°C, is also shown (empty symbols), and remains relatively constant at all temperatures showing the lack of protein aggregation or loss during sample preparation. Plots in (d), (e), and (f) depict an average of at least three independent experiments (circles), and error bars represent s.e.m.
Figure 3—figure supplement 1
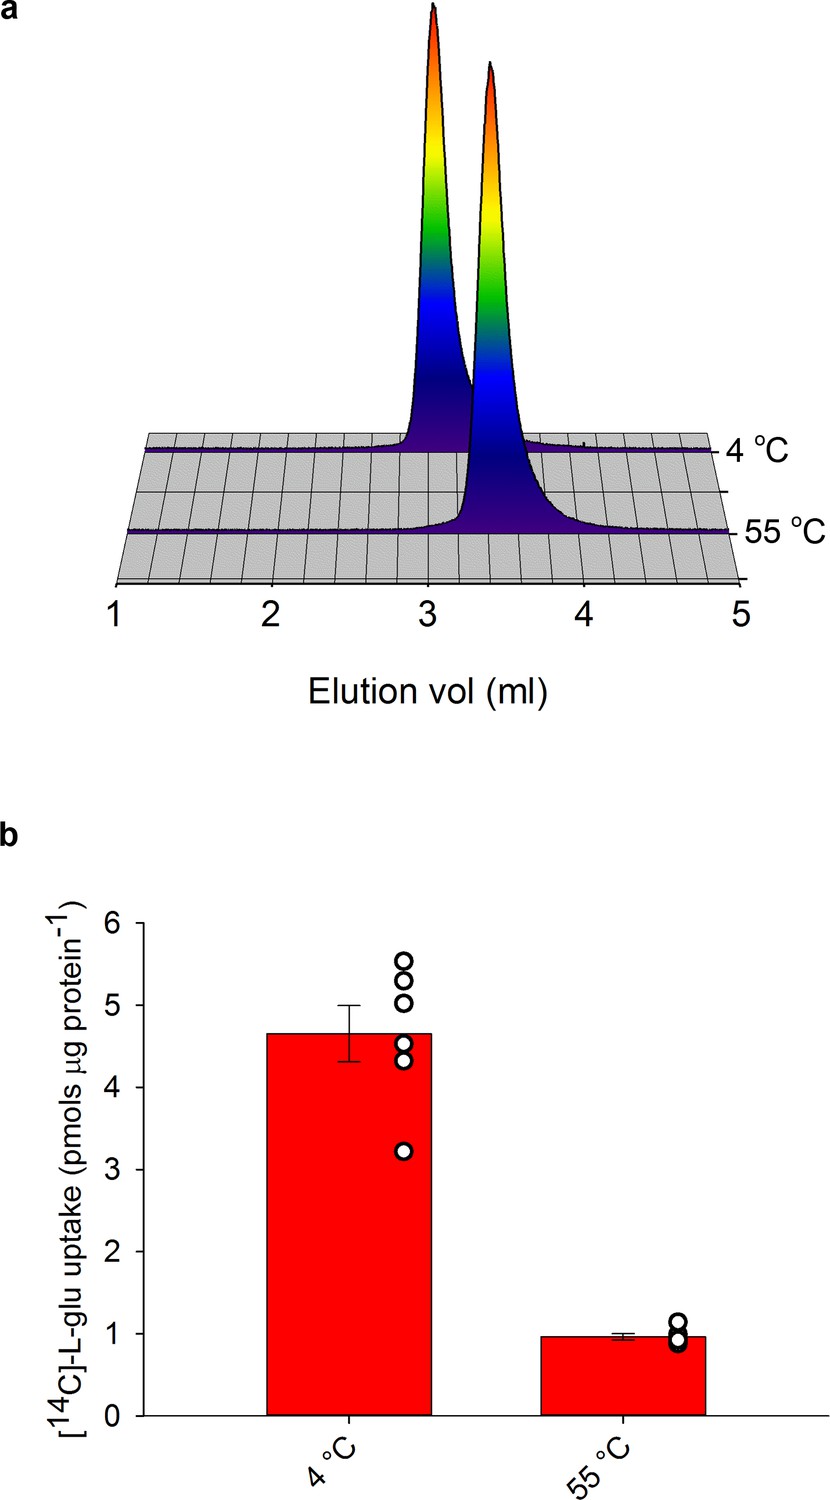
| Neurotransmitter uptake by EAAT1COCO pre-heated at 55°C.
a, Representative SEC profiles of purified EAAT1COCO samples at 4°C (reference temperature) or pre-heated at 55°C. The profiles are also shown in Figure 3b. (b), Radioactive L-glutamate uptake in liposomes with purified reconstituted EAAT1COCO. The protein was reconstituted after incubation for 20 min at either 4°C or 55°C. Plots depict an average of three independent experiments performed with duplicate measurements, and error bars represent s.e.m. Individual measurements are overlaid (open circles).
Figure 4 with 2 supplements
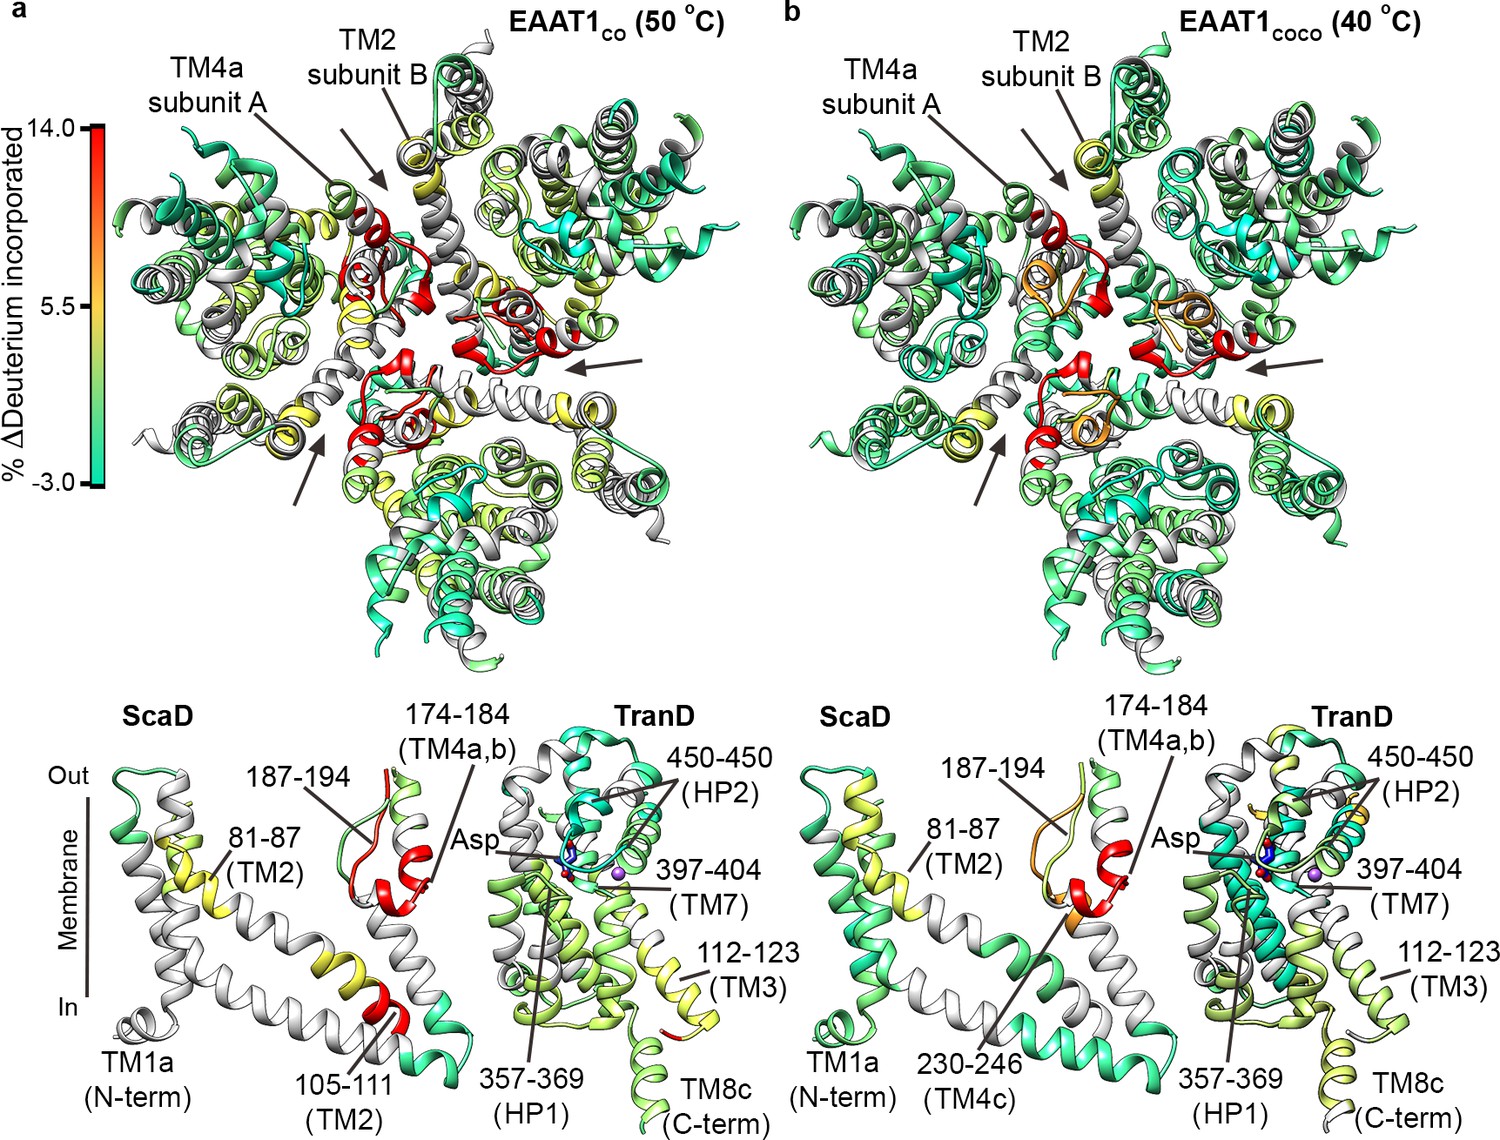
| Temperature-induced HDX changes.
(a-b) Changes in deuterium incorporation induced by pre-pulses at nearly the T50-SEC of EAAT1CO (50°C) (a), and EAAT1COCO (40°C) (b), respectively, measured after 1 hr at 20°C. The changes are mapped into the structure of the EAAT1CRYST (PDB 5LLM) trimer viewed from the extracellular medium (upper panel), as well as the scaffold (ScaD) and the transport (TranD) domains viewed from the membrane (lower panel), respectively. These domains are depicted separately for clarity of display, and black lines indicate the approximate position of some peptides in the structure, and the substrate (Asp). In the trimeric depiction, arrows point to the interface between protomers. The color code representing the change in deuterium incorporation is depicted in a scale bar (a). Positive values represent increase in deuterium uptake at 50°C (EAAT1CO) and 40°C (EAAT1COCO) over the reference temperature (20°C), respectively.
Figure 4—figure supplement 1
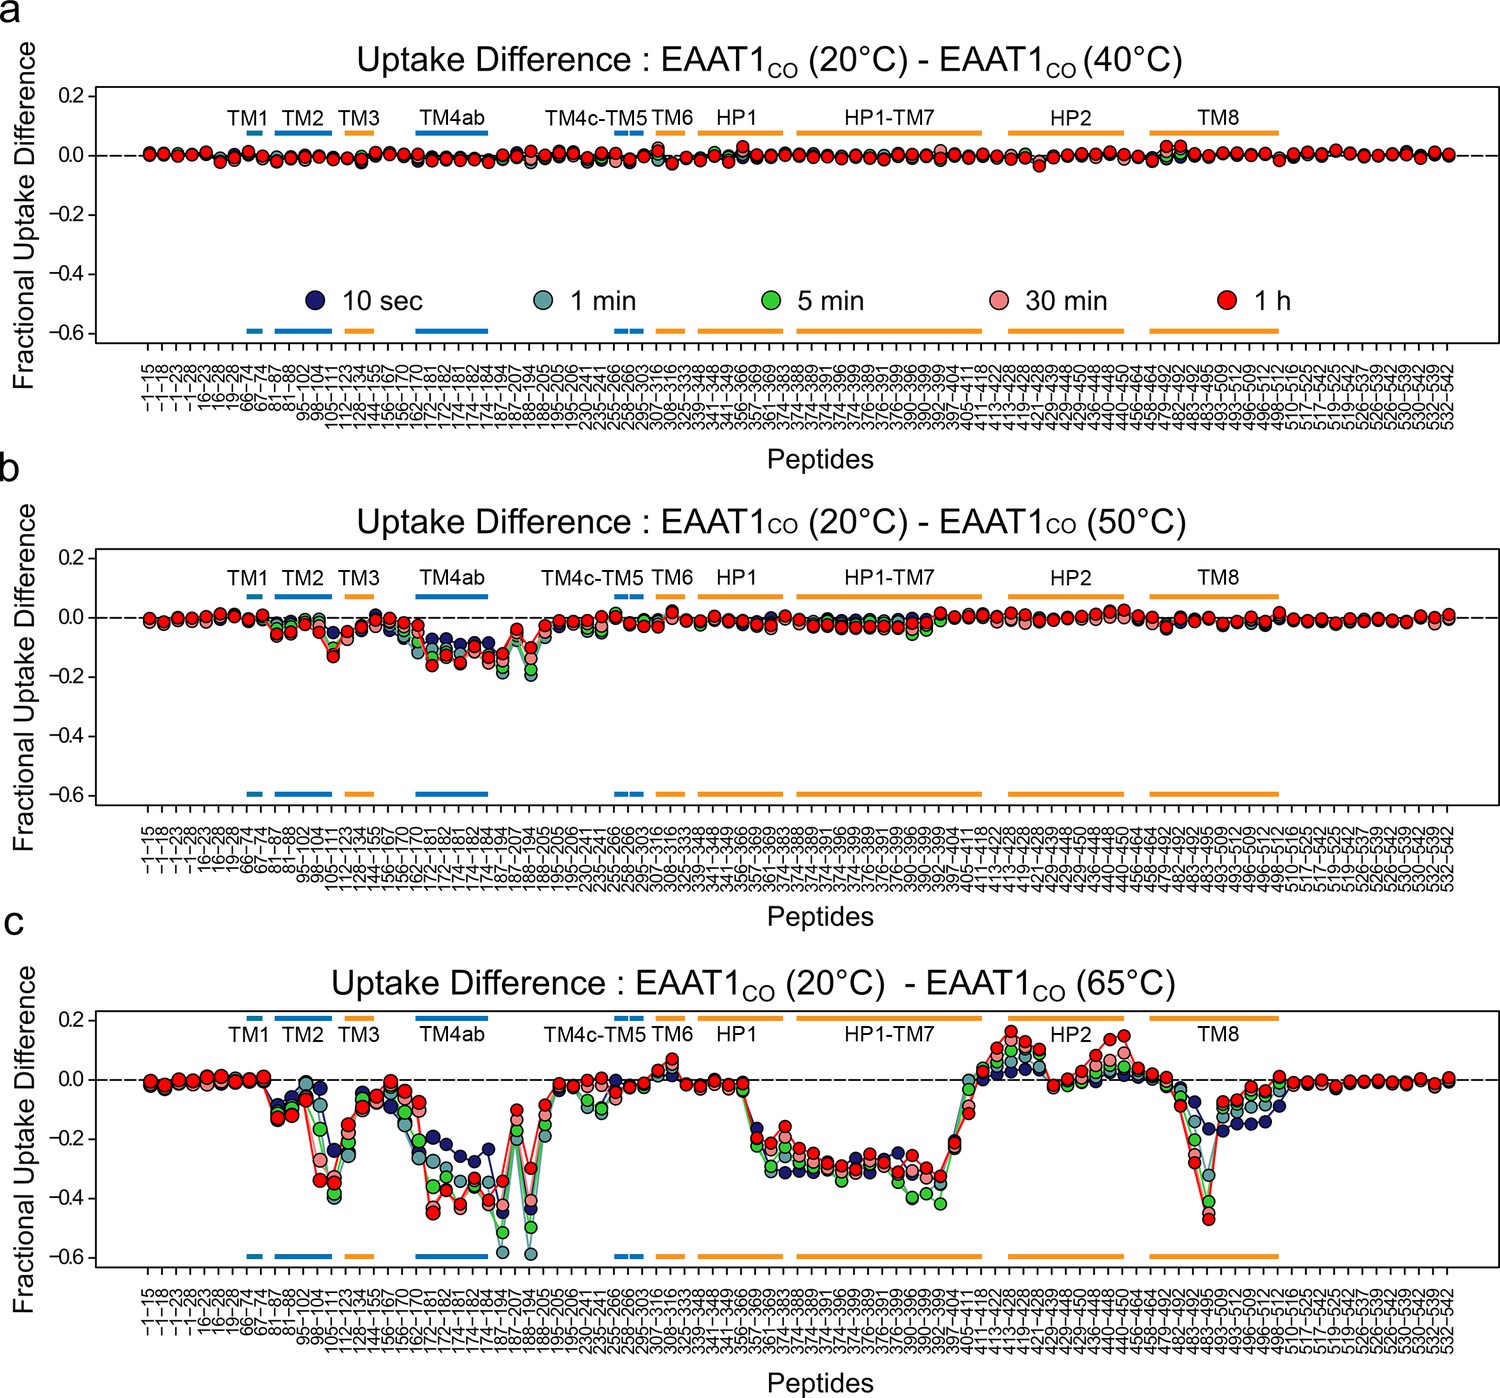
| Temperature-induced changes in EAAT1CO HDX pattern.
(a-c) Difference in fractional deuterium uptake between the reference pre-pulse temperature (20°C) and 40°C (a), 50°C (b), or 65°C (c) plotted as a function of the peptide position in the protein sequence. The color code of the MS data acquired from 10 s up to 1 hr is indicated in (a). All identified peptides are plotted. Each point corresponds to the difference in the average fractional uptake value obtained from three independent replicates. Negative differences indicate increase HDX at the test pre-pulse temperature compared to the reference. Small color bars indicate the helical region of the TranD (orange) and ScaD (blue).
Figure 4—figure supplement 2
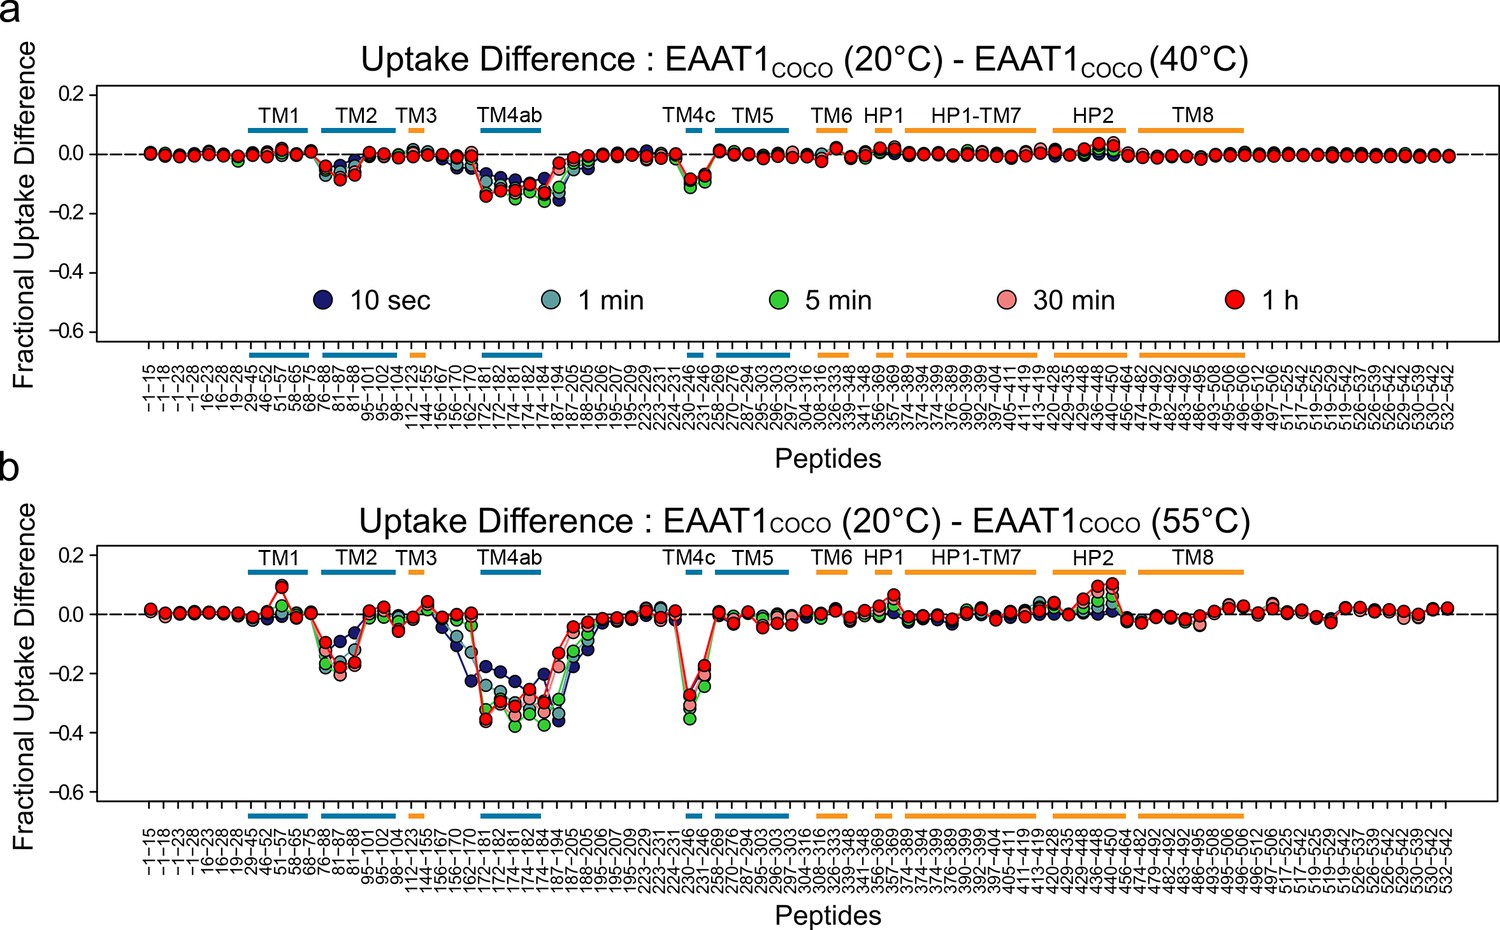
| Temperature-induced changes in EAAT1COCO HDX pattern.
(a-b) Difference in fractional deuterium uptake between the reference pre-pulse temperature (20°C), and 40 (a) or 50°C (b) plotted as a function of the peptide position in the protein sequence. The color code of the MS data acquired from 10 s up to 1 hr is indicated in (a). All identified peptides are plotted. Each point corresponds to the difference in the average fractional uptake value obtained from three independent replicates. Negative differences indicate increase HDX at the test pre-pulse temperature compared to the reference. Small color bars indicate the helical region of the TranD (orange) and ScaD (blue).
Figure 5
| Temperature-induced bimodal m/z envelopes at the trimeric interface.
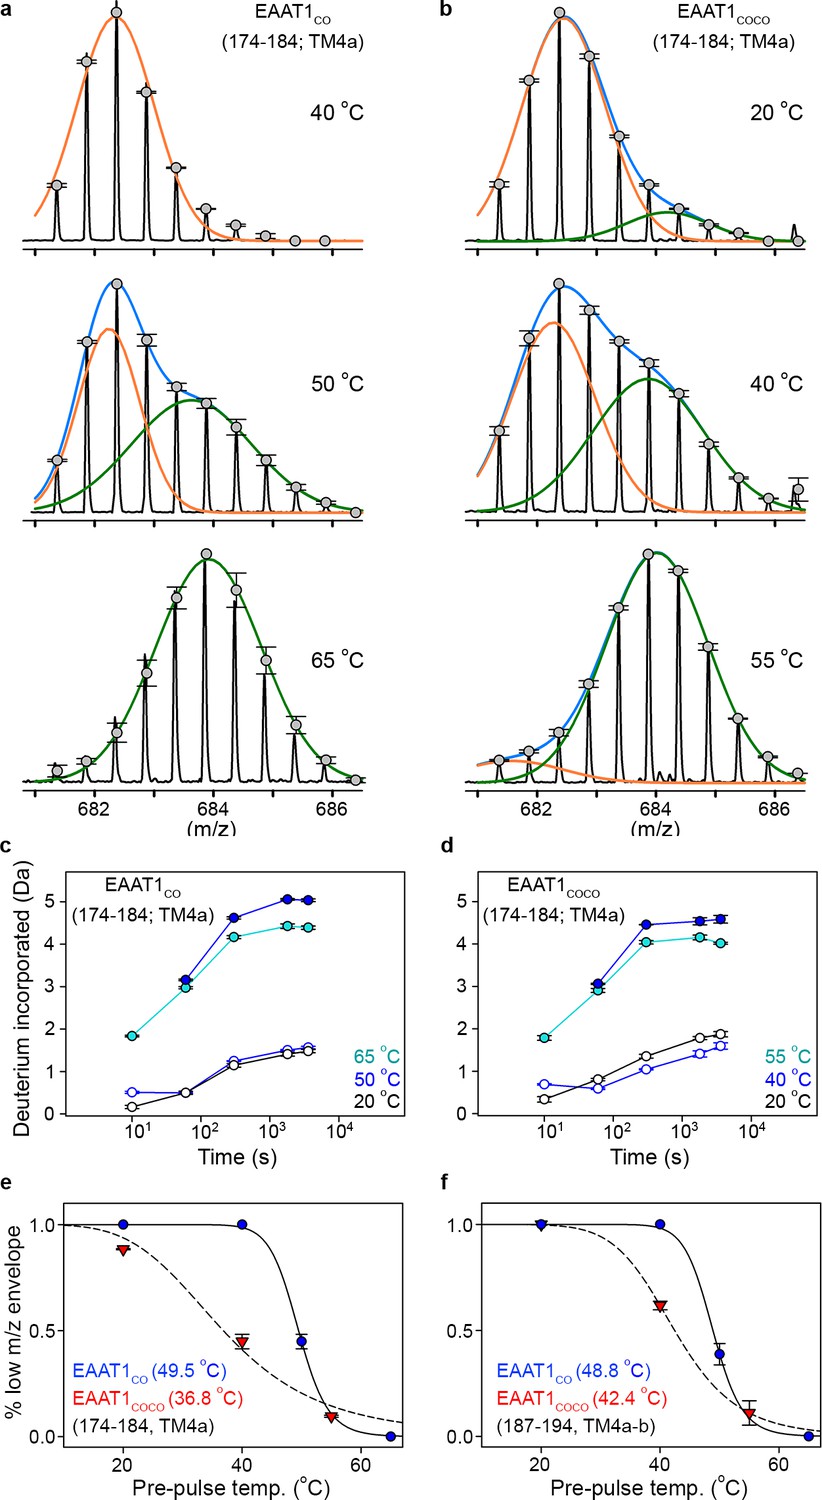
(a-b) m/z envelopes of an example peptide covering residues 174–184 of EAAT1CO (a) and EAAT1COCO (b), respectively, at different pre-pulse temperatures. Grey symbols represent the average of three experiments and error bars represent s.e.m, and are superimposed on the m/z spectrum of a representative experiment (black solid line). Blue solid lines represent fits of a double Gaussian equation to the data. The low-m/z (orange solid line) and high-m/z (green solid lines) components of such double-Gaussian fits are also shown. (c–d), HDX temporal course of peptide 174–184 of EAAT1CO (c) and EAAT1COCO (d) samples pre-heated at different temperatures. Deuterium incorporation values were calculated for the low-mass (blue open circles) and high-mass (blue solid circles) components of bimodal isotopic envelopes at the T50-SEC, as well as unimodal envelopes at high (cyan solid circles) and reference (black open circles) temperatures. Plots are an average of three independent experiments, and error bars represent s.e.m. (e–f), Pre-pulse temperature dependence of the low-m/z component in peptides 174–184 (e) and 187–194 (f) of EAAT1CO (blue), and EAAT1COCO (red). Solid and dashed lines indicate fits of a Hill-like equation to the data with T50-HDX-Bi values 49.5 ± 0.1°C and 36.8 ± 2°C, and H values −20 ± 3.1 and −4.4 ± 1 for peptide 174–184 in EAAT1CO and EAAT1COCO, respectively, as well as T50-HDX-Bi values 48.8 ± 0.2°C and 42.4 ± 0.1°C, and H values −20 ± 3.2 and −8 ± 0.1 for peptide 187–194 in EAAT1CO and EAAT1COCO, respectively. Plots depict an average of amplitudes measured at least at four different time points in three independent experiments, and error bars represent s.e.m.
Figure 6 with 1 supplement
| Local thermal unfolding.
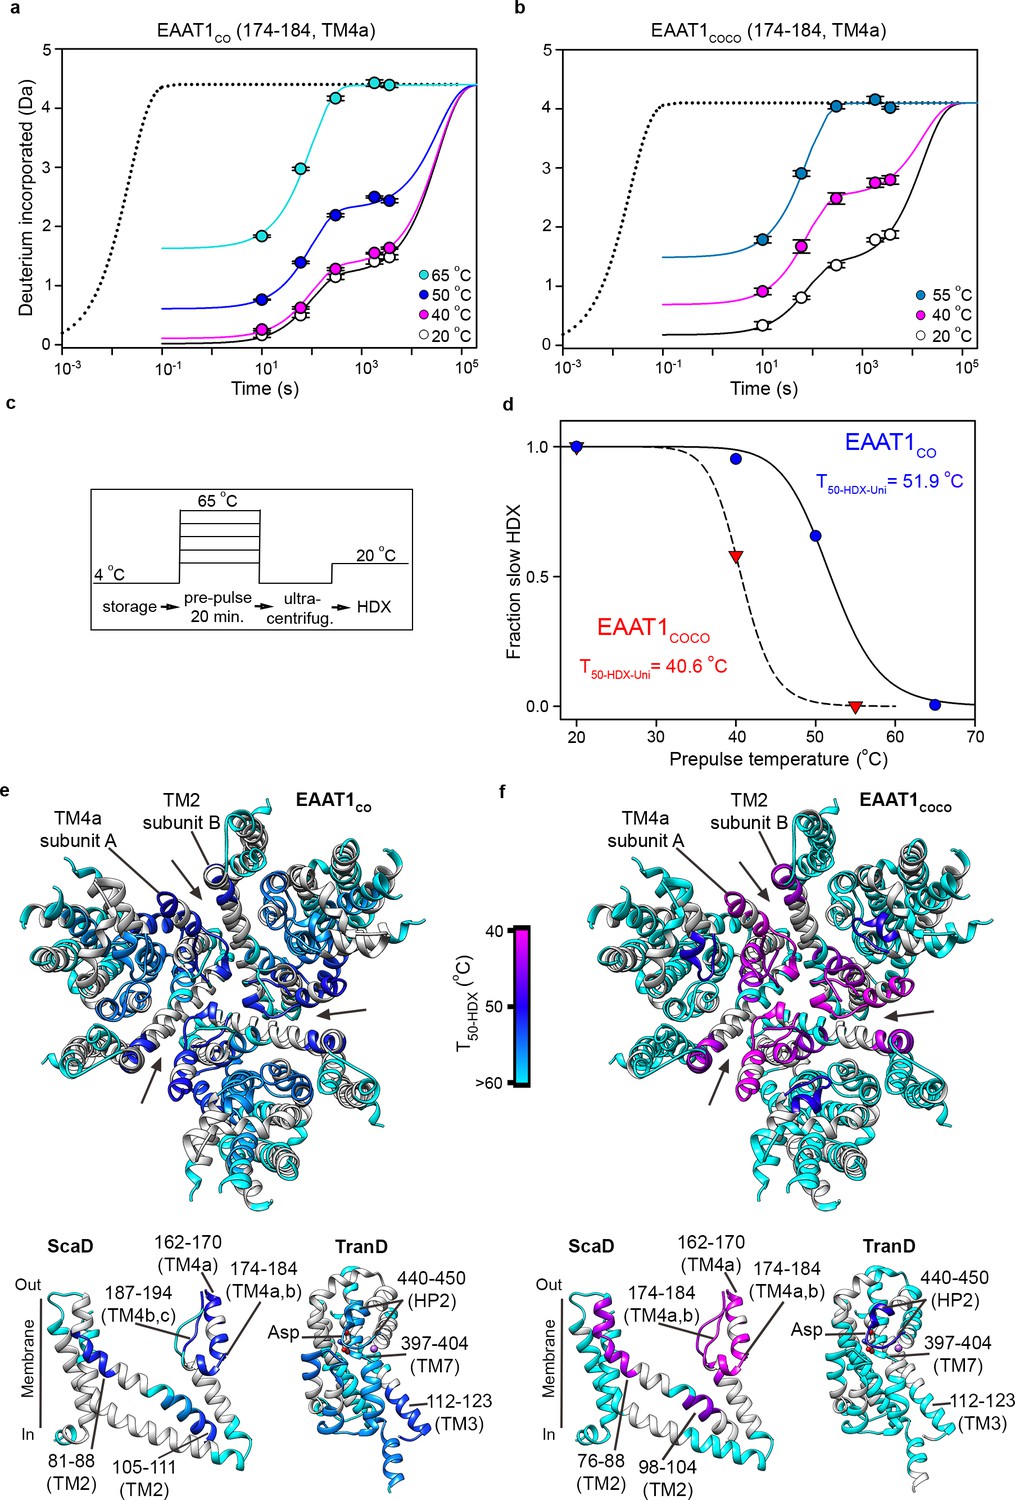
(a-b) Deuterium uptake kinetics at different pre-pulse temperatures of example peptides containing residues 174–184 in EAAT1CO (a), and EAAT1COCO (b), respectively. Solid lines represent double-exponential fits to the data, and dotted lines the expected deuterium kinetics of the unfolded and solvent exposed peptide at 20°C (see methods). Plots in (a–b) depict an average of three independent experiments, and error bars represent s.e.m. (c), Depiction of the temperature protocol used to prepare the protein samples. (d), The fraction of the slow HDX component extracted from the double-exponential fit to the kinetic data in (a) and (b) corresponding to EAAT1CO (blue symbols) and EAAT1COCO (red symbols), respectively. Lines represent the fit of a Hill-like equation with T50-HDX-Uni values 51.9°C and 40.6°C in EAAT1CO and EAAT1COCO, respectively, and H values of −18.7 and −20, respectively. (e–f) T50-HDX-Uni values, calculated as in (d), of EAAT1CO (e) and EAAT1COCO (f), respectively, are mapped into the structure of the EAAT1CRYST (PDB 5LLM) trimer viewed from the extracellular medium (upper panel), as well as the scaffold (ScaD) and the transport (TranD) domains viewed from the membrane (lower panel), respectively. These domains are depicted separately for clarity of display. The color code representing T50-HDX-Uni values is depicted in a scale bar between the trimers. Peptides that did not show any temperature-induced HDX changes are also labeled in cyan (T50-HDX-Uni>60°C).
Figure 6—figure supplement 1
| Deuterium uptake kinetics in EAAT1CO and EAAT1COCO at different temperatures.
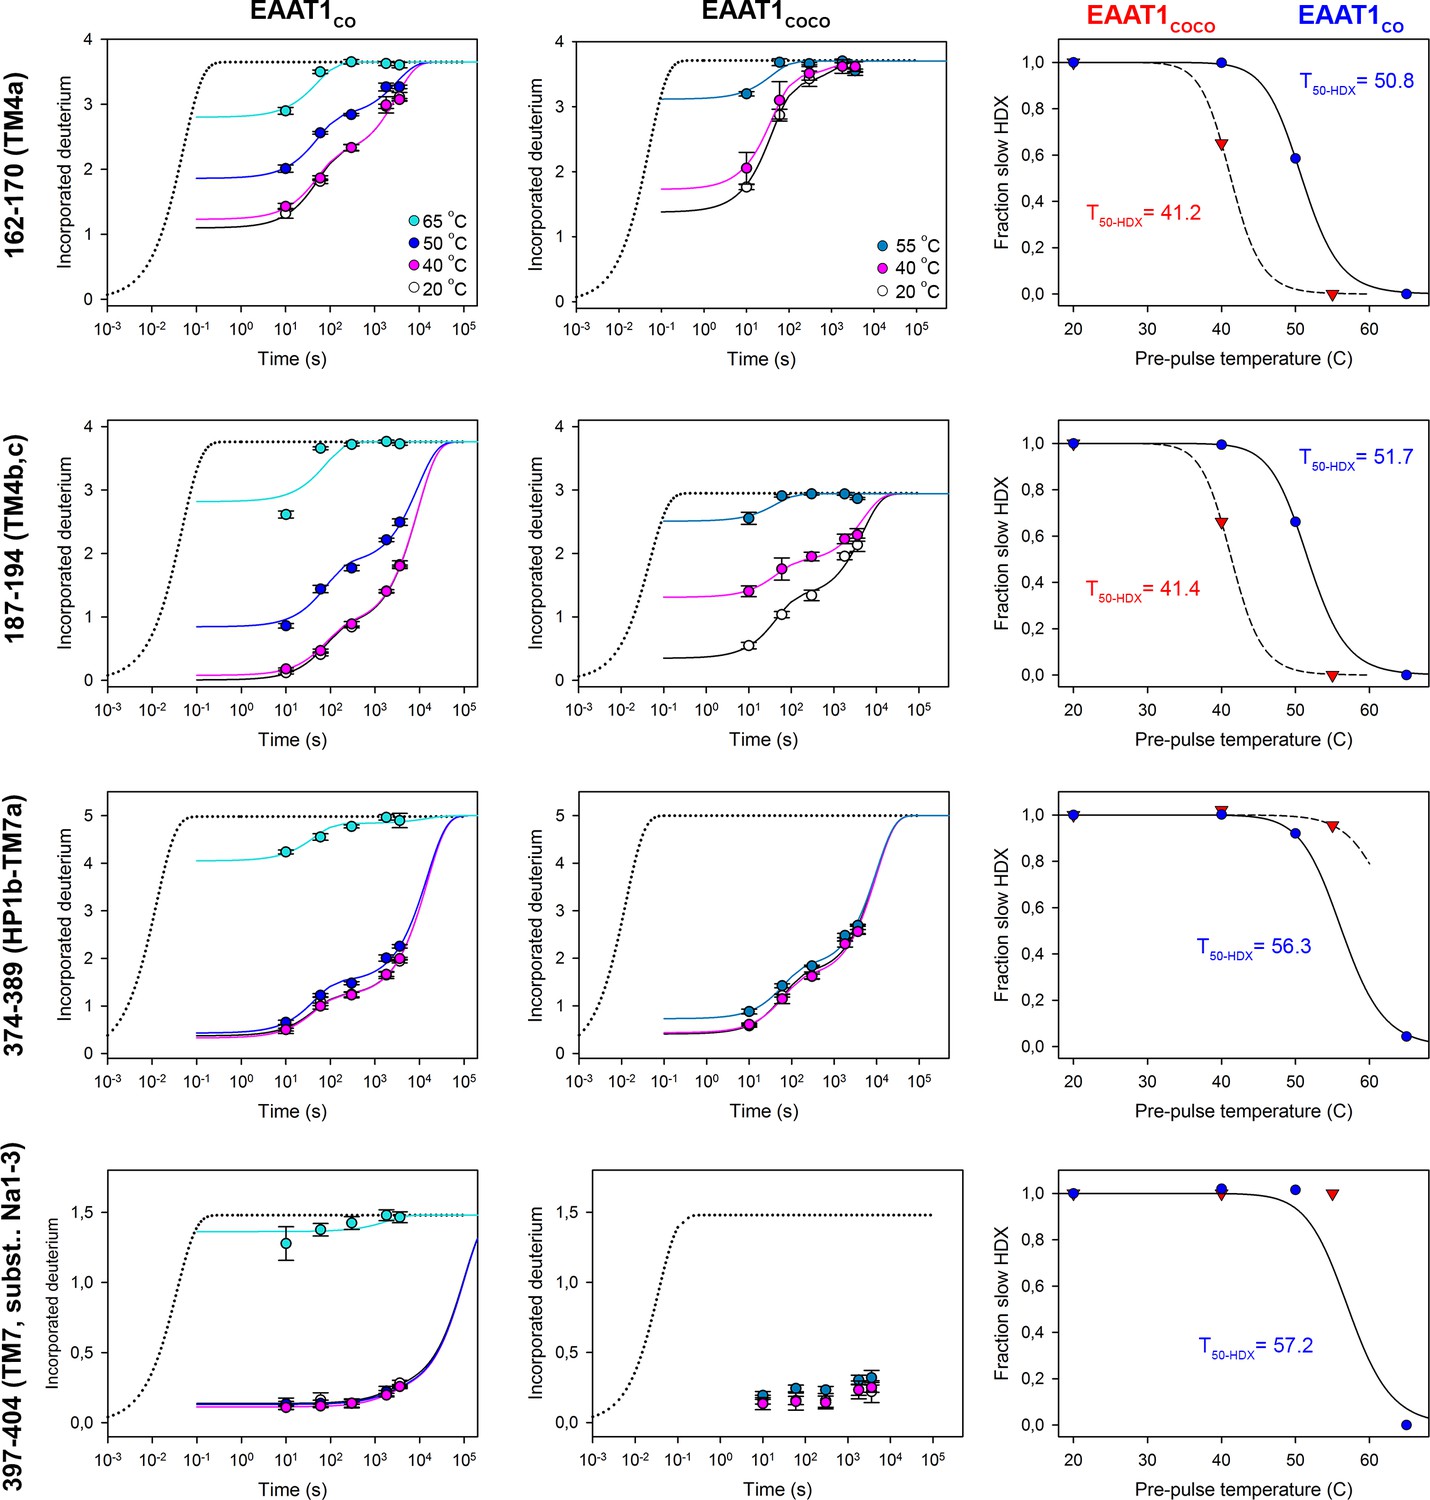
Deuterium uptake kinetic plots at different pre-pulse temperatures of example peptides covering different regions of the ScaD (peptides 162–170, and 187–194) and the TranD (peptides 374–389, and 397–404) in EAAT1CO (left column), and EAAT1COCO (middle column), respectively. The color code for the temperatures used in symbols and lines is indicated in the corresponding 162–170 peptide plots. Solid lines represent global double-exponential fits to the data obtained at all measured temperatures for an individual peptide (see methods). Dotted lines represent the expected deuterium kinetics of the unfolded and solvent exposed peptide at 20°C. Plots depict an average of three independent experiments, and error bars represent s.e.m. From the kinetic fits, the computed fraction of the slow HDX component is plotted as a function of temperature pre-pulses in EAAT1CO (blue) and EAAT1COCO (red symbols), respectively (right column). Solid and dashed lines represent the fit of a Hill-like equation (see methods) to EAAT1CO and EAAT1COCO data, respectively, with T50-HDX-Uni values depicted in the plots.
Figure 7

| Thermal unfolding pathway.
Cartoon representation of the temperature-induced structural changes observed in the consensus designs. At the reference temperature the transporters are trimeric and have the substrate (sticks) bound (left panel). As temperature increases, the inter-subunit interface (cyan) between TM4 and TM2 unfolds and the subunits dissociate loosing their transport function (middle panel). Eventually, at high temperatures, the transport domains unfold and loose the ability to bind the substrate (right panel). Thick lines represent natively folded regions of the transporters, and dotted lines unfold ones.
Tables
Key resources table
| Reagent type (species) or resource | Designation | Source or reference | Identifiers | Additional information |
|---|---|---|---|---|
| Gene (Homo sapiens) | EAAT1WT | DNA2.0 synthetic | Uniprot P43003-1 | Codon optimized Homo sapiens |
| Cell line (Homo sapiens) | HEK293F | Thermo Fisher | R79007 | negative for mycoplasma |
| Transfected construct (Homo sapiens) | EAAT1CO | This paper | ||
| Transfected construct (Homo sapiens) | EAAT1COCO | This paper | ||
| Transfected construct (Homo sapiens) | EAAT1 ScaCO-TranDCOCO | This paper | ||
| Recombinant DNA reagent | pCDNA3.1 | Invitrogen, doi: 10.1038/nature22064 | ||
| Software, algorithm | FELIX 4.1.2 | Photon Technology International/Horiba | ||
| Software, algorithm | DynamX 3.0 | Waters | ||
| Software, algorithm | HX-Express2 | http://www.hxms.com/HXExpress | ||
| Software, algorithm | Sigma Plot 12 | Sysat Inc. | ||
| Software, algorithm | Excel | Microsoft |
Additional files
-
Supplementary file 1
Alignment animal SLC1 homologs.
- https://doi.org/10.7554/eLife.40110.019
-
Supplementary file 2
Alignment PFAM curated SLC1.
- https://doi.org/10.7554/eLife.40110.020
-
Transparent reporting form
- https://doi.org/10.7554/eLife.40110.021
Download links
A two-part list of links to download the article, or parts of the article, in various formats.
Downloads (link to download the article as PDF)
Open citations (links to open the citations from this article in various online reference manager services)
Cite this article (links to download the citations from this article in formats compatible with various reference manager tools)
Consensus designs and thermal stability determinants of a human glutamate transporter
eLife 7:e40110.
https://doi.org/10.7554/eLife.40110


