Dynein-mediated transport and membrane trafficking control PAR3 polarised distribution
- Institut Jacques Monod, CNRS, UMR 7592, Paris Diderot University, Sorbonne Paris Cité, France
Figures
Figure 1 with 3 supplements
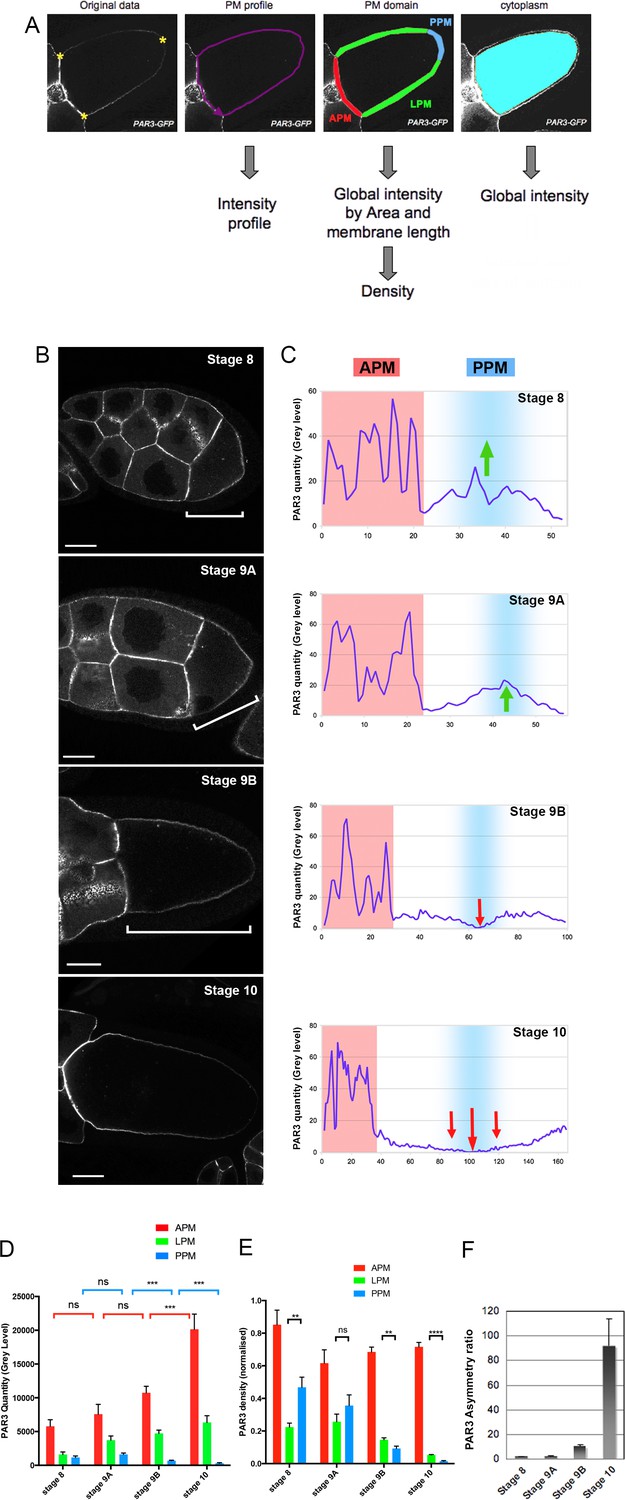
Dynamic PAR3 distribution along the oocyte anterior posterior axis.
(A) Description of the quantification Fiji Macro. After selecting three points in the oocyte (yellow stars) and delimitation of oocyte perimeter, the macro allows us to obtain different data about protein repartition in oocytes: the intensity profile of the plasma membrane (magenta); the mean fluorescent intensity and the length of each of the plasma membrane domainsare automatically generated (anterior/APM in red; lateral/LPM in green; posterior/PPM in blue) and the mean signal intensity inside the cytoplasm (cyan). (B–E) Distribution of PAR3 between stages 8 and 10 in representative examples. (B) Localisation of PAR3-GFP, expressed in the germline under control of the maternal driver Tub67c-GAL4, from stage 8 to stage 10. The brackets indicate oocytes. (C) Representative intensity profiles of plasma membrane distribution in a single oocyte (APM in red, PPM in blue). Green arrows highlight PAR3 posterior accumulation, and red arrows PAR3 posterior exclusion. (D) Raw quantity of PAR3 in each plasma membrane domain from stage 8 to stage 10 (APM in red; LPM in green; PPM in blue). (E) To avoid size/expression fluctuations of oocytes between the different mutant genotypes, PAR3 distribution has been normalised by the length of the membrane and the total oocyte signal (density/total). In this case, we cannot compare the level between the different stages but only the asymmetrical distribution of PAR3 between the different domains. (F) Evolution of PAR3 asymmetry from stage 8 to stage 10. The asymmetry ratio (APM/PPM of PAR3 density) highlights the increase of PAR3 polarity in oocytes from stage 8 to stage 10. Stage 8, n = 8; stage 9A, n = 9; stage 9B, n = 15; stage 10, n = 14. Mann-Whitney test, NS: not significant; **: p<0.01 ; ***: p<0.001; ****: p<0.0001. Error bars indicate SEM. The scale bars represent 30 µm in (B) and in all following figures.
-
Figure 1—source data 1
Quantification of TubGal4; UASp PAR3-GFP egg chambers during oogenesis.
- https://doi.org/10.7554/eLife.40212.007
Figure 1—figure supplement 1
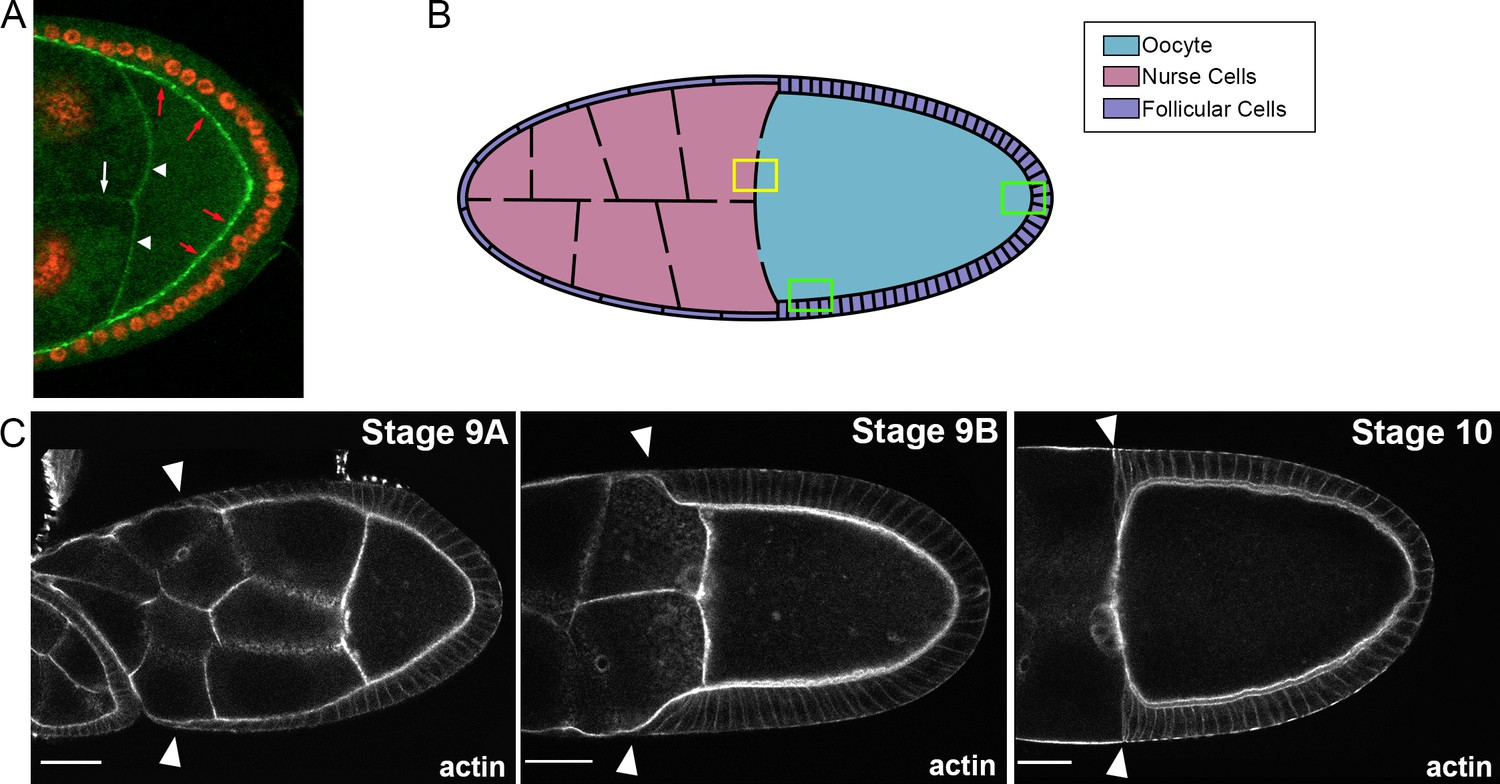
Membrane et developmental stage definitions.
(A) Egg chamber expressing PAR3-GFP under its own promoter (green/w, P[w+, FRT9-2]18E, f, baz[815.8], P{CaryP, PB[BAC Baz- sfGFP2]attP18}) and nuclear RFP (red) both in somatic and germinal cells. White arrowheads indicate the signal at the APM membrane, white arrow, the double nurse cell membrane, and red arrows, juxtaposition of the oocyte membrane and the apical membrane of follicular cells. (B) Schematic representation of a stage 10 egg chamber. The yellow box highlights the proximity between the oocyte APM and the plasma membrane of the adjacent nurse cells. The green boxes show the juxtaposition between the oocyte LPM or PPM and the apical plasma membrane of the neighbouring follicular cells. (C) Determination of oogenesis stages. Migration of follicular cells (white arrow heads) toward the oocyte was used to determine the egg chamber stage. Stage 9A comprises the oocytes of which follicular cells have migrated until the middle of nurse cell region. Stage 9B includes the oocytes of which the follicular cells have migrated from the middle of nurse cell region to near the oocyte anterior. Then at stage 10, the follicular cells are positioned around the oocyte. The scale bars represent 30 µm.
Figure 1—figure supplement 2
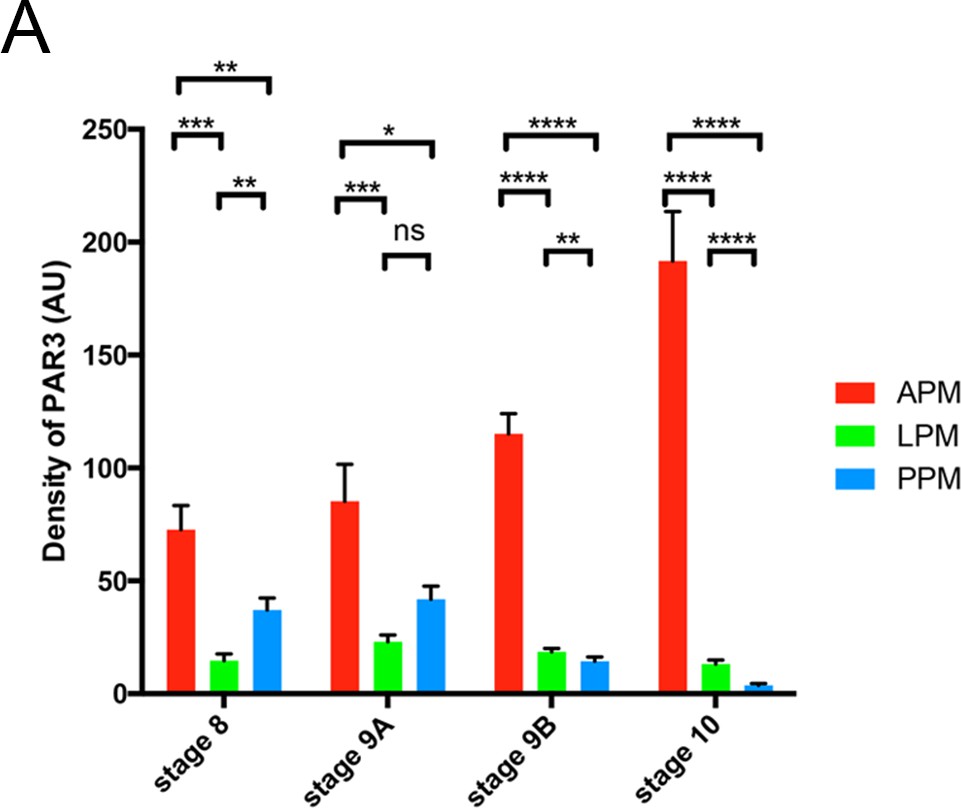
PAR3 distribution without total signal normalisation.
(A) PAR3 density from stage 8 to stage 10. The quantity of PAR3 has been normalised by the membrane length of the domain but not by the total oocyte intensity. Stage 8, n = 8; stage 9A, n = 9; stage 9B, n = 15; stage 10, n = 14. Mann-Whitney test, NS: not significant; *: p<0.05 ; **: p<0.01 ; ****: p<0.0001. Error bars indicate SEM.
Figure 1—figure supplement 3
Control experiments of PAR3 quantification process.
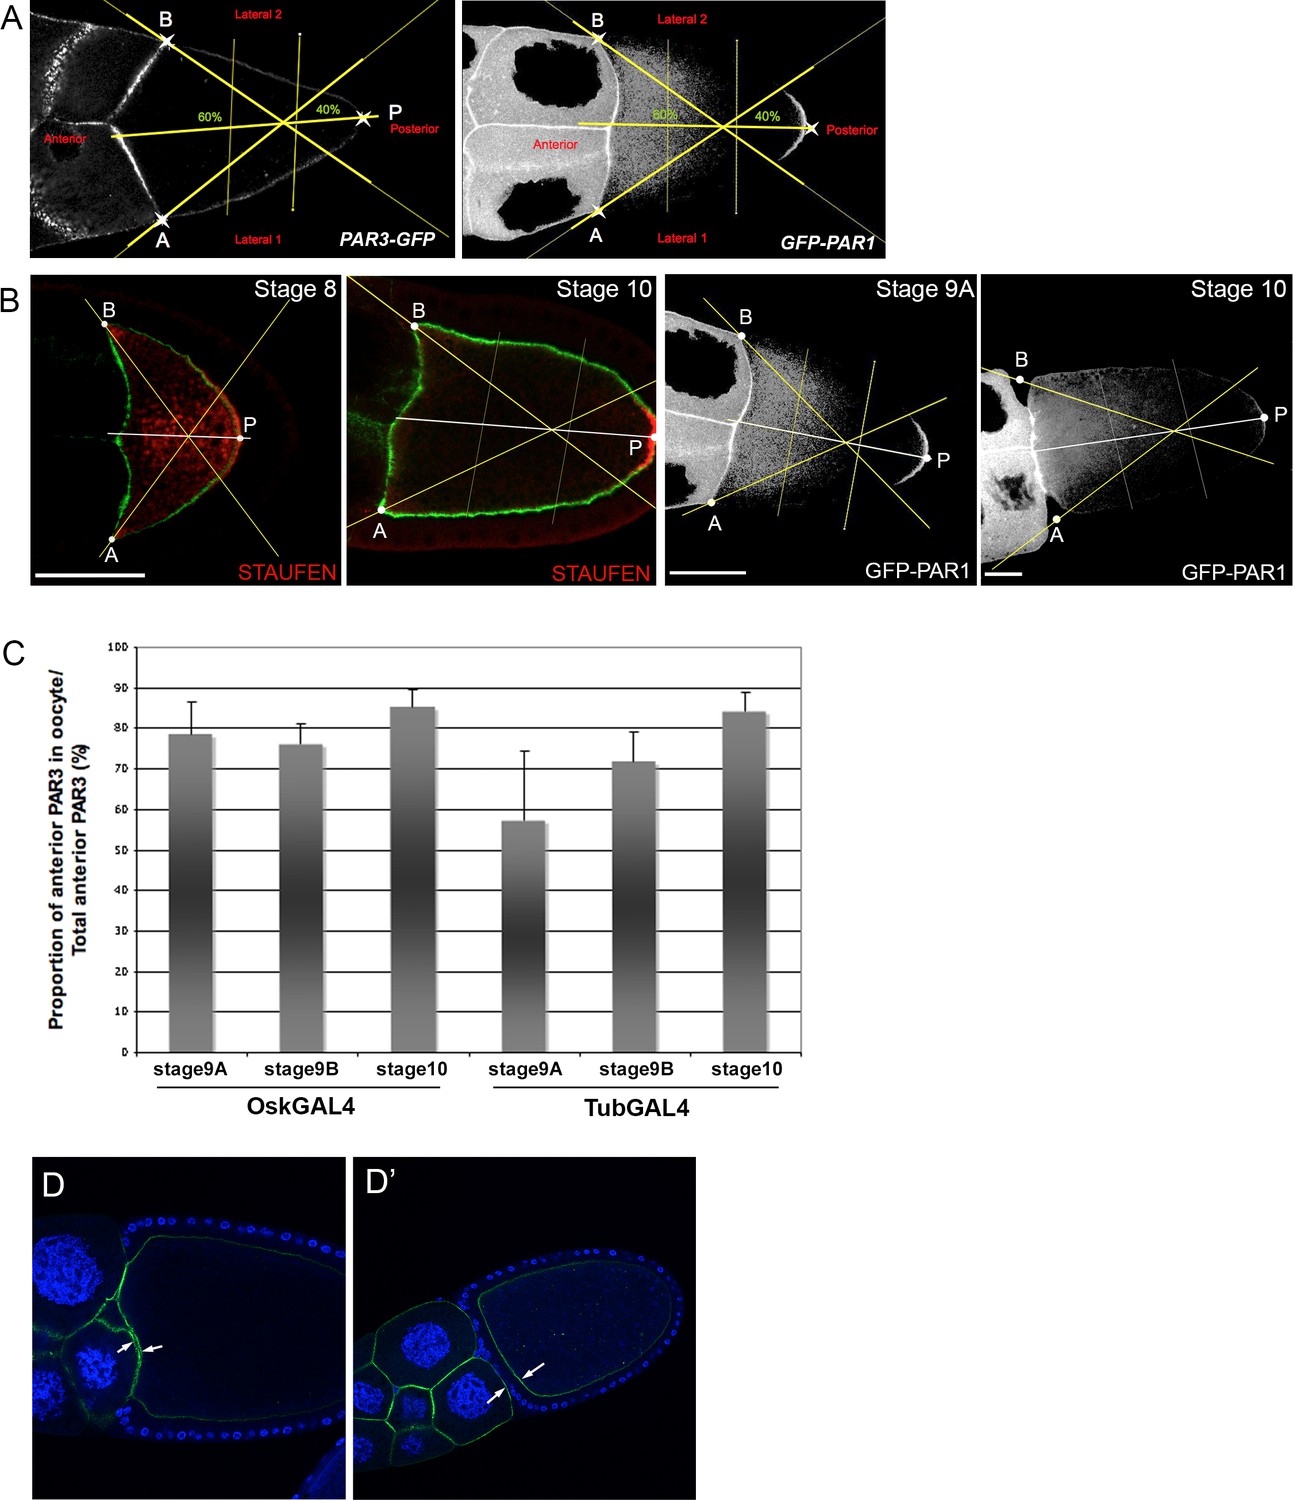
(A) Localisation of GFP-PAR3 (left) and PAR1-GFP (right) under control of maternal Tub67c-GAL4 in stage 9B egg chambers. Note the weak density of PAR3 and the strong density of PAR1 in the PPM crescent. For all egg chambers, we defined the three following points: A and B on both sides of the APM and P on the middle of the PPM. Subsequently, the Fiji Macro automatically segmented the egg chambers tracing three lines (yellow lines). First, it traced the perpendicular line going from the middle of AB to P. It then traced the lines going from A or from B and crossing at 40% of P on the preceding perpendicular line. The crossing between these two last lines and the plasma membrane separates the LPMs from the PPM crescent. The APM comprises the region between points A and B. (B) Validation of PPM crescent identification by the Fiji Macro. The PPM corresponds to the PAR1 (right, white) and the Staufen (left, red) plasma membrane domain. The actin cytoskeleton is stained green. Scale bars indicate 30 µm. (C) Quantification by our Fiji Macro of the signal intensity at the anterior domain coming both from the oocyte APM and the plasma membrane of the two neighbouring nurse cells in the control lines (Osk-GAL4 and Tub67c-GAL4). The proportion of signal arising from oocytes compared to adjacent nurse cells is relatively stable from stage 8 to stage 10. Error bar indicates SEM. (D,D’) Example of distribution of PAR3-GFP (green) expressed with Tub67c-GAL4 driver in a late stage 10 oocyte showing the proximity of the oocyte APM to the adjacent nurse cells. The nurse cell membranes are detached partially (D) or totally (D’) from the oocyte APM. White arrows indicate the oocyte APM and the nurse cell adjacent membrane. DNA is stained with DAPI (blue).
-
Figure 1—figure supplement 3—source data 1
Proportion of anterior PAR3 (APM) in oocytes versus in adjacent nurse cells.
- https://doi.org/10.7554/eLife.40212.006
Figure 2 with 2 supplements
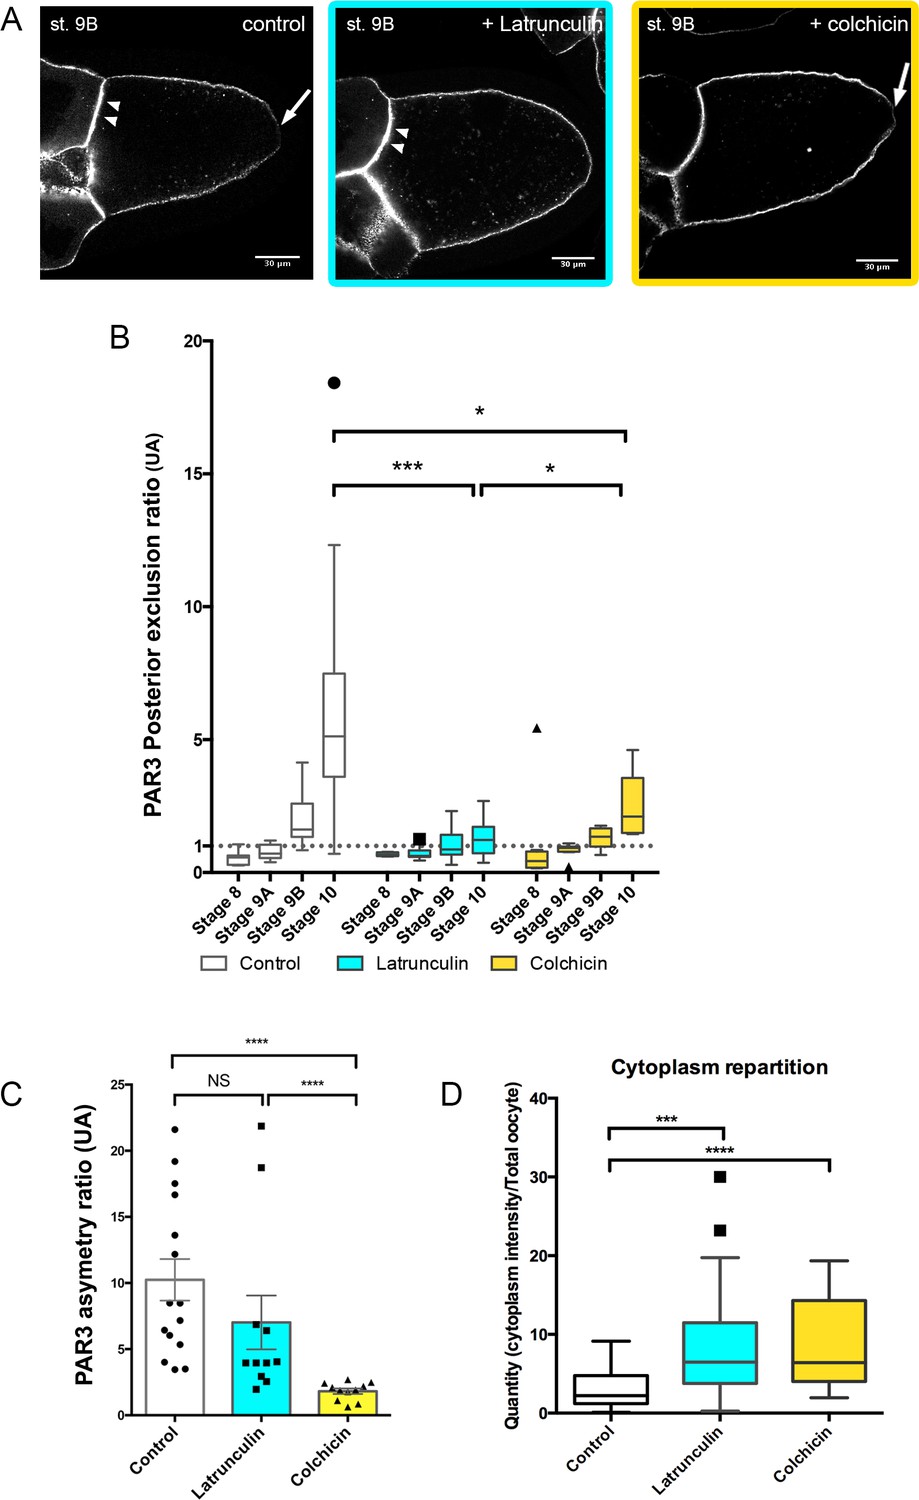
Cytoskeleton involvement in PAR3 polarity.
(A–D) Role of cytoskeleton on PAR3 distribution. Flies are nourished with latrunculin (cyan) for 48 h, colchicin (yellow) for 24 h, or only yeast paste (control). (A) Representative distribution of PAR3-GFP in stage 9B oocytes. Note the PPM exclusion of PAR3 (arrow) or the strong APM accumulation (arrowhead). (B) The PAR3 posterior exclusion ratio (ratio LPM/PPM density) is represented between stage 8 and stage 10 oocytes. Under the value of 1, there is a posterior accumulation of PAR3, and above 1 a posterior exclusion. (C) Antero-posterior asymmetry (ratio APM/PPM density at stage 9B) is strongly affected by colchicin, but not by latrunculin. (D) The two drugs lead to an increase in the cytoplasmic fraction of PAR3 in stage 9B oocytes. Mann-Whitney test, NS: not significant; *p<0.05 ; ***p<0.001 ; ****p<0.0001. Error bars indicate SEM. Control (stage 8, n = 8; stage 9A, n = 9; stage 9B, n = 15; stage 10, n = 14);+latrunculin (stage 8, n = 5; stage 9A, n = 12; stage 9B, n = 11; stage 10, n = 9);+colchicin (stage 8, n = 8; stage 9A, n = 9; stage 9B, n = 11; stage 10, n = 6).
-
Figure 2—source data 1
PAR3 posterior exclusion ratio in oocyte of flies fed with latrunculin, colchicin, or without drugs.
(Figure 2B).
- https://doi.org/10.7554/eLife.40212.013
-
Figure 2—source data 2
PAR3 asymmetry ratio in oocyte of flies fed with latrunculin, colchicin, or without drugs.
(Panel C).
- https://doi.org/10.7554/eLife.40212.014
-
Figure 2—source data 3
PAR3 quantity (cytoplasm intensity/total oocyte intensity) in oocyte of flies fed with latrunculin, colchicin, or without drugs.
(Figure 2D).
- https://doi.org/10.7554/eLife.40212.015
Figure 2—figure supplement 1
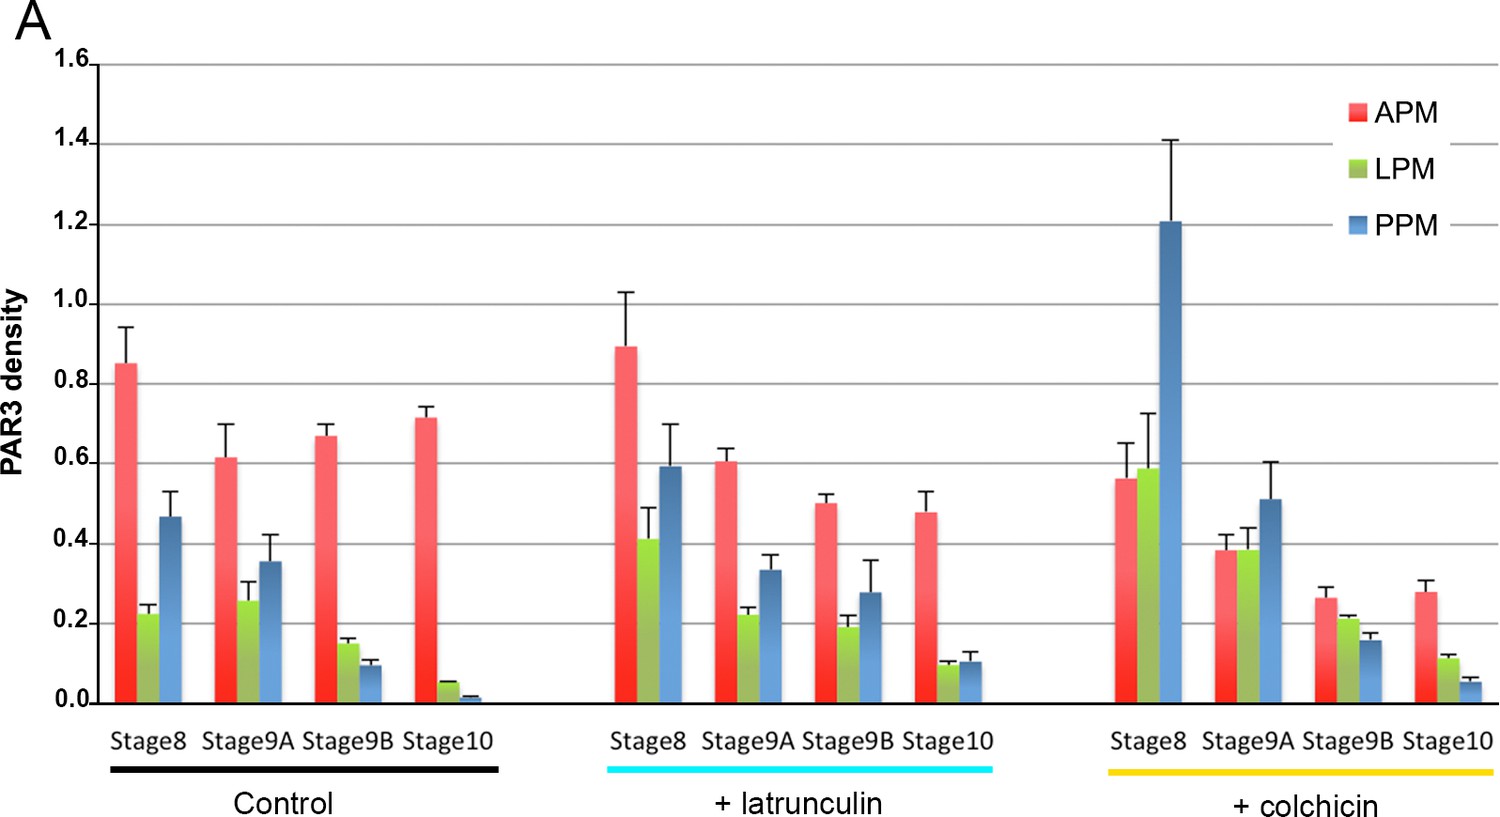
Cytoskeleton involvement in PAR3 distribution.
(A) Quantification of PAR3-GFP density between stage 8 and stage 10 upon latrunculin (cyan) and colchicin (yellow) treatment. These data were used to obtain the graph in Figure 2B–D. Error bars indicate SEM. Control (stage 8, n = 8; stage 9A, n = 9; stage 9B, n = 15; stage 10, n = 14); +latrunculin (stage 8, n = 5; stage 9A, n = 12; stage 9B, n = 11; stage 10, n = 9); +colchicin (stage 8, n = 8; stage 9A, n = 9; stage 9B, n = 11; stage 10, n = 6).
-
Figure 2—figure supplement 1—source data 1
Quantification of PAR3-GFP density (normalised) between stage 8 and stage 10 upon latrunculin and colchicin treatment.
- https://doi.org/10.7554/eLife.40212.010
Figure 2—figure supplement 2
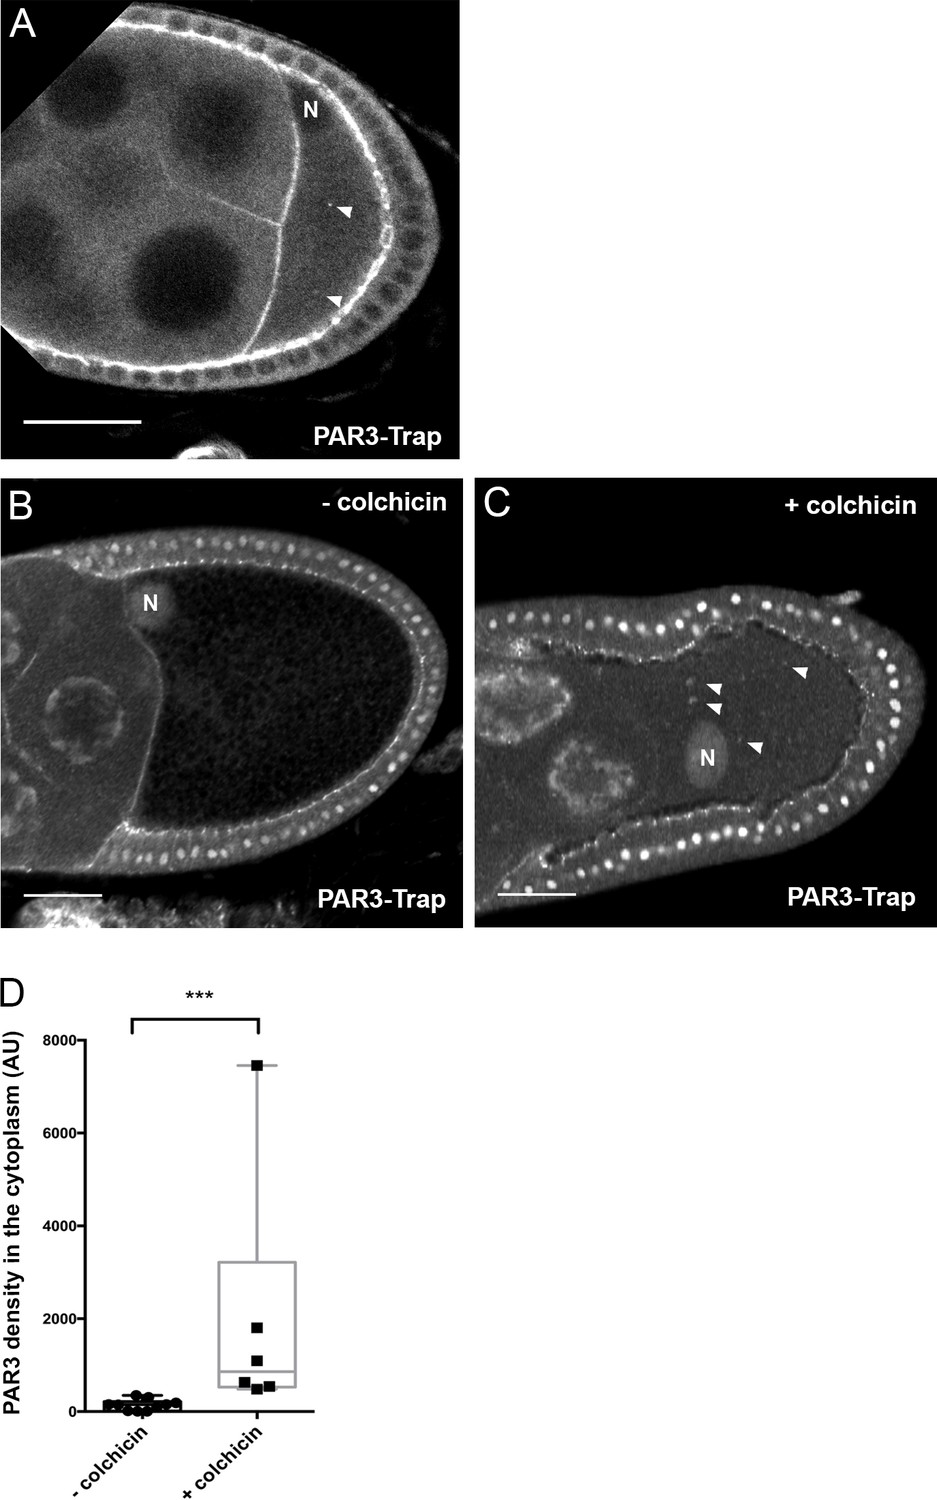
Effect of colchicin on distribution of PAR3 present at an endogenous level.
(A) Localisation of PAR3-GFP (Trap line) at a pre-vitellogenic stage egg chamber. We note PAR3 localised at the anterior cortex and also in some small dots in the oocyte cytoplasm (arrowhead). We cannot observe the very weak signal of PAR3 in the cytoplasm at a later stage because of vitellus accumulation. (B–D) Microtubule requirement for endogenous PAR3 distribution. Flies are fed with colchicin (+colchicin) for 48 h or only yeast paste (-colchicin). To enhance the GFP signal, anti-GFP staining was performed. (B,C) Representative distribution of PAR3-GFP in the absence (B) or presence of colchicin (C). Note accumulation of dotted structures (arrowhead) with colchicin. The nuclear staining is not specific for PAR3 and is only linked to the use of anti-GFP antibody. (D) Colchicin leads to an increase in the cytoplasmic fraction of PAR3. Mann-Whitney test, ***: p<0.0002. Control (n = 10) and +colchicin (n = 6). N indicates the oocyte nucleus position. The scale bars represent 30 µm.
-
Figure 2—figure supplement 2—source data 1
Density of cytoplasmic fraction of PAR3-GFP (trap line) at stage 9B upon latrunculin and colchicin treatment.
(Panel D).
- https://doi.org/10.7554/eLife.40212.012
Figure 3
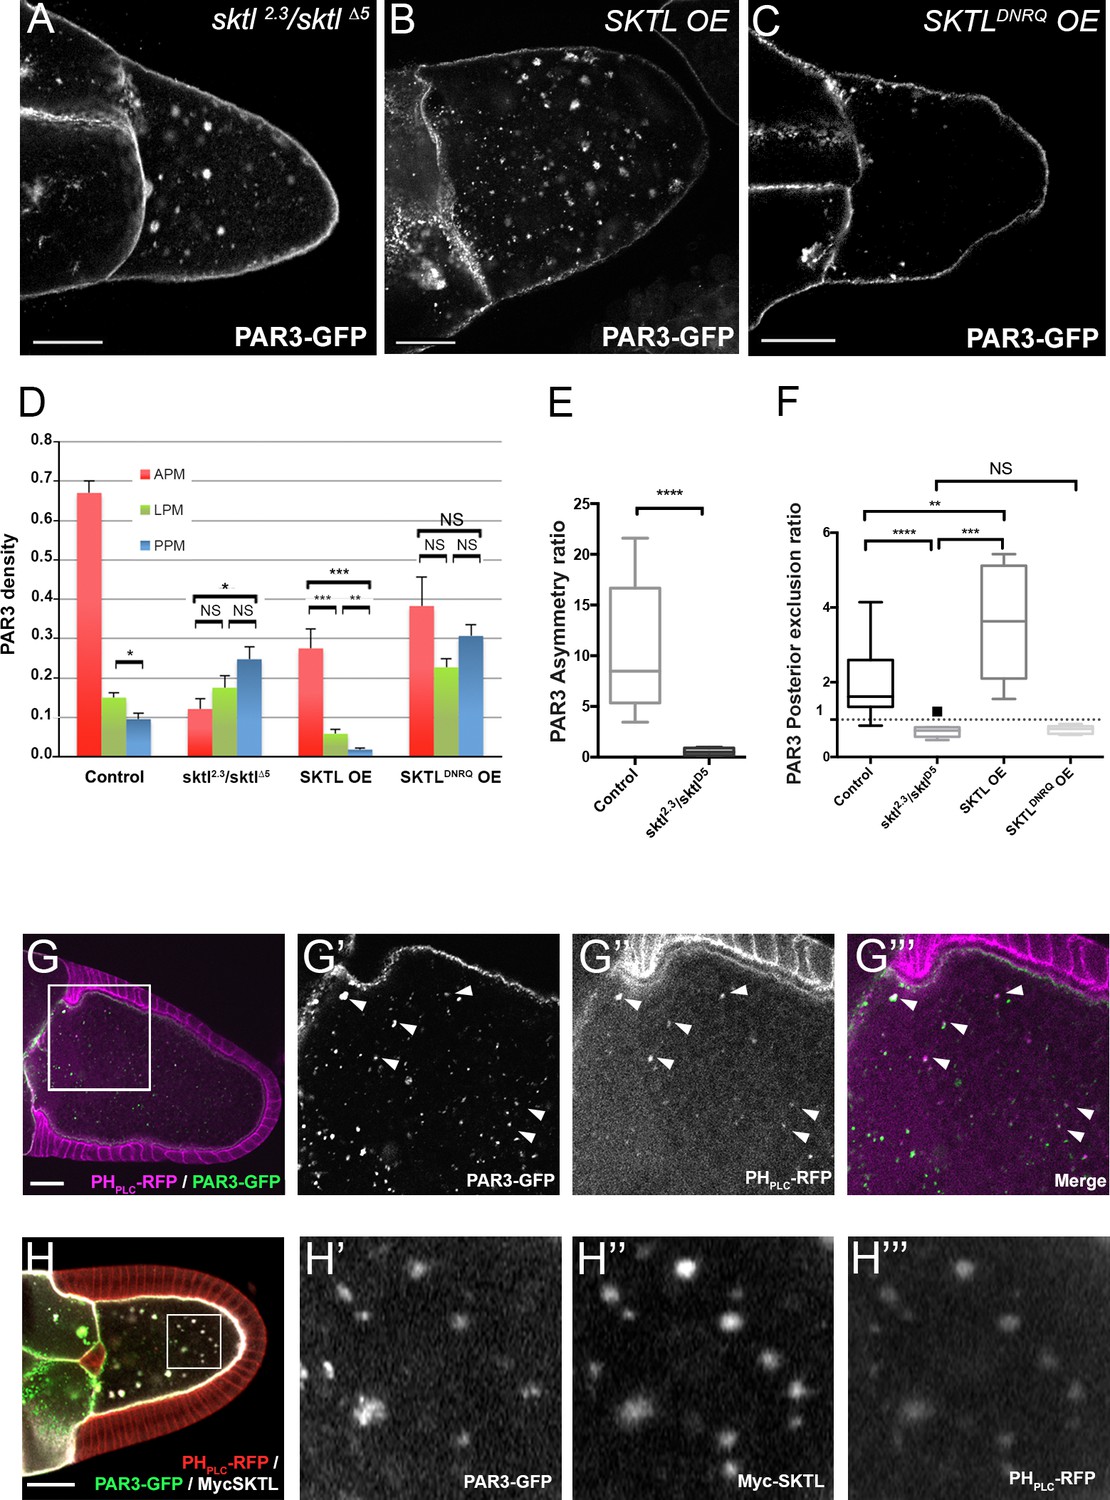
By producing PI(4,5)P2, SKTL controls PAR3 APM accumulation and PPM exclusion.
(A–F) Distribution of PAR3 in response to SKTL activity. PAR3-GFP is expressed in germinal cells at stage 9B under control conditions, or with overexpression (OE) of Myc-SKTL, Myc-SKTLDNRQ, or in context sktl2.3/sktl∆5. (A–C) Representative distribution of PAR3-GFP in oocytes in these different genetic contexts. (D) Quantification of PAR3 density at each plasma membrane domain in sktl mutant or SKTL overexpressed (OE) contexts in stage 9B oocytes. Error bars indicate SEM. (E) Antero-posterior asymmetry of PAR3 (ratio APM/PPM density) at stage 9B in control or sktl mutant. (F) Quantification of PAR3 posterior exclusion ratio in sktl mutant or SKTL overexpressed contexts at stage 9B. For (D–F): control (stage 9B, n = 10); sktl2.3/sktl∆5 (stage 9B, n = 8); Myc-SKTL (stage 9B, n = 8); Myc-SKTLDNRQ (stage 9B, n = 10). Mann-Whitney test, NS: not significant; *p<0.05 ; **p<0.01 ; ***p<0.001 ; ****p<0.0001. (G) PAR3-GFP (green, G’) expressed in the germline is present occasionally on vesicles containing PI(4,5)P2 visualised with PHPLC RFP (magenta). Arrowheads show the vesicles that are associated with PAR3 and PI(4,5)P2. G’, G’’ and G’’’ are magnifications of G (white frame). (H) Colocalisation of PAR3 (green, H’), PI(4,5)P2 visualised with PHPLC RFP (red, H’’’), and SKTL visualised with myc tag (white, H’’). Note that coexpression of PAR3 and SKTL increase the cytoplasmic dotted localisation of PAR3. Scale bars indicate 30 µm.
-
Figure 3—source data 1
Quantification of PAR3 density (normalised) at each plasma membrane domain in sktl mutant or SKTL overexpressed (OE) contexts in stage 9B oocytes.
- https://doi.org/10.7554/eLife.40212.017
-
Figure 3—source data 2
Quantification of PAR3 asymmetry ratio in sktl mutant or control at stage 9B.
(Panel E).
- https://doi.org/10.7554/eLife.40212.018
-
Figure 3—source data 3
Quantification of PAR3 posterior exclusion ratio in sktl mutant or SKTL overexpressed contexts at stage 9B.
(Panel F).
- https://doi.org/10.7554/eLife.40212.019
Figure 4 with 1 supplement
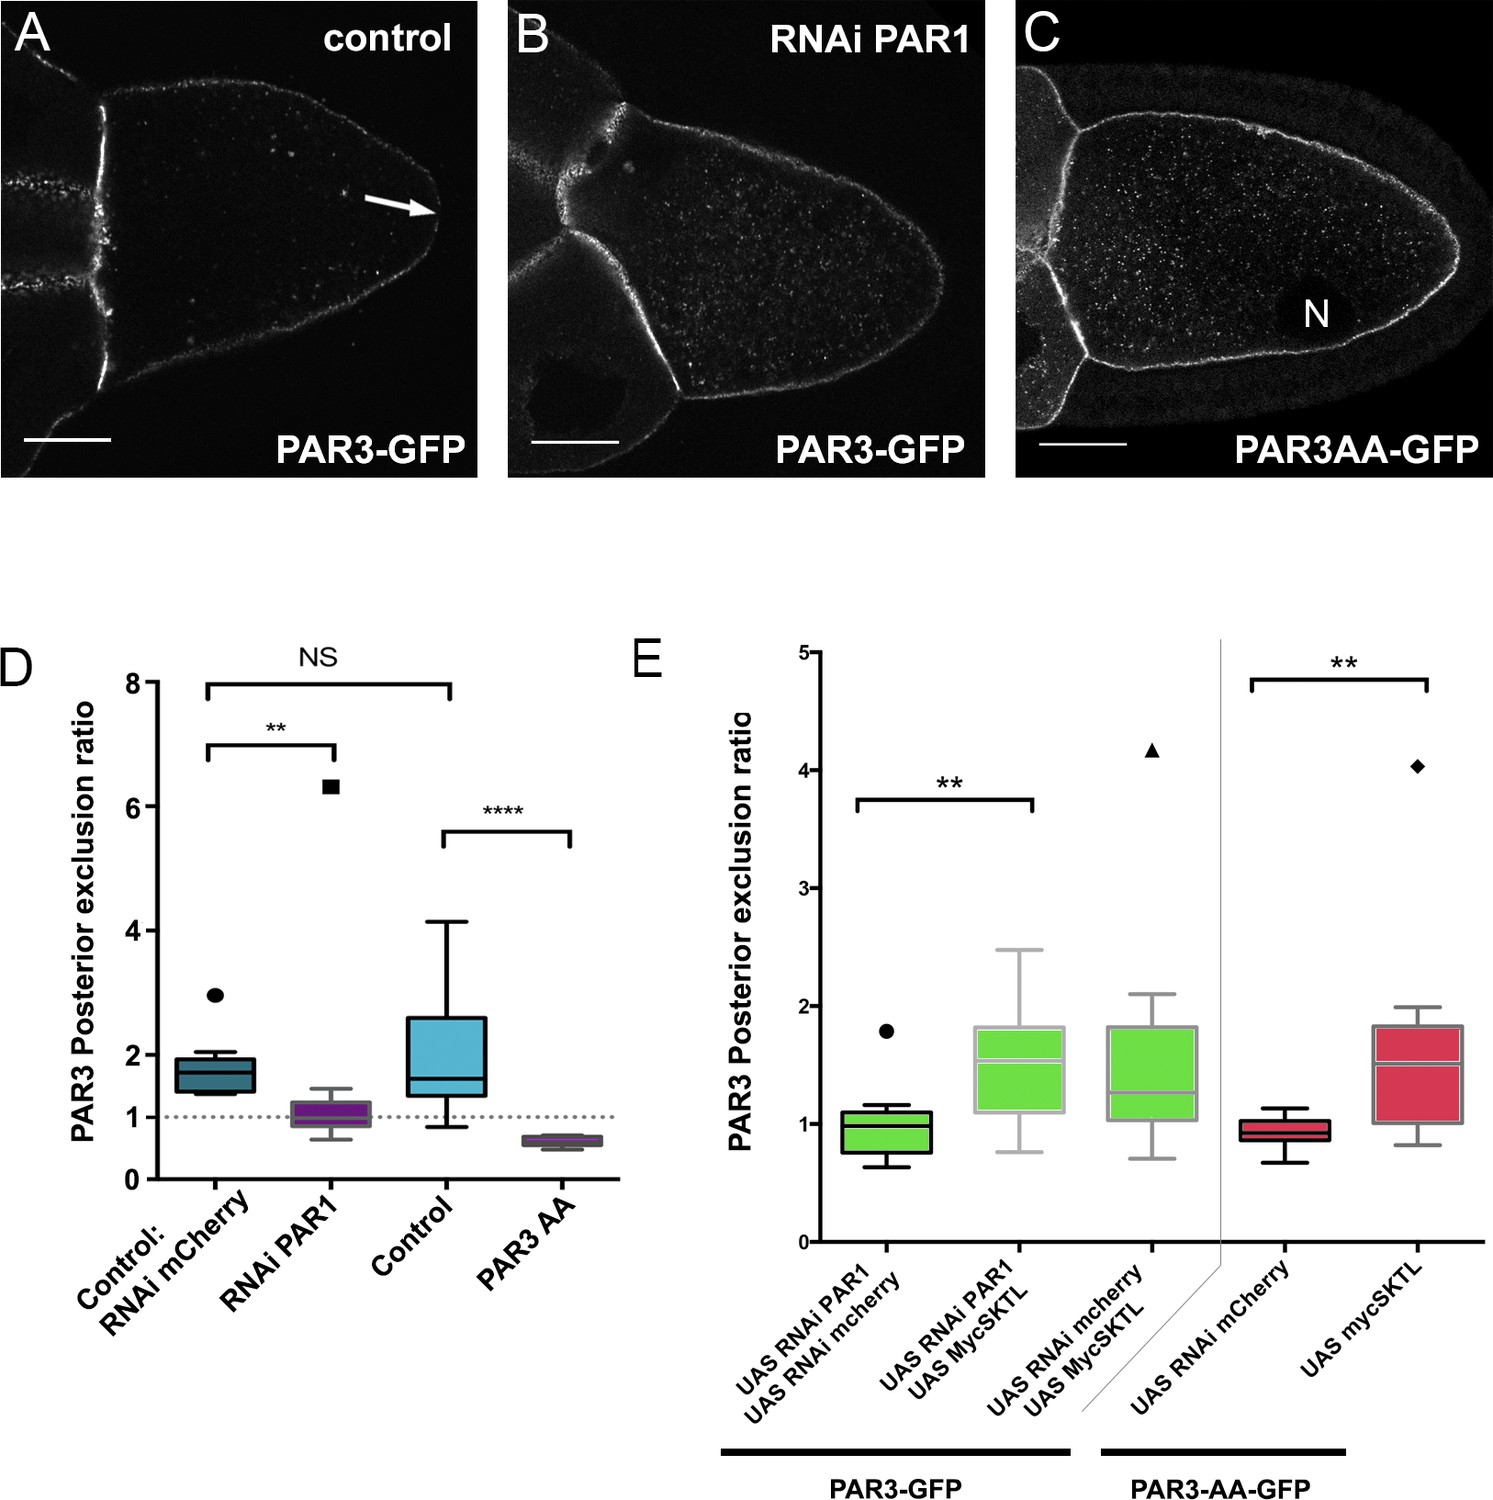
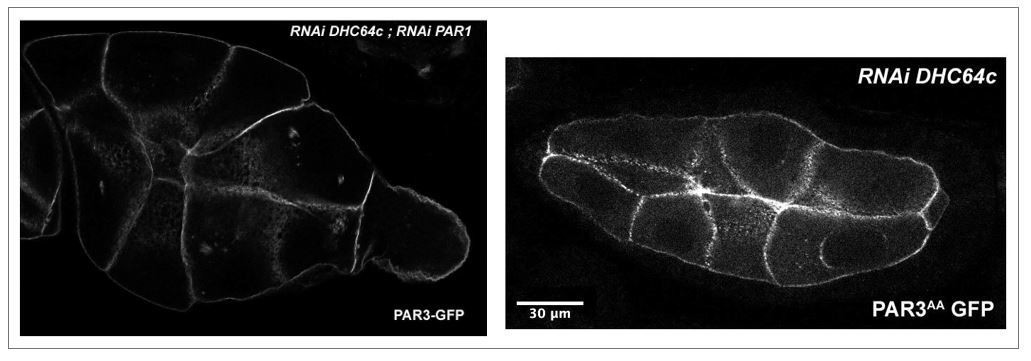
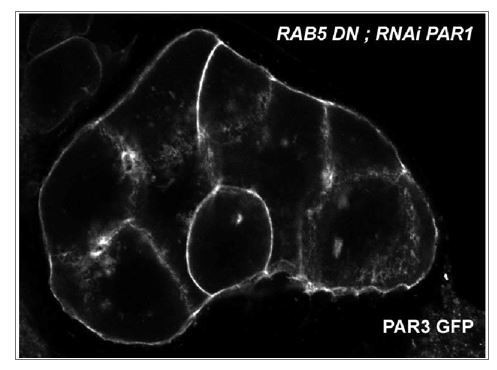
SKTL-dependent PAR3 posterior exclusion bypasses regulation by PAR1.
(A–C) Representative distribution of PAR3-GFP in stage 9B oocyte in a control situation (A), in RNAi PAR1 context (B), or when PAR3 phosphorylation sites by PAR1 are mutated (C). In the control genotype, PAR3 is excluded from PPM (arrow), unlike the other two genotypes. N indicates the oocyte nucleus position. The scale bars represent 30 µm. (D) PAR3 posterior exclusion in response to PAR1 at stage 9B. In germinal cells, PAR3AA-GFP, a mutant form, non phosphorylable by PAR1 or PAR3-GFP is expressed with nothing, with par1, or with mCherry knock-down contexts. The posterior exclusion ratios in stage 9B oocytes are represented. PAR3 (stage 9B, n = 15); PAR3-AA (stage 9B, n = 6); PAR3 RNAi mCherry (stage 9B, n = 10); PAR3 RNAi PAR1 (stage 9B, n = 10). (E) SKTL effect on PAR3 posterior exclusion is observed in combination with a PAR1 activity decrease (in green) or with the PAR3-AA non phosphorylable form (in red). PAR3, RNAi PAR1, RNAi mCherry (stage 9B, n = 10); PAR3, RNAi PAR1, mycSKTL (stage 9B, n = 11) PAR3 RNAi PAR1 (stage 9B, n = 10); PAR3, RNAi mCherry, mycSKTL (stage 9B, n = 10); PAR3-AA, RNAi mCherry (stage 9B, n = 10); PAR3-AA, mycSKTL (stage 9B, n = 10). Mann-Whitney test, NS: not significant; *p<0.05 ; **p<0.01 ; ***p<0.001 ; ****p<0.0001.
-
Figure 4—source data 1
Quantification of PAR3 posterior exclusion in response to PAR1 at stage 9B.
(Panel D).
- https://doi.org/10.7554/eLife.40212.022
-
Figure 4—source data 2
Quantification of PAR3 posterior exclusion in response to PAR1 at stage 9B in combination with SKTL.
(Panel E).
- https://doi.org/10.7554/eLife.40212.023
Figure 4—figure supplement 1
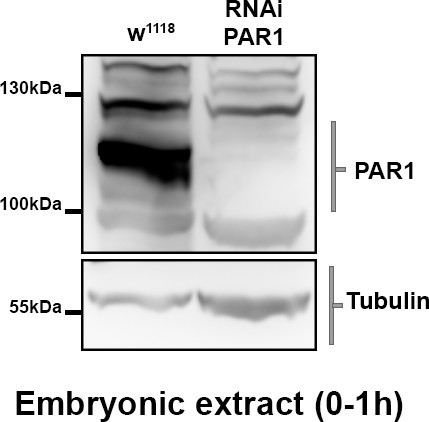
Validation of RNAi PAR1 efficiency.
Flies Tub67c-GAL4 or Tub67c-GAL4; UASp RNAi par1 were put on fly cages to lay eggs on agar plates. The plates were collected every hour to produce the embryonic extracts revealed after western blot. PAR1 was revealed with a rabbit anti-PAR1 antibody.
Figure 5 with 1 supplement
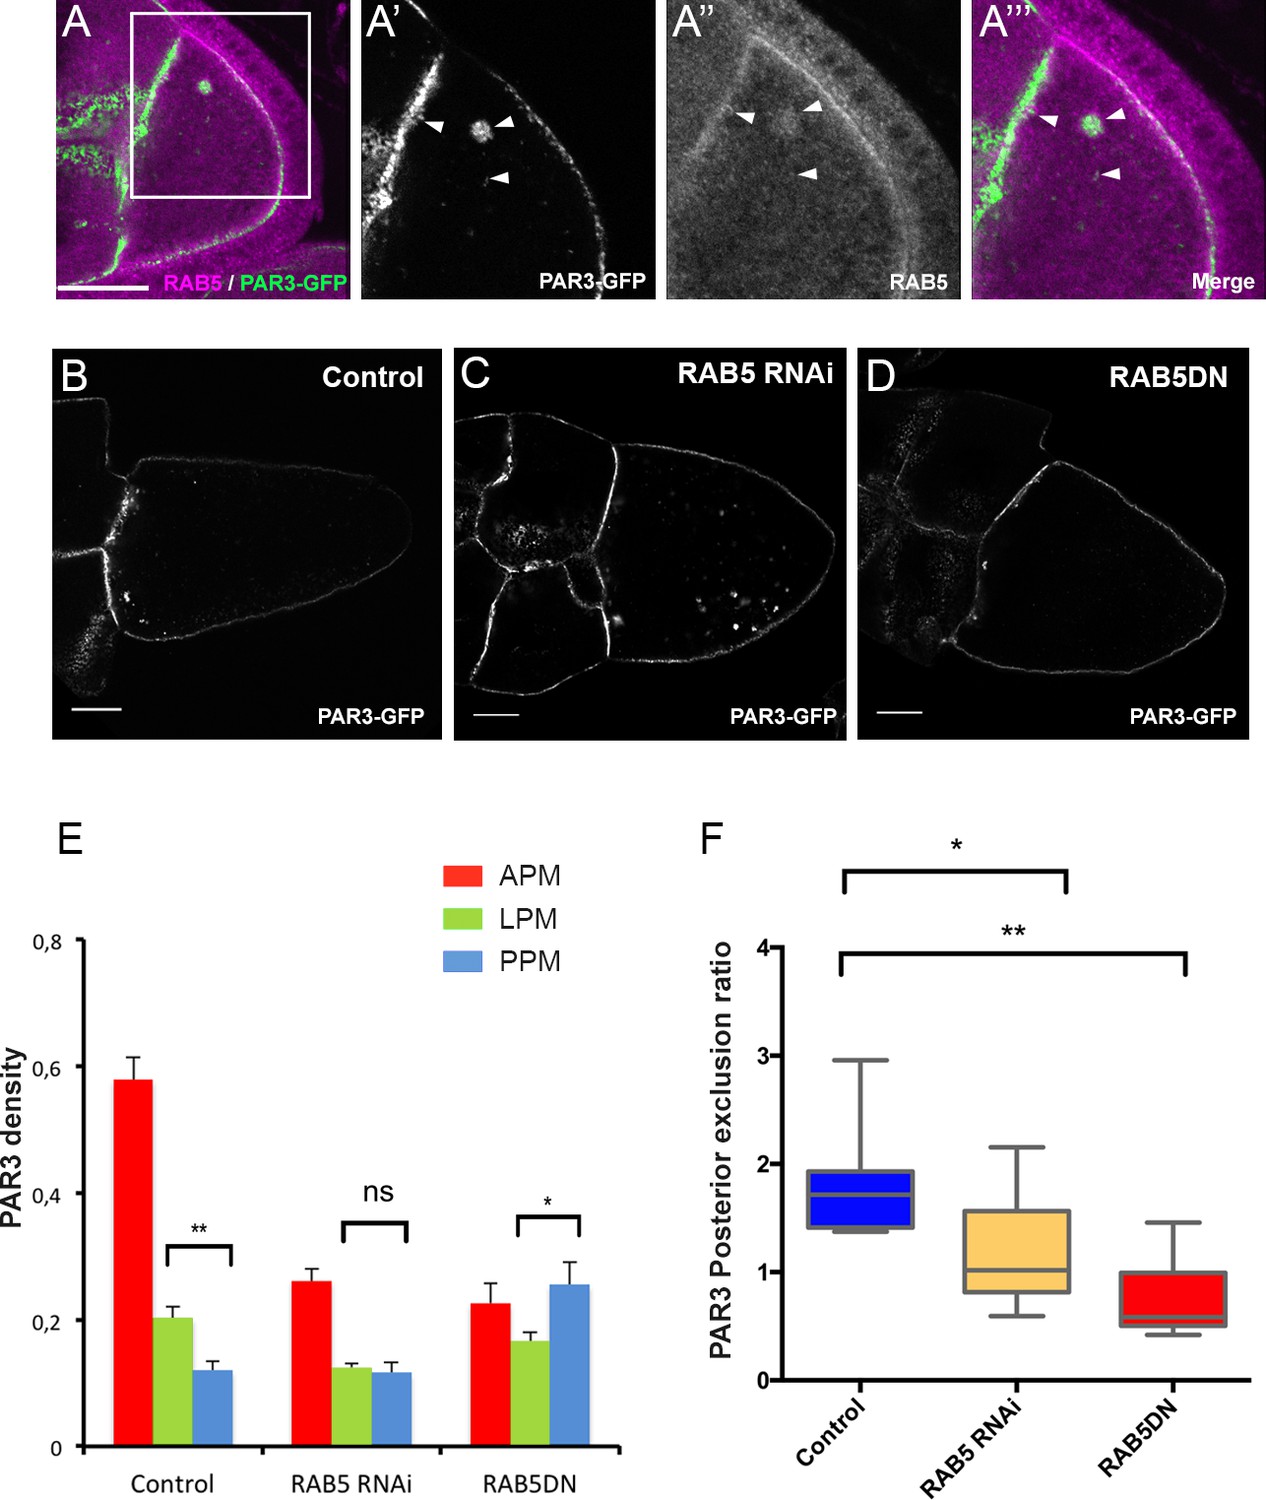
PAR3 asymmetry depends on RAB5.
(A) PAR3-GFP (A’), (A’’’ green) expressed in germline is present occasionally in RAB5-positive early endosomes (A’’), (A’’’) magenta). A’, A’’ and A’’’ are magnifications of A (white frame). Arrowheads show the vesicles that are associated with PAR3 and RAB5. (B–F) PAR3 distribution in response to RAB5 activity impairment. PAR3-GFP is expressed in germinal cells at stage 9B in RAB5 RNAi, RAB5DN(S43N) or in mCherry knockdown (control) contexts. (B–D) Representative images of PAR3 distribution under control conditions (B), in RAB5 RNAi (C), or in RAB5DN(S43N) (D). Scale bars indicate 30 µm. (E) Quantification of PAR3 density at each plasma membrane domain. Error bars indicate SEM. (F) Quantification of PAR3 posterior exclusion in different RAB5 mutant contexts. Control (stage 9B, n = 10); RAB5 RNAi (stage 9B, n = 12); RAB5DN(S43N) (stage 9B, n = 6). Mann-Whitney test, ns: not significant; *p<0.05 ; **p<0.01.
-
Figure 5—source data 1
Quantification of PAR3 density at each plasma membrane domain of stage 9B oocytes in response to RAB5 activity impairment.
(Panel E).
- https://doi.org/10.7554/eLife.40212.026
-
Figure 5—source data 2
Quantification of PAR3 posterior exclusion in different RAB5 mutant contexts at stage 9B.
(Panel F).
- https://doi.org/10.7554/eLife.40212.027
Figure 5—figure supplement 1
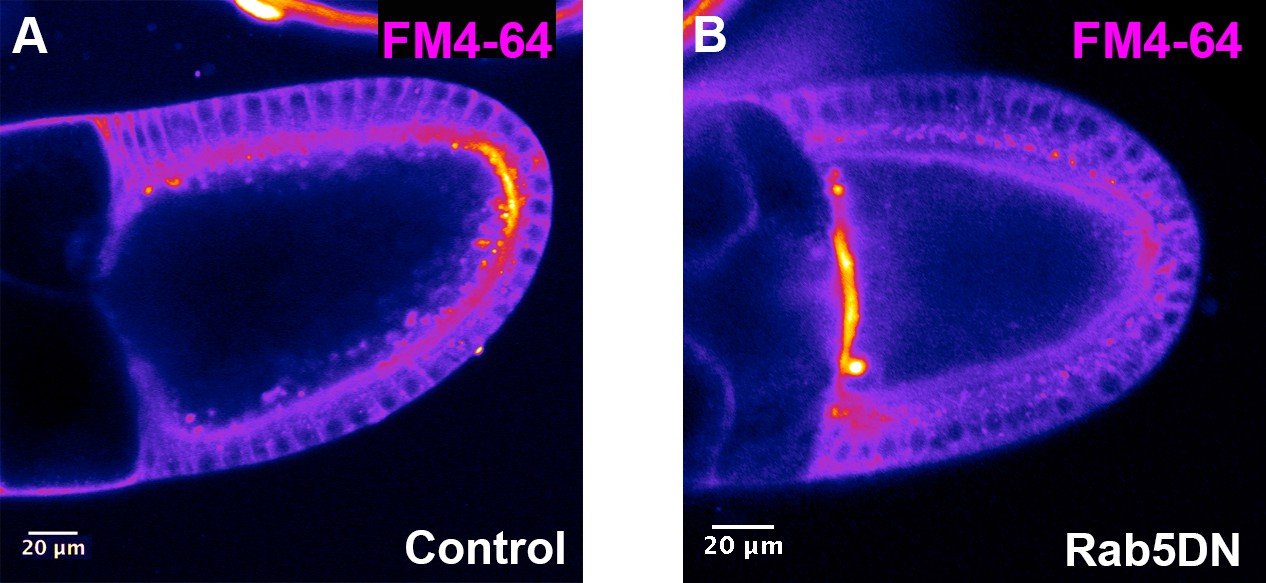
Validation of RAB5DN effect on endocytosis.
Endocytosis uptake of FM4-64 dye was performed on control (A, Tub67c-GAL4) or on RAB5DN(S43N) expressing egg chambers (B, Tub67c-GAL4; UASp RAB5DN). In panel (A), the dye is internalised in dotted structures all around the plasma membrane with a higher rate at the posterior. In panel (B), there is a strong decrease of FM4-64 internalisation, indicating that endocytosis is altered by RAB5DN(S43N) expression. Note that FM4-64 accumulates at the APM, and there are no clear explanations for this.
Figure 6 with 2 supplements
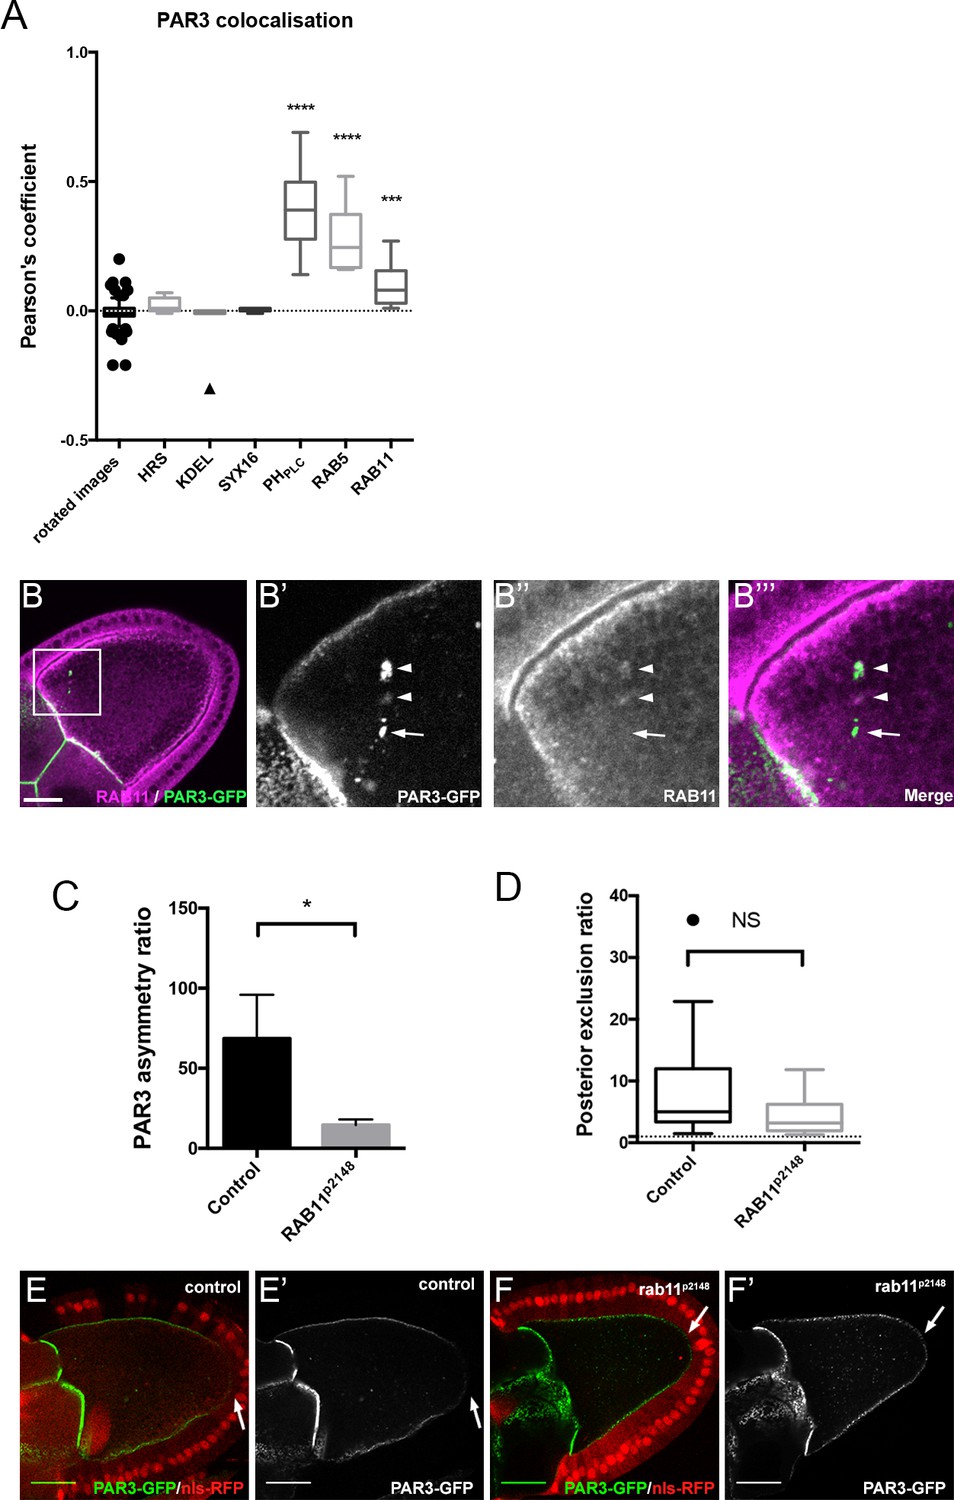
Role of RAB11 on PAR3 asymmetrical localisation.
(A) Colocalisation of PAR3 (PAR3-GFP maternally expressed) with vesicular trafficking markers. To quantify the colocalisation, we measured the Pearson’s coefficient on stage 9B oocytes and results are presented in the box plot. As a control, we used the value of colocalisation obtained with the same images but after rotation of one by 90 degrees. The stars represent the p-value with the control. For HRS, KDEL, and SYX16: n = 7; for PHPLC: n = 8; for RAB5: n = 10; for RAB11: n = 13. (B) PAR3-GFP (B’), green) expressed in germline is present occasionally in RAB11-positive recycling endosomes (B’’), (B’’’) magenta). B’, B’’, and B’’’ are magnifications of B (white frame). Arrowheads show the vesicles associated with PAR3 and RAB11. The arrow points to the vesicle associated only with PAR3. (C,D) RAB11 effect on asymmetrical distribution of PAR3. The antero-posterior asymmetry (C) and the posterior exclusion (D) of PAR3 at stage 9B have been evaluated in rab11P2148 germline clones. Control (stage 9B, n = 10); rab11P2148 (stage 9B, n = 10). Mann-Whitney test, NS: not significant; *p<0.05; ***p<0.001 ; ****p<0.0001. Error bars indicate SEM. (E,F) Representative images of PAR3 distribution in rab11P2148 clones. The rab11P2148 mutant cells are indicated by the absence of nuclear RFP staining (nls-RFP). (E) The heterozygote egg chamber (rab11P2148/+) is used as a control. (F) rab11P2148 mutant oocyte. Note that PAR3 is always excluded from PPM (arrow). Scale bars indicate 30 µm.
-
Figure 6—source data 1
Quantification of PAR3 colocalisation with vesicular compartment.
(Panel A).
- https://doi.org/10.7554/eLife.40212.031
-
Figure 6—source data 2
Quantification of PAR3 asymmetry ratio in rab11 mutant clones.
(Panel C).
- https://doi.org/10.7554/eLife.40212.032
-
Figure 6—source data 3
Quantification of PAR3 posterior exclusion ratio in rab11 mutant clones.
(Panel D).
- https://doi.org/10.7554/eLife.40212.033
Figure 6—figure supplement 1
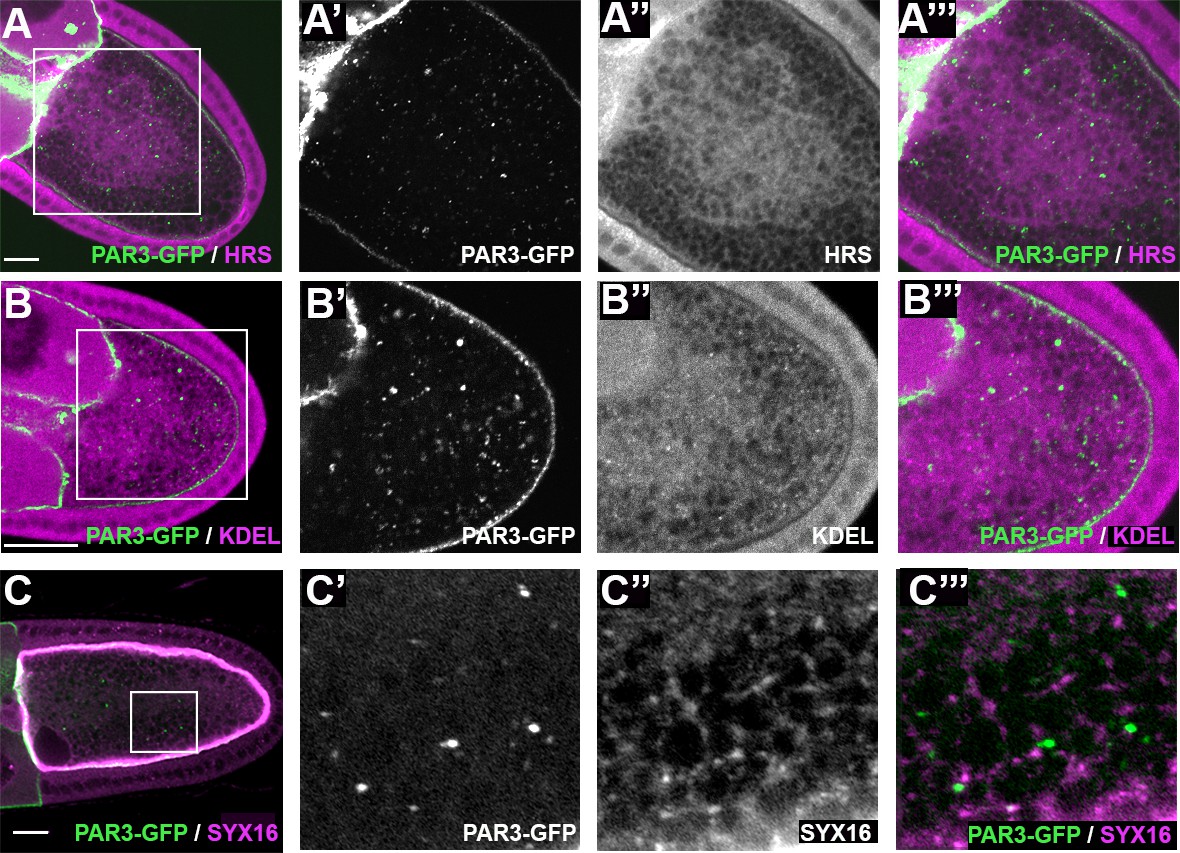
PAR3 and vesicular compartments.
(A–C’’) Characterisation of the components of PAR3-GFP vesicular structures. PAR3-GFP (green, (A, B, C) is expressed in the germline under control of the maternal driver Tub67c-GAL4. By immunostaining, we can observe that PAR3-GFP cytoplasmic vesicular structures do not colocalise with HRS (magenta, A’), a late endosome marker, KDEL (magenta, B’), an endoplasmic reticulum marker, or SYNTAXIN 16 (magenta C’), a TRANS Golgi marker. The scale bars represent 30 µm.
Figure 6—figure supplement 2
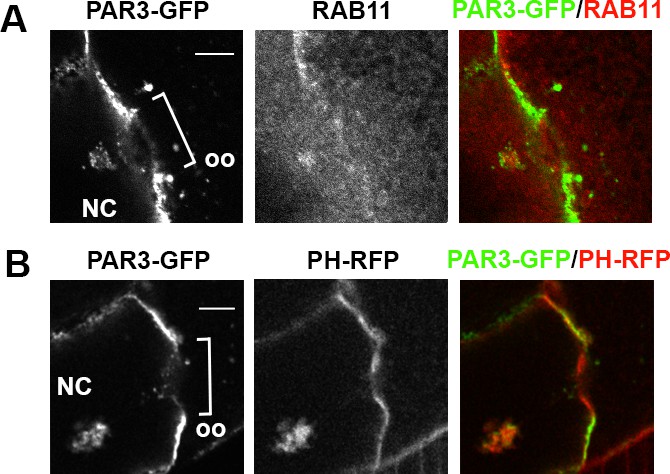
PAR3 colocalises with PI(4,5)P2 and RAB11 in front of the ring canal.
(A, B) Localisation of PAR3-GFP near a ring canal between a nurse cell (NC) plasma membrane and the oocyte (Oo) APM. PAR3-GFP is expressed in the germline under the control of the maternal driver Tub67c-GAL4. In the NC, besides being at the plasma membrane, PAR3 can be accumulated in front of the ring canal. In this case, PAR3 is present in vesicular structures that are RAB11-positive (A) and PI(4,5)P2-positive (B). The scale bars represent 10 µm.
Figure 7 with 2 supplements
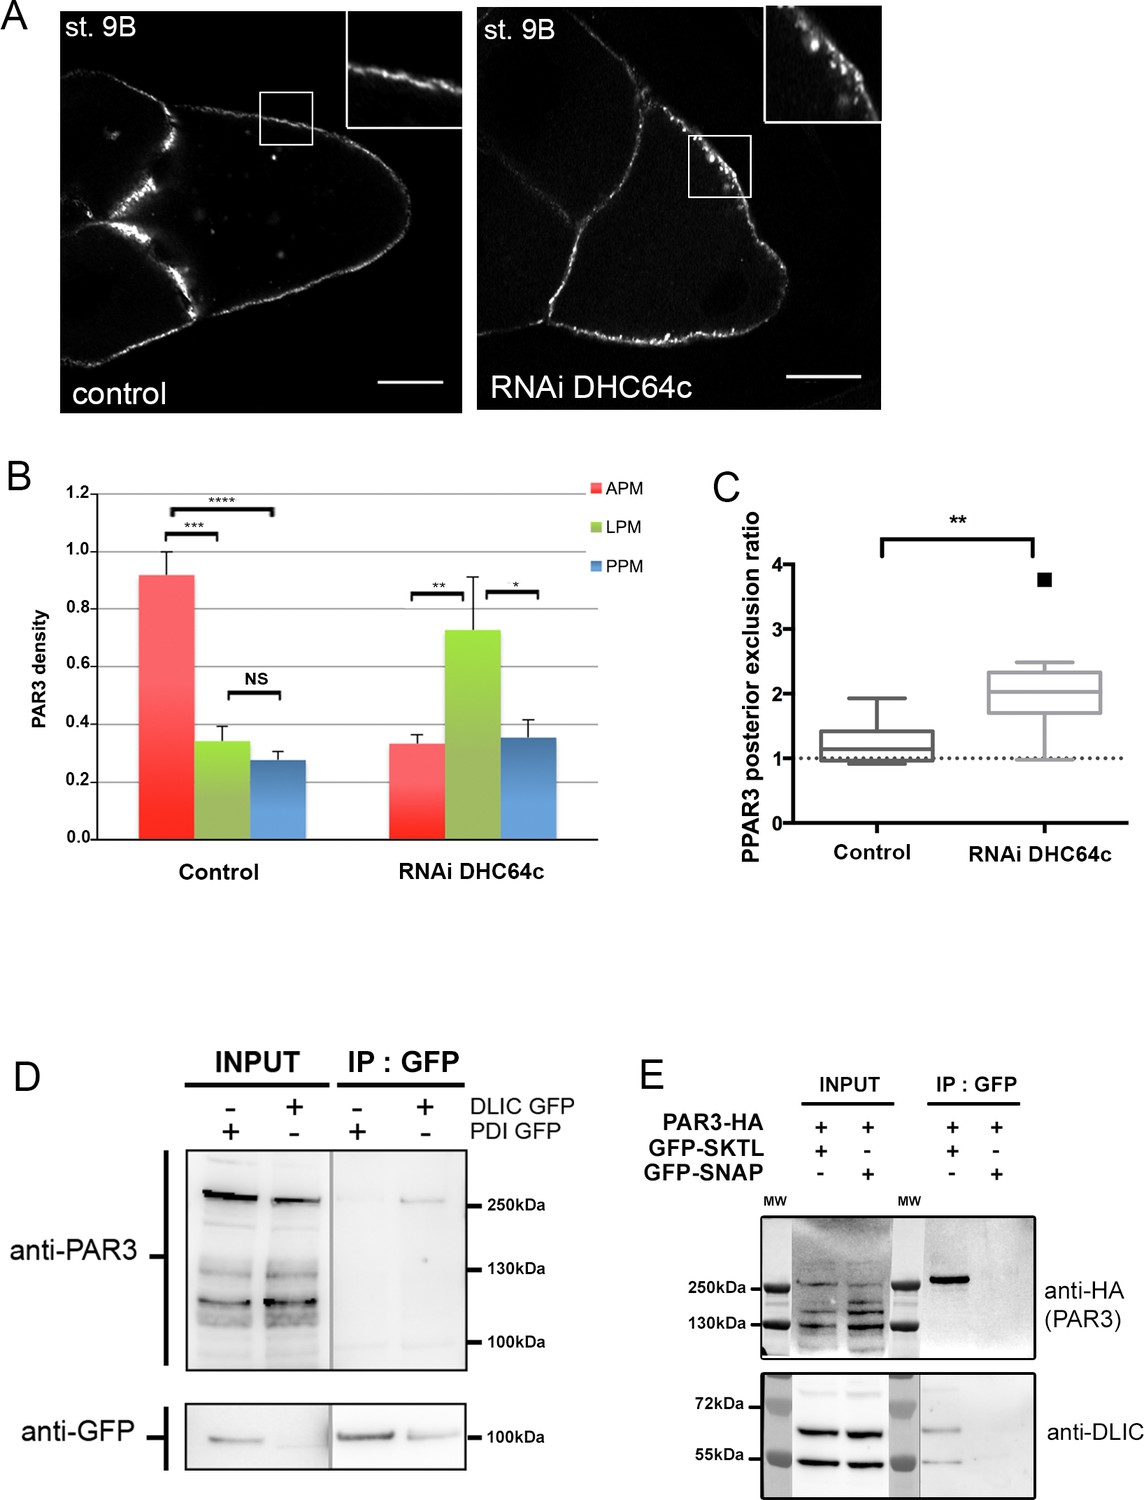
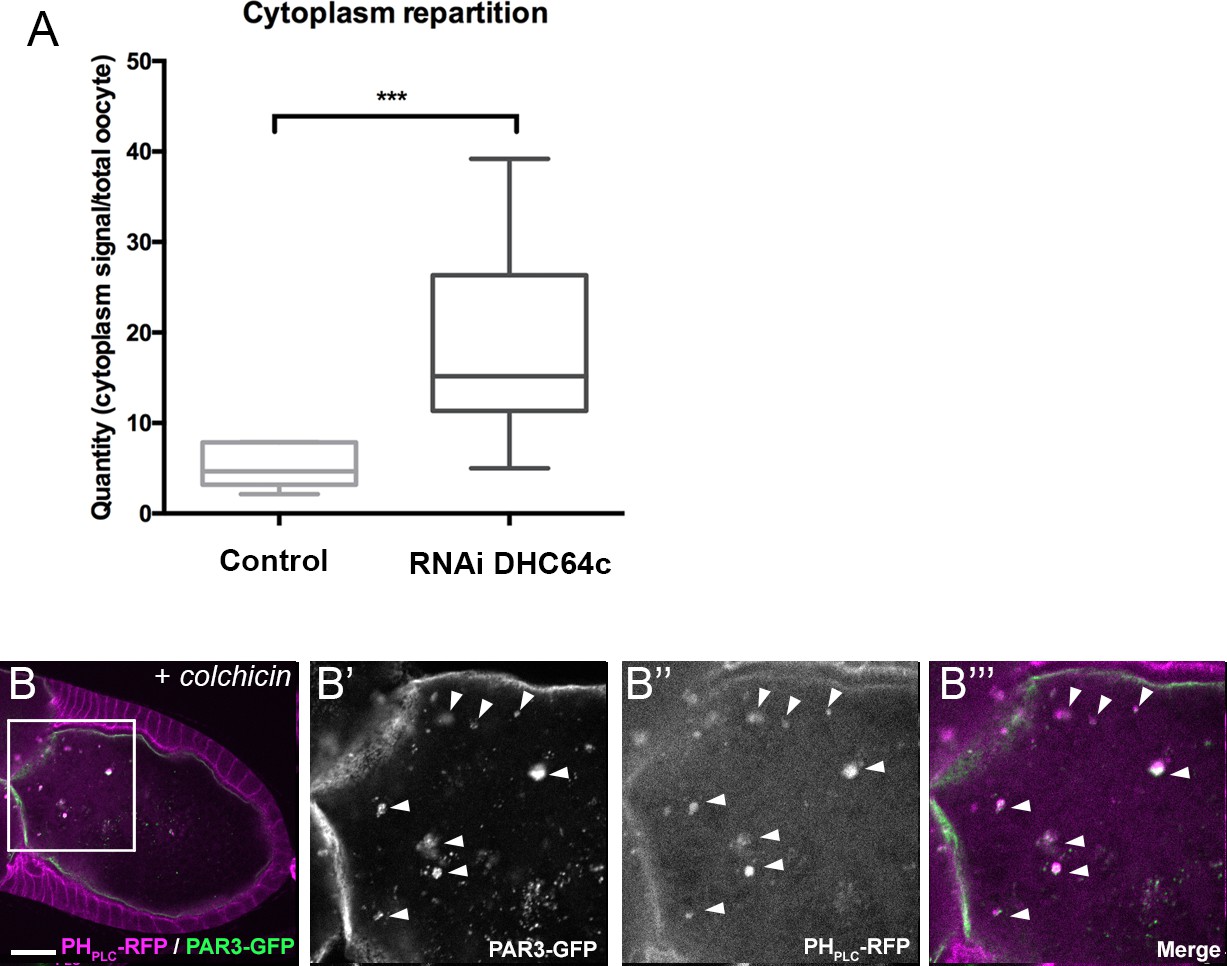
Dynein regulates PAR3 asymmetry.
(A–C) Distribution of PAR3 in response to dynein activity decrease. PAR3-GFP is expressed in germinal cells at stage 9B in control (osk-GAL4; UASp PAR3-GFP) or dhc64 knockdown contexts (osk-GAL4; UASp RNAi dhc64; UASp PAR3-GFP). (A) Representative distribution of PAR3 in oocyte (note the dotted accumulation of PAR3 under the plasma membrane in the insert). The scale bars represent 30 µm. (B) Quantification of PAR3 density at each plasma membrane domain. (C) Quantification of PAR3 posterior exclusion (ratio LPM/PPM) in dynein mutant context. For (A–C): control (stage 9B, n = 10); RNAi dhc64c (stage 9B, n = 10). For (B, C), Mann-Whitney tests; NS: not significant; *p<0.05 ; **p<0.01; ***p<0.001; ****p<0.0001. Error bars indicate SEM. (D) Co-immunoprecipitation (IP) of PAR3 by DLIC-GFP in ovarian extracts. Ovaries were dissected from Pubi-DLIC-GFP flies or control Pubi-PDI-GFP flies. The ovarian extract was incubated on magnetic beads coupled with antibody anti-GFP. PAR3 was revealed by anti-PAR3 antibody. (E) SKTL interacts with both PAR3 and DLIC. CoIP of PAR3-HA or DLIC with GFP-SKTL in S2 cell extracts. Cells were transfected with GFP-SKTL or GFP-SNAP (as control) and with PAR3-HA. The cell extracts were incubated on magnetic beads with anti-GFP antibody. PAR3 was revealed by anti-HA antibody and DLIC by anti-DLIC antibody.
-
Figure 7—source data 1
Quantification of PAR3 density at each plasma membrane domain in Dhc64 knockdown at stage 9B oocytes (Panel B).
- https://doi.org/10.7554/eLife.40212.037
-
Figure 7—source data 2
Quantification of PAR3 posterior exclusion ratio in Dhc64 knockdown at stage 9B oocytes (Panel C).
- https://doi.org/10.7554/eLife.40212.038
Figure 7—figure supplement 1
Control experiments of PAR3 antibody specificity and charge control of immunopurification of GFP-SKTL.
(A) Role of dynein on PAR3 cytoplasmic accumulation (quantification of PAR3 proportion in the cytoplasm related to the whole oocyte intensity). Control (stage 9B, n = 10); RNAi dhc64c (stage 9B, n = 10). Mann-Whitney test, ***p<0.001. Error bars indicate SEM. (B) PAR3 association with PI(4,5)P2 vesicles is not affected by colchicin. Flies are nourished with colchicin for 24 h. PAR3-GFP (B’, green) still colocalises with PI(4,5)P2 visualised with PHPLC RFP (B’’, B’’’, magenta). B’, B’’, and B’’’ are magnifications of B (white frame). The scale bars represent 30 µm.
Figure 7—figure supplement 2
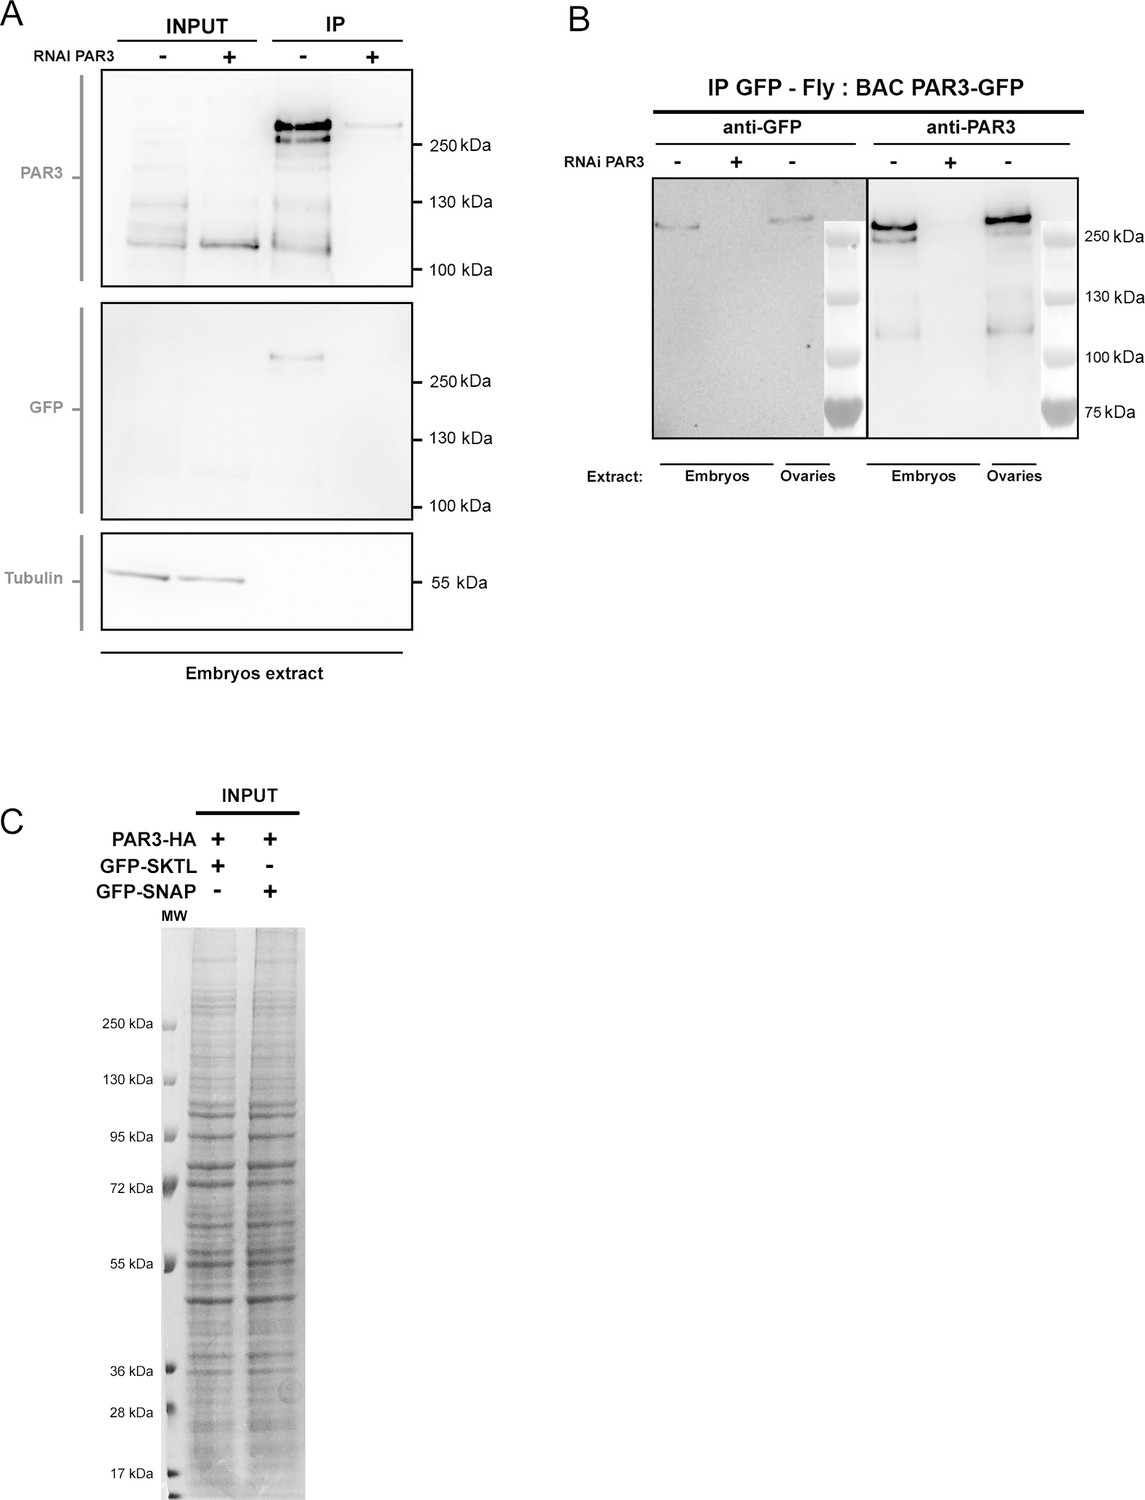
Validation of PAR3 detection by antibody By western blot with anti-PAR3 antibody, we revealed numerous bands corresponding to several isoforms of PAR3 and to post-transcriptionally modified forms.
We hypothesised that the higher band (>250 kD) corresponds to an oligomer form of PAR3. (A) To confirm that this higher band is PAR3, we tried to decrease its intensity by PAR3 RNAi. We immunoprecipitated PAR3-GFP (Tub67c-GAL4; UASp PAR3-GFP) in embryonic extracts expressing or not PAR3 RNAi. We revealed PAR3 using anti-PAR3 antibody or GFP antibody. We used tubulin as loading control. (B) We ran the same experiment with a strain expressing PAR3-GFP at an endogenous level (Bac PAR3-GFP). PAR3-GFP was immunoprecipitated by GFP antibody in ovarian or embryonic extracts. In this case, we also revealed a PAR3 band of high molecular weight, which disappeared with PAR3 RNAi. These results confirm that the high molecular weight band revealed by anti-PAR3 antibody is a form of PAR3, perhaps a dimer form, in accordance to its weight. (C) Visualisation with Coomassie blue staining of the total proteins in Figure 7E-input samples.
Figure 8
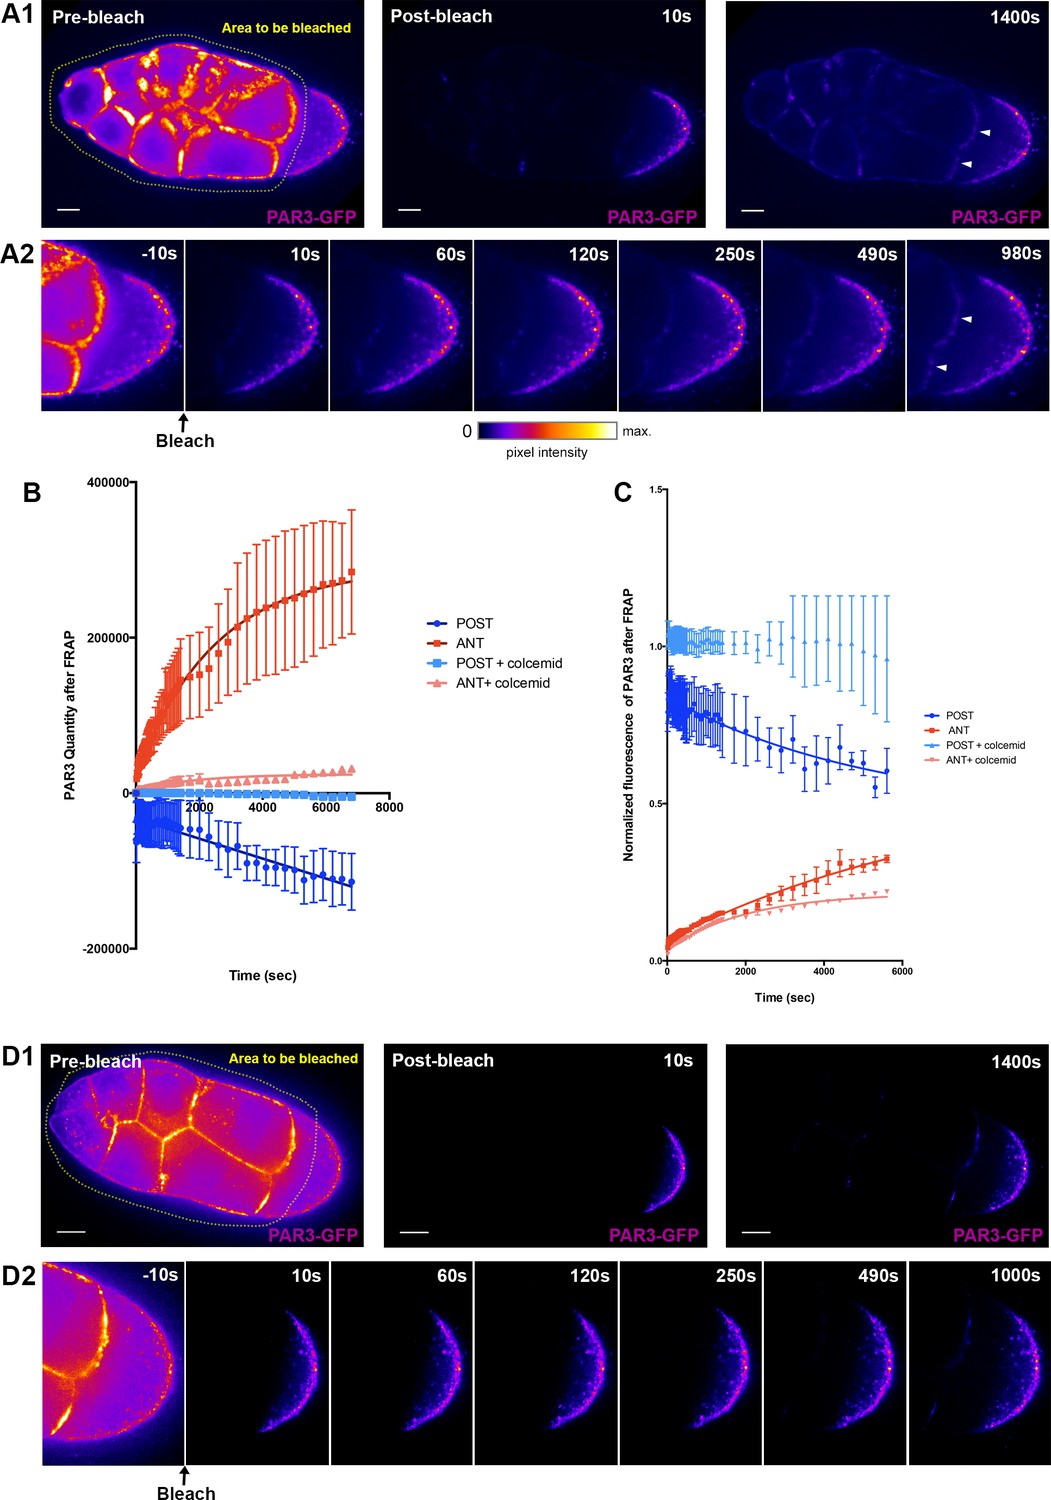
PAR3 recovery after APM photobleaching.
(A) PAR3-GFP expressed in ovarian follicle (Tub67c-GAL4; UASp PAR3-GFP) is photobleached in all the nurse cells and at the APM (yellow area, A1). The fluorescence recovery was followed for around 1400 s (A2). (B) PAR3 quantity in each domain (anterior and posterior domains) was quantified using the same method as previously for three ovarian follicles and raised to 0 after bleaching. It can be seen that, after photobleaching, PAR3 accumulates progressively at the anterior while it is excluded from the posterior. (C) PAR3 quantity of each zone before FRAP was normalised to 1, and recovery of fluorescence was observed. (D) The same experiment as in (A) was performed on ovarian follicle incubated with colcemid. The quantification is shown in graphs in (C) and (D). In (B) and (C), the error bar represents SEM. The scale bars represent 20 µm.
-
Figure 8—source data 1
PAR3 quantity variation (grey levels) at the anterior and the posterior of oocyte after anterior FRAP experiment.
This experiment was performed on three oocytes for each condition (panel B).
- https://doi.org/10.7554/eLife.40212.040
-
Figure 8—source data 2
PAR3 quantity of each zone before FRAP was normalised to 1, and recovery of the fluorescence was observed.
- https://doi.org/10.7554/eLife.40212.041
Figure 9 with 2 supplements
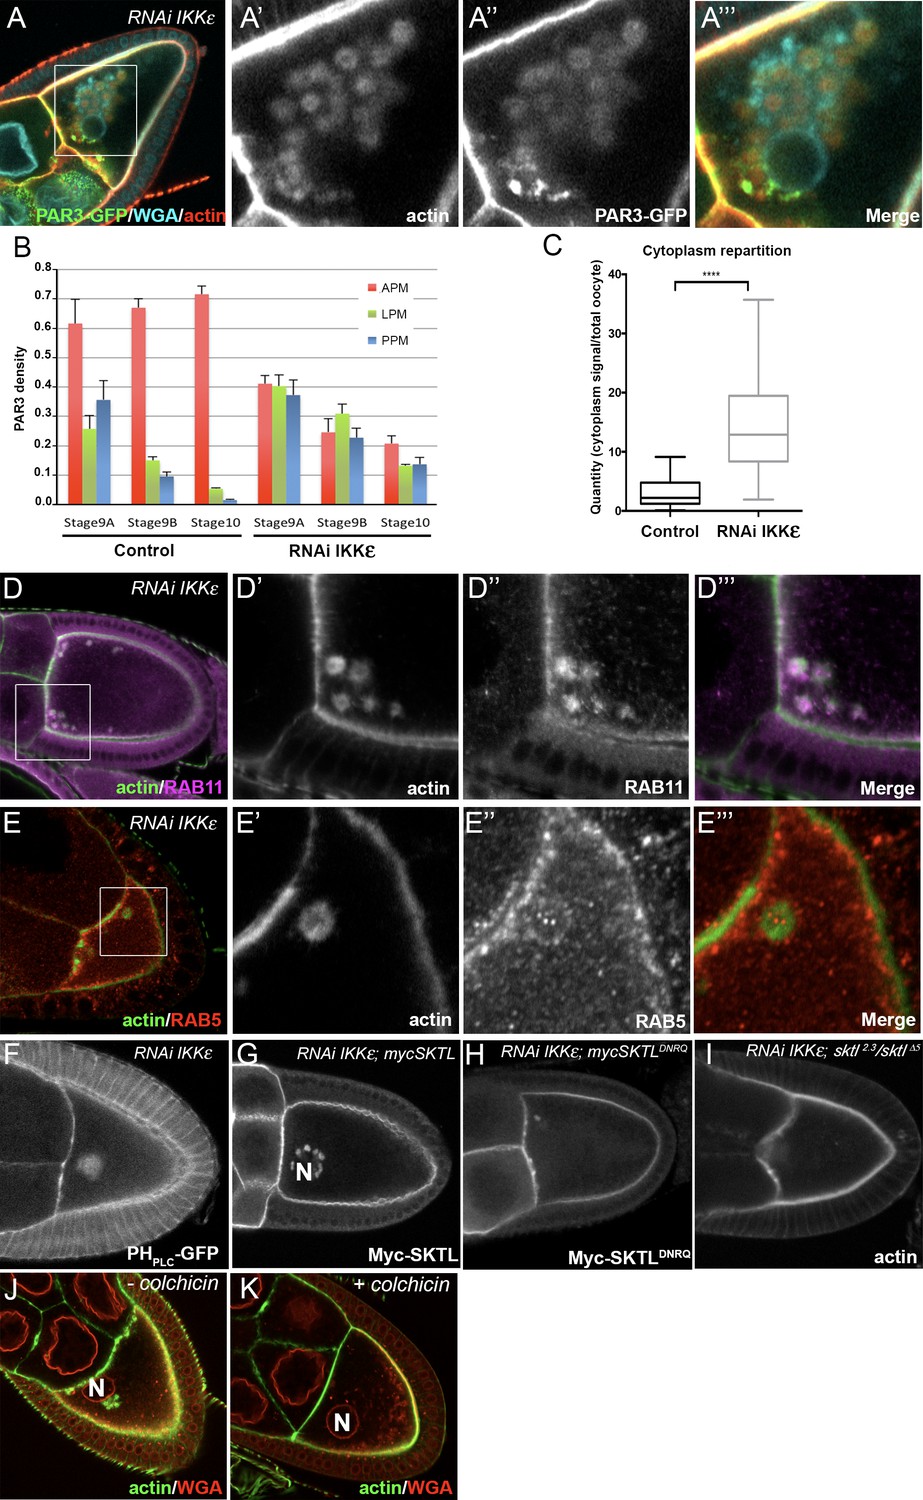
IKKε regulates PAR3 microtubule unloading and APM accumulation.
(A–C) Distribution of PAR3 in response to IKKε knockdown. (A) IKKε knockdown affects the localisation of PAR3 and leads to an accumulation of circular actin clumps (ACs) enriched in PAR3. (B) Quantification of PAR3 density at each plasma membrane domain from stage 9A to stage 10 oocytes in WT or IKKε knockdown contexts (Tub67c-GAL4; UASp RNAi ikkε; UASp PAR3-GFP). (C) Quantification of PAR3-GFP distribution in the cytoplasm related to the whole oocyte intensity at stage 9B in WT or in IKKε knockdown contexts. For (B, C), Control (stage 9A, n = 9; stage 9B, n = 15; stage 10, n = 14); RNAi IKKε (stage 9A, n = 15; stage 9B, n = 10; stage 10, n = 9). (C) Mann-Whitney test. Error bars indicate SEM. **** indicates p<0.0001. (D, E) Actin clumps (D’, E’, green) contain RAB11 (magenta, D’’), but no RAB5 (E’’, red) is around these actin clumps. Actin is visualised after staining with phalloidin. (D’–D’’’) and (E’–E’’’), are magnifications of D and E (white frame). (F, G) In an IKKε knockdown oocyte, ACs contain PI(4,5)P2, visualised with PHPLC GFP probe, (F) and Myc-SKTL, visualised with Myc tag (G). (H, I) PI(4,5)P2 or SKTL are involved in formation of the ACs. ACs are reduced in SKTLDNRQ context (H) and disappearin sktl2.3/sktl∆5 context (I). (J, K) MTs are necessary for actin ring formation. Flies were nourished with colchicin for 24 h (K) or only yeast paste (J). Actin (green) is visualised after staining with phalloidin and the nuclear membranes after staining with WGA (red). The oocyte nucleus position is indicated by an ‘N’ in (G), (J), and (K).
-
Figure 9—source data 1
Quantification of PAR3 density at each plasma membrane domain in IKKe knockdown at stage 9B oocytes (Panel B).
- https://doi.org/10.7554/eLife.40212.047
-
Figure 9—source data 2
Quantification of PAR3 proportion in the cytoplasm related to the whole oocyte intensity in IKKe knockdown context.
(panel C).
- https://doi.org/10.7554/eLife.40212.048
Figure 9—figure supplement 1
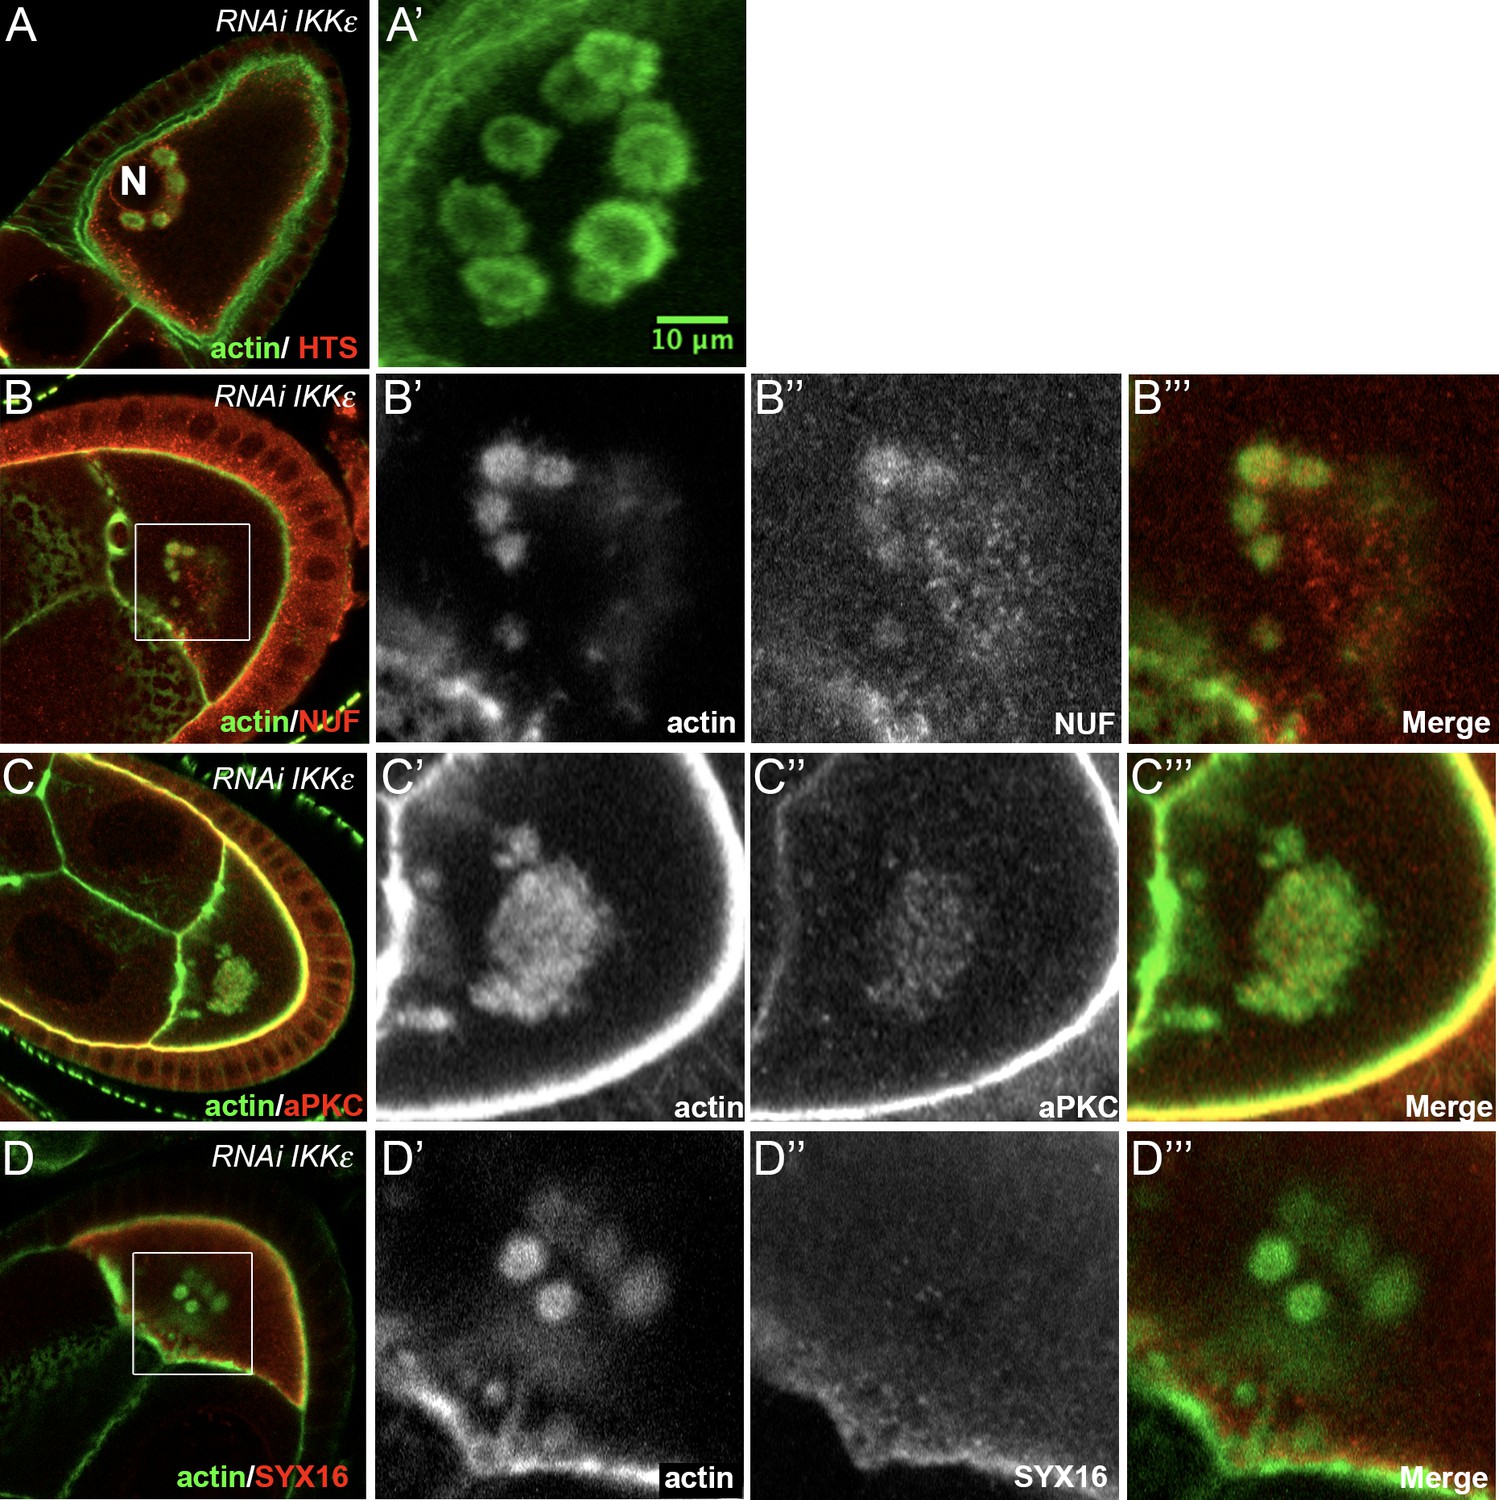
Effect of IKKε knockdown.
(A) In an IKKε knockdown oocyte, ACs (A, A’ green) are accumulated around the nucleus (red). The oocyte nucleus position is indicated by an ‘N’ in A. (A’) is a magnification of the oocyte presented in (A) and represents five Z-plans (13.5 µm of depth). (B–D) ACs (B’, C’, D’ green) contain NUF (B’’, red), aPKC (C’’, red) but not SYX16 (D’’, red). Actin is visualised after staining with phalloidin. (B’–B’’’) and (C’–C’’’), (D’–D’’’) are magnifications of B, C, and D (white frame).
Figure 9—figure supplement 2
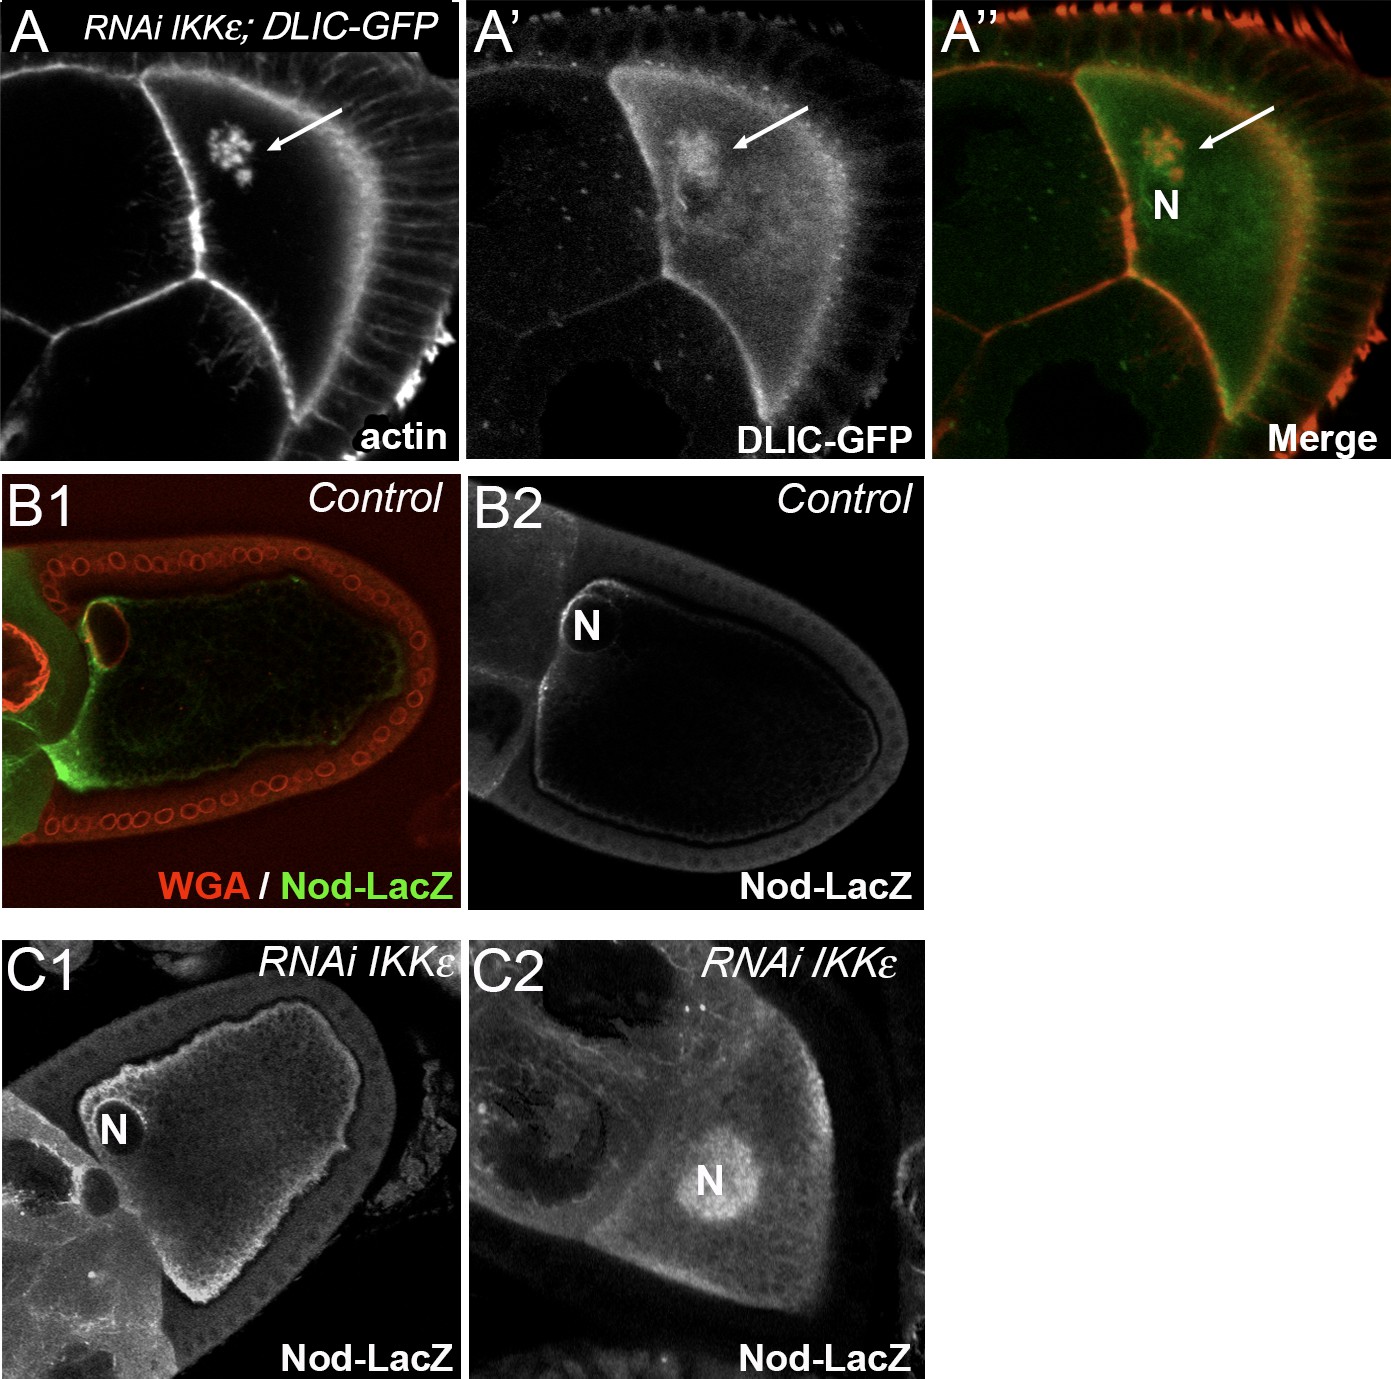
Alteration of microtubule network in IKKε knockdown.
(A) Dynein is trapped in ACs. Dynein is visualised thanks to DLIC-GFP transgene (green) and actin (red) is visualised after staining with phalloidin. (B–C) Effect of IKKε on MT minus ends. MTs minus ends are visualised with the transgene UASp Nod-LacZ after staining with anti-β-galactosidase. In a wild-type oocyte, MT minus ends are localised around the nucleus and surround the nucleus at the plasma membrane. (B1) and (B2) are two independent examples of this staining. In an IKKε knockdown oocyte, MT minus ends are isotropically localised at the plasma membrane, around the nucleus (C1) and in the clumps around the nucleus (C2). (C1) and (C2) are two independent examples of this staining. ‘N’ indicates the oocyte nucleus position.
-
Figure 9—figure supplement 2—source data 1
Quantification of PAR3 in the cytoplasm related to the whole oocyte intensity in IKKe knockdown context.
(panel C).
- https://doi.org/10.7554/eLife.40212.046
Figure 10
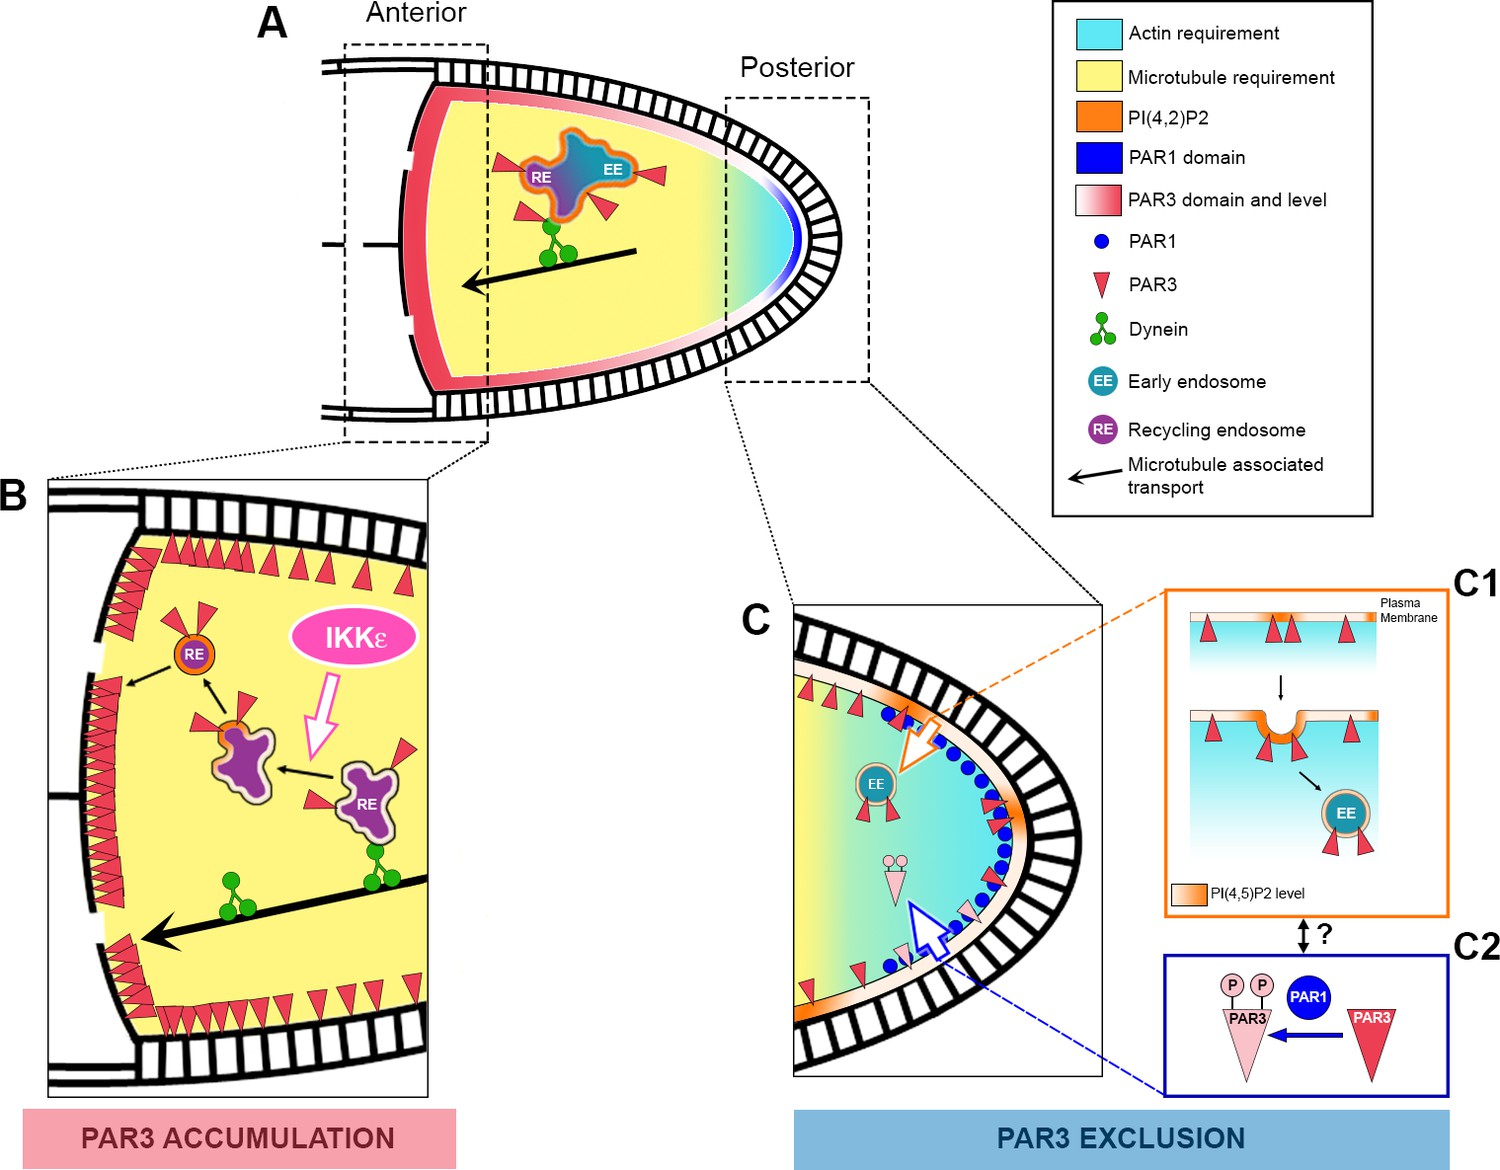
Speculative model of PAR3 localisation regulation.
(A) In Drosophila oocytes, PAR3 asymmetrical localisation proceeds in at least two steps. The first step (C) occurs at the posterior plasma membrane and leads to the PAR3 exclusion starting from stage 9B. This step implicates PAR3 phosphorylation by PAR1 (C2) and RAB5-dependent endocytosis (C1). PIP5K, SKTL, and its product PI(4,5)P2 (orange) are crucial for this process, as well as the actin cytoskeleton (blue gradient). As PIP(4,5)P2 is critical for the endocytosis onset but also for actin cytoskeleton regulation, the link between all these protagonists remains hypothetical. Furthermore, as the polarised localisation of PAR1 depends on actin, we cannot exclude a role for PAR1 on endocytosis directly or indirectly by PAR3 phosphorylation. The second step (B) takes place at the anterior cortex where PAR3 has to be strongly enriched. Dynein-dependent transport brings PAR3 to the MT minus ends likely with recycling endosomal cargo (RE). Then PAR3 cargo would be released from the dynein through an IKKε-dependent process. However, how PAR3 reaches the cortex is unknown. PI(4,5)P2 is also important for the PAR3 endosomal sorting and we can speculate that an association with vesicles is required for anterior cortex targeting. Finally, while we have shown that the posterior fraction of PAR3 provides, through MTs, the anterior pool of PAR3, the neo-synthesized fraction of PAR3 from the nurse cell could also contribute to the anterior pool. As the MT network presents only a slight bias of minus end directed transport in the oocyte, it is thus possible that PAR3 is transported step by step along the lateral cortex before reaching the anterior membrane.
Author response image 1
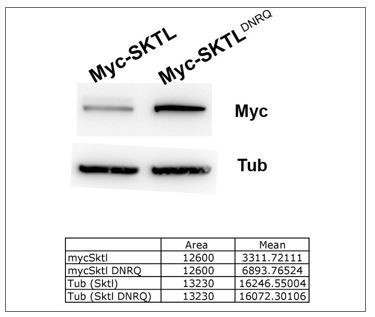
Our results show that the mutant form is more stable than wild type.
Thus, the absences of effect of DNRQ form cannot be explain by protein instability.
Author response image 2
Author response image 3
Videos
Video 1
Recovery of fluorescence after photobleaching of PAR3 at the APM domain.
Representative FRAP experiment on PAR3-GFP (Tub67c-GAL4; UASp PAR3-GFP) in Drosophila egg chamber.
Additional files
-
Source code 1
Oocyte analysis source code.
- https://doi.org/10.7554/eLife.40212.050
-
Transparent reporting form
- https://doi.org/10.7554/eLife.40212.051
Download links
A two-part list of links to download the article, or parts of the article, in various formats.
Downloads (link to download the article as PDF)
Open citations (links to open the citations from this article in various online reference manager services)
Cite this article (links to download the citations from this article in formats compatible with various reference manager tools)
Dynein-mediated transport and membrane trafficking control PAR3 polarised distribution
eLife 8:e40212.
https://doi.org/10.7554/eLife.40212


