Conserved and divergent development of brainstem vestibular and auditory nuclei
- King’s College London, United Kingdom
Figures
Figure 1
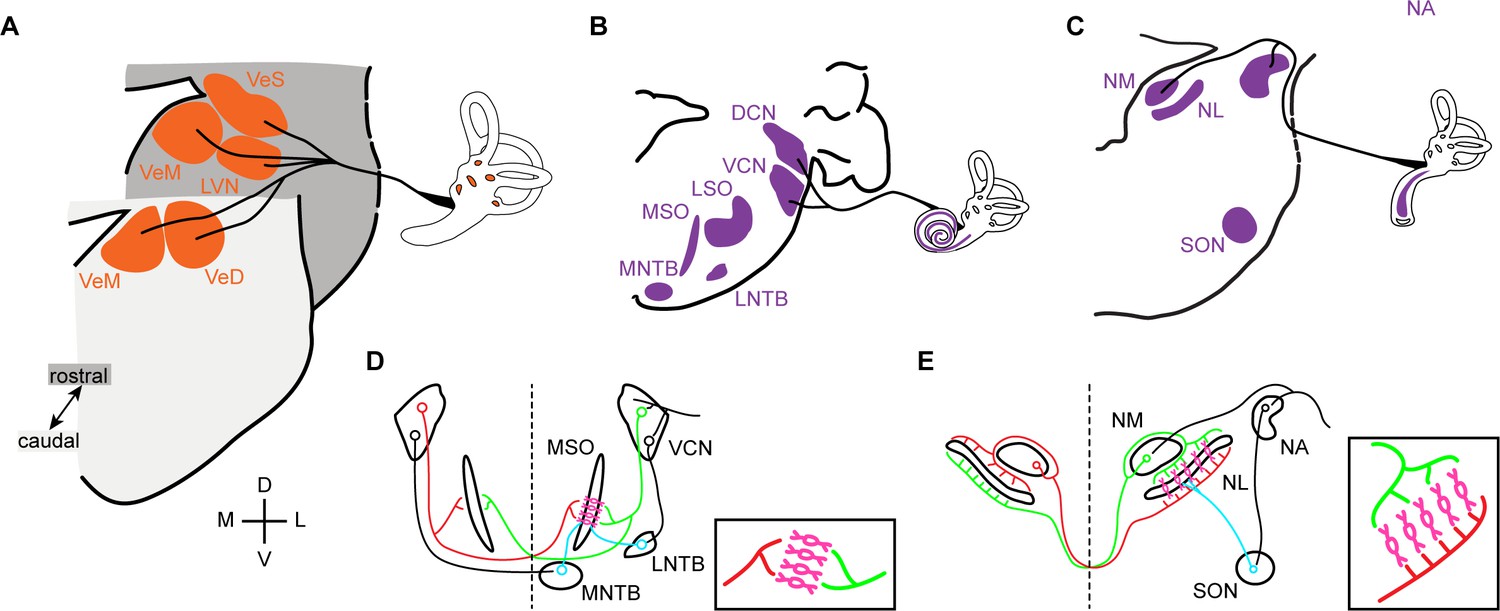
Vestibular and auditory brainstem nuclei of mammals and birds.
(A) Schematic diagrams of hindbrain coronal sections showing the four main vestibular nuclei of vertebrates that receive direct input form the VIIIth (vestibular) nerve. VeS, Superior Vestibular Nucleus; LVN, Lateral Vestibular Nucleus (Deiter’s Nucleus); VeM, Medial Vestibular Nucleus; VeD, Descending Vestibular Nucleus (Spinal or Inferior Vestibular Nucleus). D, dorsal; V, ventral; M, medial; L, lateral. (B-C) Schematic diagrams of hindbrain coronal sections depicting the mammalian (B) and avian (C) hindbrain first order auditory nuclei that receive direct input from the VIIIth (auditory) nerve and the main second order nuclei to which they project. DCN, Dorsal Cochlear Nucleus; VCN, Ventral Cochlear Nucleus; LSO, Lateral Superior Olive; MSO, Medial Superior Olive; MNTB, Medial Nucleus of the Trapezoid Body; LNTB, Lateral Nucleus of the Trapezoid Body; NA, Nucleus Angularis; NM, Nucleus Magnocellularis; NL, Nucleus Laminaris; SON, Superior Olivary Nucleus. (D-E) Schematic representation of the main connections of the mammalian (D) and avian (E) ITD circuits. Insets. Close-up view of the coincidence detection neurons showing the arrangement of ipsilateral and contralateral connections. Bilateral projection neurons, red and green. Coincidence detection neurons, magenta. Inhibitory neurons, cyan. Auditory nerve inputs and inhibitory connections are drawn only on the right side for simplicity.
Figure 2
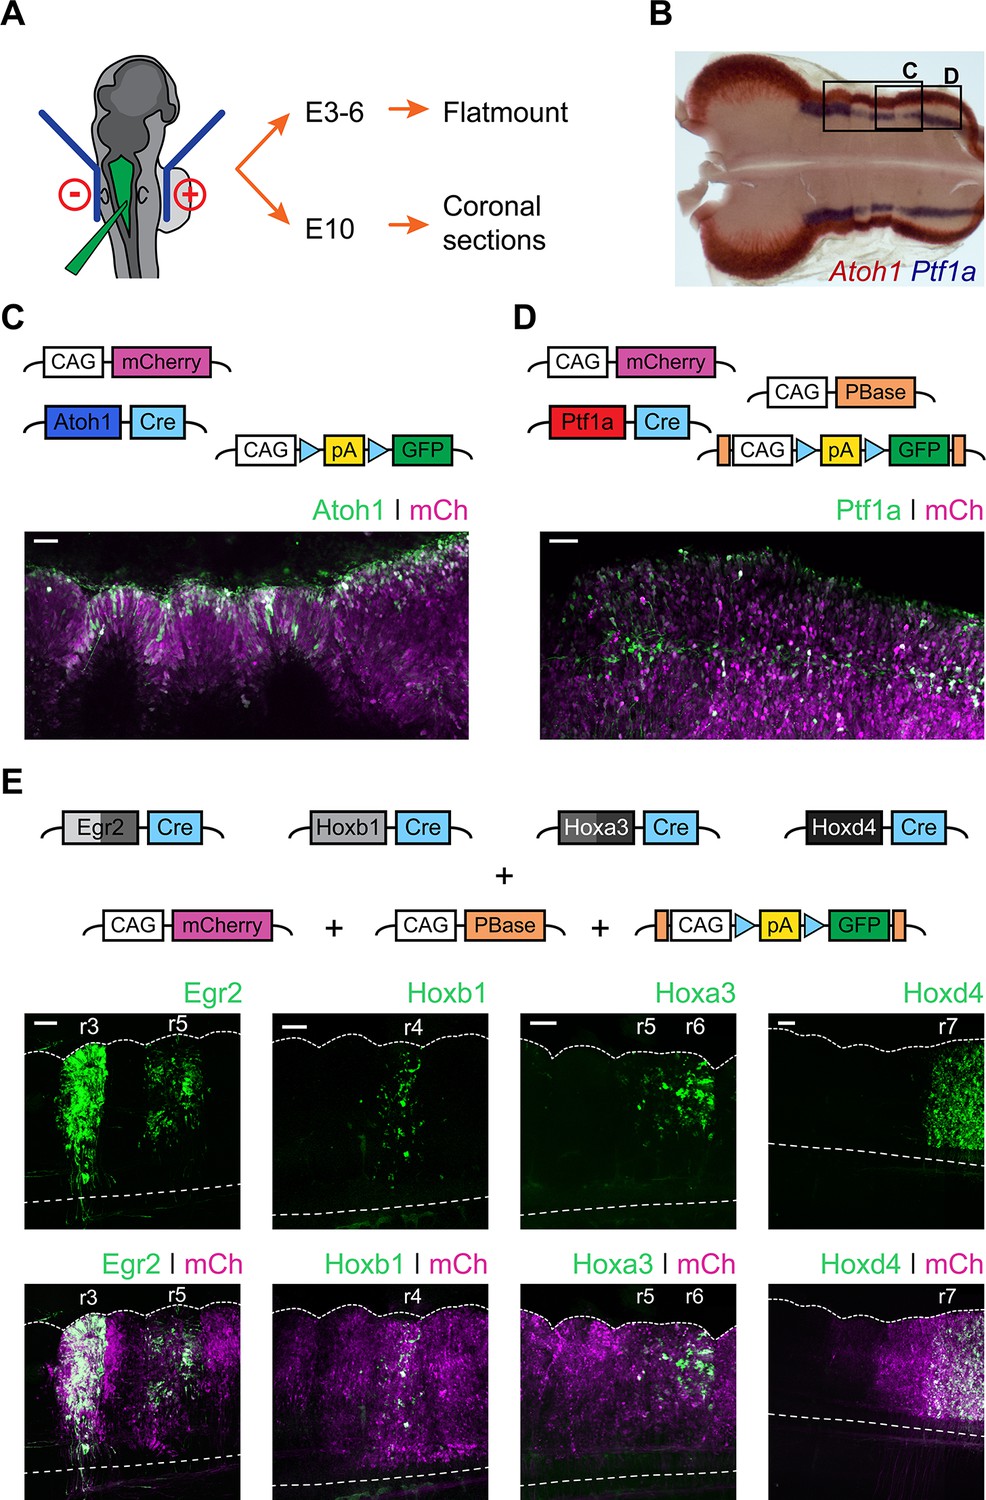
Fate mapping the developmental origin of hindbrain auditory and vestibular nuclei.
(A) Diagram of the electroporation strategy. (B) Representative flatmount view of a HH21 chick hindbrain stained by in situ hybridisation for Atoh1 (red) and Ptf1a (blue). (C-D) Top panels. Plasmid constructs employed for labelling Atoh1+ (C) and Ptf1a+ (D) progenitors. Bottom panels. Representative close up flatmount image of HH17 chick hindbrains, electroporated at HH14 with Atoh1-Cre + CAG-Flox-pA-GFP + CAG-mCherry (C) or Ptf1a-Cre + CAG-PBase + Pb-CAG-Flox-pA-GFP + CAG-mCherry (D). Scale bar: 50 µm. (E) Top panels. Plasmid constructs employed for labelling cells arising from specific rhombomeres. Bottom panels. Representative close up flatmount images of HH17 (HH28 for Hoxd4) chick hindbrains, electroporated at HH14 with CAG-PBase +Pb-CAG-Flox-pA-GFP + CAG-mCherry and Egr2-Cre, Hoxb1-Cre, Hoxa3-Cre or Hoxd4-Cre, from left to right, respectively. Dotted lines outline the lateral border and the ventral midline. Scale bar: 100 µm.
Figure 3
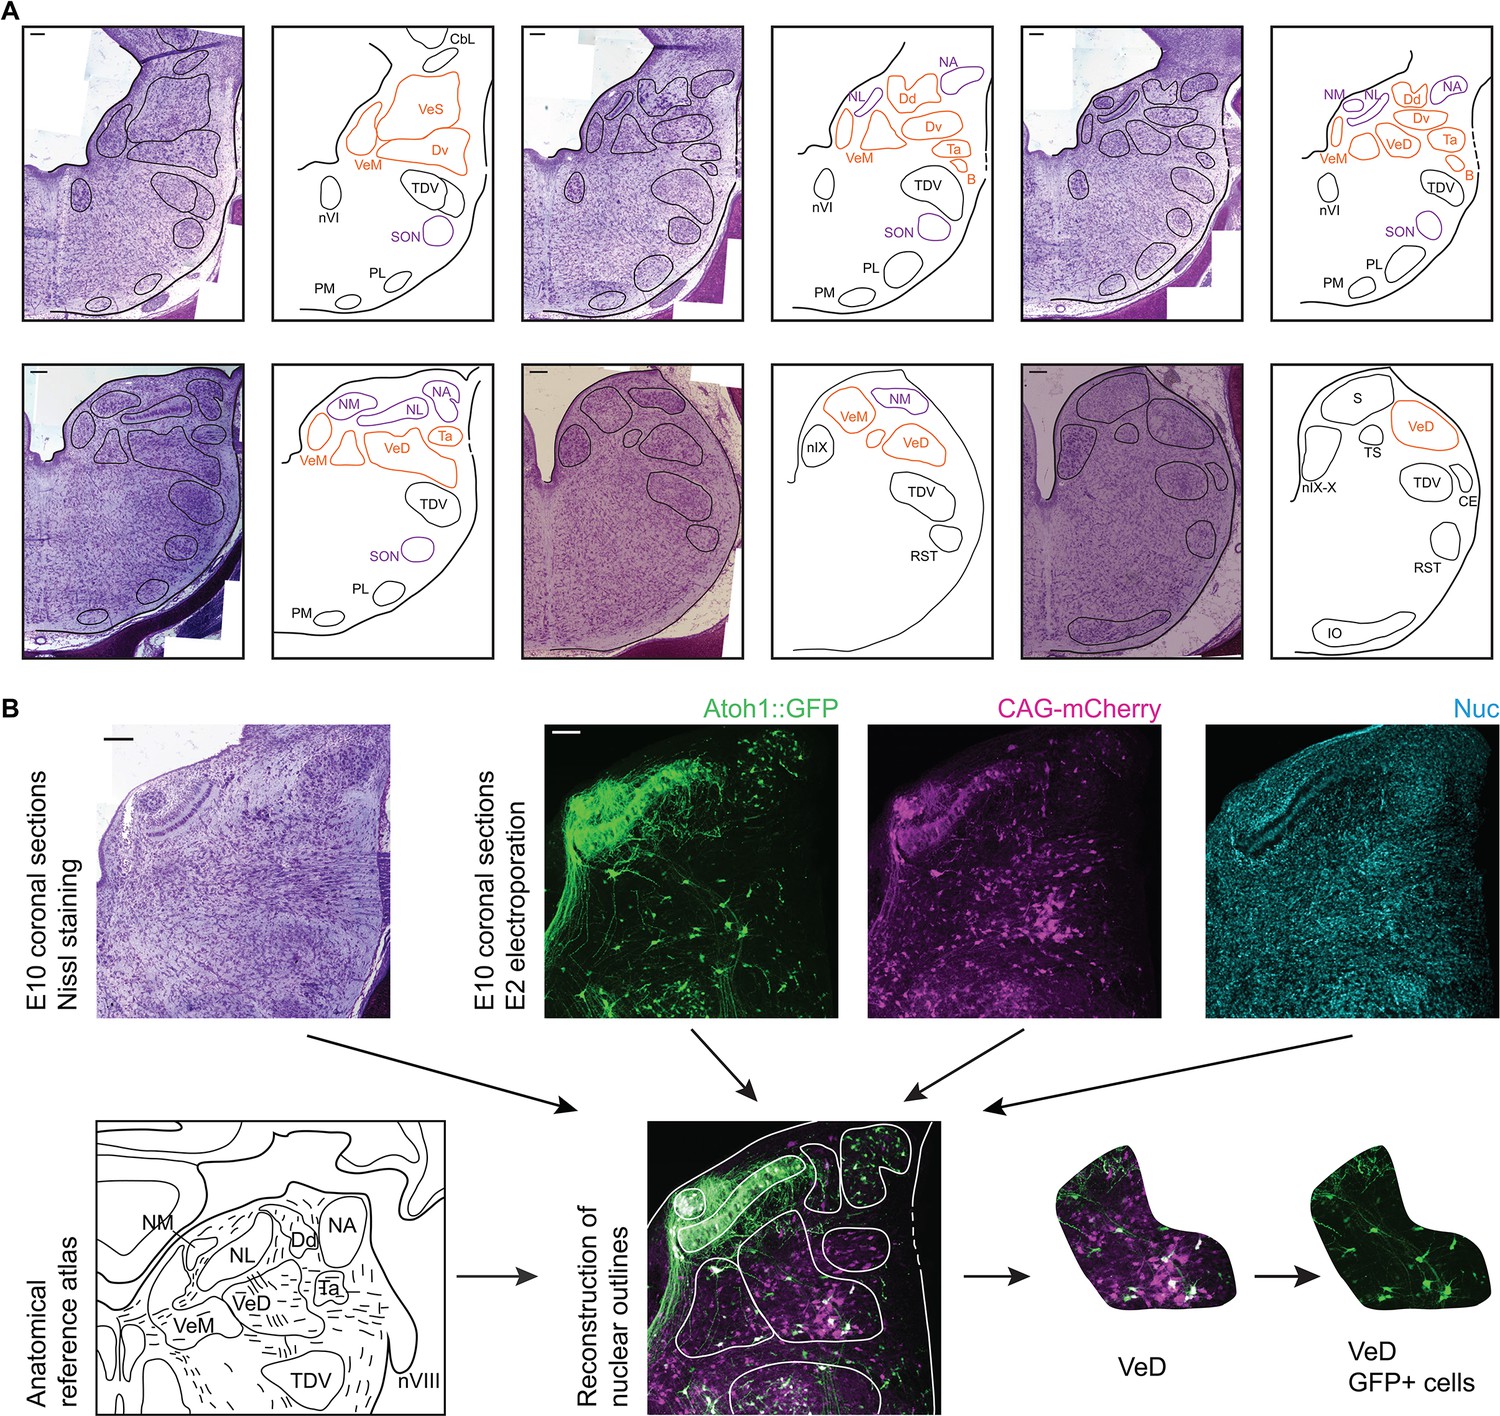
Anatomy of hindbrain auditory and vestibular nuclei.
(A) Representative images of coronal sections of Nissl stained E10 chick hindbrain (left panels) and diagrams (right panels), showing the outlines of hindbrain nuclei. From left to right and top to bottom: rostral to caudal. Scale bars: 50 µm. All drawings are to scale. B, Cell group B; Cbl, Nucleus Cerebellaris Internus; CE, Nucleus Cuneatus Externus; Dd, Nucleus Deiters Dorsalis; Dv, Nucleus Deiters Ventralis; IO, Inferior Olive Nucleus; NA, Nucleus Angularis; nIX, Glossopharyngeal Nucleus; nIX-X, Glossopharyngei and Vagus Nucleus; NL, Nucleus Laminaris; NM, Nucleus Magnocellularis; nVI, Abducens Nucleus; PL, Lateral Pontine Nucleus; PM, Medial Pontine Nucleus; RST, Reticular Subtrigeminal Nucleus; S, Solitaris Nucleus; SON, Superior Olivary Nucleus; Ta, Tangential Nucleus; TDV, Descending Trigeminal Nucleus; TS, Torus Semicircularis; VeD, Descending Vestibular Nucleus; VeM, Medial Vestibular Nucleus; VeS, Superior Vestibular Nucleus. (B) Example of a nucleus identification by combining information from Nissl stained sections (top left), fluorescent protein expression and nuclear staining (top right) and anatomical reference atlases (bottom left, modified from (Kuenzel and Masson, 1988; Wold, 1976)).
Figure 4
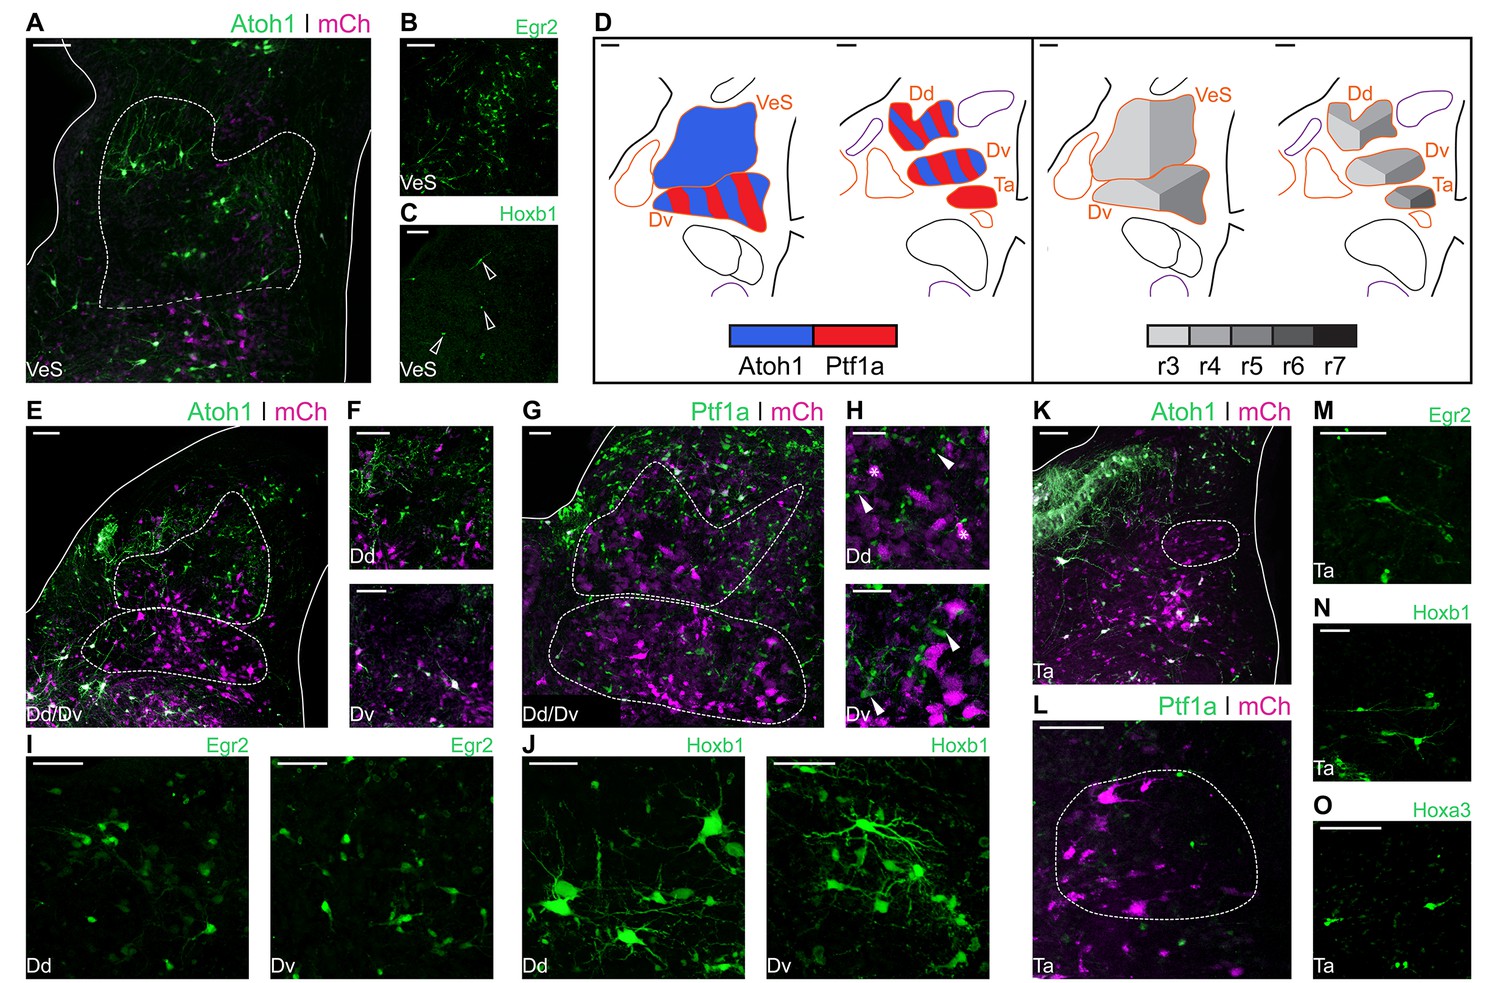
Developmental origin of avian Superior, Deiters and Tangential vestibular nuclei.
(A) Close up view of the VeS from an E10 chick hindbrain coronal section electroporated at HH14 with Atoh1::GFP and CAG-mCherry. Solid lines, hindbrain borders. Dotted lines, VeS borders. Scale bar: 100 µm. (B-C) Close up view of the VeS from an E10 chick hindbrain coronal section electroporated at HH14 with Egr2::GFP (B) or Hoxb1::GFP (C). Scale bars: 100 µm. (D) Diagrams summarising the contributions of Atoh1+/Ptf1a+ progenitors (left panel) or different rhombomeres (right panel) to the superior, deiters and tangential vestibular nuclei. Scale bars: 50 µm. (E) Close up view of the Dd and Dv from an E10 chick hindbrain coronal section electroporated at HH14 with Atoh1::GFP and CAG-mCherry. Solid lines, hindbrain borders. Dotted lines, Dd and Dv borders. Scale bar: 100 µm. (F) Detailed view of Atoh1+ cells in the Dd (top panel) and the Dv (bottom panel). Scale bars: 100 µm. (G) Close up view of the Dd and Dv from an E10 chick hindbrain coronal section electroporated at HH14 with Ptf1a::GFP and CAG-mCherry. Solid line, hindbrain borders. Dotted lines, Dd and Dv borders. Scale bar: 50 µm. (H) Detailed view of Ptf1a+ cells in the Dd (top panel) and the Dv (bottom panel). Scale bars: 50 µm. (I-J) Detailed view of Egr2+ (I) and Hoxb1+ (J) cells in the Dd (left panel) and the Dv (right panel). Scale bars: 50 µm. (K) Close up view of the Ta from an E10 chick hindbrain coronal section electroporated at HH14 with Atoh1::GFP and CAG-mCherry. Solid lines, hindbrain borders. Dotted line, Ta borders. Scale bar: 100 µm. (L) Close up view of the Ta from an E10 chick hindbrain coronal section electroporated at HH14 with Ptf1a::GFP and CAG-mCherry. Scale bar: 100 µm. (M-O) Detailed view of Egr2+ (M), Hoxb1+ (N), Hoxa3+ (O) cells in the Ta. Scale bars: 50, 100 and 100 µm, respectively.
Figure 5
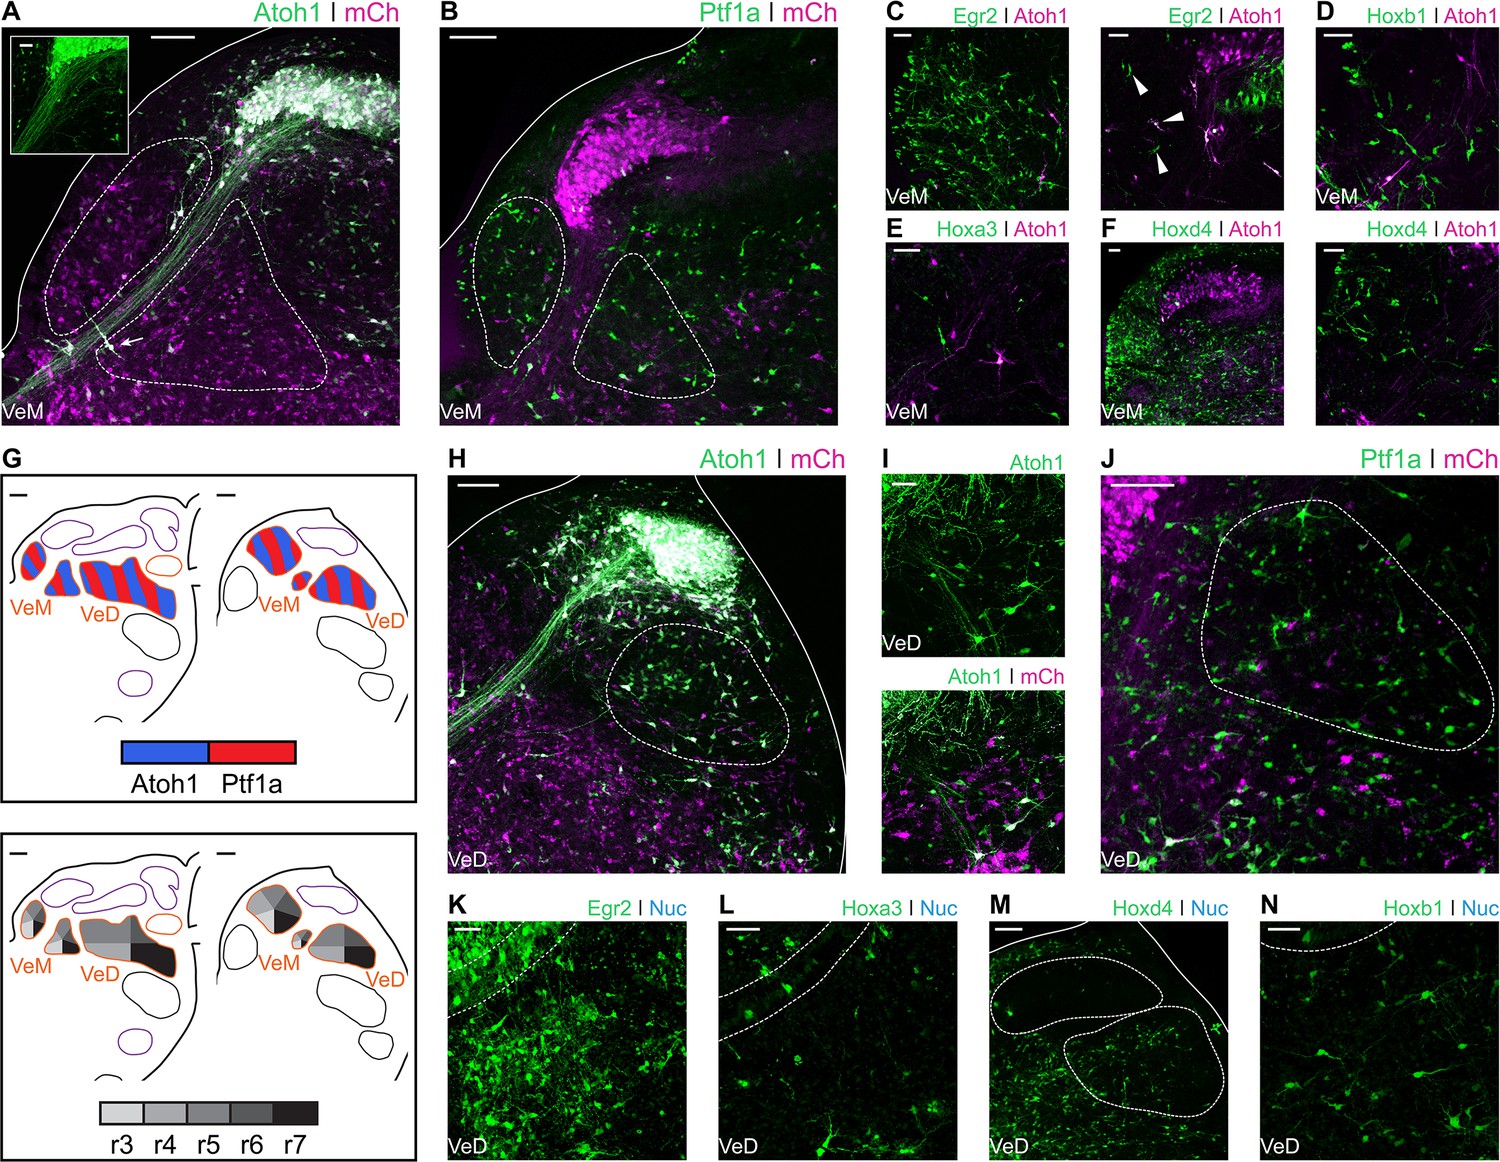
Developmental origin of avian Medial and Descending vestibular nuclei.
(A) Close up view of the VeM from an E10 chick hindbrain coronal section electroporated at HH14 with Atoh1::GFP and CAG-mCherry. Scale bar: 100 µm. Inset: detailed view of VeM Atoh1+ cells. Solid line, hindbrain border. Dotted lines, VeM borders. Scale bar: 50 µm. (B) Close up view of the VeM from an E10 chick hindbrain coronal section electroporated at HH14 with Ptf1a::GFP and CAG-mCherry. Solid line, hindbrain border. Dotted lines, VeM borders. Scale bar: 100 µm. (C-F) Close up view of the VeM from E10 chick hindbrain coronal sections electroporated at HH14 with Atoh1-Gal4 + UAStdT and Egr2::GFP (C. left panel, rostral. Right panel, caudal), Hoxb1::GFP (D), Hoxa3::GFP (E) or Hoxd4::GFP (F left panel, rostral. Right panel, caudal). Scale bars: 50 µm. (G) Diagrams summarising the contributions of Atoh1+/Ptf1a+ progenitors (left panel) or different rhombomeres (right panel) to the medial and descending vestibular nuclei. Scale bars: 50 µm. (H) Close up view of the VeD from an E10 chick hindbrain coronal section electroporated at HH14 with Atoh1::GFP and CAG-mCherry. Scale bar: 100 µm. (I) Detailed view of Atoh1+ cells in the rostral VeD. Solid lines, hindbrain border. Dotted line, VeD border. Scale bar: 50 um. (J) Close up view of the VeD from an E10 chick hindbrain coronal section electroporated at HH14 with Ptf1a::GFP and CAG-mCherry. Dotted line, VeD border. Scale bar: 100 µm. (K-N) Close up view of the VeD from E10 chick hindbrain coronal sections electroporated at HH14 with Egr2::GFP (K), Hoxa3::GFP (L), Hoxd4::GFP (M) or Hoxb1::GFP (N). Solid lines, hindbrain border (M). Dotted lines, NL borders (K, L and N), NM and VeD borders (M). Scale bars: 50 µm.
Figure 6

Developmental origin of chick first order hindbrain auditory nuclei.
(A) Representative image of an E10 chick hindbrain coronal section electroporated at HH14 with Atoh1-Cre + CAG-Flox-pA-GFP (Atoh1::GFP) and CAG-mCherry. Scale bar: 100 µm. (B) Close up view of the NM from a section caudal to the one shown in A. Solid line, hindbrain border. Scale bar: 50 µm. (C) Close up view of Atoh1+ NM projections to the contralateral NL. Scale bar: 50 µm. (D) Close up view of the caudal NM showing a diffuse boundary with the VeD. Dotted line shows NM border. Arrows show VeD projections that join the contralateral NM axons. Scale bar: 50 µm. (E) Close up view of the NM from an E10 chick hindbrain coronal section electroporated at HH14 with Ptf1a-Cre, PBase, Pb-CAG-Flox-pA-GFP (Ptf1a::GFP) and CAG-mCherry. Dotted line shows NM border. Scale bar: 50 µm. (F-I) Close up view of the NM from E10 chick hindbrain coronal sections electroporated at HH14 with CAG-PBase + Pb-CAG-Flox-pA-GFP + Atoh1-Gal4 + UAS-tdT (Atoh1::tdT) and Egr2-Cre (F), Hoxa3-Cre (G), Hoxb1-Cre (H) or Hoxd4-Cre (I). Scale bars: 50 µm. Arrows point to Egr2+/Atoh1+ (F), Hoxa3+/Atoh1+ (G) and Hoxd4+/Atoh1+ (I) cells. (J) Close up view of the NM from an E10 chick hindbrain coronal section electroporated at HH14 with Hoxd4-Cre + Atoh1-FLPo + CAG-Flox-FLp-pA-GFP + CAG-mCherry. Dotted line shows NM border. Scale bar: 50 µm. (K) Diagrams summarising the contributions of Atoh1+/Ptf1a+ progenitors (left panel) or different rhombomeres (right panel) to the first order auditory nuclei. Scale bars: 50 µm. (L) Close up view of the NA from an E10 chick hindbrain coronal section electroporated at HH14 with Atoh1::GFP and CAG-mCherry. Solid lines, hindbrain borders. Scale bar: 50 µm. (M) Close up views of representative vertical (top-left panel), planar (top-right panel) and radial (bottom panel) NA Atoh1+ cells. Scale bars: 25 µm. (N) Close up view of representative stubby NA Ptf1a+ cells. Scale bar: 20 µm. (O) Close up views of representative vertical, (left panel), planar (middle panel) and radial (right panel) NA Egr2+ cells. Scale bars: 20 µm. (P) Close up views of representative vertical and stubby, (left panel), planar (middle panel) and radial (right panel) NA Hoxb1+ cells. Scale bars: 20 µm.
Figure 7

Developmental origin of avian second order hindbrain auditory nuclei.
(A) Close up view of the NL from an E10 chick hindbrain coronal section electroporated at HH14 with Atoh1::GFP and CAG-mCherry. Solid line, dorsal border of the hindbrain. Dotted line, NL border. Yellow dotted square, approximate location of inset image. Scale bar: 50 µm. Inset: detailed view of Atoh1+ NL cells depicting bipolar morphology. Scale bar: 20 µm. (B-D) Close up view of the NL from E10 chick hindbrain coronal sections electroporated at HH14 with Egr2::GFP (B), Hoxb1::GFP (C), Hoxa3::GFP (D) and counterstained with NucRed. Dotted lines show NL borders. Scale bars: 50 µm. (E) Diagrams summarising the contributions of Atoh1+/Ptf1a+ progenitors (top panel) or different rhombomeres (bottom panel) to the second order auditory nuclei. Scale bars: 50 µm. (F) Close up view of the SON from an E10 chick hindbrain coronal section electroporated at HH14 with Atoh1::GFP and CAG-mCherry. Solid lines, hindbrain borders. Dotted line, SON border. Yellow dotted square, approximate location of inset image. Scale bar: 100 µm. Inset: detailed view of Atoh1+ SON. Scale bar: 50 µm. (G) Close up view of the SON from an E10 chick hindbrain coronal section electroporated at HH14 with Ptf1a::GFP and CAG-mCherry. Dotted line shows SON border. Scale bar: 100 µm. (H) Close up view of the SON from an E10 chick hindbrain coronal section electroporated at HH14 with Egr2::GFP and counterstained with NucRed. Dotted line shows SON border. Scale bar: 50 µm. (I) Close up view of the SON from an E10 chick hindbrain coronal section electroporated at HH14 with Egr2::GFP and Atoh1::tdT. Filled arrowheads show Egr2+/Atoh1+ cells; empty arrowheads show Egr2+/Atoh1- cells; asterisks show Egr2-/Atoh1+ cells. Scale bar: 50 µm. (J-K. Close up view of the SON from E10 chick hindbrain coronal sections electroporated at HH14 with Hoxb1::GFP (J) or Hoxa3::GFP (K) and counterstained with NucRed. Dotted lines show SON borders. Scale bars: 50 µm.
Figure 8
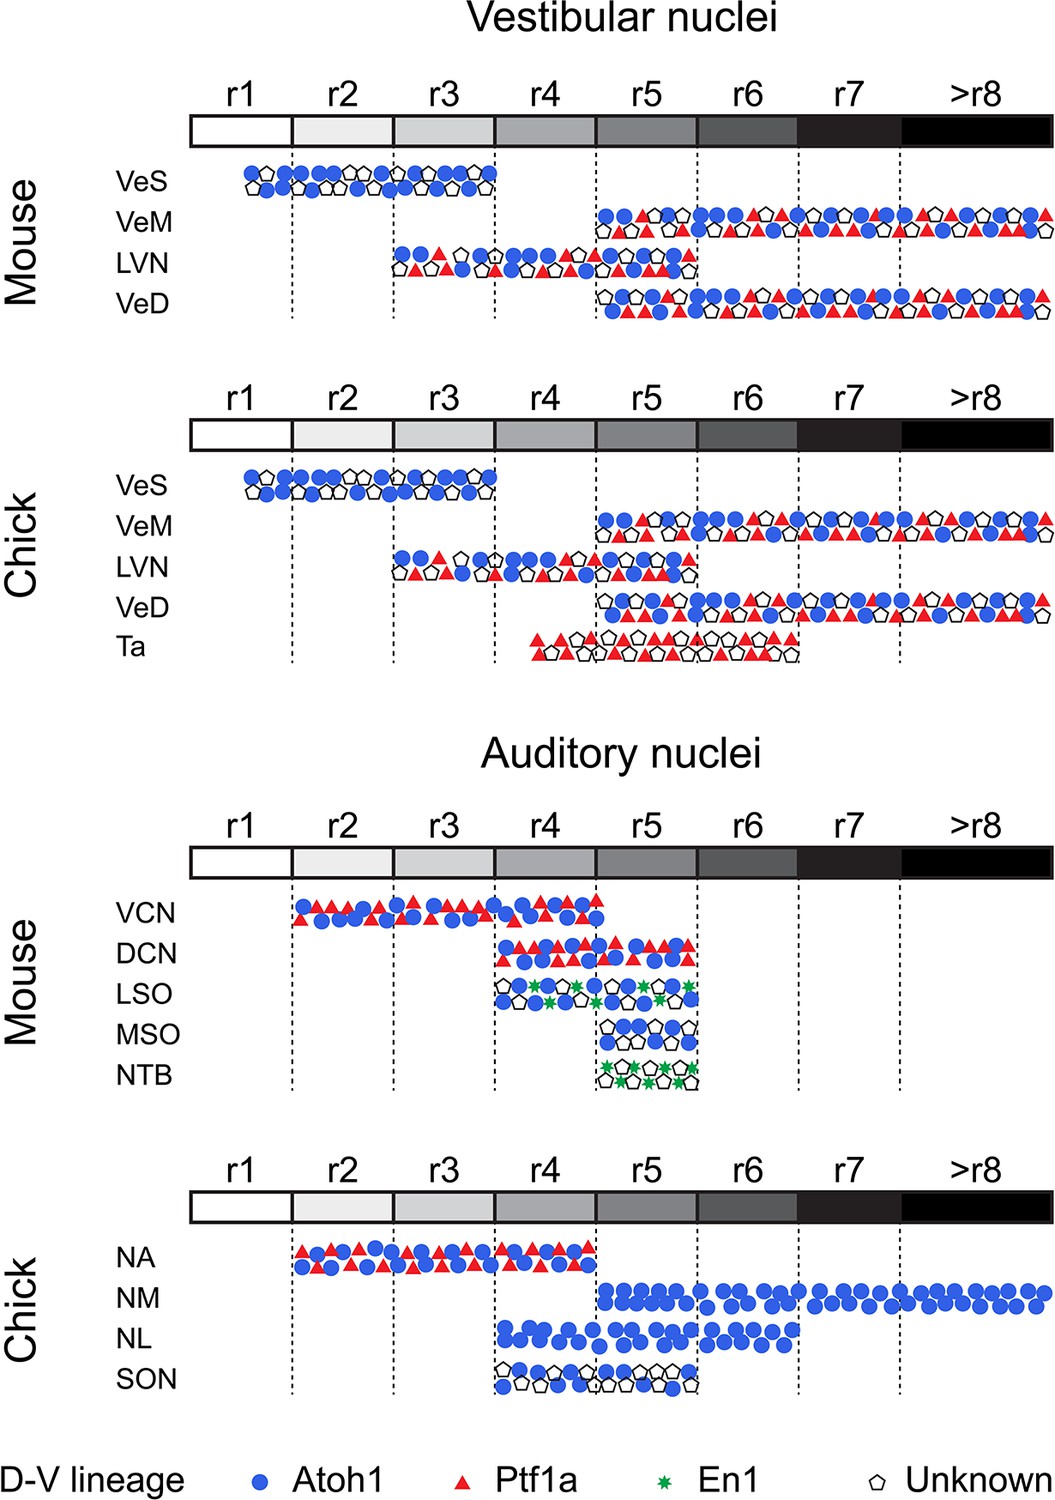
Comparative developmental origin of mammalian and avian vestibular and auditory hindbrain nuclei.
Schematic diagram showing the lineage origin of cells in the auditory and vestibular nuclei (blue circles, Atoh1; red triangles, Ptf1a; green stars, En-1; empty pentagons, unknown), alongside their rhombomeric origin (left to right, r1 to >r8, white to black grey scale). Chick mapping data, this work and (Cambronero and Puelles, 2000; Cramer et al., 2000; Marín et al., 2008; Marín and Puelles, 1995). Mouse mapping data from (Altieri et al., 2015; Chen et al., 2012; Di Bonito et al., 2015; Di Bonito et al., 2013; Di Bonito and Studer, 2017; Di Bonito et al., 2017; Farago et al., 2006; Fujiyama et al., 2009; Maricich et al., 2009; Marrs et al., 2013; Marrs and Spirou, 2012; Pasqualetti et al., 2007; Rose et al., 2009; Wang et al., 2005; Yamada et al., 2007). An r3 contribution to nuclei of the superior olivary complex cannot at present be completely ruled out.
Tables
Key resources table
| Reagent type (species) or resource | Designation | Source or reference | Identifiers | Additional information |
|---|---|---|---|---|
| Recombinant DNA reagent | CAG-mCherry | Dr.Murakami (Osaka University) | ||
| Recombinant DNA reagent | Atoh1-Cre | DOI: 10.1523/JNEUROSCI.4231–11.2012 | Avihu Klar, Hebrew University Medical School | |
| Recombinant DNA reagent | Atoh1-Gal4 | this paper | Atoh1 enhancer from Atoh1-Cre subcloned upstream of Gal4 coding sequence (Martin Meyer, King's College London) - Primers in Table 1 | |
| Recombinant DNA reagent | Atoh1-FLPo | this paper | Atoh1 enhancer from Atoh1-Cre subcloned upstream of FLPo recombinase coding sequence (Avihu Klar, Hebrew University Medical School) - Primers in Table 1 | |
| Recombinant DNA reagent | Ptf1a-Cre | this paper | Ptf1a short enhancer (Meredith et al., 2009) - DOI:10.1523/JNEUROSCI.2303–09.2009) was subcloned upstream of the Cre recombinase coding sequence replacing the Atoh1 enhancer in the Atoh1-Cre plasmid (Avihu Klar, Hebrew University Medical School) - Primers in Table 1 | |
| Recombinant DNA reagent | Egr2-Cre | this paper | Egr2 enhancer sequence (mm10 chr:67320405–67321006) described in Chomette et al., 2006 (doi:10.1242/dev.02289) was subcloned upstream of the Cre recombinase coding sequence replacing the Atoh1 enhancer in the Atoh1-Cre plasmid (Avihu Klar, Hebrew University Medical School) - Primers in Table 1 | |
| Recombinant DNA reagent | Hoxb1-Cre | this paper | Hoxb1 enhancer sequence (mm10 chr11:96365175–96365784) described in Ferretti et al., 2005 (doi:10.1128/MCB.25.19.8541–8552.2005) was subcloned upstream of the Cre recombinase coding sequence replacing the Atoh1 enhancer in the Atoh1-Cre plasmid (Avihu Klar, Hebrew University Medical School) - Primers in Table 1 | |
| Recombinant DNA reagent | Hoxa3-Cre | this paper | Hoxa3 enhancer sequence (mm10 chr6:52177190–52177795) described in Manzanares et al., 2001 (PMID: 9895323) was subcloned upstream of the Cre recombinase coding sequence replacing the Atoh1 enhancer in the Atoh1-Cre plasmid (Avihu Klar, Hebrew University Medical School) - Primers in Table 1 | |
| Recombinant DNA reagent | Hoxd4-Cre | this paper | Hoxd4 enhancer sequence (mm10 chr2:74729772–74731362) described in Morrison et al. (1997) (PMID: 9272954) was subcloned upstream of the Cre recombinase coding sequence replacing the Atoh1 enhancer in the Atoh1-Cre plasmid (Avihu Klar, Hebrew University Medical School) - Primers in Table 1 | |
| Recombinant DNA reagent | Pbase | Sanger Institute | ||
| Recombinant DNA reagent | pCAG-LoxP-pA-LoxP-EGFP | DOI: 10.1523/JNEUROSCI.4231–11.2012 | Avihu Klar, Hebrew University Medical School | |
| Recombinant DNA reagent | pCAG-FRT-pA-FRT-LoxP-pA-LoxP-EGFP | DOI: 10.1093/nar/gku750 | Avihu Klar, Hebrew University Medical School | |
| Recombinant DNA reagent | UAS-tdT | Martin Meyer (King's College London) | ||
| Recombinant DNA reagent | chick Atoh1 riboprobe | Wilson and Wingate, 2006 (doi:10.1016/j.ydbio.2006.05.028) | ||
| Recombinant DNA reagent | chick Ptf1a riboprobe | ChEST1028o4 | Green and Wingate, 2014 (doi:10.1242/dev.099119) | |
| Antibody | rabbit polyclonal anti-GFP | Invitrogen -ThermoFisher | Cat no. A11122 | IHC (1:500) |
| Antibody | Alexa 488-conjugated goat polyclonal anti-rabbit IgG | Molecular Probes - ThermoFisher | Cat no. A11034 | IHC (1:500) |
| Commercial assay or kit | Gibson Assembly kit | New England Biolabs | Cat no. E5510S |
Table 1
Restriction enzymes and sequences of the oligos used for cloning of expression constructs.
Uppercase, gene-specific portion. Lowercase, vector specific portion.
| Plasmid | PCR/digest | Restriction enzymes or primers sequences |
|---|---|---|
| Atoh1-Gal4 | Vector | NcoI + NotI digest of pBαtubGal4 vector |
| Insert PCR | ctccaccgcggtggcAGAGCTTCCACTTCACCTCTCTGAGTG | |
| On Atoh1-Cre vector | gtttcttcttgggcccGGGGAGCGGCGAGAGGCT | |
| Atoh1-FLPo | Vector | NcoI + NotI digest of CAG-FLPo vector |
| Insert PCR | agcagagcgcggcgcCTCCTGGGCAACGTGCTG | |
| On Atoh1-Cre vector | cctgaggagtgaattggcGAATTCCTCATCAGATCCGCC | |
| Ptf1a-Cre | Vector | NcoI + SacI digest of Atoh1-Cre vector |
| Insert PCR | gggcgaattggagctAGGATCGTCAGCCACAGAGTTCATGG | |
| On Ptf1a-GFP vector | ctgcagatatccagccCATGGCGCCGCGCTCTGC | |
| Egr2-Cre | Vector | SacI + XmaI digest of Atoh1-Cre vector |
| Insert PCR | gggcgaattggagctGGGTTGTGAATGGAGCCAG | |
| On mouse gDNA | attcctgcagcccggGCAAGCCGACCAAACTCC | |
| Hoxb1-Cre | Vector | SacI + XmaI digest of Atoh1-Cre vector |
| Insert PCR | gggcgaattggagctCTAGTCATCCTTTTGTCCC | |
| On mouse gDNA | attcctgcagcccggTCTTGCCCTACAACCTTTC | |
| Hoxa3-Cre | Vector | SacI + XmaI digest of Atoh1-Cre vector |
| Insert PCR | gggcgaattggagctATCAAATAGCAGCGAATCTTCG | |
| On mouse gDNA | attcctgcagcccggGGGACGTGTAGGAGGTGA | |
| Hoxd4-Cre | Vector | SacI + XmaI digest of Atoh1-Cre vector |
| Insert PCR | gggcgaattggagctCTAGAAGCCCACAGAAGTTG | |
| On mouse gDNA | attcctgcagcccggCTAGAGCAGGTTCCCAGATG |
Table 2
Summary of the plasmid combinations used, the structures labelled, the figures showing representative images of the labelling observed and the number of embryos analysed.
https://doi.org/10.7554/eLife.40232.011| Enhancer/reporter plasmid combinations | Abbreviation | Structures labelled (Figures) – [# embryos] |
|---|---|---|
| Hindbrain flatmounts (embryos fixed at E4/E6) | ||
| Atoh1-Cre + CAG Flox-pA-GFP+CAG-mCherry | Atoh1::GFP + mCherry | RL (2C) – (12) |
| Ptf1a-Cre + CAG PBase+Pb CAG-Flox-pA-GFP+CAG-mCherry | Ptf1a::GFP + mCherry | VZ (2D) – (7) |
| Egr2-Cre + CAG PBase+Pb CAG-Flox-pA-GFP+CAG-mCherry | Egr2::GFP + mCherry | r3, r5 (2E) – (5) |
| Hoxb1-Cre + CAG PBase+Pb CAG-Flox-pA-GFP+CAG-mCherry | Hoxb1::GFP + mCherry | r4 (2E) – (5) |
| Hoxa3-Cre + CAG PBase+Pb CAG-Flox-pA-GFP+CAG-mCherry | Hoxa3::GFP + mCherry | r5, r6 (2E) – (5) |
| Hoxd4-Cre + CAG PBase+Pb CAG-Flox-pA-GFP+CAG-mCherry | Hoxd4::GFP + mCherry | ≥r7 (2E) – (5) |
| Hindbrain coronal cryosections (embryos fixed at E10) | ||
| Atoh1-Cre + CAG Flox-pA-GFP+CAG-mCherry | Atoh1::GFP + mCherry | VeS (4A), Dd/Dv (4E-F), Ta (4K), VeM (5A), VeD (5H-I), NM (6A-D), NA (6 L-M), NL (7A), SON (7F) – (10) |
| Atoh1-Cre + CAG-Flox-pA-GFP | Atoh1::GFP | NL (7A - inset), SON (7F - inset) – (4) |
| Ptf1a-Cre + CAG PBase+Pb CAG-Flox-pA-GFP+CAG-mCherry | Ptf1a::GFP + mCherry | Dd/Dv (4 G-6H), Ta (4L), VeM (5B), VeD (5J), -NM (6E), NA (6N), SON (7G) – (9) |
| Egr2-Cre + CAG PBase+Pb-CAG-Flox-pA-GFP | Egr2::GFP | VeS (4B), Dd/Dv (4I), Ta (4M), VeD (5K), NA (6O), NL (7B), SON (7H) – (4) |
| Hoxb1-Cre + CAG PBase+Pb-CAG-Flox-pA-GFP | Hoxb1::GFP | VeS (4C), Dd/Dv (4J), Ta (4N), VeD (5N), NA (6P), NL (7C), SON (7J) – (7) |
| Hoxa3-Cre + CAG PBase+Pb-CAG-Flox-pA-GFP | Hoxa3::GFP | Ta (4O), VeD (5L), NL (7D), SON (7K) – (4) |
| Hoxd4-Cre + CAG PBase+Pb-CAG-Flox-pA-GFP | Hoxd4::GFP | VeD (5M) – (7) |
| Egr2-Cre + CAG PBase+Pb CAG-Flox-pA-GFP+Atoh1 Gal4+UAS-tdT | Egr2::GFP + Atoh1::tdT | VeM (5C), NM (6F), SON (7I)– (4) |
| Hoxb1-Cre + CAG PBase+Pb CAG-Flox-pA-GFP+Atoh1 Gal4+UAS-tdT | Hoxb1::GFP + Atoh1::tdT | VeM (5D), -NM (6H)– (7) |
| Hoxa3-Cre + CAG PBase+Pb CAG-Flox-pA-GFP +Atoh1 Gal4+UAS-tdT | Hoxa3::GFP + Atoh1::tdT | VeM (5E), NM (6G) – (4) |
| Hoxd4-Cre + CAG PBase+Pb CAG-Flox-pA-GFP+Atoh1 Gal4+UAS-tdT | Hoxd4::GFP + Atoh1::tdT | VeM (5F), NM (6I) – (7) |
| Hoxd4-Cre + Atoh1 FLPo+CAG Flox-FLp-pA-GFP+CAG-mCherry | Hoxd4 + Atoh1::GFP + mCherry | NM (6J) – (2) |
Additional files
-
Transparent reporting form
- https://doi.org/10.7554/eLife.40232.012
Download links
A two-part list of links to download the article, or parts of the article, in various formats.
Downloads (link to download the article as PDF)
Open citations (links to open the citations from this article in various online reference manager services)
Cite this article (links to download the citations from this article in formats compatible with various reference manager tools)
Conserved and divergent development of brainstem vestibular and auditory nuclei
eLife 7:e40232.
https://doi.org/10.7554/eLife.40232


