ppargc1a controls nephron segmentation during zebrafish embryonic kidney ontogeny
- University of Notre Dame, United States
Figures
Figure 1 with 2 supplements
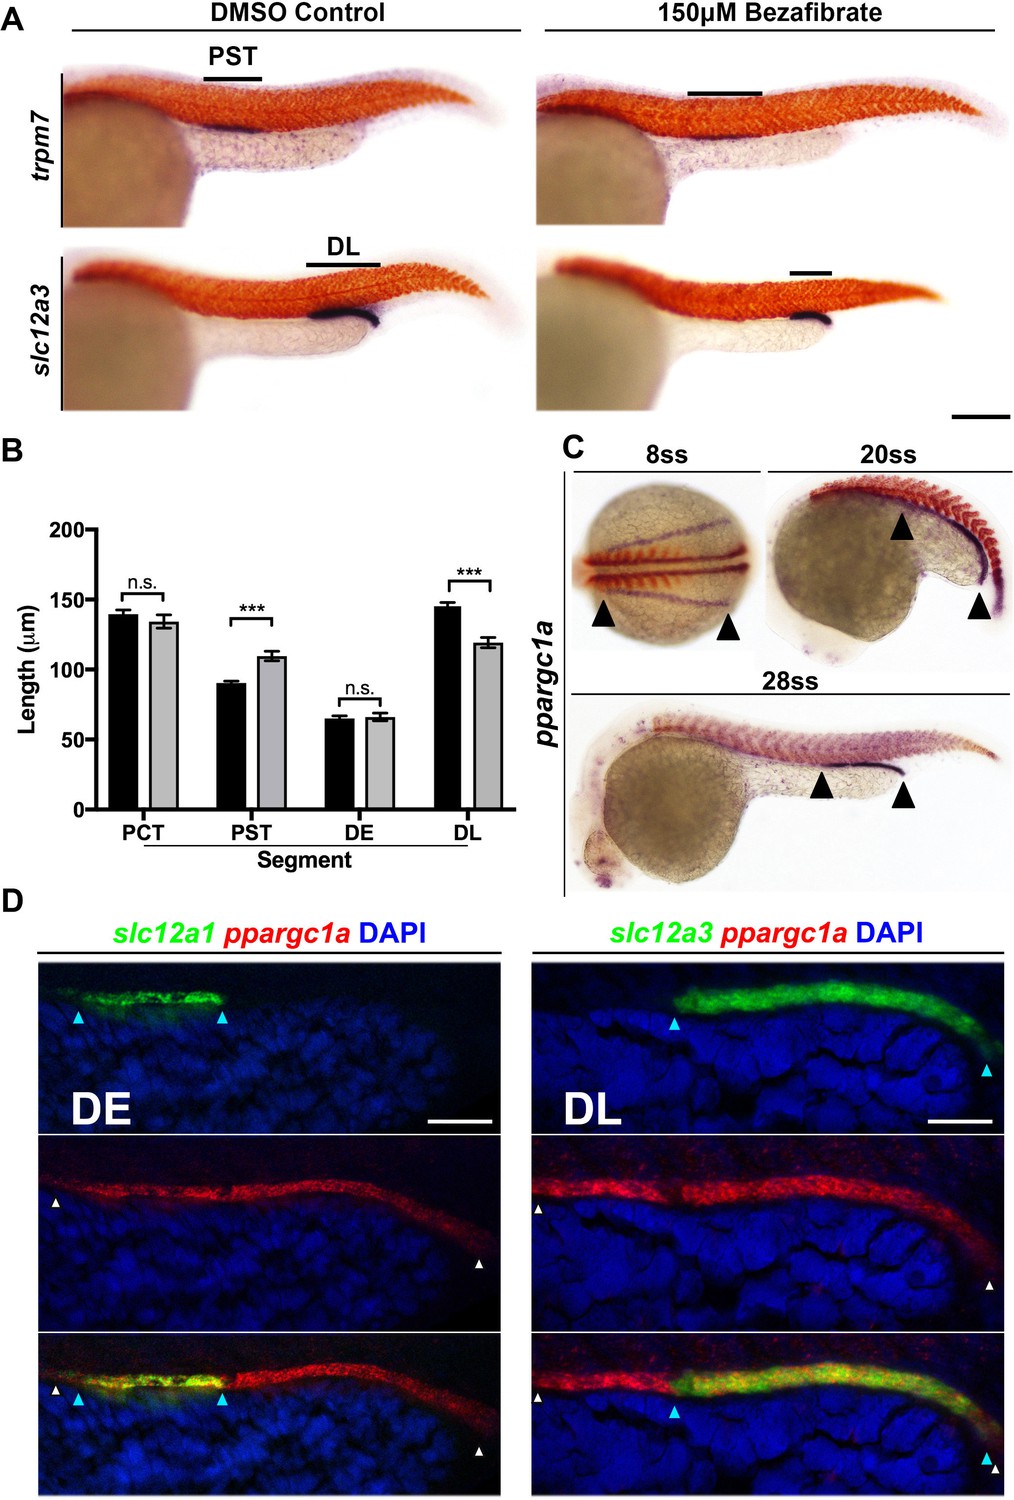
PPAR agonist bezafibrate alters zebrafish pronephros segmentation, and the PPAR coactivator ppargc1a exhibits a dynamic expression pattern in renal progenitors.
(A) Double WISH at the 28 ss for the PST segment marker trpm7 (top), and the DL segment marker slc12a3 (bottom), with smyhc (red) to mark somites in DMSO control (left) and PPAR agonist, 150 μM Bezafibrate-treated (right) samples confirmed the initial hit from the chemical screen. Scale bar = 90 μm. (B) Absolute length measurements of the changes to pronephros segment lengths in bezafibrate treated (grey) and control samples (black). (C) Double WISH for ppargc1a (purple) expression at the 8 ss, 20 ss, and 28 ss with somites stained (red) (8 ss = deltaC, 20 ss and 28 ss = smyhc). (D) Double FISH at the 28 ss showing colocalization of ppargc1a (red) with slc12a1 (distal early, left) and slc12a3 (DL, right). Expression boundaries are indicated with blue (DE, left and DL, right) and white (ppargc1a) arrowheads. Scale bars = 35 μm. Data are represented as ±SD, significant by t test comparing the drug treatment to the DMSO vehicle control, n.s. = not significant, *** = p < 0.001.
Figure 1—figure supplement 1
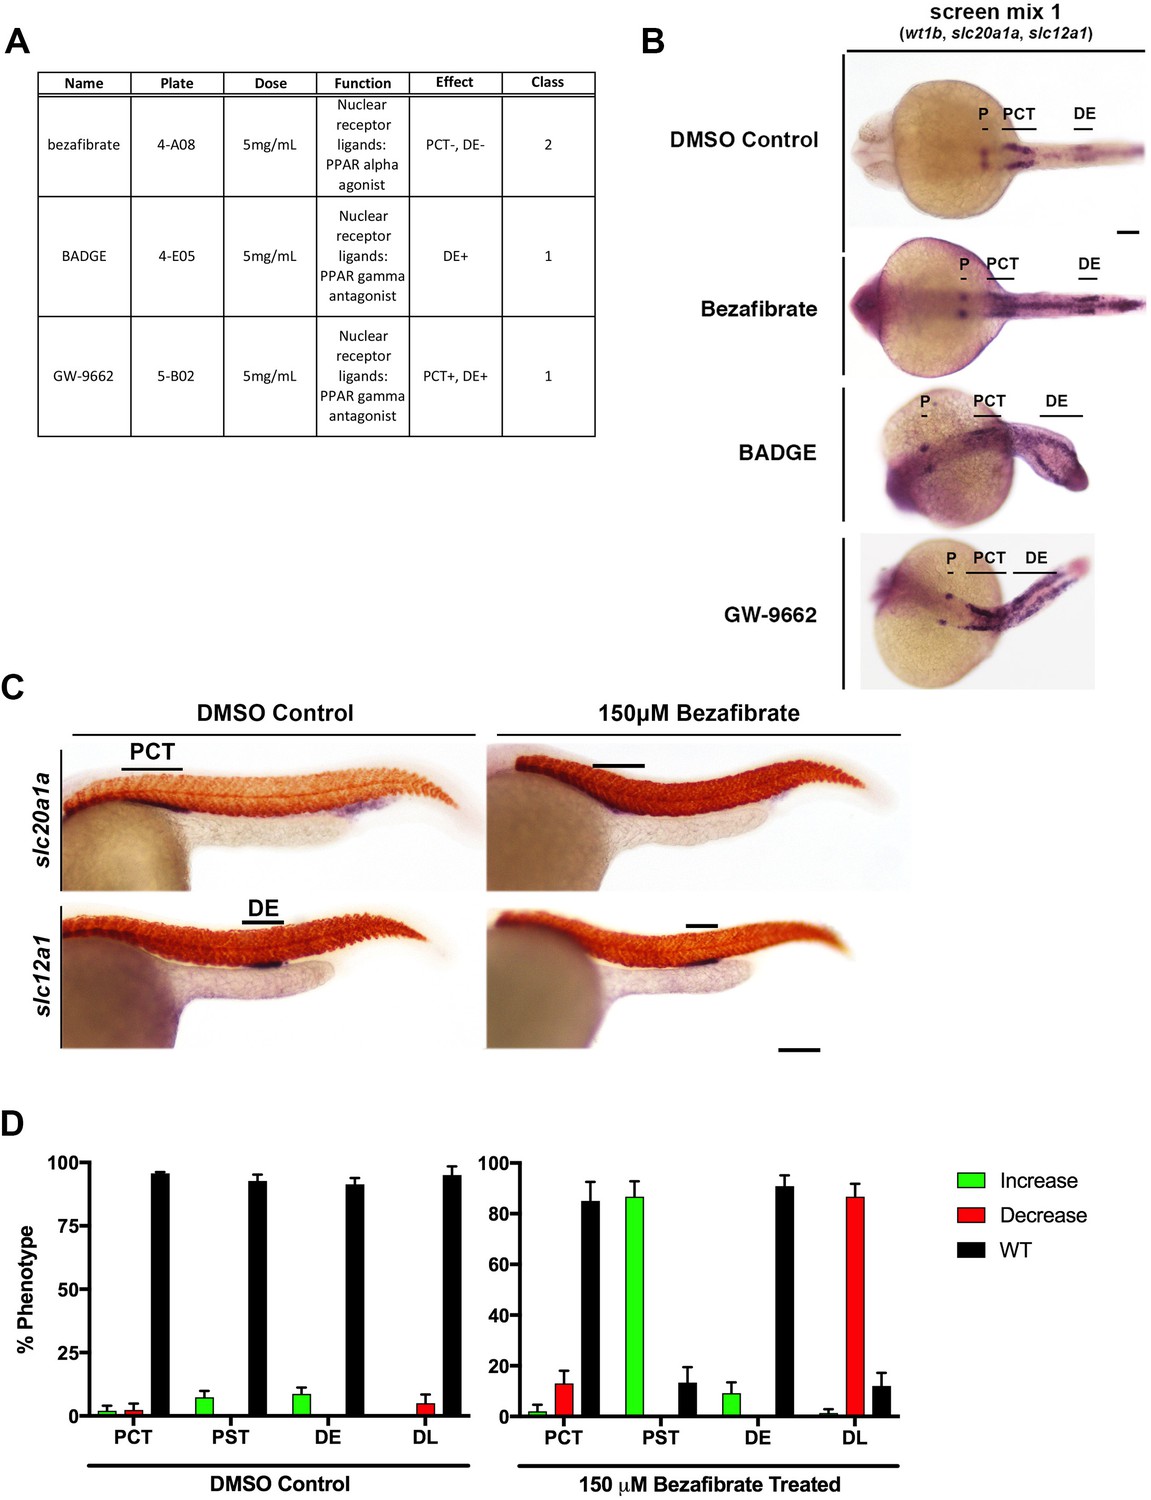
Chemical genetics analysis of nephron development following exposure to PPAR pathway modulators.
Treatment with 150 μM bezafibrate does not alter two of the four segment boundaries at the 28 ss. (A) Table of hits from the initial chemical genetic screen that target the PPAR pathway (B) WISH for wt1b (podocytes), slc20a1a (PCT), and slc12a1 (DE) in 28 ss zebrafish treated with chemicals targeting the PPAR pathway. (C) Treatment with 150 μM bezafibrate does not alter two of the four segment boundaries at the 28 ss. Double WISH showing no change in the boundary of slc20a1a or slc12a1, markers for PCT and DE, respectively, in DMSO control treated embryos and treated embryos. smyhc (red) marks the somites. Scale bars = 70 μm. (D) Penetrance graph showing the percent of phenotypes observed (green = increase, red = decrease, and black = WT) in control and treated samples. Data are represented as ±SD.
Figure 1—figure supplement 2

ppargc1a mRNA transcripts are expressed throughout the intermediate mesoderm before restricting to the distal nephron segments.
(A) Additional time points of ppargc1a (purple) mRNA expression illustrating the restricting domain from the 20 ss to the 28 ss. deltaC (12 ss) and smyhc (22–27 ss) were used to stain somites (red). ppargc1a mRNA expression at 30 hpf with a 20 X inset to show light proximal expression detectable at this stage. Scale bar = 90 μm. (B) Lateral (left) and flat-mounted dorsal (right) images of double WISH in 15 ss WT embryos for ppargc1a (purple) in and smyhc (red). The box indicates the approximate region of panel C. Scale bars = 110 μm (lateral) and 200 μm (dorsal flat-mount). (C) Double FISH in 15 ss WT embryos showing colocalization of ppargc1a (red, left) with pax2a (green, middle) and the images merged (right) with DAPI (blue). Scale bars = 100 μm.
Figure 2 with 6 supplements
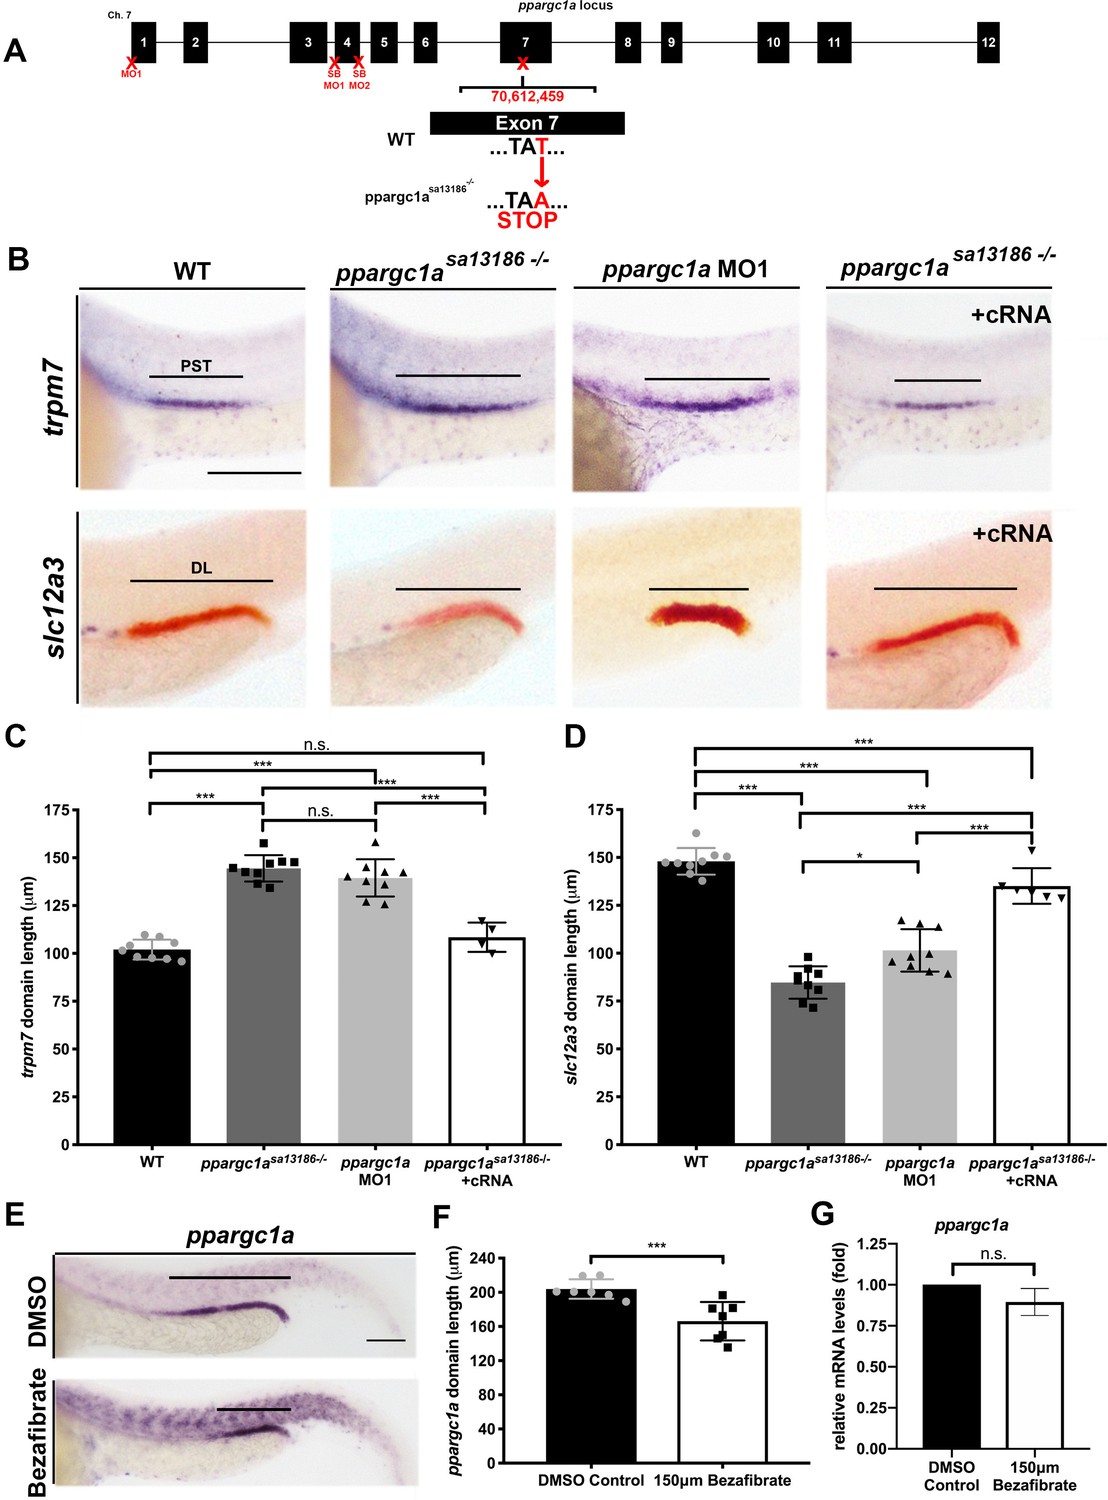
Loss-of-function studies show ppargc1a is necessary for proper PST and DL formation.
(A) Exon map of zebrafish ppargc1a and the target sites (X) for morpholinos (MO) and the location of the ppargc1asa13186 mutant allele. (B) WISH images of 28 ss ppargc1asa13186 WT siblings (WT), ppargc1asa13186-/-, ppargc1a MO1 injected, and ppargc1asa13186-/- + ppargc1a cRNA illustrating the changes in PST (trpm7-purple, top) and DL (slc12a3-red, bottom) formation in the ppargc1asa13186-/- and ppargc1a morphants, and the subsequent rescue when ppargc1a cRNA was added to the ppargc1asa13186-/-. Scale bars = 100 μm. Absolute length measurements of the PST (C), and DL (D) segments. (E) ppargc1a expression in DMSO control (top) and 150 μM bezafibrate-treated (bottom) zebrafish at the 28 ss following vehicle or vehicle/drug addition at the 5 hpf stage. Scale bars = 65 μm. (F) Absolute length measurements of the ppargc1a expression domain at 28 ss in DMSO control and bezafibrate-treated embryos from panel E. (G) qRT-PCR results showing ppargc1a RNA expression levels in bezafibrate-treated samples compared to DMSO controls. Data are represented as ±SD, significant by t test, n.s. = not significant, ** = p < 0.01, *** = p < 0.001.
Figure 2—figure supplement 1
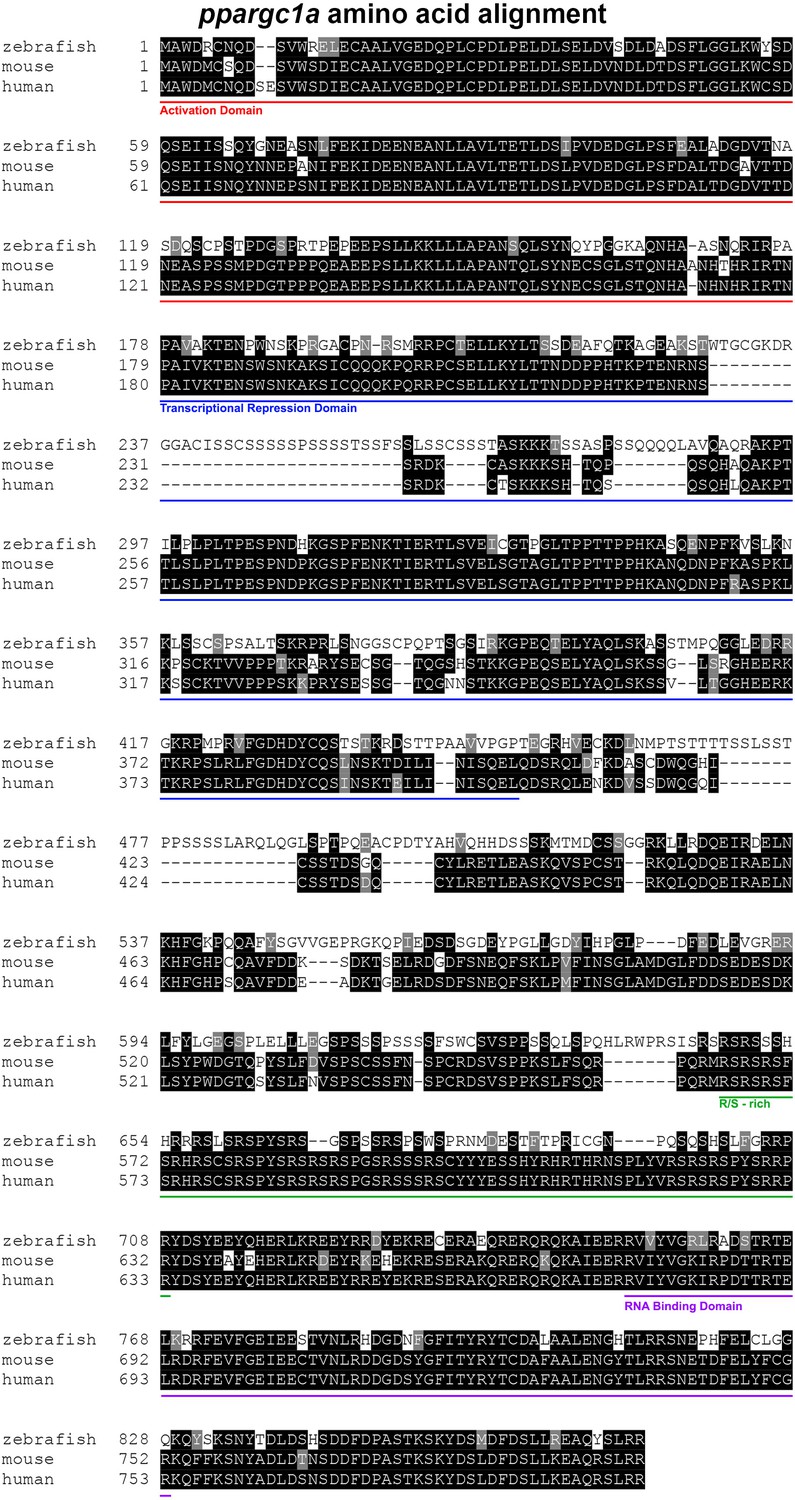
ppargc1a is conserved across vertebrate species.
Sequence alignment illustration of zebrafish (top), mouse (middle), and human Ppargc1a amino acids. Black background indicates conservation among species. Conserved protein functional domains are indicated with color labeling and lines to demarcate their locales.
Figure 2—figure supplement 2
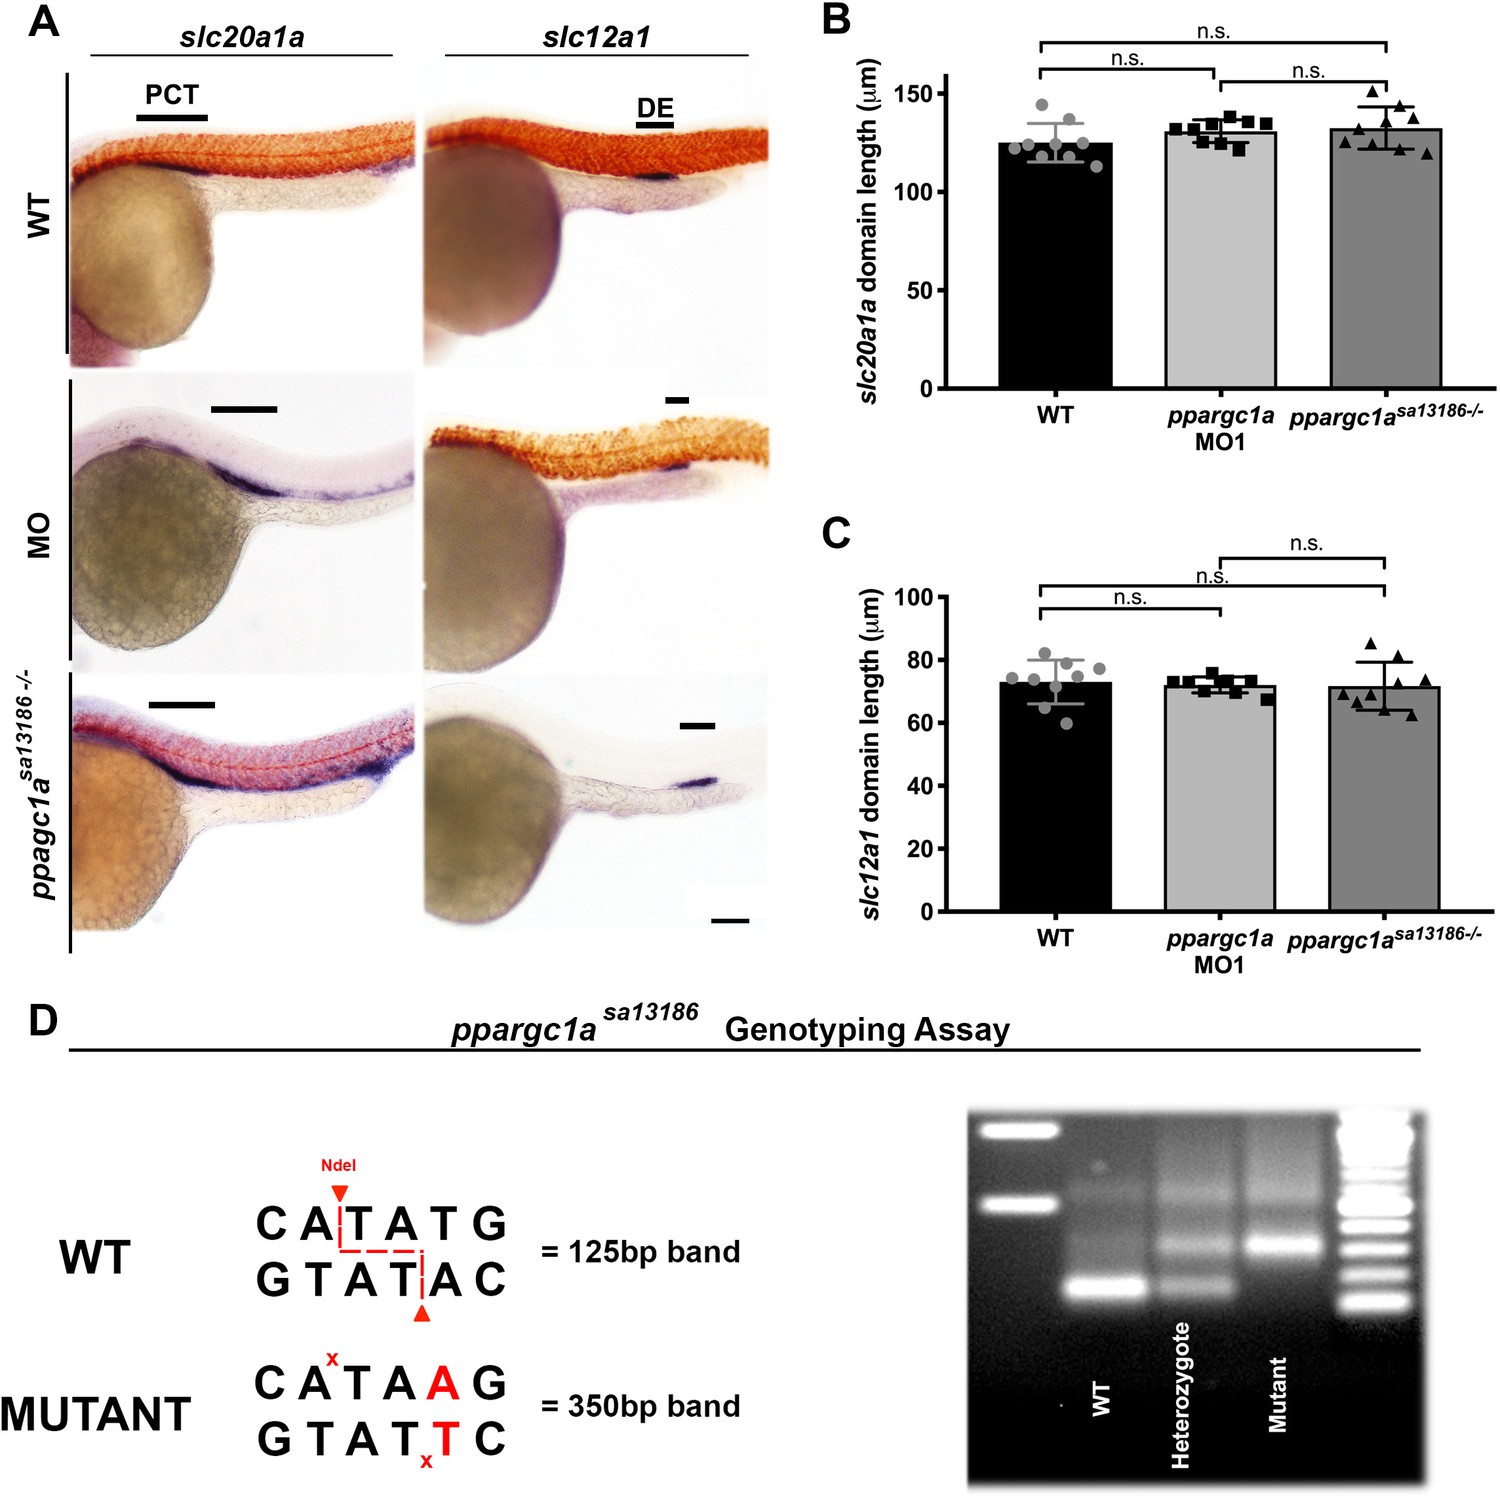
ppargc1a loss of function does not affect PCT or DE segment development.
(A) Double or single WISH for the PCT (slc20a1a) and the DE (slc12a1) for WT, ppargc1a MO1 injected, and ppargc1asa13186-/- do not indicate a change in the domain length of either segment marker at the 28 ss. Scale bar = 70 μm. Absolute length measurements for the PCT (B) and DE (C). Data are represented as ±SD, significant by t test, n.s. = not significant. (D) Schematic showing the details of a genotyping assay performed to identify ppargc1asa13186-/-.
Figure 2—figure supplement 3
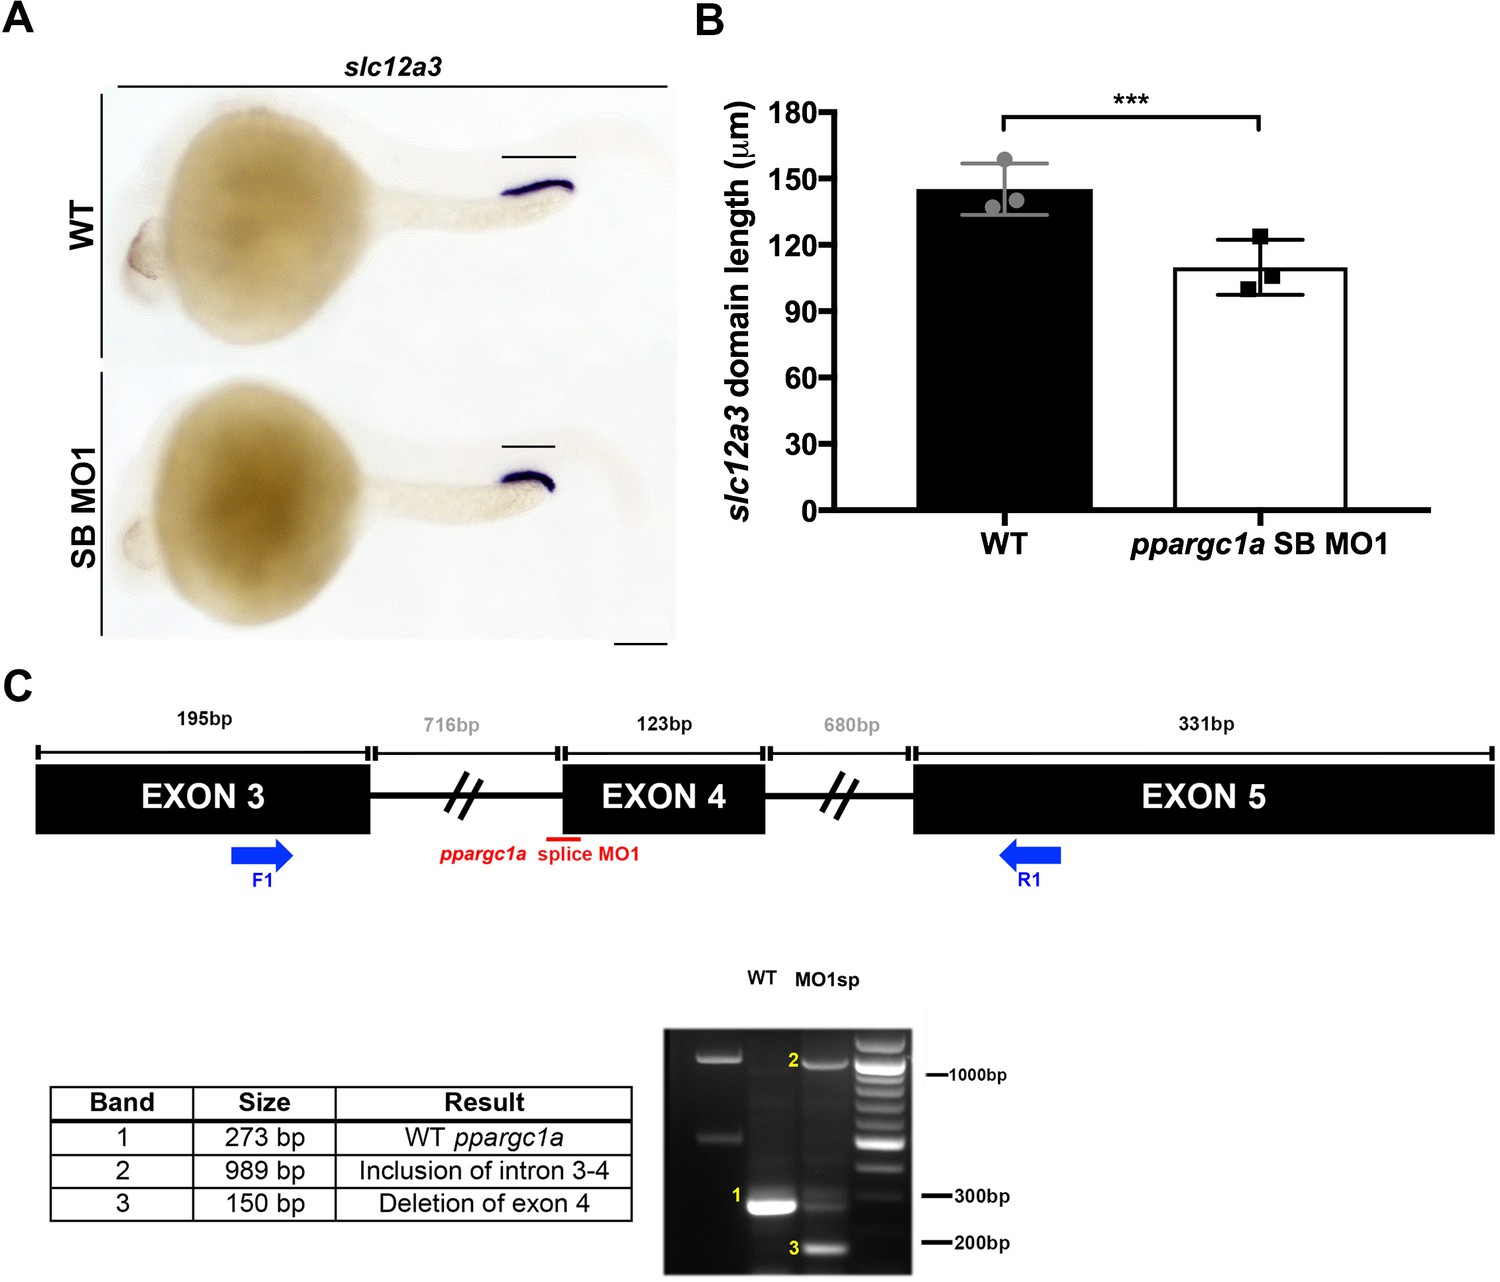
Loss of function via a ppargc1a splice blocking MO recapitulates the decreased DL phenotype seen in other loss of function tests.
(A) WISH for slc12a3 (DL) in 28 ss WT (top) and splice blocking (SB) MO1 (bottom) with the graph (B) showing absolute length measurements of representative samples. Scale bar = 100 μm. (C) RT-PCR analysis revealed disrupted splicing of ppargc1a at the target site specified on the exon map schematic. Data are represented as ±SD, significant by t test, *** = p < 0.001.
Figure 2—figure supplement 4

Loss of function via a ppargc1a splice blockingMO recapitulates the decreased DL phenotype seen in other loss of function tests.
(A) WISH for slc12a3 (DL) in 28 ss WT (top) and splice blocking (SB) MO2 (bottom) with the graph (B) showing absolute length measurements of representative samples. Scale bar = 100 μm. (C) RT-PCR analysis revealed disrupted splicing of ppargc1a at the target site specified on the exon map schematic. Data are represented as ±SD, significant by t test, *** = p < 0.001.
Figure 2—figure supplement 5
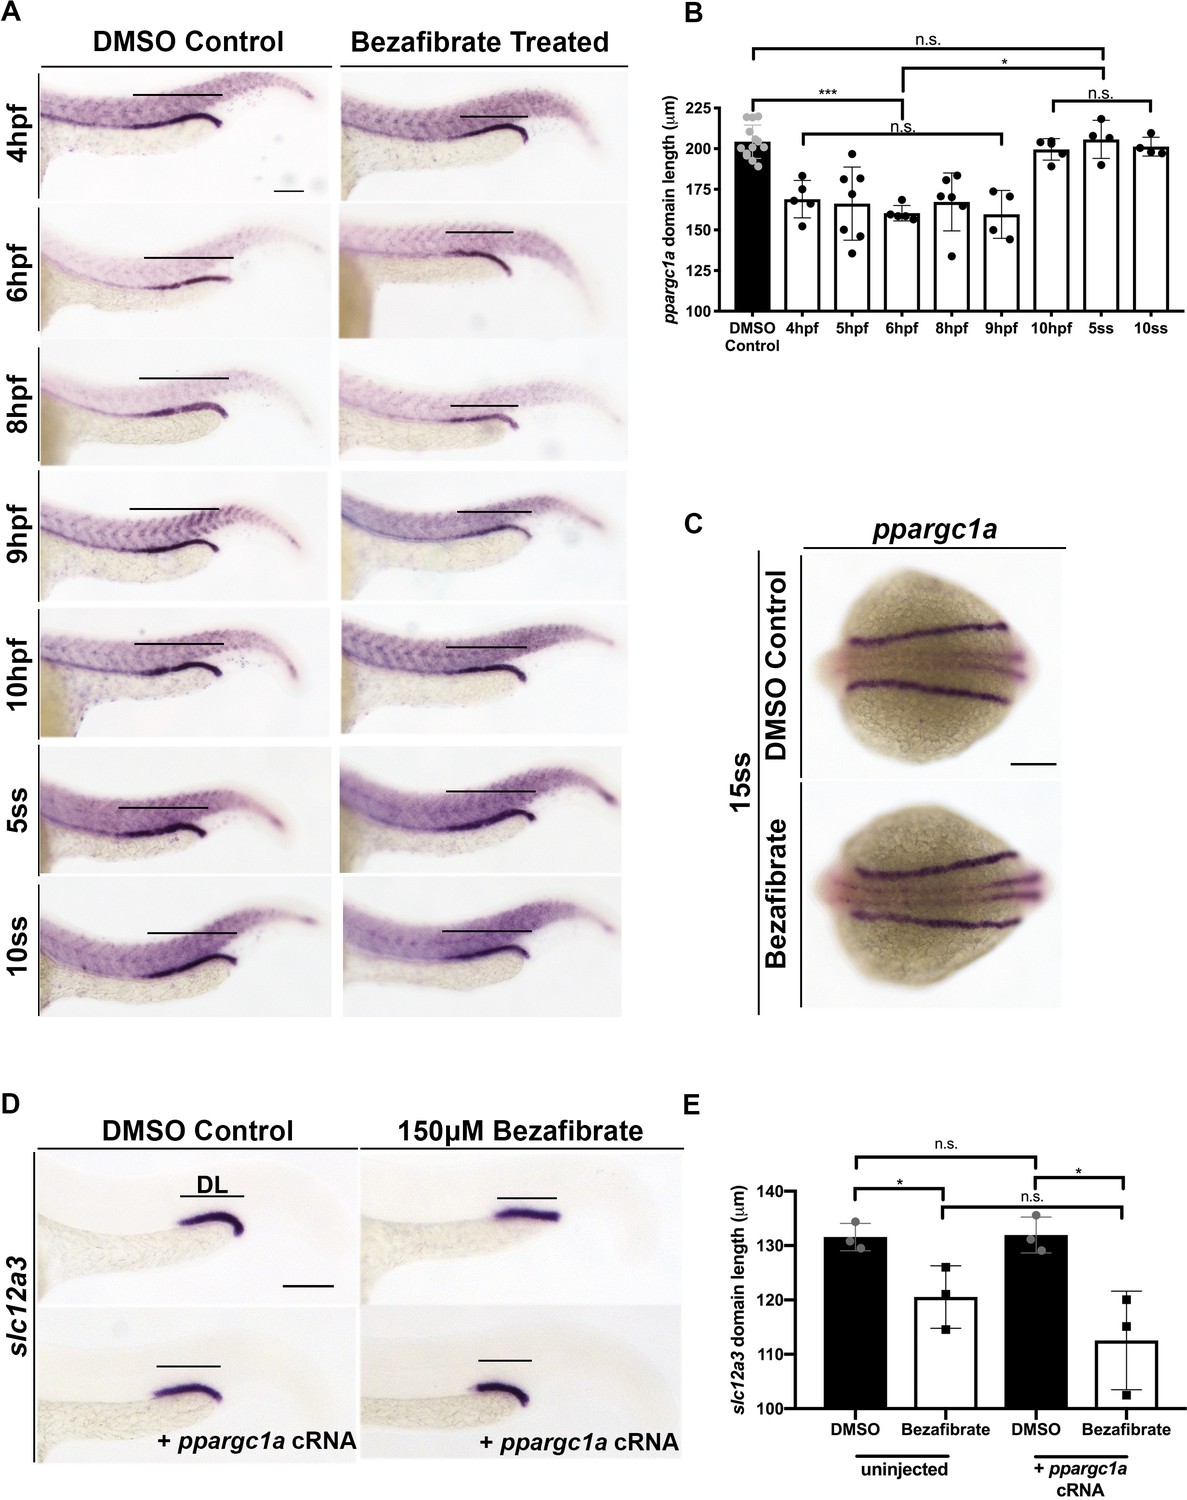
The time of bezafibrate addition causes differential effects on ppargc1a domain length, and the effect of bezafibrate on DL development is not rescued by ppargc1a RNA overexpression.
(A) Various time points for chemical addition in DMSO control (left) and 150 μM bezafibrate (right) treated 28 ss zebrafish after WISH for ppargc1a. Scale bars = 60 μm. (B) The absolute measurement of ppargc1a domain length in DMSO control compared to 150 μM bezafibrate treated at the various time points of addition. Note: 5 hpf time of addition data is depicted here for statistical comparison in addition to Figure 2F. (C) WISH for ppargc1a expression at 15 ss in DMSO control and 150 μM bezafibrate treated (5 hpf - 15 ss) zebrafish. Scale bar = 100 μm. (D) WISH for slc12a3 (DL) in DMSO control and 150 μM bezafibrate treated (top) and DMSO control +ppargc1 a cRNA and 150 μM bezafibrate treated +ppargc1 a cRNA (bottom). (E) Absolute measurements of slc12a3 domain length. Scale bars = 100 μm. Data are represented as ±SD, significant by ANOVA (B) or t test (E), n.s. = not significant, * = p < 0.05, *** = p < 0.001.
Figure 2—figure supplement 6
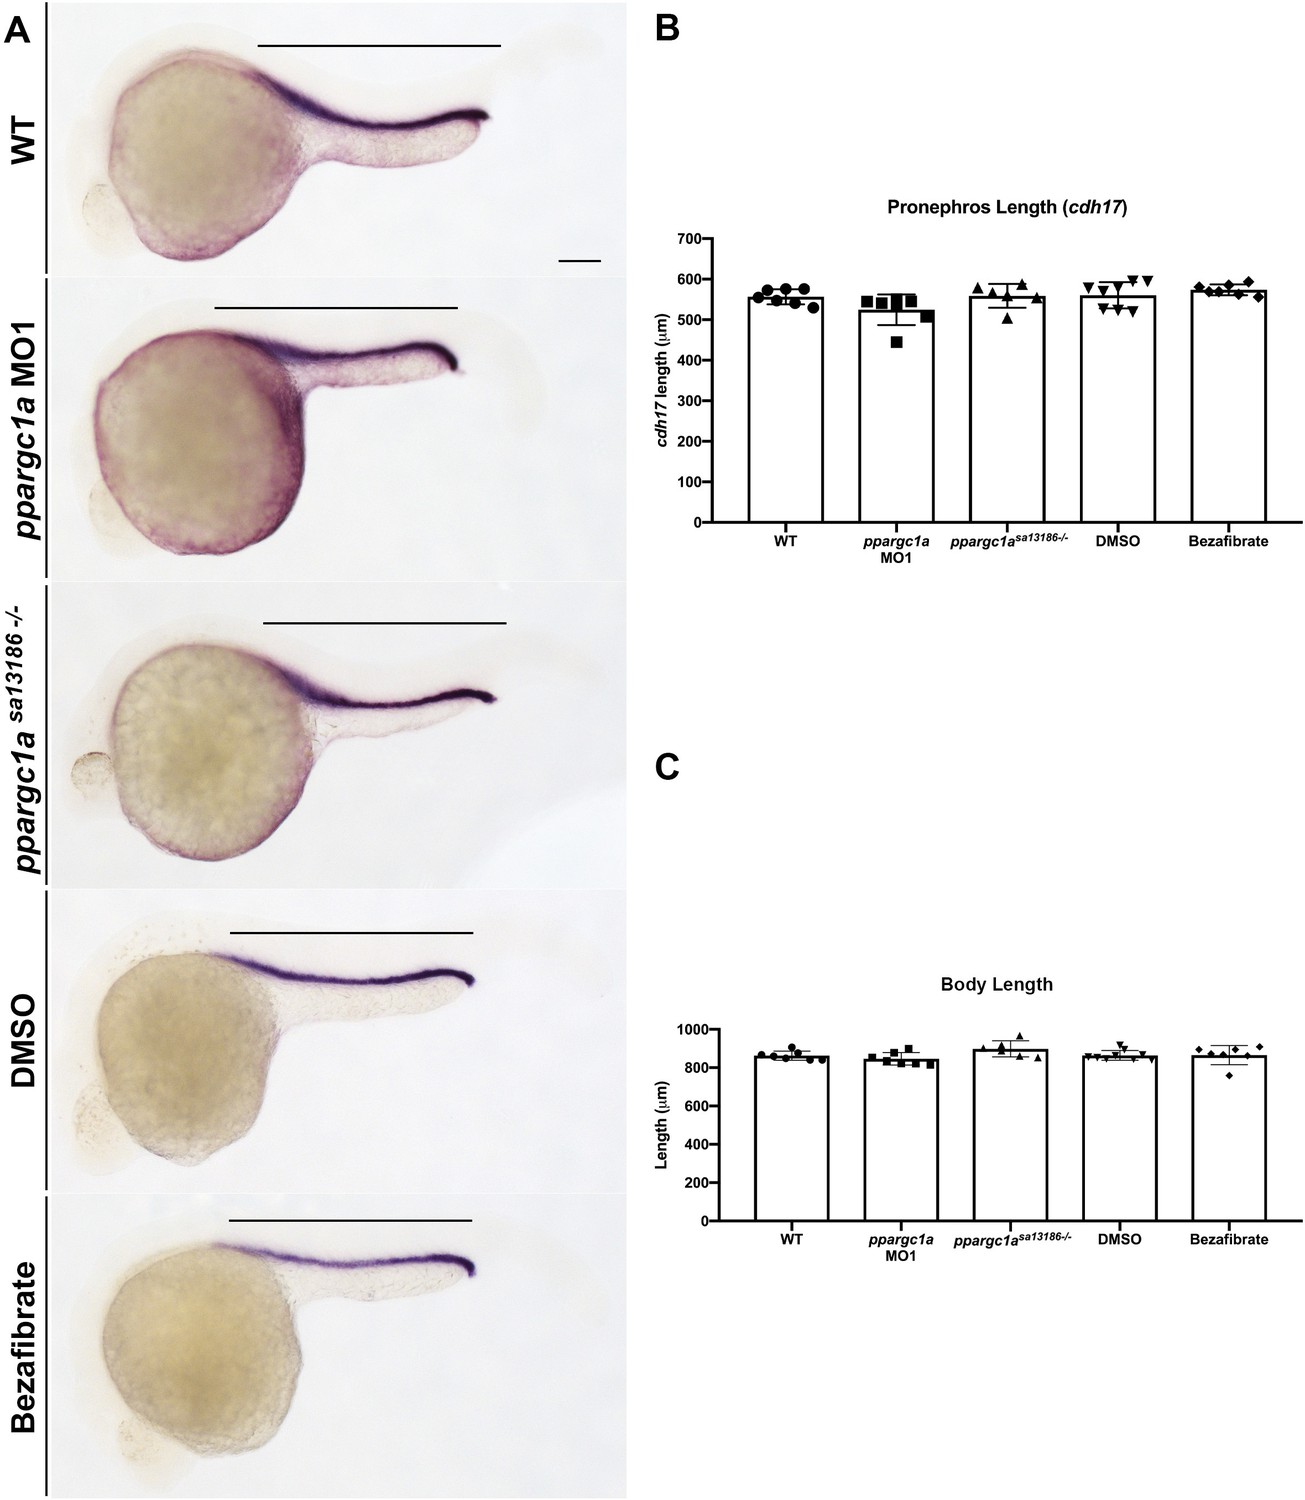
Pronephros and body length measurements indicate no significant change in any treatment group compared to WT.
(A) WISH for tubule marker cdh17 in 28 ss WT, ppargc1a MO1, ppargc1asa13186-/-, DMSO control, and 150 μM bezafibrate-treated zebrafish. Scale bar = 75 μm. (B) Absolute length measurements of cdh17 in the various treatment groups. (C) Body length absolute measurements from the head/yolk sac boundary to the tip of the cdh17 stain (approximate collecting duct area). Data are represented as ±SD, and comparisons between all groups were not significant by t test.
Figure 3 with 5 supplements
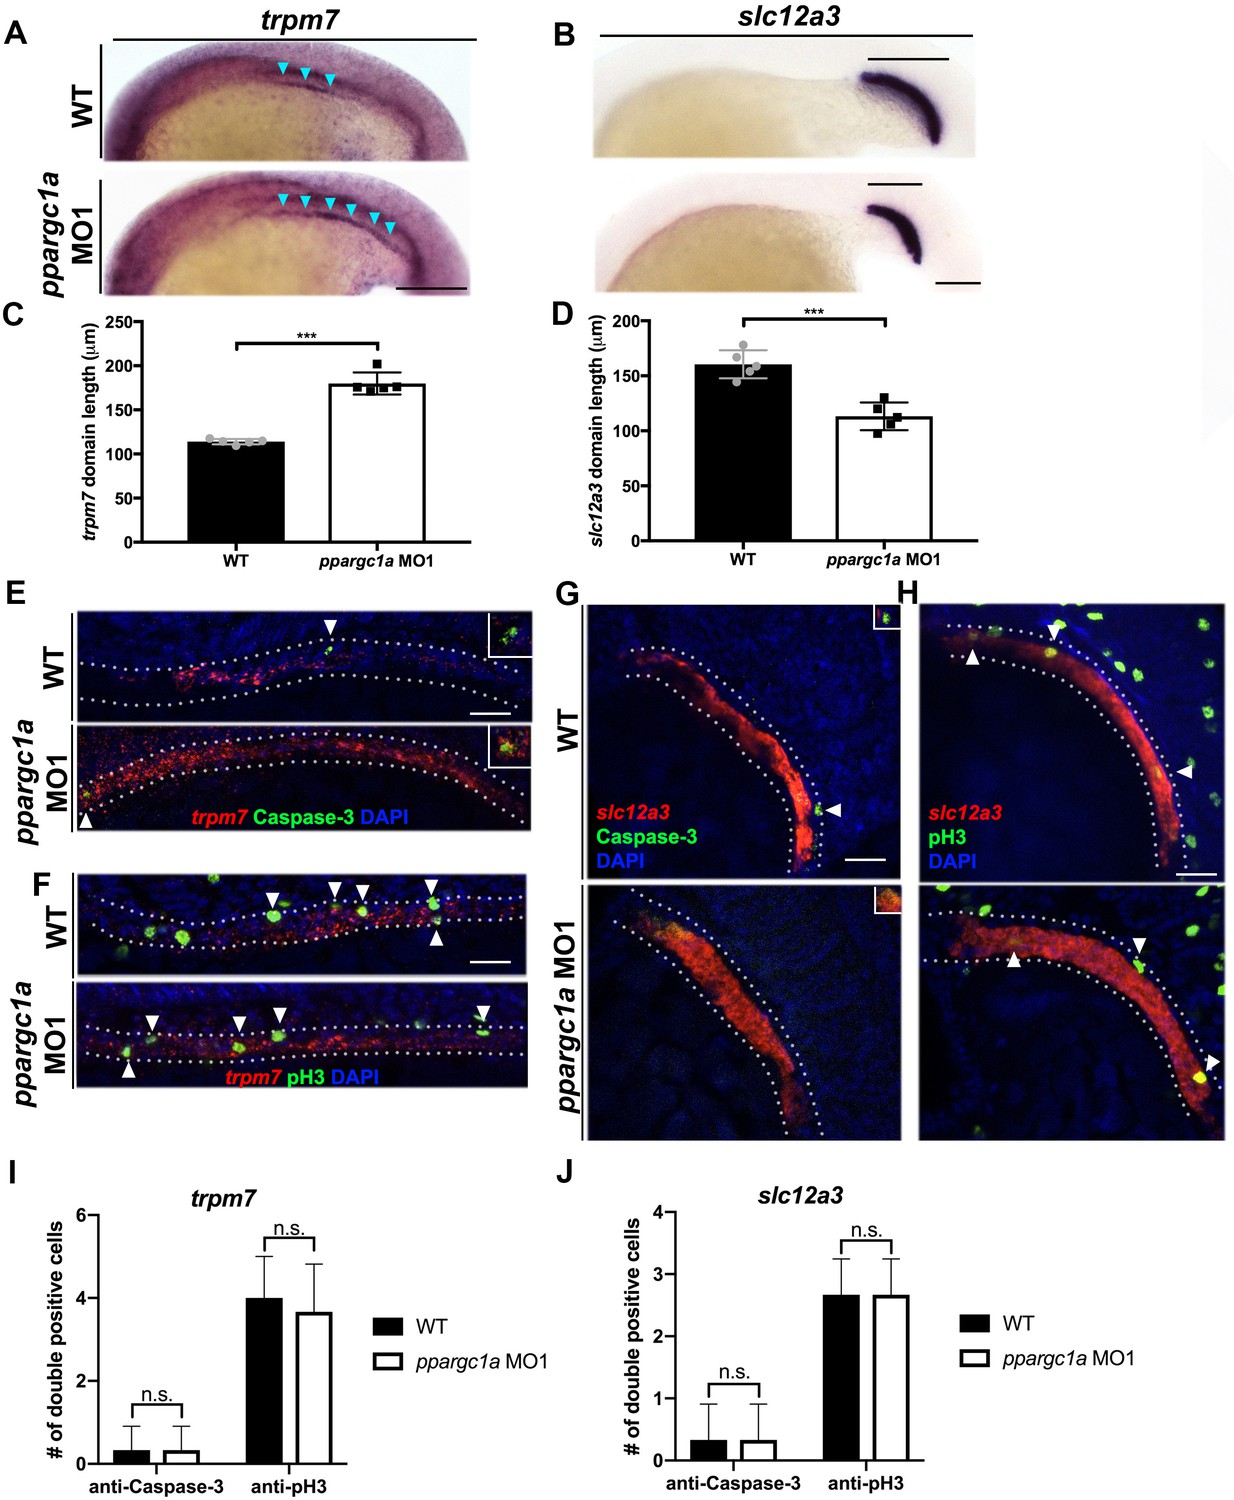
Loss of ppargc1a does result in segment changes at the 20 ss but no change in cellular turnover is observed.
(A) WISH at the 20 ss for trpm7 (left) and (B) slc12a3 (right) in WT (top) and ppargc1a MO (bottom). Blue arrowheads indicate trpm7 expression in the developing pronephros. Scale bar = 100 μm. The representative graphs showing absolute length measurements of trpm7 (C) and slc12a3 (D). (E) FISH/IHC for trpm7 (red) and anti-Caspase-3 (green) with DAPI (blue) in WT (top) and ppargc1a MO1 (bottom). (F) FISH/IHC for trpm7 (red) and anti-phospho-Histone H3 (green) in WT (top) and ppargc1a MO1 (bottom). (G) FISH/IHC for slc12a3 (red) and anti-Caspase-3 (green) with DAPI (blue) in WT (top) and ppargc1a MO1 (bottom). (H) FISH/IHC for slc12a3 (red) and anti-phospho-Histone H3 (green) with DAPI (blue) in WT (top) and ppargc1a MO1 (bottom). (I) The number of trpm7/Caspase-3 or trpm7/pH3 double-positive cells is depicted. (J) The number of slc12a3/Caspase-3 or slc12a3/pH3 double positive cells is depicted. (WT quantifications = black bars, ppargc1a-deficient quantifications = white bars.) Data are represented as ±SD, significant by t test, n.s. = not significant, *** = p < 0.001.
Figure 3—figure supplement 1
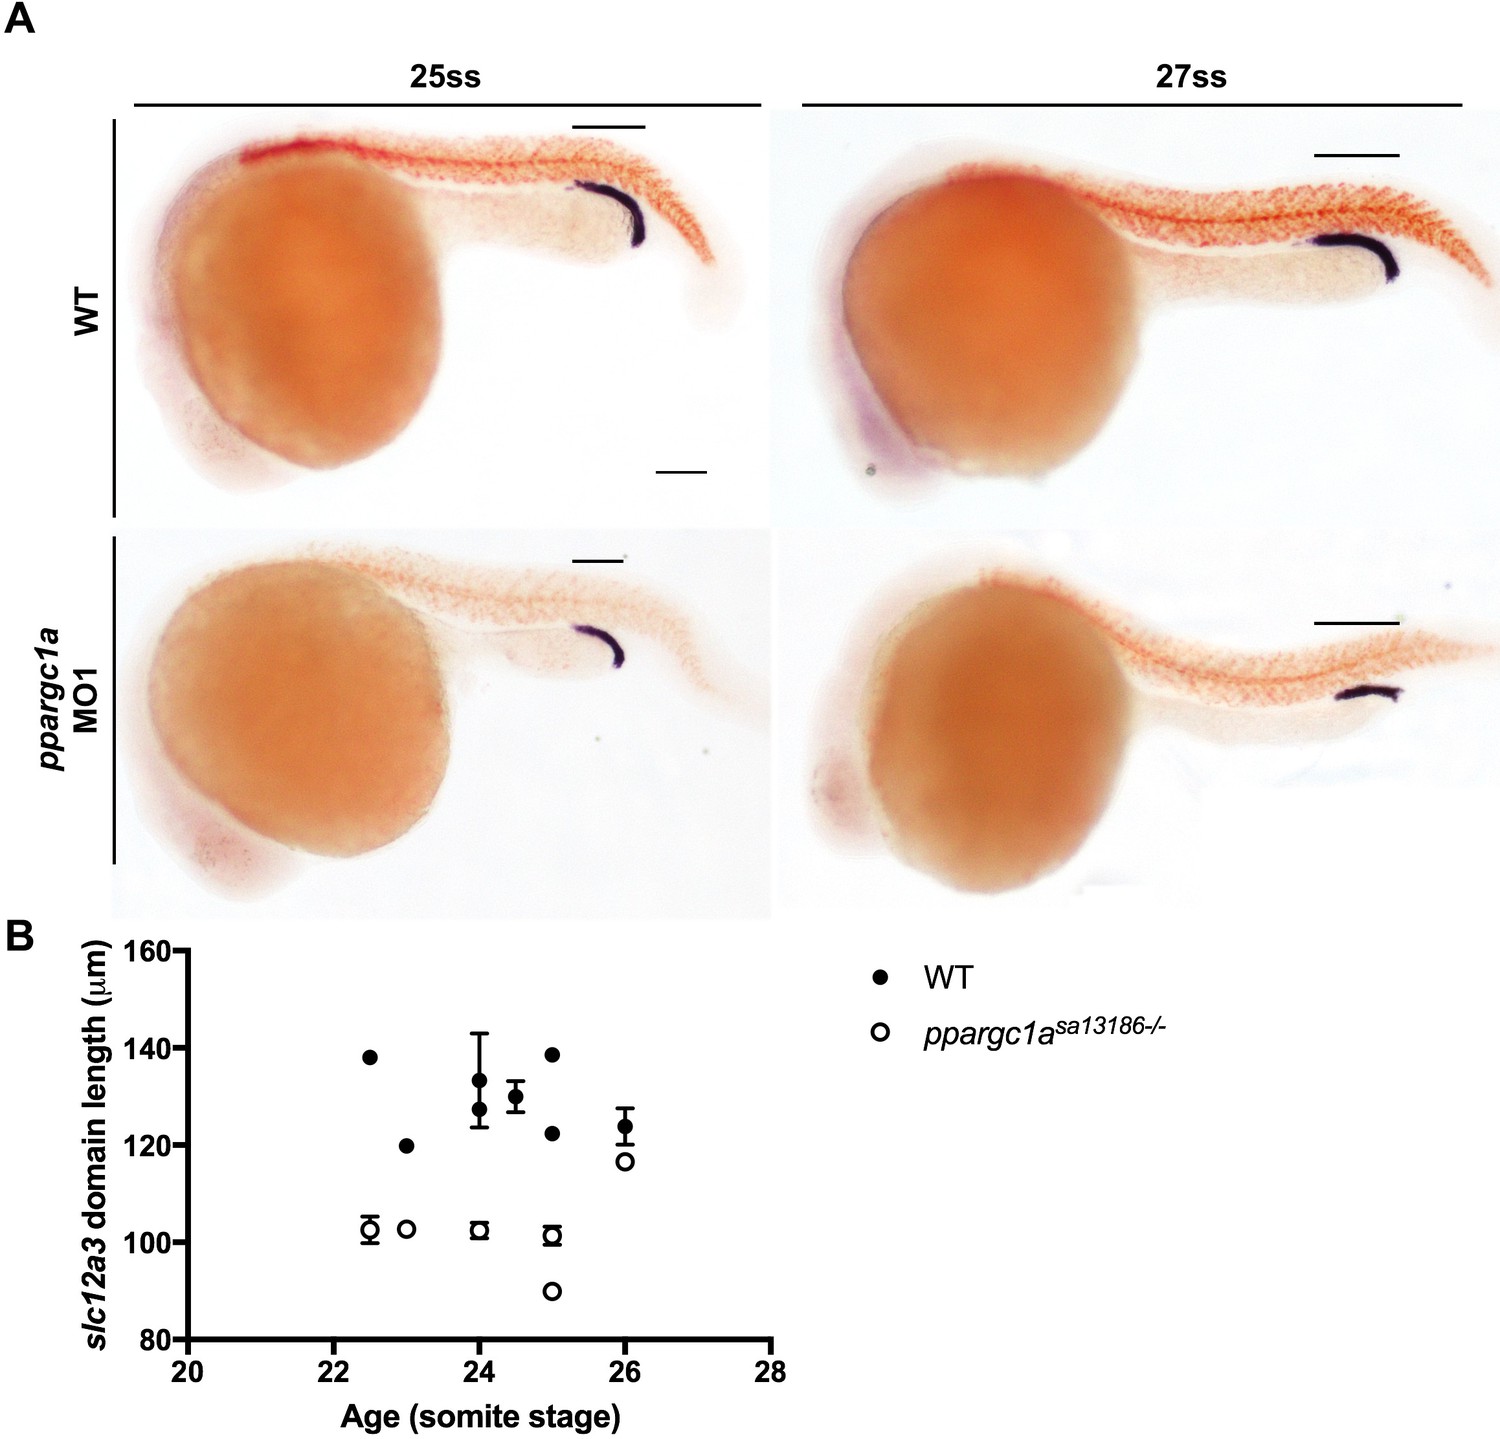
Decreased DL phenotypes are evident at the 25 ss and 27 ss in ppargc1a-deficient embryos.
(A) Double WISH for slc12a3 (purple) and smyhc (red) in WT and ppargc1a MO1 injected zebrafish. Scale bars = 100 μm. (B) Graph indicating the slc12a3 domain length in relation to age (in ss) in WT (black) and MO1 injected (white).
Figure 3—figure supplement 2
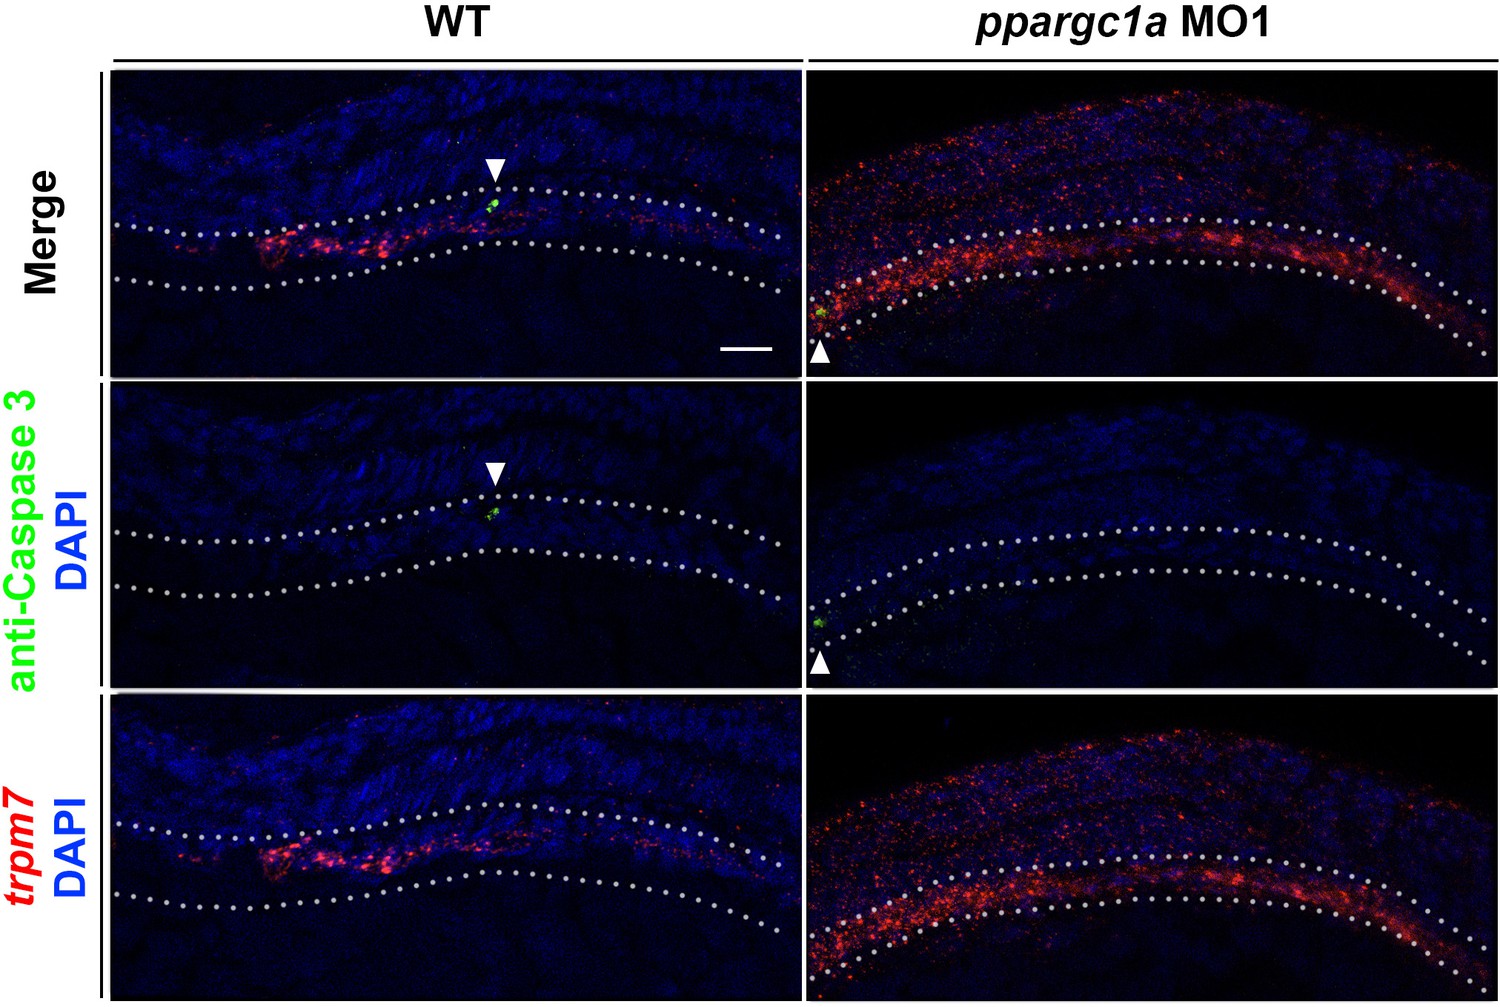
Confocal image split channels of trpm7 and anti-Caspase-3 in WT and ppargc1a deficient 20 ss zebrafish.
trpm7 (red) with DAPI (blue) on bottom, anti-Caspase-3 (green) with DAPI (blue) middle, and merge on top. Scale bar = 30 μm.
Figure 3—figure supplement 3

Confocal image split channels of trpm7 and anti-pH3 in WT and ppargc1a deficient 20 ss zebrafish.
trpm7 (red) with DAPI (blue) on bottom, anti-pH3 (green) with DAPI (blue) middle, and merge on top. Scale bar = 30 μm.
Figure 3—figure supplement 4
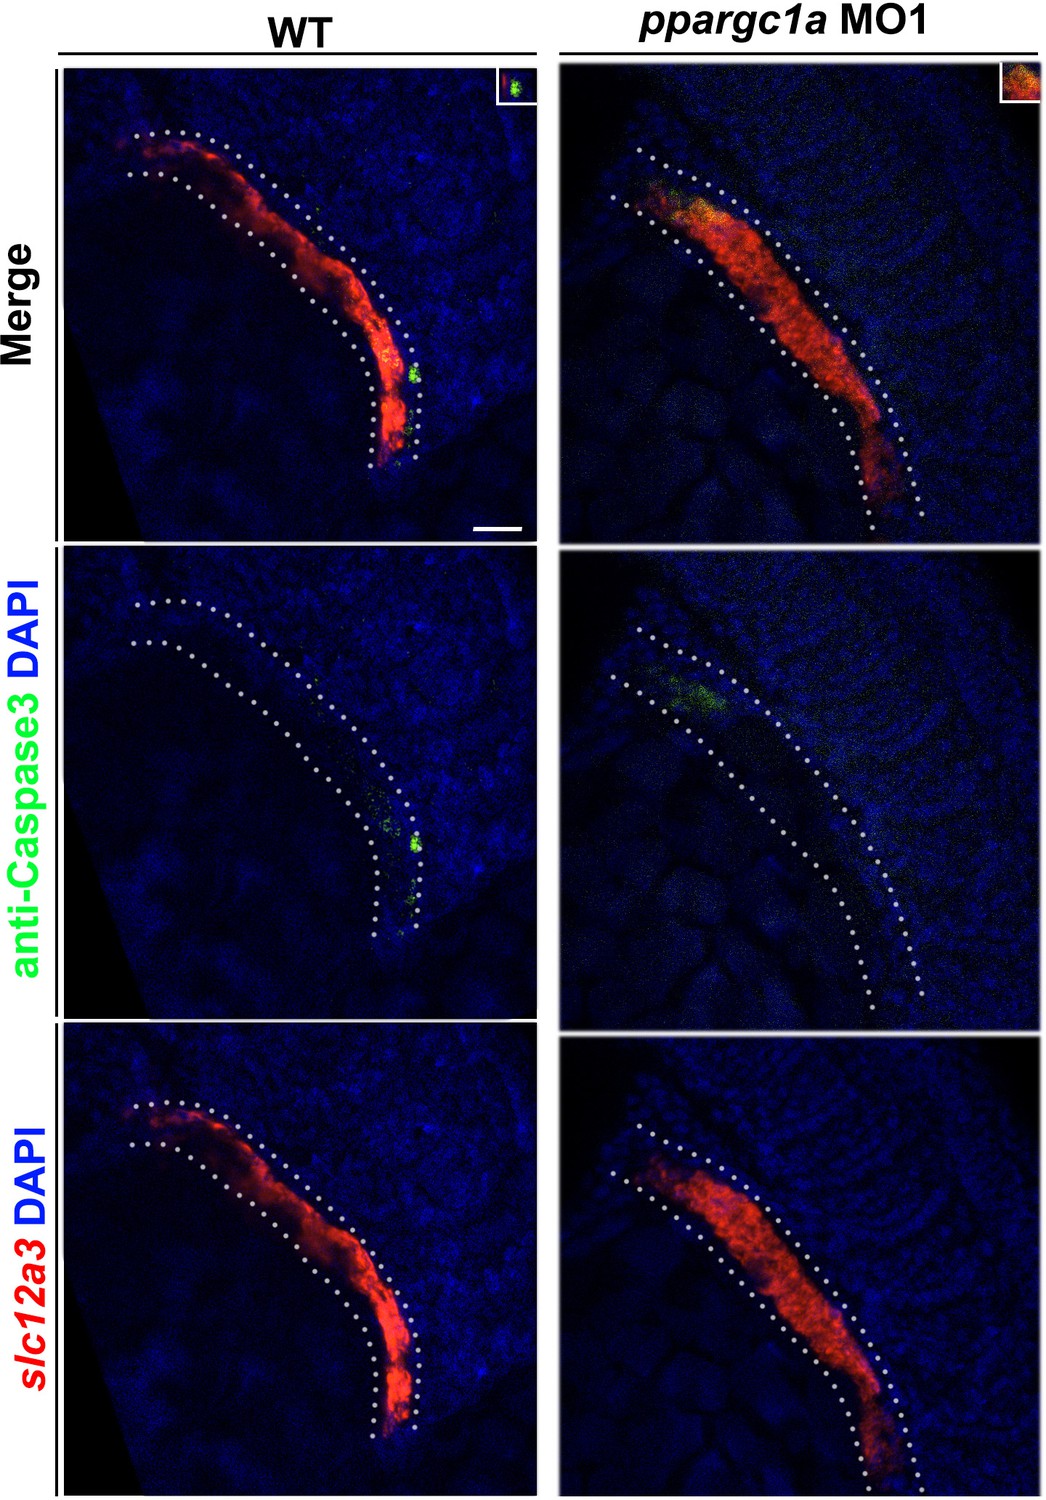
Confocal image split channels of slc12a3 and anti-Caspase-3 in WT and ppargc1a-deficient 20 ss zebrafish.
slc12a3 (red) with DAPI (blue) on bottom, anti-Caspase-3 (green) with DAPI (blue) middle, and merge on top. Scale bar = 30 μm.
Figure 3—figure supplement 5
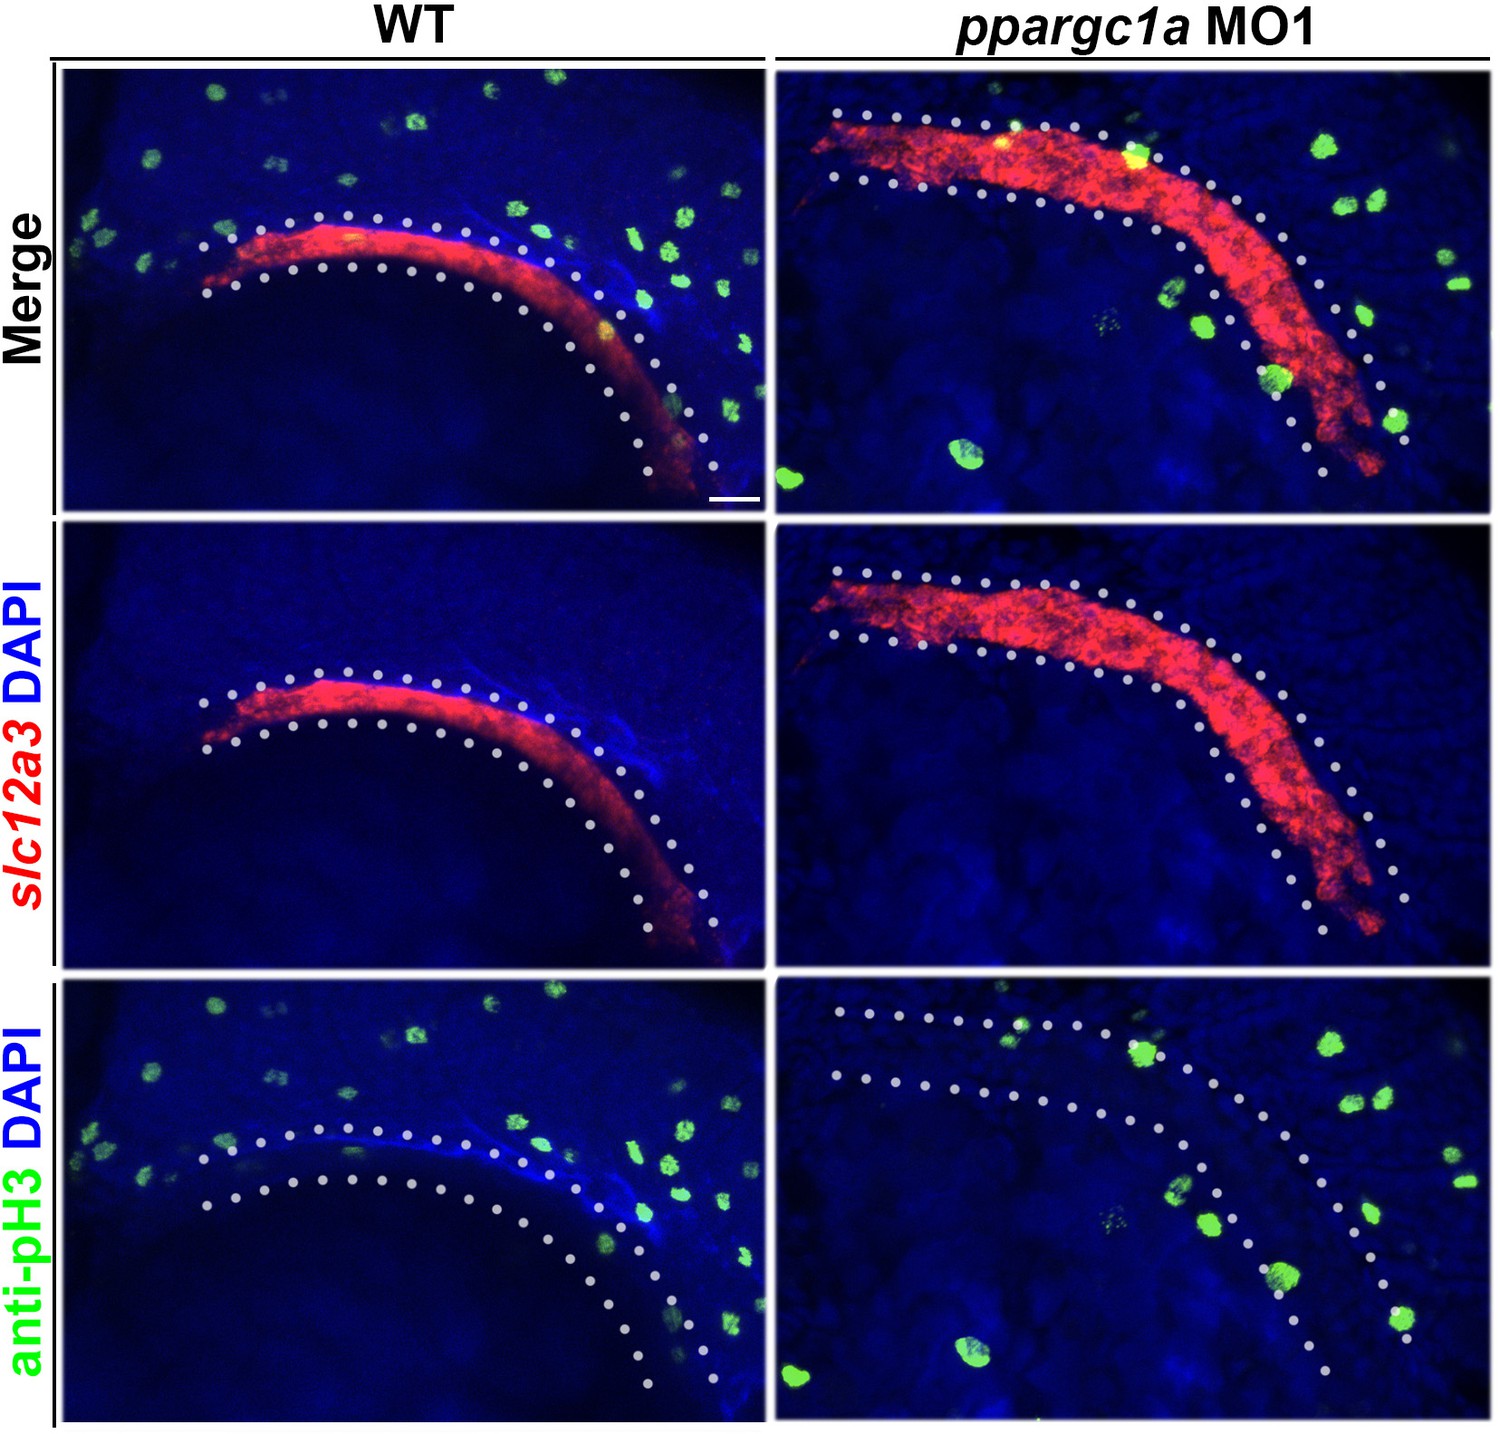
Confocal image split channels of slc12a3 and anti-pH3 in WT and ppargc1a-deficient 20 ss zebrafish.
slc12a3 (red) with DAPI (blue) on bottom, anti-pH3 (green) with DAPI (blue) middle, and merge on top. Scale bar = 30 μm.
Figure 4
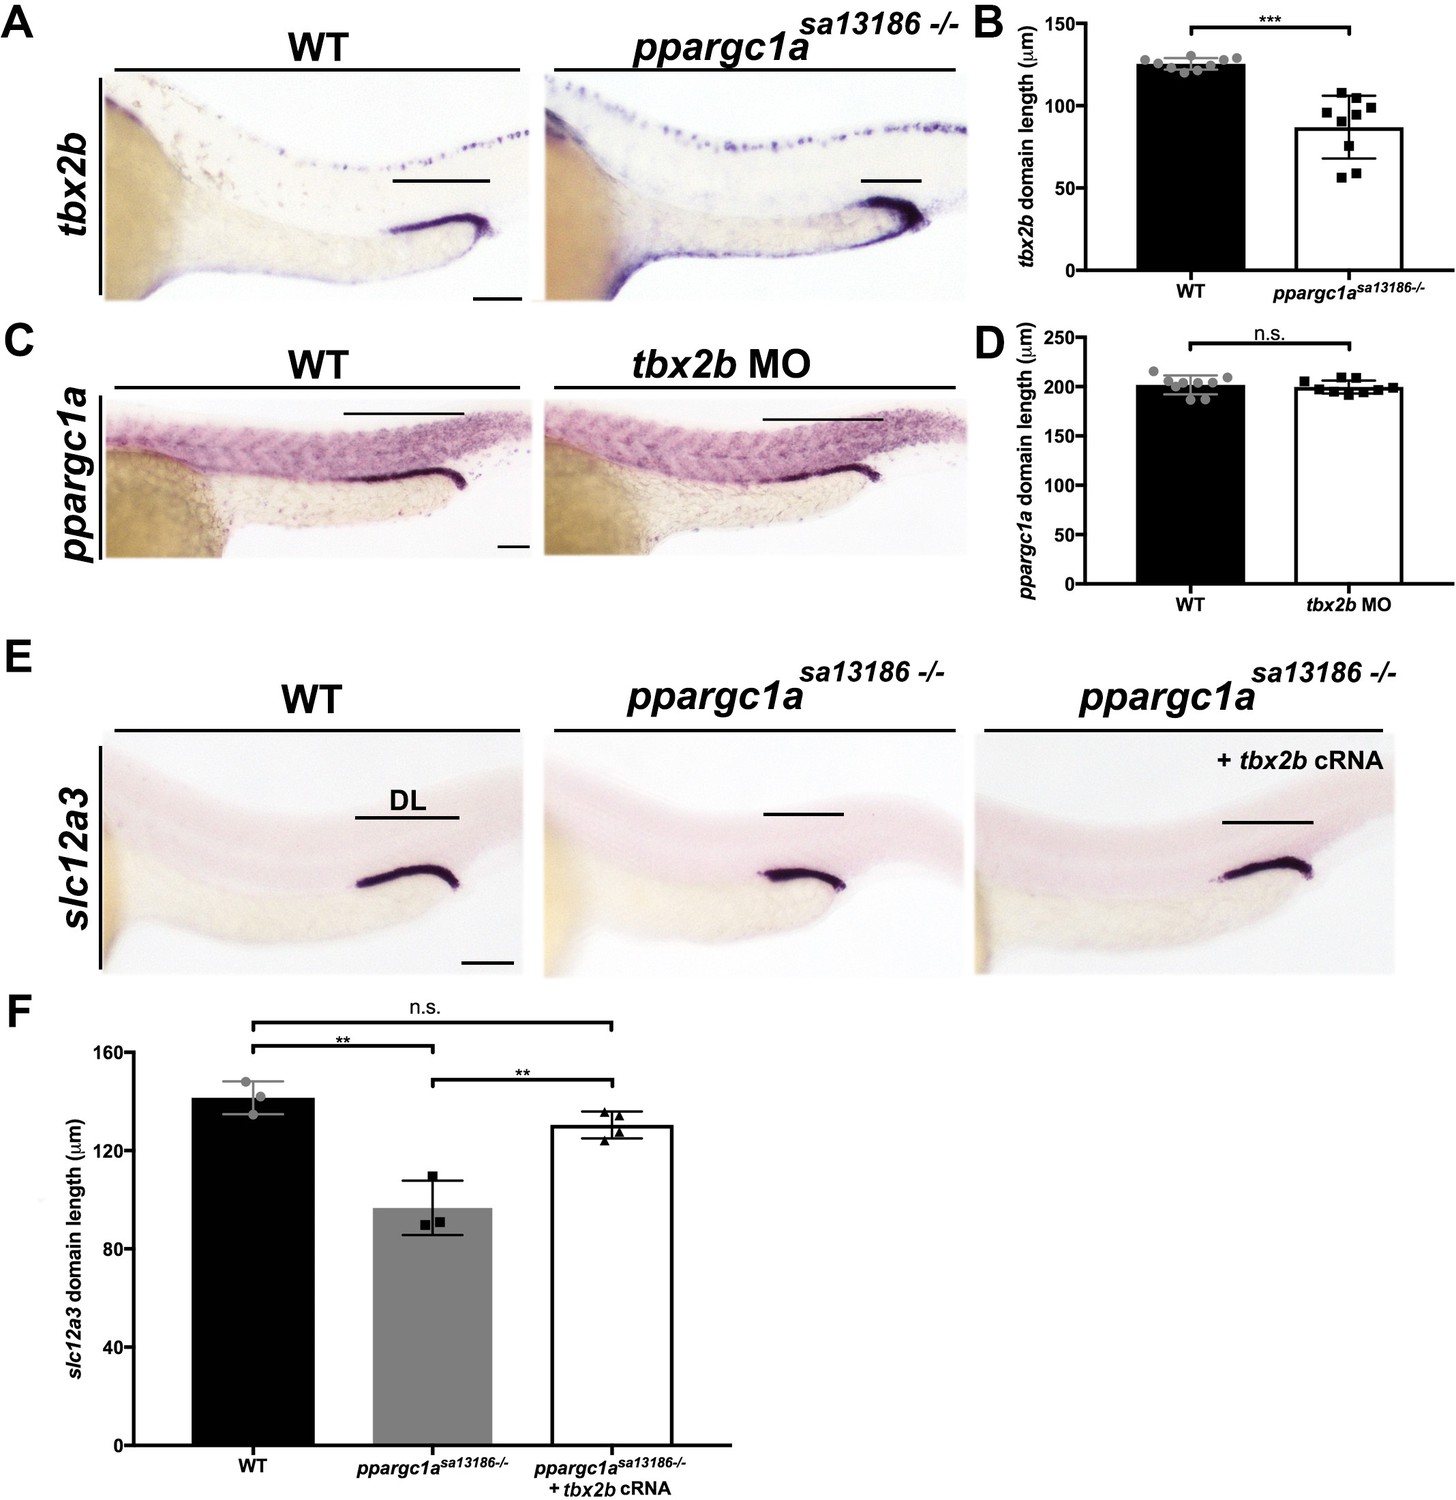
ppargc1a acts upstream of tbx2b to form the DL segment.
(A) WISH for tbx2b (purple) expression in 28 ss WT and ppargc1asa13186-/-zebrafish. Scale bars = 75 μm. (B) Absolute length measurements of tbx2b mRNA expression domains in WT and ppargc1asa13186-/- zebrafish. (C) ppargc1a expression in WT and tbx2b MO injected 28 ss zebrafish. Scale bars = 65 μm. (D) Absolute length measurements of ppargc1a expression domain in WT and tbx2b MO injected zebrafish. (E) WISH at 28 ss for slc12a3 (purple) in WT, ppargc1asa13186-/-, and ppargc1asa13186-/- injected with tbx2b cRNA. Scale bars = 75 μm. (F) Absolute length measurements of slc12a3 mRNA expression domains in WT, ppargc1asa13186-/-, and ppargc1asa13186-/- + tbx2b cRNA. Data are represented as ±SD, significant by t test, n.s. = not significant, ** = p < 0.01, and *** = p < 0.001.
Figure 5 with 3 supplements
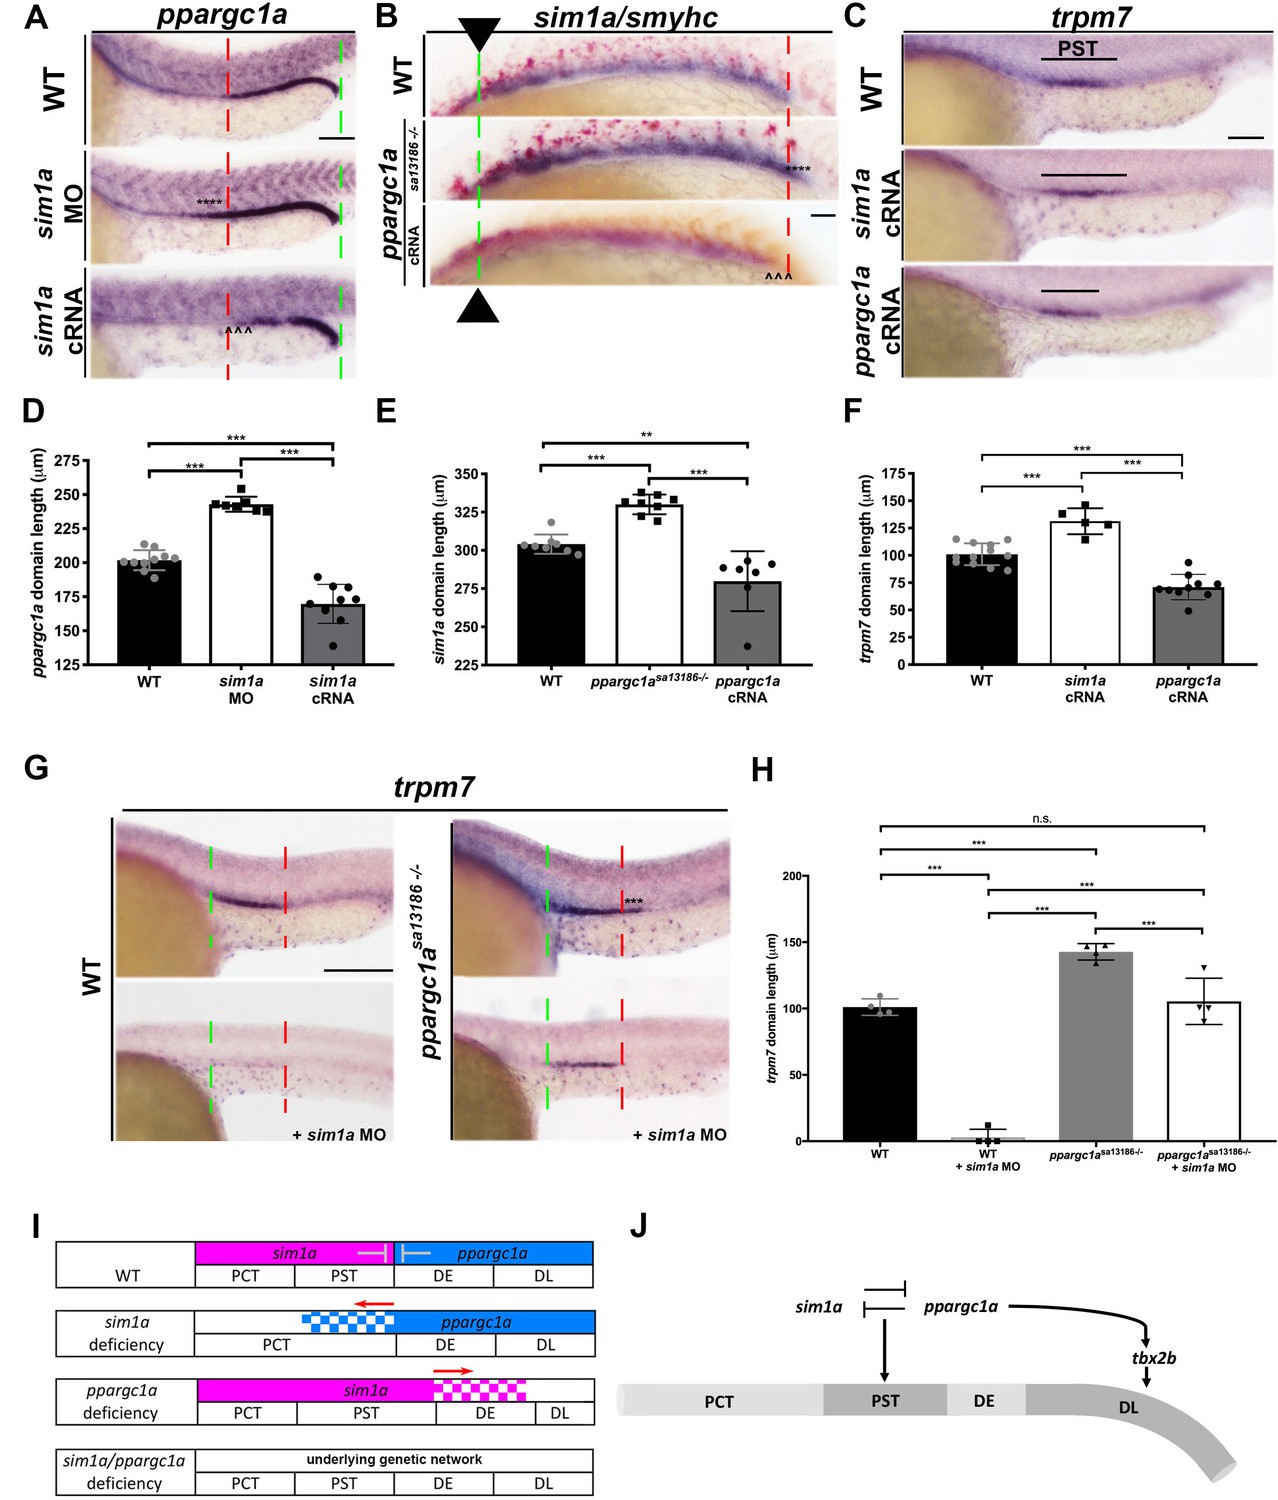
ppargc1a and sim1a have a reciprocal antagonistic relationship that is necessary to negotiate the PST segment boundary.
(A) WISH for ppargc1a (purple) expression at 28 ss in WT, sim1a MO, and sim1a cRNA injected zebrafish. The green and red dashed lines indicate the beginning and the end of WT expression, respectively, the expansion of the ppargc1a domain in sim1a MO is denoted with asterisks, and the reduction in the ppargc1a domain in sim1a cRNA injected is denoted with arrowheads. Scale bars = 60 μm. (B) WISH for sim1a (purple) and smyhc (red) in 20 ss WT, ppargc1asa13186-/-, and ppargc1a cRNA injected zebrafish. Arrows and the dashed green line represent the beginning of the sim1a domain expression, the red dashed line indicate the end of the WT sim1a expression domain to illustrate the expansion of the segment boundary in ppargc1asa13186-/- is denoted with asterisks, and the reduction of the sim1a domain in ppargc1a cRNA injected is denoted with arrowheads. Scale bar = 40 μm. (C) WISH for trpm7 at 28 ss in WT, sim1a cRNA, and ppargc1a cRNA injected zebrafish. Scale bar = 50 μm (D) Absolute length measurements of the ppargc1a domain in 28 ss in WT, sim1a MO injected, and sim1a cRNA injected zebrafish. (E) Absolute length measurements of the 20 ss sim1a domain in WT, ppargc1asa13186-/-, and ppargc1a cRNA injected zebrafish. (F) Absolute length measurements of the trpm7 domain in the 28 ss WT, sim1a cRNA injected, and ppargc1a cRNA injected zebrafish. (G) WISH for trpm7 (PST segment) in WT, WT + sim1 a MO, ppargc1asa13186-/-, and ppargc1asa13186-/- + sim1a MO zebrafish. The green and red dashed lines indicate the beginning and end of WT trpm7 expression domains respectively. Asterisks represent expanded expression domain. Scale bars = 100 μm. (H) Absolute length measurements for the trpm7 domain in WT, sim1a MO injected, ppargc1asa13186-/-, and ppargc1asa13186-/- sim1a MO injected zebrafish. (I) Expression summary table depicting the segment boundaries and expression domains of ppargc1a and sim1a in WT, sim1a-deficient, ppargc1a-deficient, and double-deficient zebrafish. (J) Genetic model illustrating the relationships supported in this study that ppargc1a works upstream of tbx2b to form the DL and has a cross-repressive relationship with sim1a to properly form the segment boundary of the PST. Data are represented as ±SD, significant by t test, n.s. = not significant, *** = p < 0.001.
Figure 5—figure supplement 1
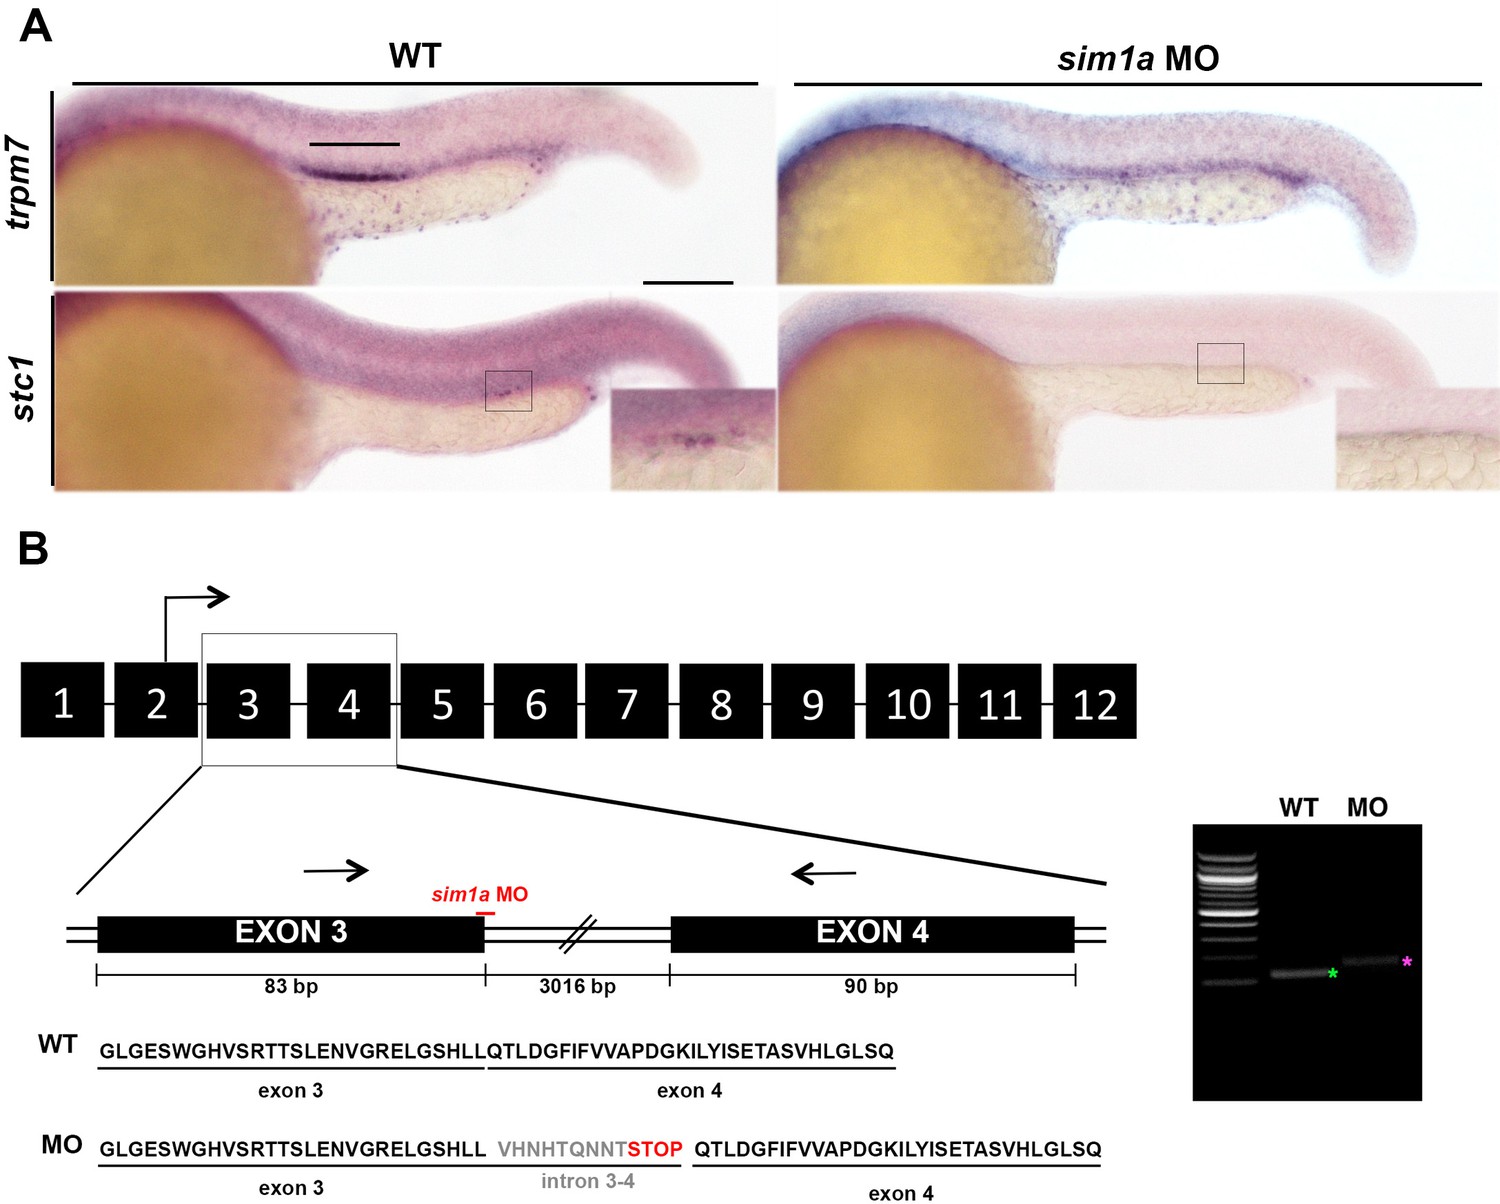
sim1a knockdown was verified by reverse transcriptase PCR and known sim1a deficient phenotypes.
(A) WISH for previously published sim1a deficient phenotypes including the PST (top - trpm7) and CS (bottom - stc1) in WT (left) and sim1a MO injected (right) zebrafish. Scale bars = 100 μm. (B) RT-PCR showing a larger band in the sim1a MO lane of the gel and a schematic illustrating the results of sequencing the MO injected band verifying disrupted splicing of the sim1a transcripts.
Figure 5—figure supplement 2
The CS is expanded in ppargc1a-deficient zebrafish.
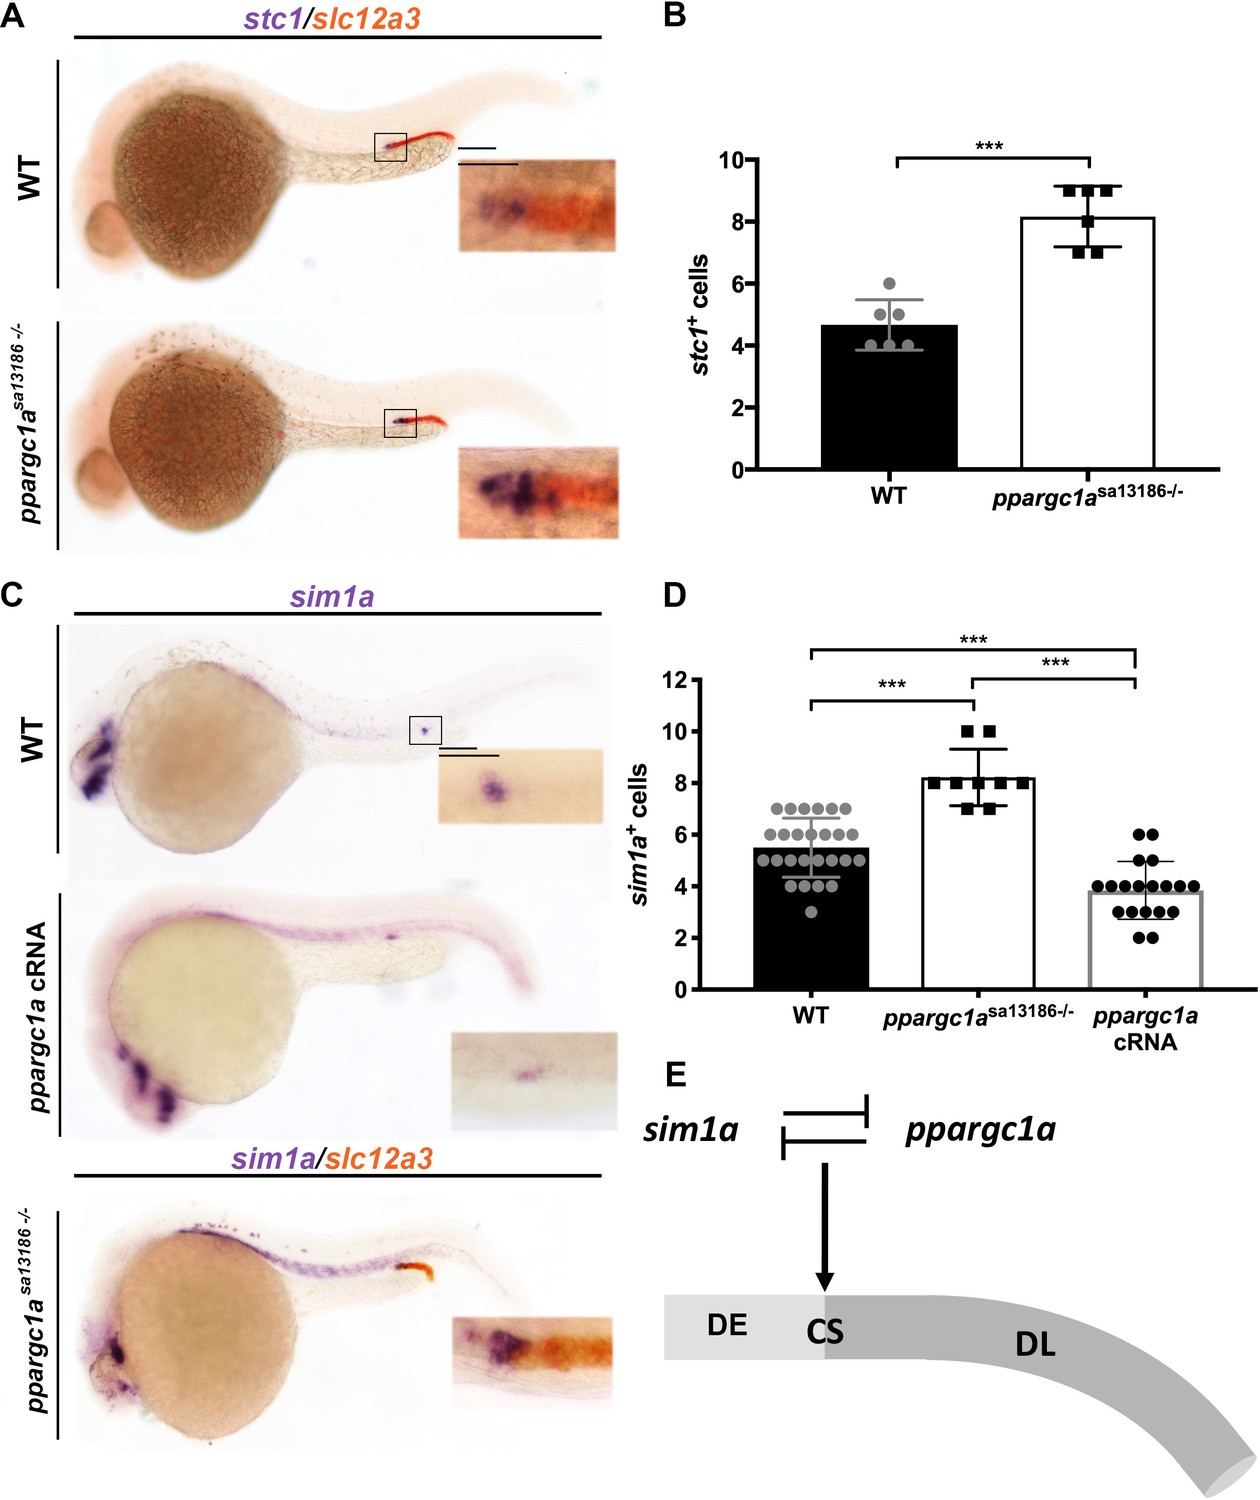
(A) Double WISH for stc1 (purple) and slc12a3 (red) in WT and ppargc1asa13186-/-. The DL was stained as an internal control to ID mutants that were later verified either by sequencing or the restriction enzyme digest previously described. Scale bars = 100 μm (4 x image) and 50 μm (inset). (B) Graph indicating stc1+ cell numbers in WT compared to ppargc1asa13186-/-. (C) WISH at 28 ss for sim1a (purple) in WT (top) and ppargc1a cRNA injected (middle) and double WISH for sim1a (purple) and slc12a3 (red) in ppargc1asa13186-/-. Scale bars = 100 μm (4 x image) and 50 μm (inset). (D) Graph indicating the number of sim1a+ cells in the WT CS compared to ppargc1asa13186-/- and ppargc1a cRNA injected zebrafish. Data are represented as ±SD, significant by t test, *** = p < 0.001. (E) Genetic model depicting the cross-repressive interactions between ppargc1a and sim1a that result in the CS.
Figure 5—figure supplement 3
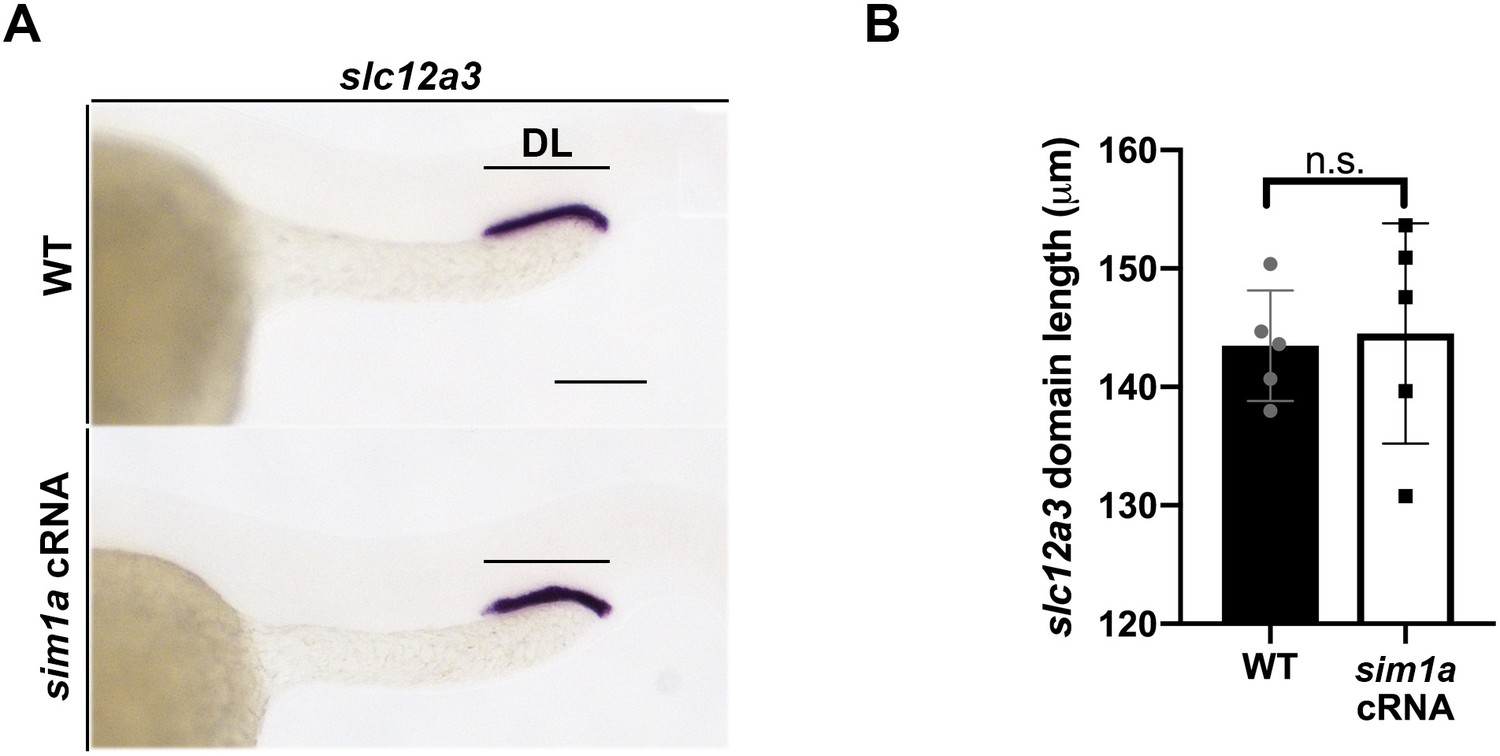
sim1a overexpression does not affect DL segment development.
(A) WISH for slc12a3 (DL) in WT (top) and sim1a cRNA injected 28 ss zebrafish embryos. Scale bar = 100 μm. (B) Graph indicating the slc12a3 domain length in WT compared to sim1a cRNA overexpression. Data are represented as ±SD, and were not significant by t test, n.s. = not significant.
Tables
Key resources table
| Reagent type (species) or resource | Designation | Source or reference | Identifiers | Additional information |
|---|---|---|---|---|
| Antibody | anti-Caspase-3 (rabbit) | BD Biosciences | 559565 | dilution 1:100 |
| Antibody | phospho-Histone H3 (Ser10) (rabbit) | Millipore | 06–570 | dilution 1:200 |
| Antibody | Alexa Fluor anti-rabbit secondary (goat) | Invitrogen | A11037 | dilution 1:500 |
| Chemical compound, drug | dimethyl sulfoxide (DMSO) | American Bioanalytical | AB03091-00100 | |
| Chemical compound, drug | bezafibrate | Enzo Life Sciences | BML-GR211-0001 | |
| Genetic reagent (Danio rerio) | ppargc1asa13186 zebrafish line | Zebrafish International Resource Center (ZIRC) | ZMP:sa13186 | Zebrafish Mutation Project allele sa13186 |
| Commercial assay or kit | PCR purification kit | Qiagen | 28106 | |
| Commercial assay or kit | NdeI restriction endonuclease enzyme | New England BioLabs | R0111S | |
| Commercial assay or kit | TRIzol Reagent | Invitrogen | 15596018 | |
| Commercial assay or kit | qScript cDNA SuperMix | QuantaBio | VWR 101414–106 | |
| Commercial assay or kit | PerfeCTa SYBR Green SuperMix with ROX | QuantaBio | VWR 101414–160 | |
| Chemical compound, drug | mMESSAGE mMACHINE SP6 Transcription kit | Ambion | AM1340 | |
| Other | custom antisense morpholino oligonucleotide | Gene Tools, LLC | ppargc1a ATG MO1 (ZFIN: MO1-ppargc1a) | 5’–CCTGATTACACCTGTCCCACGCCAT–3’ |
| Other | custom antisense morpholino oligonucleotide | Gene Tools, LLC | ppargc1a SB MO1 | 5’–GGAGCTTCTTCAGCTACAAACAGAG–3’ |
| Other | custom antisense morpholino oligonucleotide | Gene Tools, LLC | ppargc1a SB MO2 | 5’–GGTGAGCAGCTACCTTGGCAACAGC–3’ |
| Other | custom antisense morpholino oligonucleotide | Gene Tools, LLC | tbx2b MO | 5’–CCTGTAAAAACTGGATCTCTCATCGG–3’ |
| Other | custom antisense morpholino oligonucleotide | Gene Tools, LLC | sim1a MO | 5’–TGTGATTGTGTACCTGAAGCAGATG–3’ |
| Software, algorithm | Nikon Elements imaging software | Nikon | ||
| Software, algorithm | Graphpad Prism 8 | GraphPad Prism (https://www.graphpad.com/scientific-software/prism/) | ||
| Software, algorithm | ImageJ | ImageJ (https://imagej.nih.gov/ij/) |
Additional files
-
Transparent reporting form
- https://doi.org/10.7554/eLife.40266.023
Download links
A two-part list of links to download the article, or parts of the article, in various formats.
Downloads (link to download the article as PDF)
Open citations (links to open the citations from this article in various online reference manager services)
Cite this article (links to download the citations from this article in formats compatible with various reference manager tools)
ppargc1a controls nephron segmentation during zebrafish embryonic kidney ontogeny
eLife 7:e40266.
https://doi.org/10.7554/eLife.40266


