Functionally defined white matter of the macaque monkey brain reveals a dorso-ventral attention network
- The Rockefeller University, United States
- Indiana University, United States
- University of Bremen, Germany
Figures
Figure 1 with 1 supplement
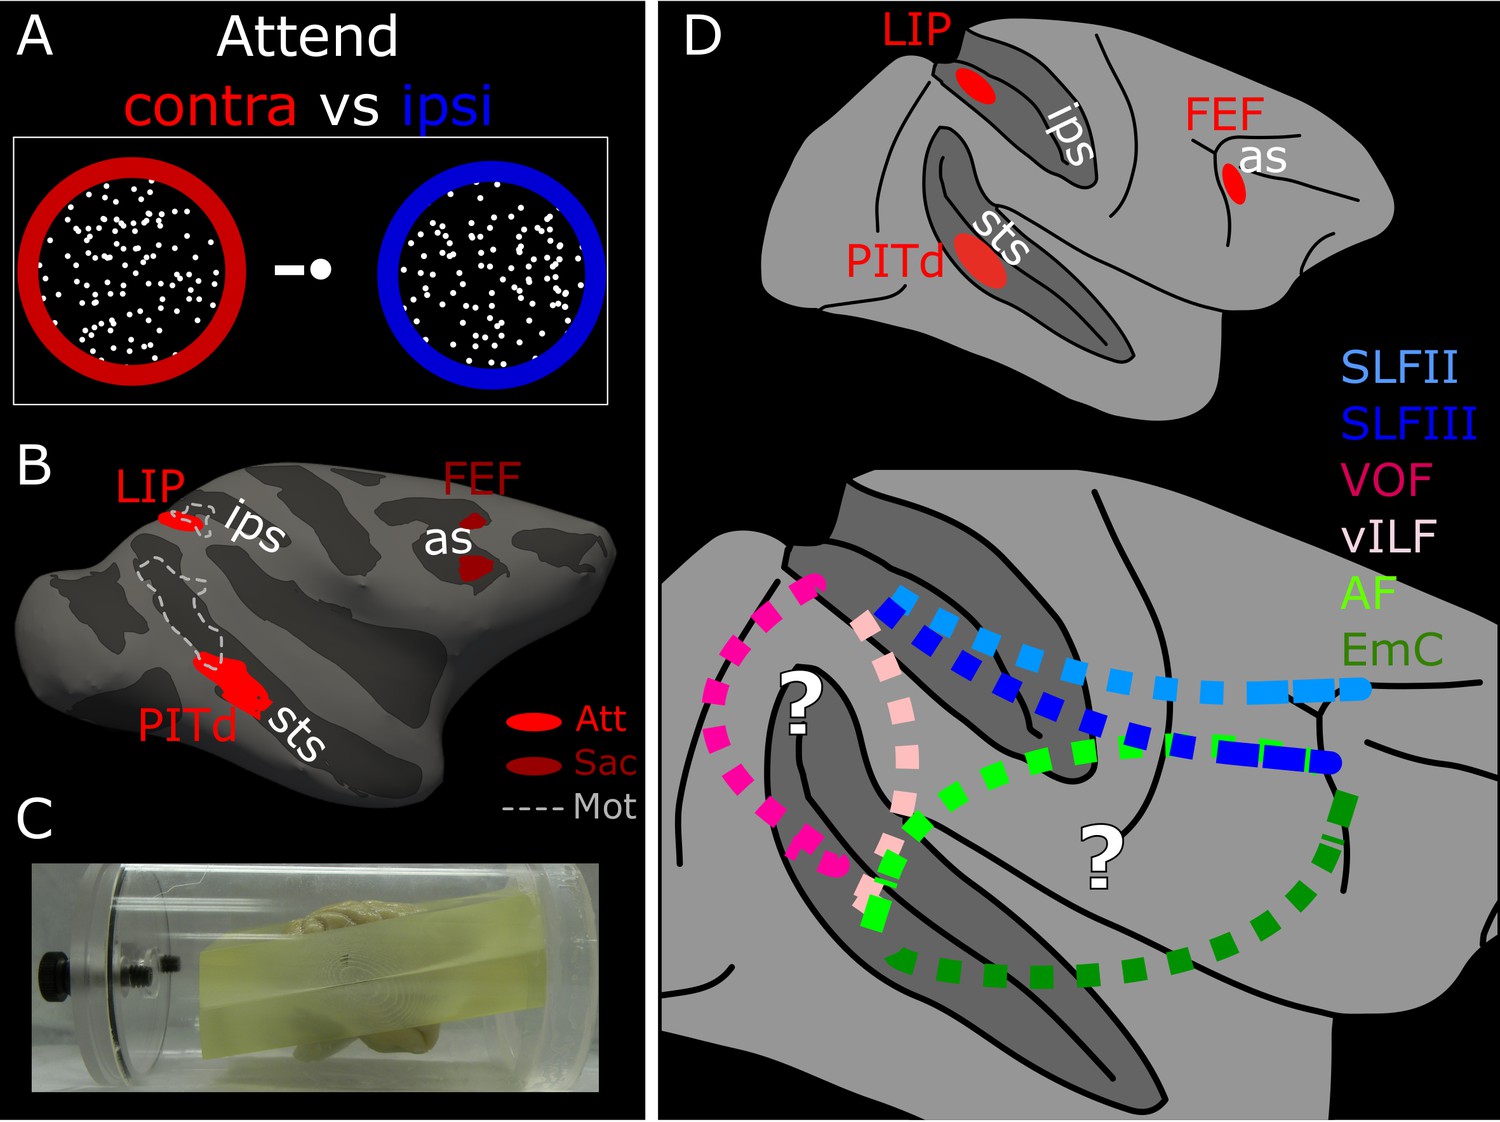
Functionally guided identification of the putative endogenous attention network.
(A) Schematic of the two attentional conditions of the motion discrimination task performed during functional scanning. Monkeys alternated between paying attention to the right, passive fixation, and paying attention to the left. During the ‘right’ and ‘left’ blocks, subjects had to detect and discriminate a motion event at the cued location, while ignoring similar visual stimulation at the irrelevant location. (B) Schematic of the ROIs defined by attentional modulation, motion selectivity, and saccade modulation overlaid on the inflated right hemisphere of Monkey 1 (M1). PITd and LIP (light red) were significantly more activated by performance of the attentive motion-discrimination task on the right as compared to the left hemifield; FEF (dark red) was significantly more activate by performance of the saccade task as compared to fixation; dashed-line areas were significantly more activated during passive fixation of moving stimuli as compared to static stimuli. (C) Custom-made brain mold used to perform ex-vivo diffusion imaging. The device holds the brain with the anterior and posterior commissure aligned to the bore. (D) Whole brain model of the attention network of the Macaque as defined by functional activation in (Stemmann and Freiwald, 2016) (top). Schematic of putative connections and the hypothetical pathways between attention nodes PITd, LIP and FEF (bottom). sts, superior temporal sulcus; ips, intraparietal sulcus; as, arcuate sulcus; PITd, Posterior Infero-Temporal dorsal area; LIP, Lateral Intraparietal area; FEF, Frontal Eye Field; AF, Arcuate Fasciculus; EmC: Extreme Capsule; vILF: vertical branch of the Inferior Longitudinal Fasciculus; SLF: Superior Longitudinal Fasciculus; VOF, Vertical Occipital Fasciculus. See also Figure 1—figure supplement 1, and Supplementary file 1.
Figure 1—figure supplement 1
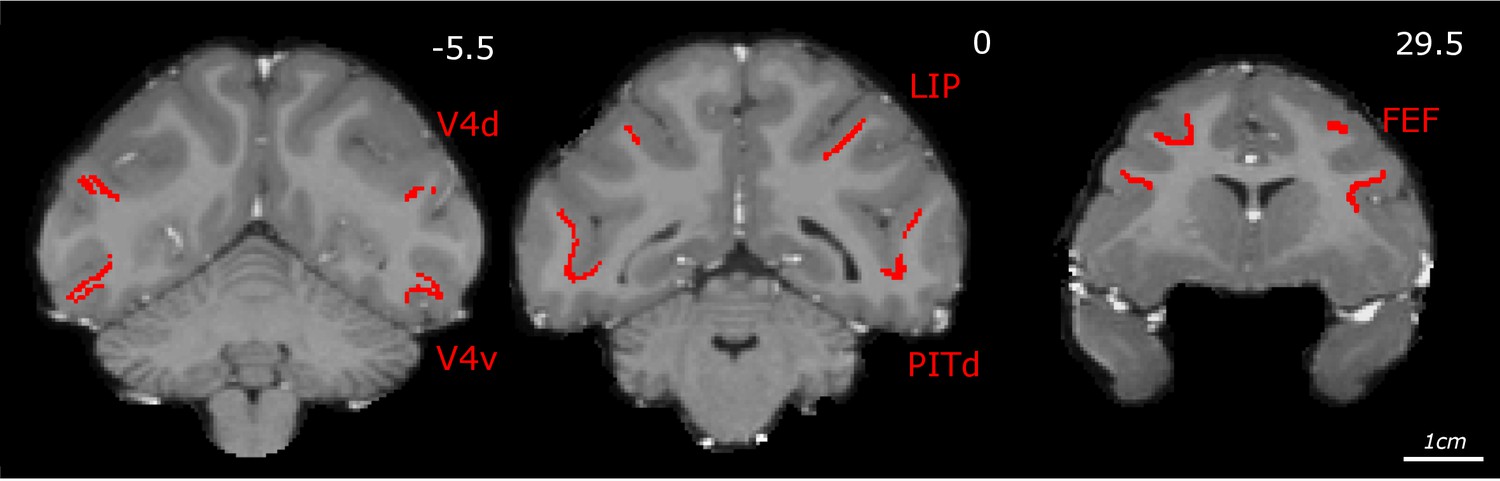
Functional cortical ROIs.
Coronal view of functional ROIs as described in Stemmann and Freiwald (2016), overlaid on in-vivo T1 images of subject M1. ROIs were projected at the intersection between gray and white matter, inflated, and transferred into the diffusion space through linear and non-linear warping. These functional ROIs have been used to identify the monkey attention network. Areas V4d and V4v have been used to define fVOF described in Figure 3-figure supplement 2, Figure 4-figure supplement 3.
Figure 2 with 1 supplement

Macaque dorso-ventral attentional connections identified using Principal Diffusion Directions.
Schematic of the macaque attention network identified with fMRI (top panel); the dashed white line indicates the section plane of axial images in B; white solid line indicates section planes of coronal images in A and C. Bottom panel shows a coronal-plane image of the Fractional Anisotropy (FA) map of subject M1; bright voxels in the FA map indicate anisotropic voxels. Note the clear separation between different association fascicles, labelled in the right hemisphere. CB: Cingulum Bundle CC: corpus callosum; MdLF: Middle Longitudinal Fasciculus; ILF: Inferior Longitudinal Fasciculus; SLF: Superior Longitudinal Fasciculus (branch I, II, III); SS: sagittal stratum. In the left hemisphere, original functional ROIs have been projected at the intersection between gray and white matter for PITd and LIP (red areas). ROIs have been then inflated, and used as seeds for tractography; (B) Axial-plane images of the FA map of subject M1 (left). Principal Diffusion Direction (PDD) map of subject M1 (right). Colors indicate the PDD in individual voxels; blue: superior-inferior, S-I; green: anterior-posterior, A-P; red: left-right, L-R; the position and properties of fascicle departing from PITd is visible in the white matter posterior to the STS (yellow dashed outlines were segmented automatically using the Matlab Image Processing Toolbox (RRID:SCR_001622), Color Thresholder (channel settings: R < 75; G < 75; B > 50). (C) Multiple coronal-plane images of the PDD map of subject M1. IOS: Inferior Occipital Sulcus; IPS: Inferior Parietal Sulcus; LF: Lateral Fissure; STS: Superior Temporal Sulcus. See also Figure 2—figure supplement 1.
Figure 2—figure supplement 1
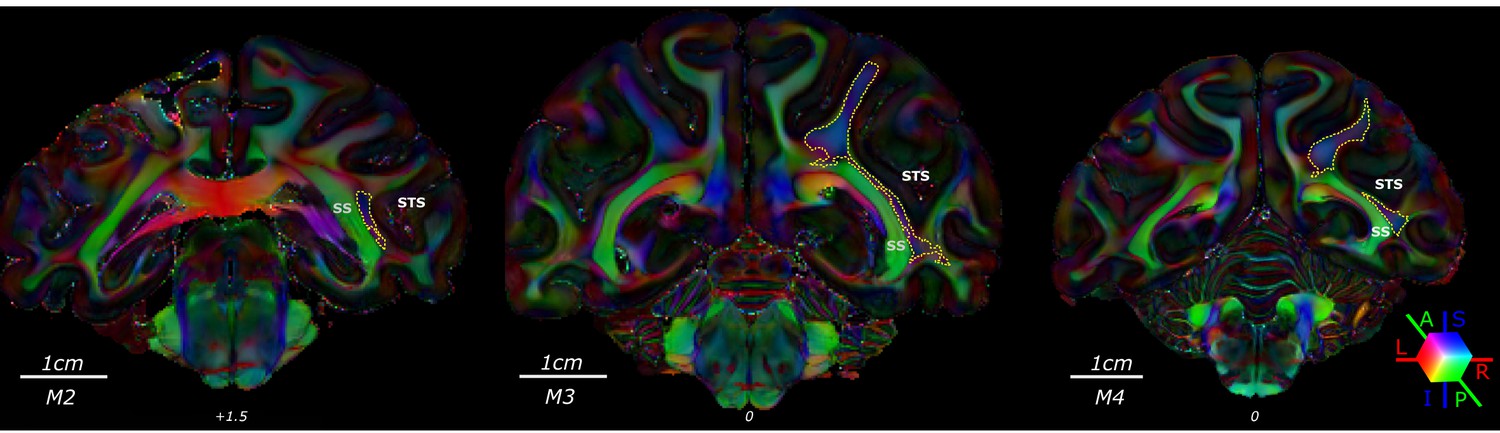
Functionally guided inspection of white matter between PITd and LIP.
Coronal-plane images of the PDD maps of subject 2-4; here segmented dorso-ventral tracts compatible with a direct connection between LIP-PITd; this procedure was guided by the position of functional mapping of attention areas; yellow dashed lines were automatically segmented by using Matlab Image Processing Toolbox (RRID:SCR_001622), Color Thresholder (channel settings: R<75; G<75; B>50); the position and properties of LIP-PITd connection is clearly visible in all subjects.
Figure 3 with 3 supplements
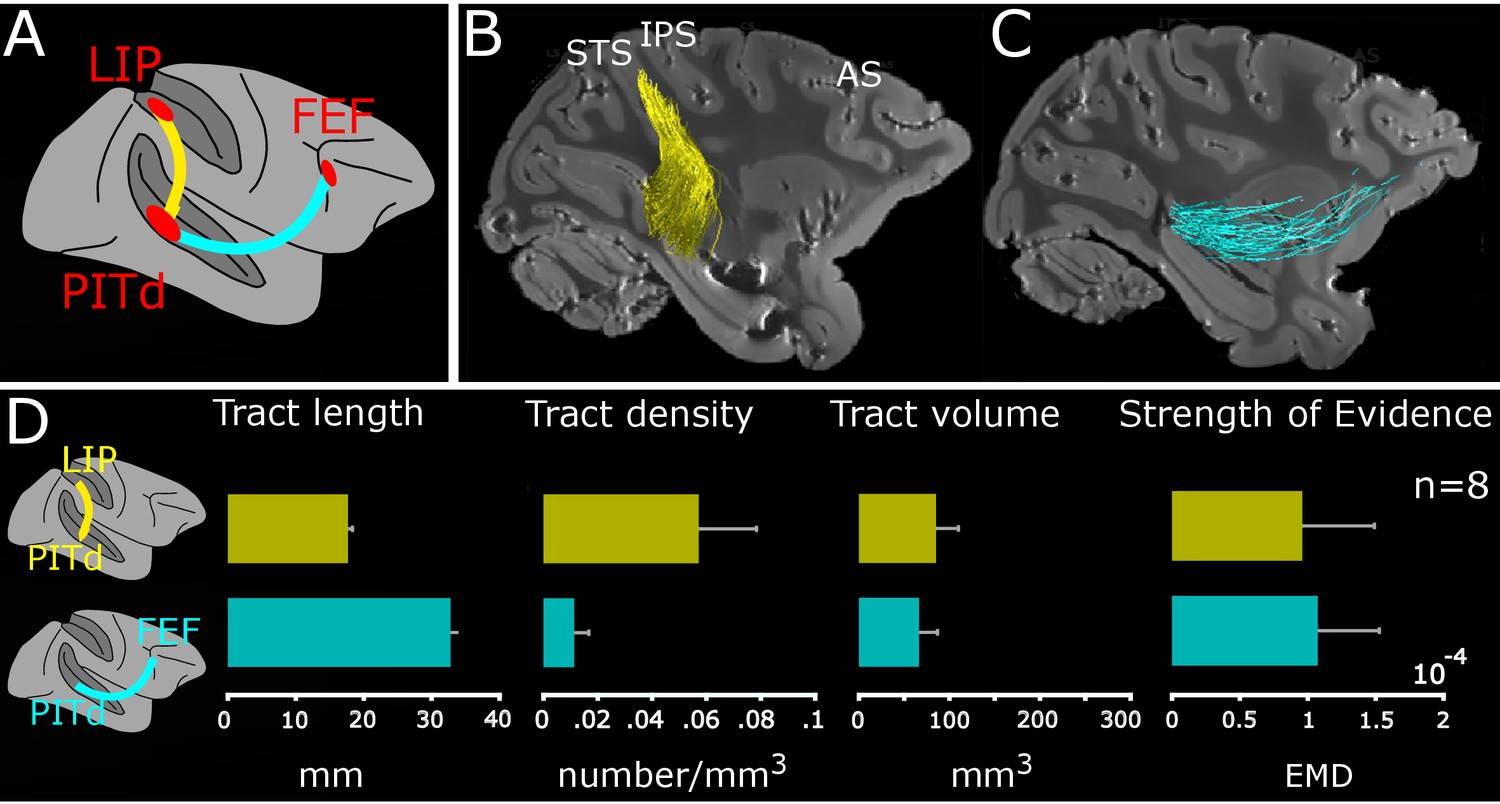
Macaque dorso-ventral attentional connection identified using tractography.
(A) Schematic connections; PITd-LIP: yellow trace; PITd-FEF: cyan trace. (B-C) Sagittal-view of PITd-to-LIP and PITd-to-FEF connections overlaid on non-diffusion weighted (b = 0) image for M1. Conventions as in Figure 1. (D) Average tract length (mm); tract density (number of streamlines/mm3), tract volume (mm3) and strength of evidence are shown for functional tracts of all subjects. Error bars represent ±1 standard error of the mean across the eight hemispheres. See also Figure 3—figure supplements 1, 2 and 3.
Figure 3—figure supplement 1
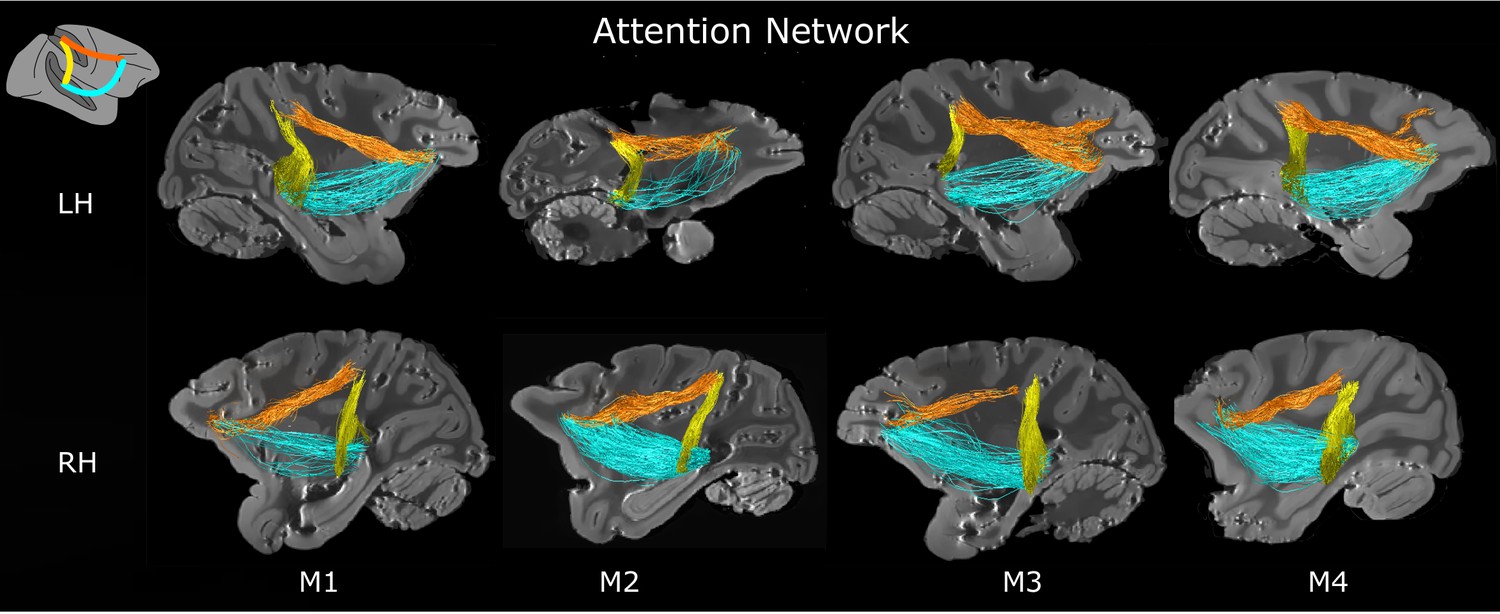
Tract properties are consistent across subjects and tracking methods.
Attentional connections identified using functional ROI-to-ROI tractography overlaid on non-diffusion weighted (b=0) image are reported for the right and left hemispheres of subjects M1, M2, M3, and M4. Yellow streamlines: PITd-LIP; cyan streamlines: PITd-FEF; orange streamlines: LIP-FEF.
Figure 3—figure supplement 2
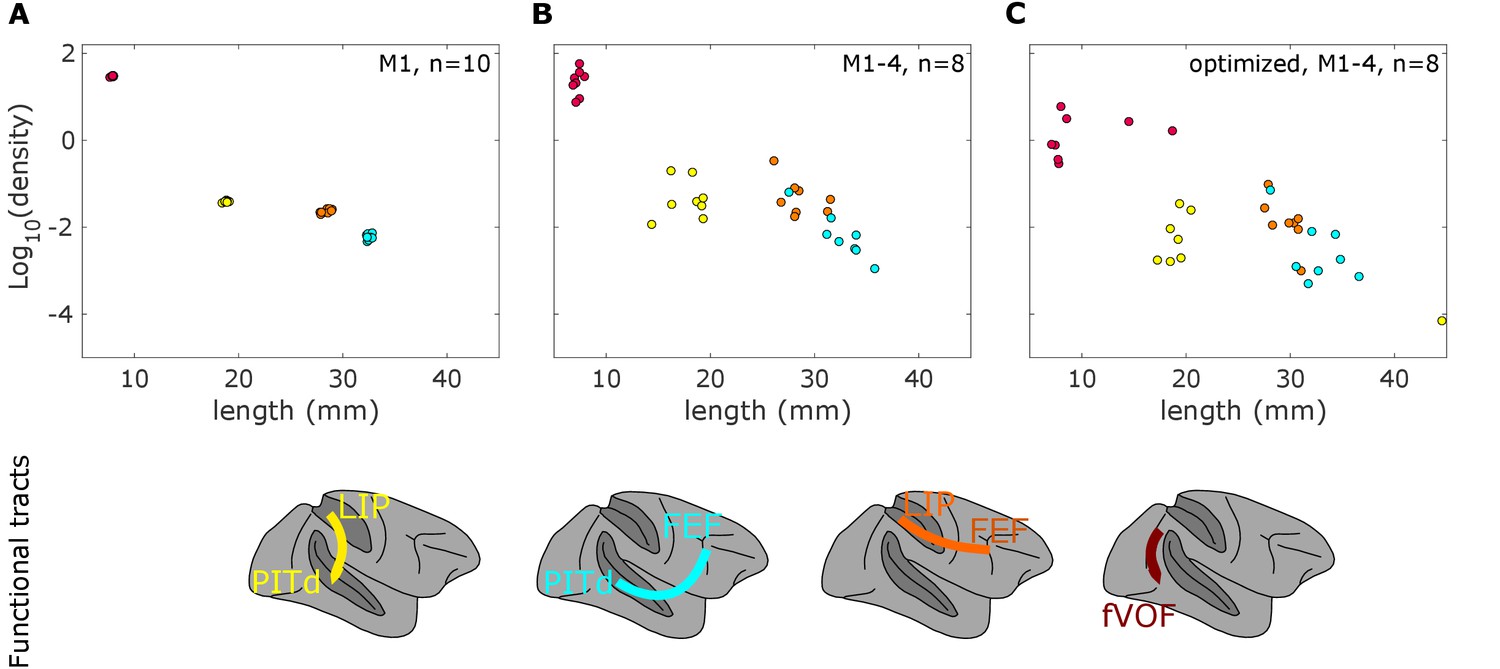
quantitative anatomical properties.
Tract density (log scale) is correlated with tract length in different experimental conditions. (A) Variability within subject M1. The 10 repetitions of probabilistic tractography of left hemisphere of subject M1 are reported for the attentional tracts and the fVOF. (B) Variability across subjects and hemispheres. Note that tract quantitative properties are consistent across subjects. (C) Variability across subjects and hemispheres after connectome optimization.
Figure 3—figure supplement 3
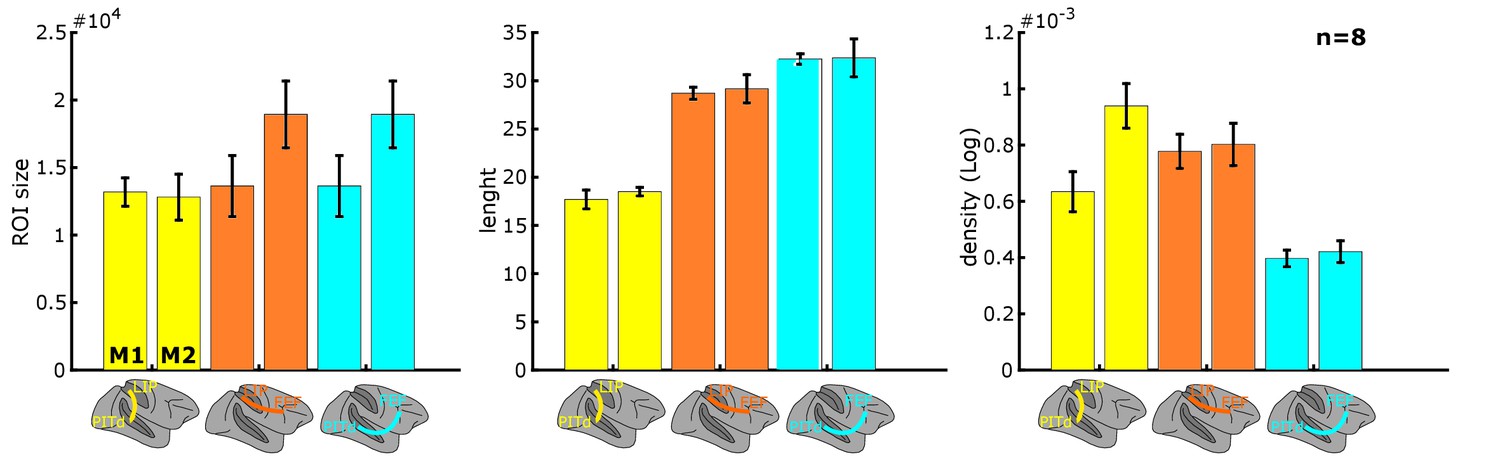
Consistency across attentional ROI sets.
Attentional ROIs from M1 and M2 showed similar size; for tracking purposes, they were aligned to the high-resolution B0 diffusion image of M2-M4 and M1, M3, M4 respectively using the Advanced Normalization Toolbox (Ants). Tracking results were consistent across the two ROI sets as shown by tract length and density.
Figure 4 with 4 supplements
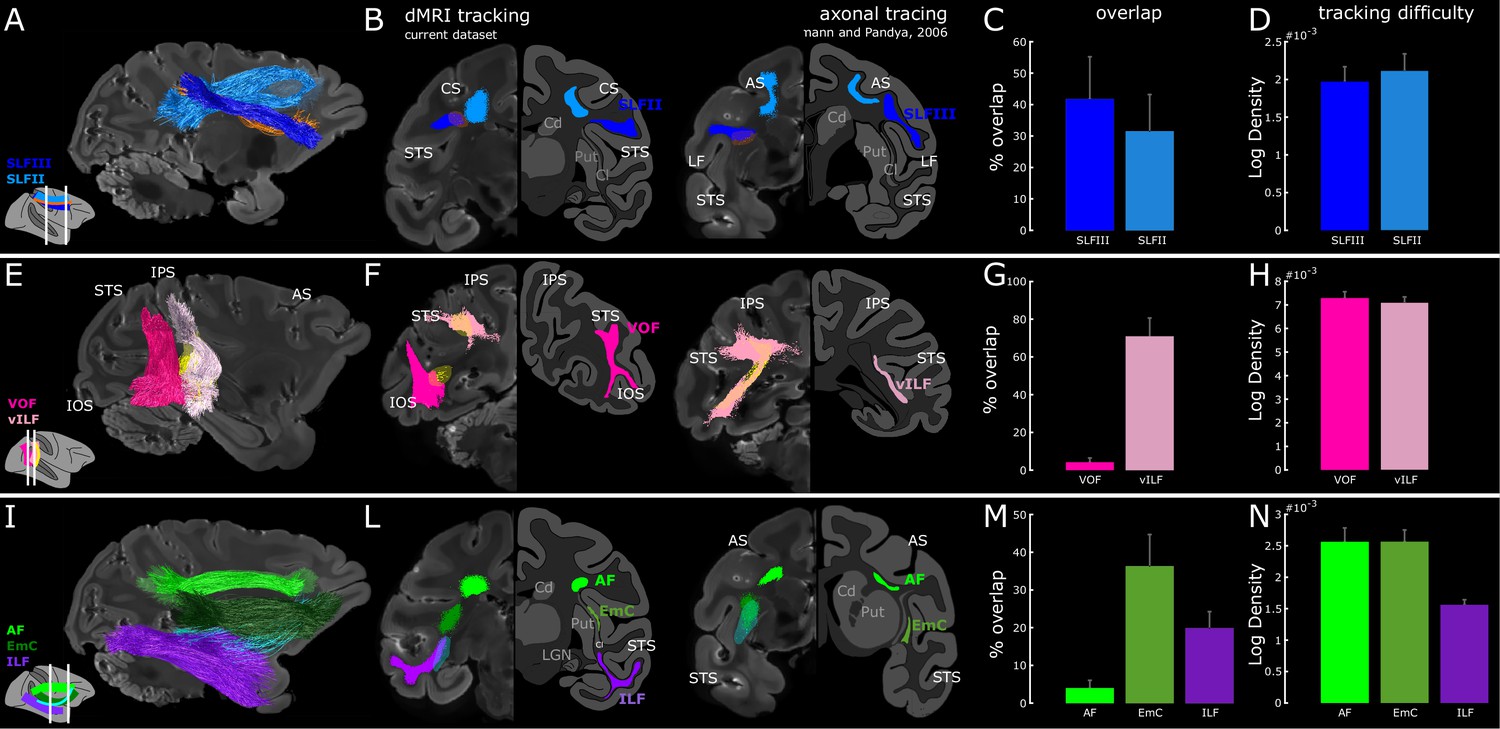
White matter within the vILF, EmC and SLF supports the endogenous attention network.
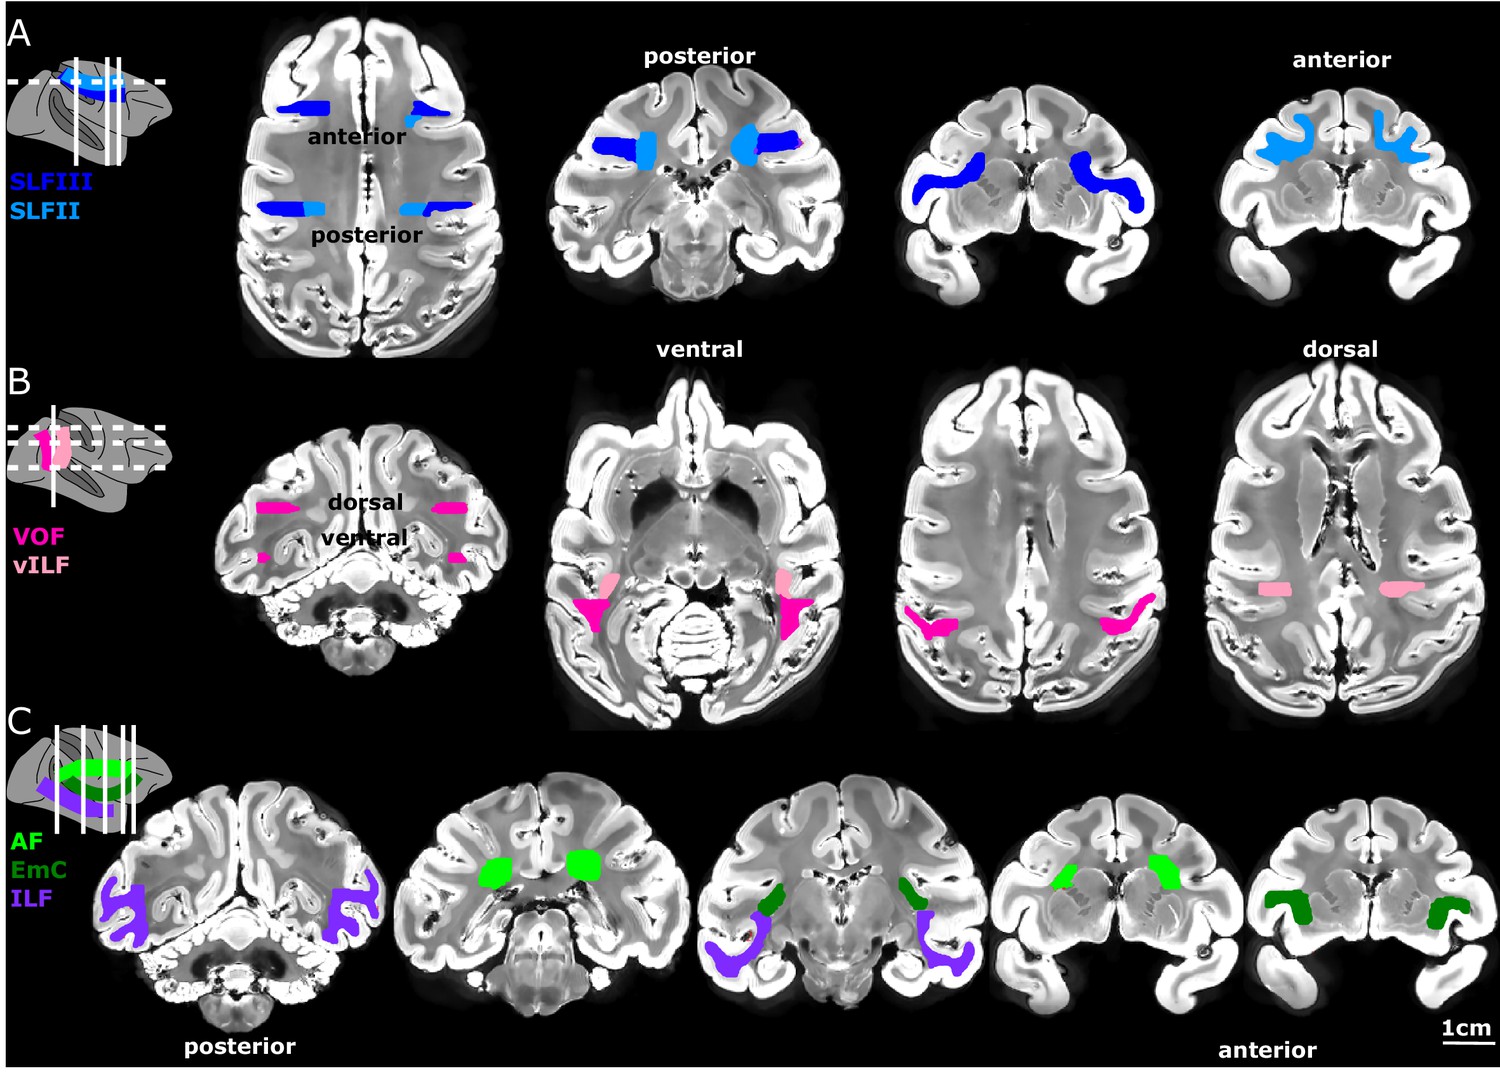
(A) Sagittal view of SLF (dark and light blue) and LIP-FEF (orange) connectivity of subject M1. (B) Two coronal views of FEF-to-LIP connection and the SLF overlaid on the left hemispheres; the right hemispheres represent the schematic of the SLFII and the SLFIII (adapted from (Schmahmann and Pandya, 2006); sections 85,73, p. 542,540). (E) Sagittal view of the VOF, the vILF (dark and light pink), and LIP-PITd (yellow) connections of subject M1. (F) Two coronal views of PITd-to-LIP connection and the VOF overlaid on the left hemispheres; the right hemispheres represent the schematic of the vertical limb of the ILF (adapted from (Schmahmann and Pandya, 2006); section 129,105, p. 549,546). Note that VOF was recently described as a separate fasciculus in the monkey (Takemura et al., 2017) and previously called vILF in Schmahmann and Pandya (2006); some inconsistency between tracer and diffusion literature, as well as between human and NHP literature still exists. While in the tracer literature the vertical connectivity in the posterior part of the brain is typically associated with vILF, in the diffusion imaging literature and especially in humans, several vertical tracts have been defined (see Discussion for more details). (I) Sagittal view of the ILF (violet), EmC (dark green), AF (light green), and PITd-FEF (cyan) connectivity of subject M1. (L) Two coronal-views of PITd-to-FEF connection and ILF; the right hemispheres represent the schematic of the horizontal limb of the ILF and of the Extreme Capsule (adapted from (Schmahmann and Pandya, 2006); section 85,57, p. 542,538). (C,G,M) Quantitative overlap between functionally defined attentional tracts and hypothesized anatomical pathways. (D,H,N) Tracking difficulty as measured through tract density (streamlines/mm3). Cd: Caudate nucleus; Cl: claustrum; LGN: Lateral Geniculate Nucleus; Put: Putamen. Other conventions as in Figures 1–2. See also Figure 4—figure supplements 1, 2, 3 and 4.
Figure 4—figure supplement 1
Anatomical waypoint ROIs.
(A) Axial and coronal view of the waypoint ROIs used to identify the SLFII and SLFIII overlaid on non-diffusion weighted (b=0) image of subject M1. We used two coronal inclusion waypoint ROIs for each tract; two coronal exclusion waypoint ROIs were also used for the AF(Schmahmann & Pandya, 2006; Thiebaut de Schotten et al., 2011). (B) Coronal and; axial view of waypoint ROI used to identify the VOF and vILF (Schmahmann et al., 2007; Takemura et al., 2017). (C) Coronal view of the waypoint ROIs used to identify the ILF, the EmC, and the AF. We used two coronal inclusion waypoint ROIs for each tract. Additional exclusion waypoint ROIs were used to exclude the Sagittal Stratum from ILF (Schmahmann et al., 2007; Takemura et al., 2017), to exclude the subcortical white matter and extreme/external capsule from AF (Eichert et al., 2018), and to exclude posterior terminations from EmC (Mars et al., 2016).
Figure 4—figure supplement 2
Tract properties are consistent across subjects and tracking methods.
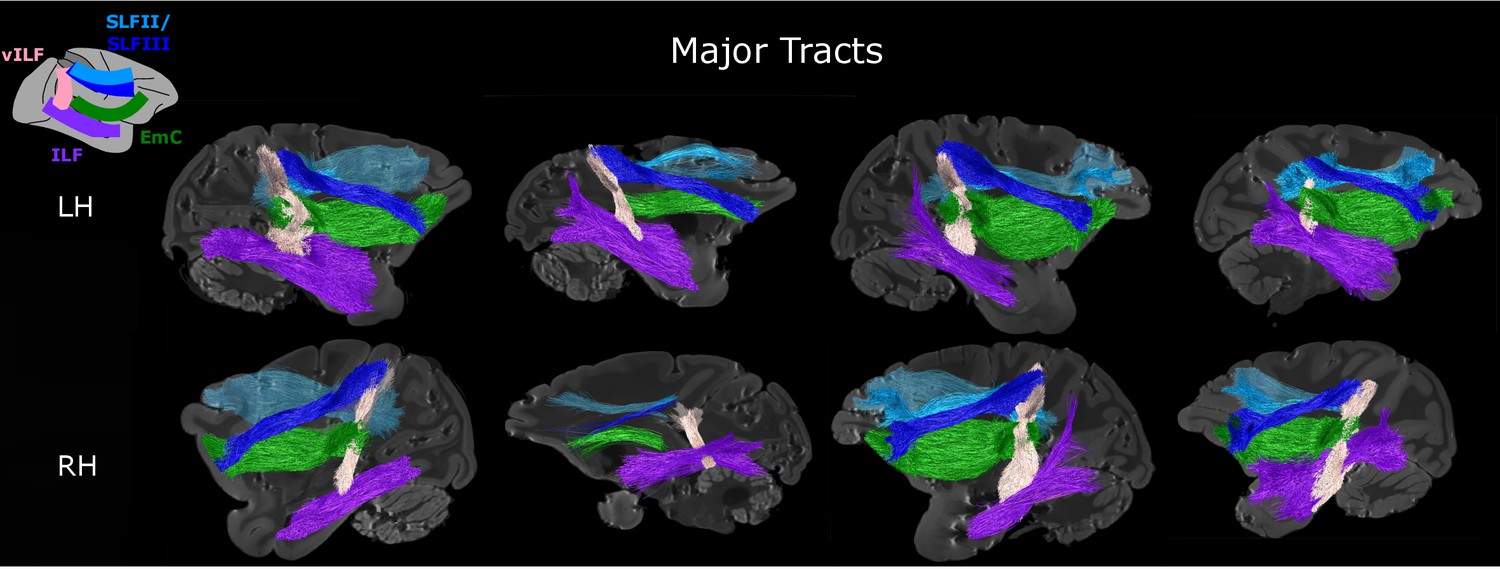
Anatomical connections identified using way-point ROI tractography overlaid on non-diffusion weighted (b=0) image are reported for the right and left hemispheres of subjects M1, M2, M3, and M4. vILF (pink), SLFII (light blue), SLFIII (dark blue), EmC (green), and ILF (violet) identified using waypoint ROIs are reported for the right and left hemispheres of subjects M1-4.
Figure 4—figure supplement 3
The VOF identified through ROI-to-ROI and waypoint tracking is separated from PITd-LIP tract.
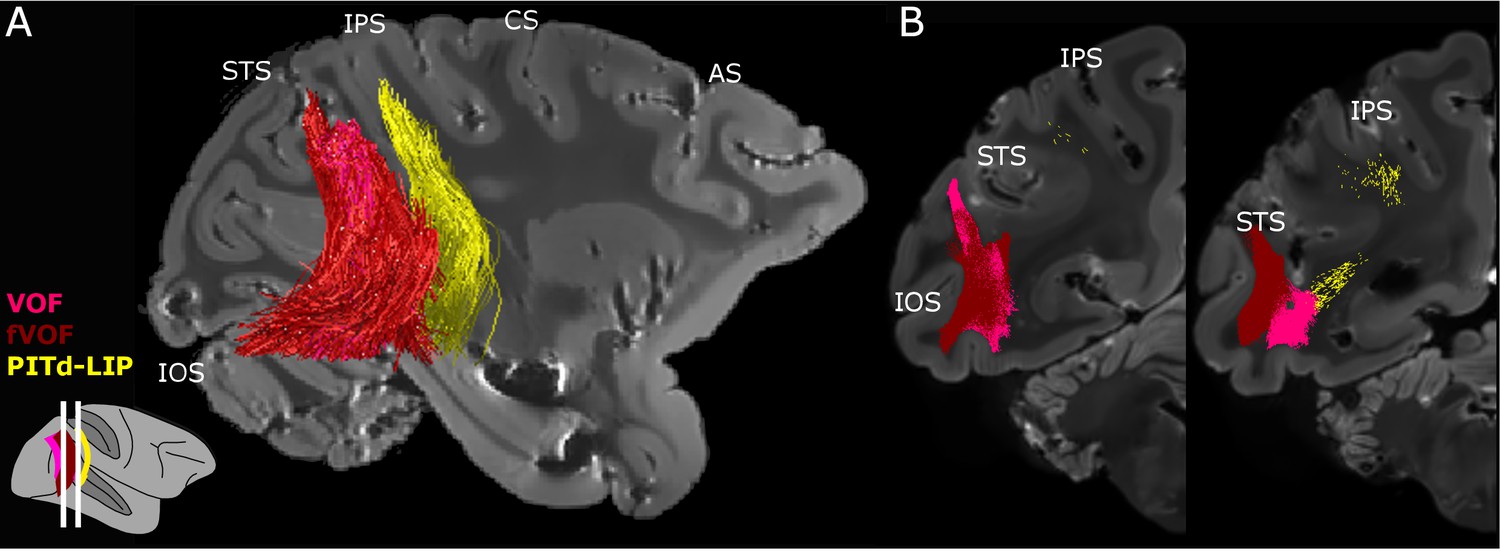
(A-B) Sagittal and coronal views of left the VOF and LIP-PITd connection of subject M1; Yellow streamlines represent PITd-LIP connection as identified by using functionally defined ROI-to-ROI tracking. Pink streamlines represent the VOF defined by anatomical waypoints, whereas red streamlines represent the fVOF defined by functional ROI-to-ROI tracking between V4d and V4v. Note that while PITd-LIP and V4d-V4v tracts remained completely separated, V4d-V4v and the VOF were instead completely intermingled and indistinguishable. This means that connections between the dorsal and ventral components of V4 represent an important portion of the VOF.
Figure 4—figure supplement 4
Connectivity fingerprints of posterior STS areas.
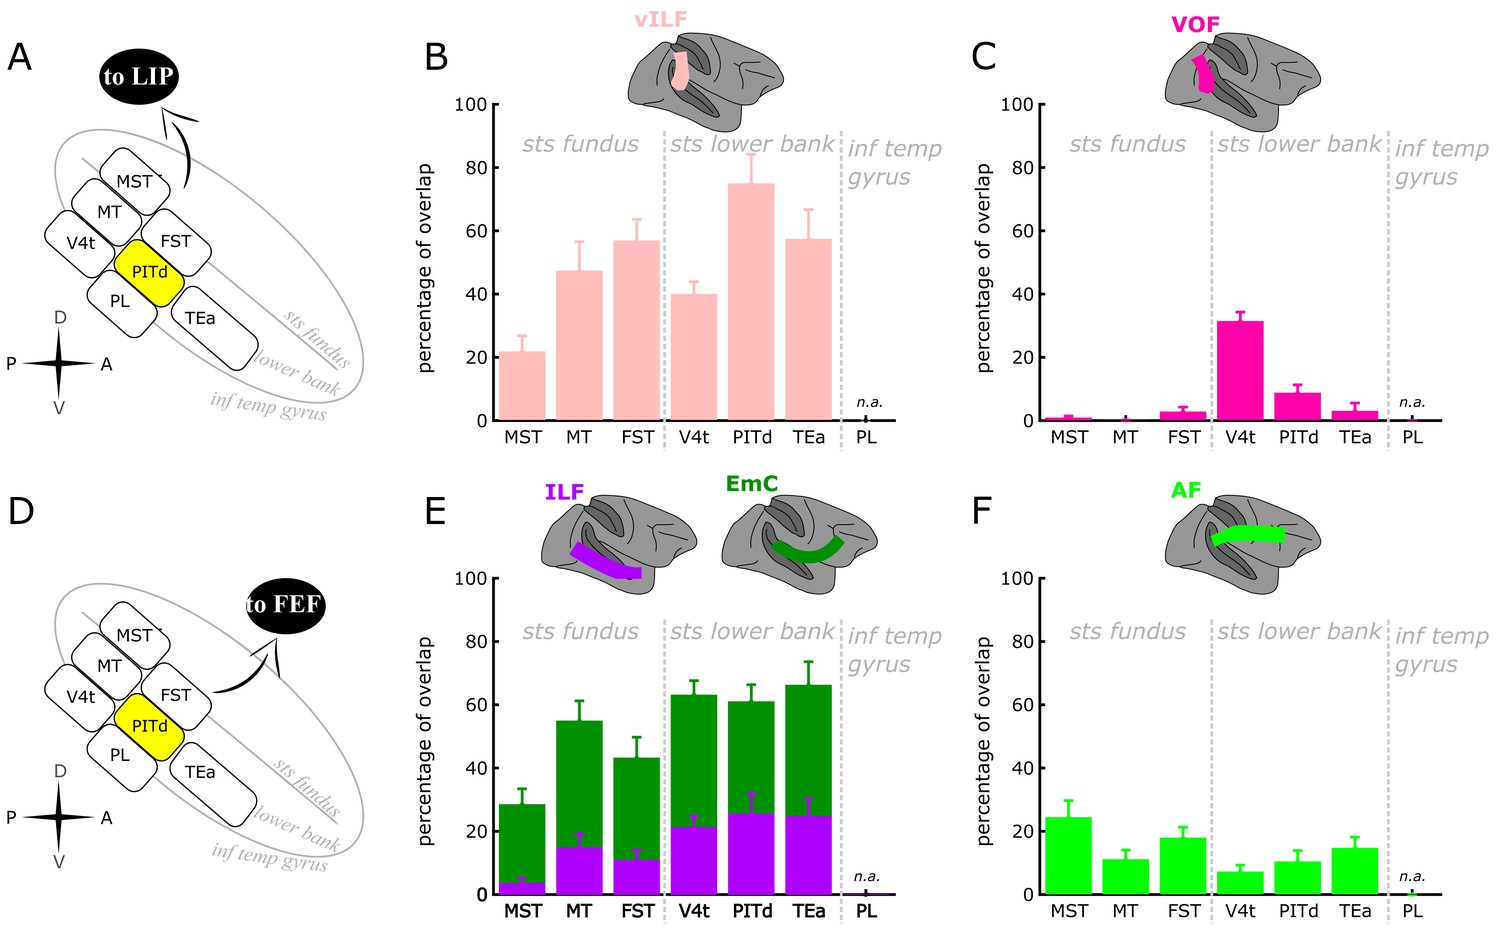
(A,D) functional and anatomical parcelation of the posterior-STS. FST: fundus of superior temporal sulcus; MST: medial superior temporal area; MT: middle temporal area; PL: posterior lateral face area; TEa, anterior portion of temporal areas; V4t: visual area 4 transition. B-C. Connectivity pattern from different posterior-STS areas to LIP is analyzed as percentage of overlap with the major anatomical tracts vILF and VOF. Note that PITd showed the highest degree of overlap with vILF; all areas, except for V4t, showed a similar degree of overlap with VOF, consistent with previous findings in humans defining the VOF as mostly confined to occipital areas. E-F. Connectivity pattern from different posterior-STS areas to FEF is analyzed as percentage of overlap with the major anatomical tracts ILF and EmC, or AF. Note that PITd, similarly to nearby areas in the lower bank of the STS, but differently from areas in the upper bank specialized for motion processing, showed the highest degree of overlap with EmC+vILF; all areas, showed a similar degree of overlap with AF, with MST showing the highest degree of overlap with this dorsal longitudinal tract.
Figure 5 with 1 supplement
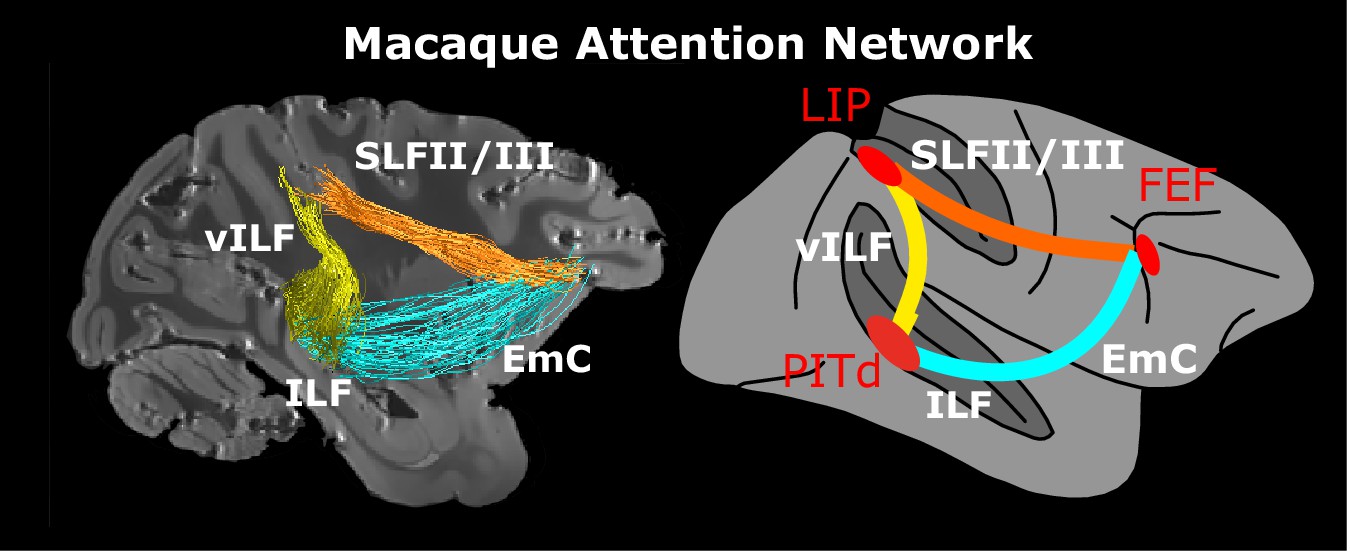
Macaque endogenous attention network.
Whole brain model and structural connectivity of the attention network of the macaque as defined by functional activation (red areas, Stemmann and Freiwald, 2016) and structural connectivity. Colored solid lines represent connections and pathways between attention nodes PITd, LIP and FEF. Conventions as in Figure 1. See also Figure 5—video 1.
Figure 5—video 1
Macaque dorso-ventral attention network.
Whole brain model, structural connectivity, and methodological approach used to reveal the attention network of the macaques. Functional activation as defined by fMRI (red areas, Stemmann and Freiwald, 2016) and structural connectivity as defined by tractography (colored streamlines) are shown in the video. See also Figures 1 and 5.
Additional files
-
Supplementary file 1
Functional ROI mapping.
For each functional ROI used during tracking procedure we report the behavioral task used for the functional mapping, the AP position of stereotactic coordinates in AC coordinate (center of ROI), and the anatomical AP position of the corresponding areas in Saleem and Logothetis (2007).
- https://doi.org/10.7554/eLife.40520.017
-
Transparent reporting form
- https://doi.org/10.7554/eLife.40520.018
Download links
A two-part list of links to download the article, or parts of the article, in various formats.
Downloads (link to download the article as PDF)
Open citations (links to open the citations from this article in various online reference manager services)
Cite this article (links to download the citations from this article in formats compatible with various reference manager tools)
Functionally defined white matter of the macaque monkey brain reveals a dorso-ventral attention network
eLife 8:e40520.
https://doi.org/10.7554/eLife.40520


