Molecular and topological reorganizations in mitochondrial architecture interplay during Bax-mediated steps of apoptosis
- MRC Laboratory of Molecular Biology, United Kingdom
- National Institute of Neurological Disorders and Stroke, National Institutes of Health, United States
Figures
Figure 1 with 1 supplement
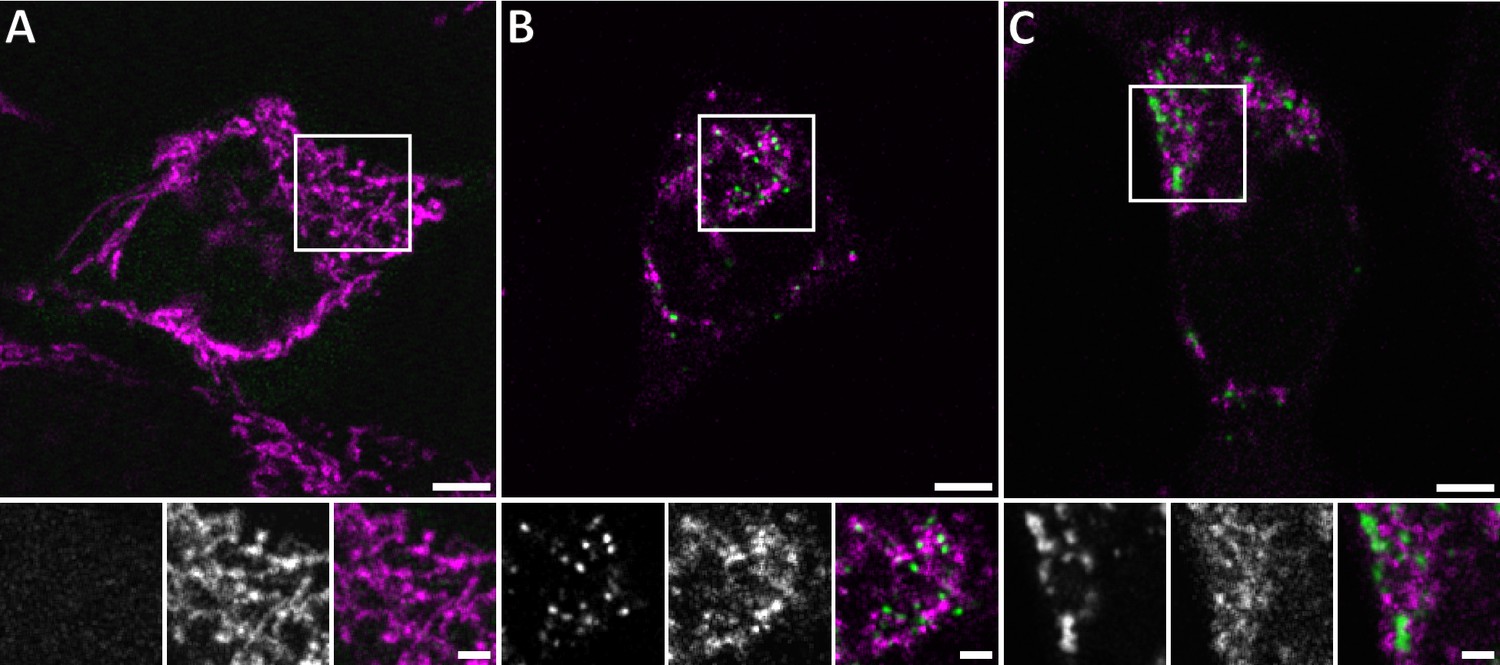
Live confocal fluorescence microscopy of HeLa cells overexpressing GFP-Bax.
HeLa cells transfected with GFP-Bax (green) in the presence of Q-VD-OPh were imaged every 30 min for 24 hr after transfection. Cells were stained with MitoTracker Deep Red (magenta) prior to imaging. (A) Representative cell 9 hr after transfection. (B) Representative cell 14 hr after transfection, showing formation of GFP-Bax punctae. (C) Larger clusters of GFP-Bax in a representative cell 19 hr after transfection. White boxes indicate areas shown magnified below the large image. The three magnified images correspond to: GFP-Bax channel (left), MitoTracker Deep Red channel (middle), and merge (right). Scale bars: 5 µm (upper panel) and 2 µm (lower panel).
Figure 1—figure supplement 1
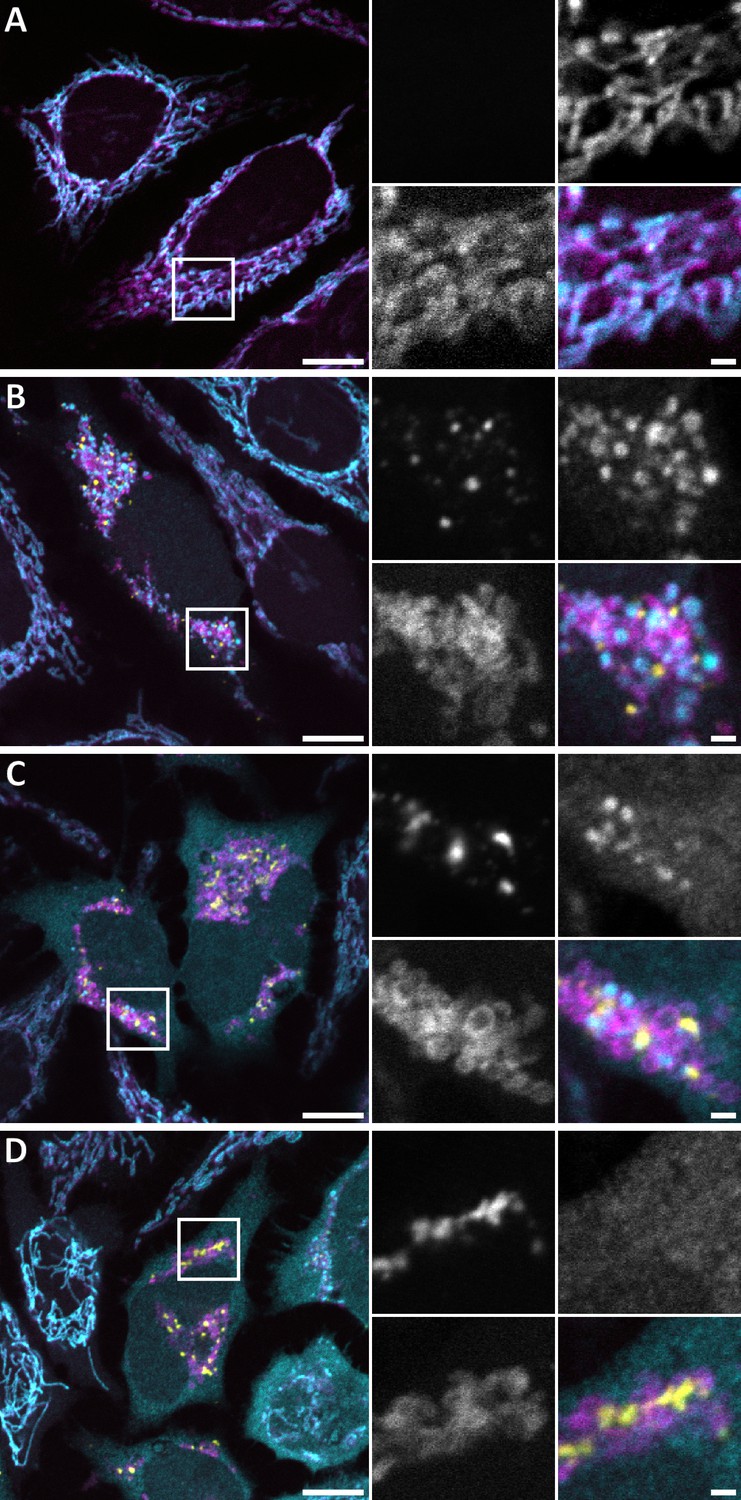
Immunofluorescence of cytochrome c release at different stages of GFP-Bax recruitment to mitochondria.
Confocal FM of fixed HeLa cells, 16 hr post-transfection with GFP-Bax (yellow) in the presence of Q-VD-OPh. Cells were stained with antibodies for the translocase of outer membrane 20 (TOM20) (magenta) and cytochrome c (cyan). A-C are merges of GFP-Bax (yellow) with TOM20 (magenta) and cytochrome c (cyan) signals. White boxes indicate areas shown magnified to the right side of the large image. The four magnified images correspond to: GFP-Bax channel (top left), cytochrome c channel (top right), TOM20 channel (bottom left), merge (bottom right). (A) Cell that does not express GFP-Bax. No release of cytochrome c from the mitochondria. (B) Cell that shows small punctae of GFP-Bax and displays partial release of cytochrome c. (C) Cell that shows large clusters of GFP-Bax and displays partial release of cytochrome c. (D) Cell that shows large clusters of GFP-Bax and displays full release of cytochrome c from the mitochondria into the cytosol. Scale bars are 10 µm (overview images) and 2 µm (magnified views).
Figure 2 with 2 supplements
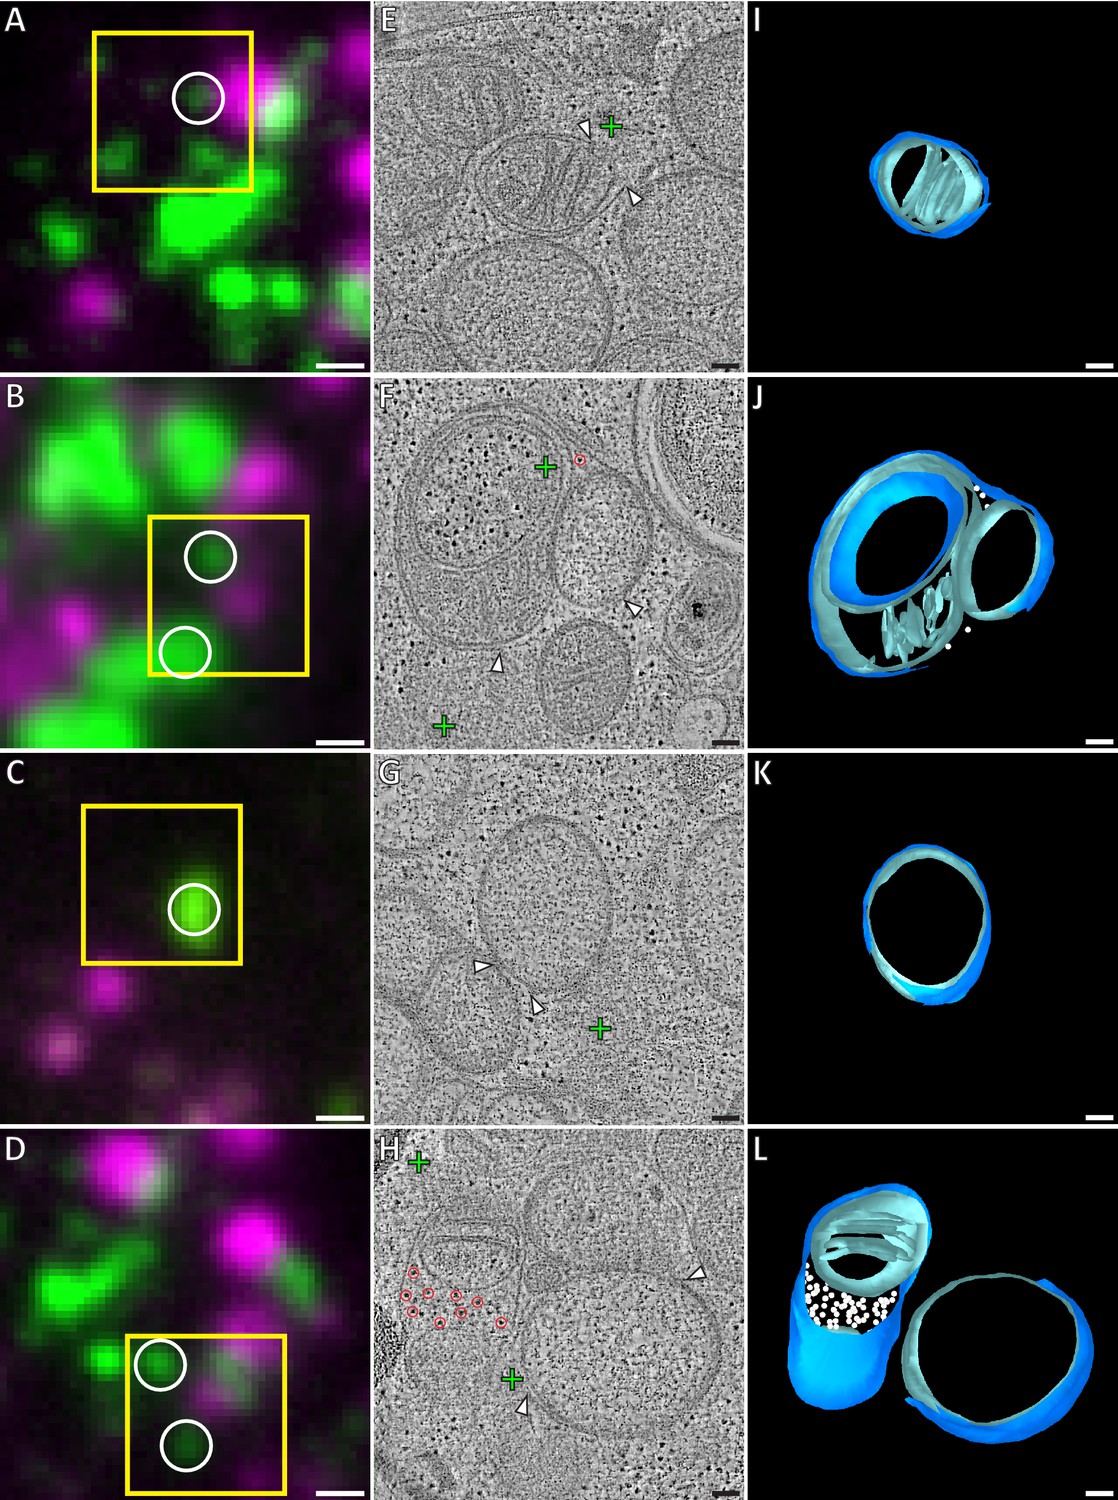
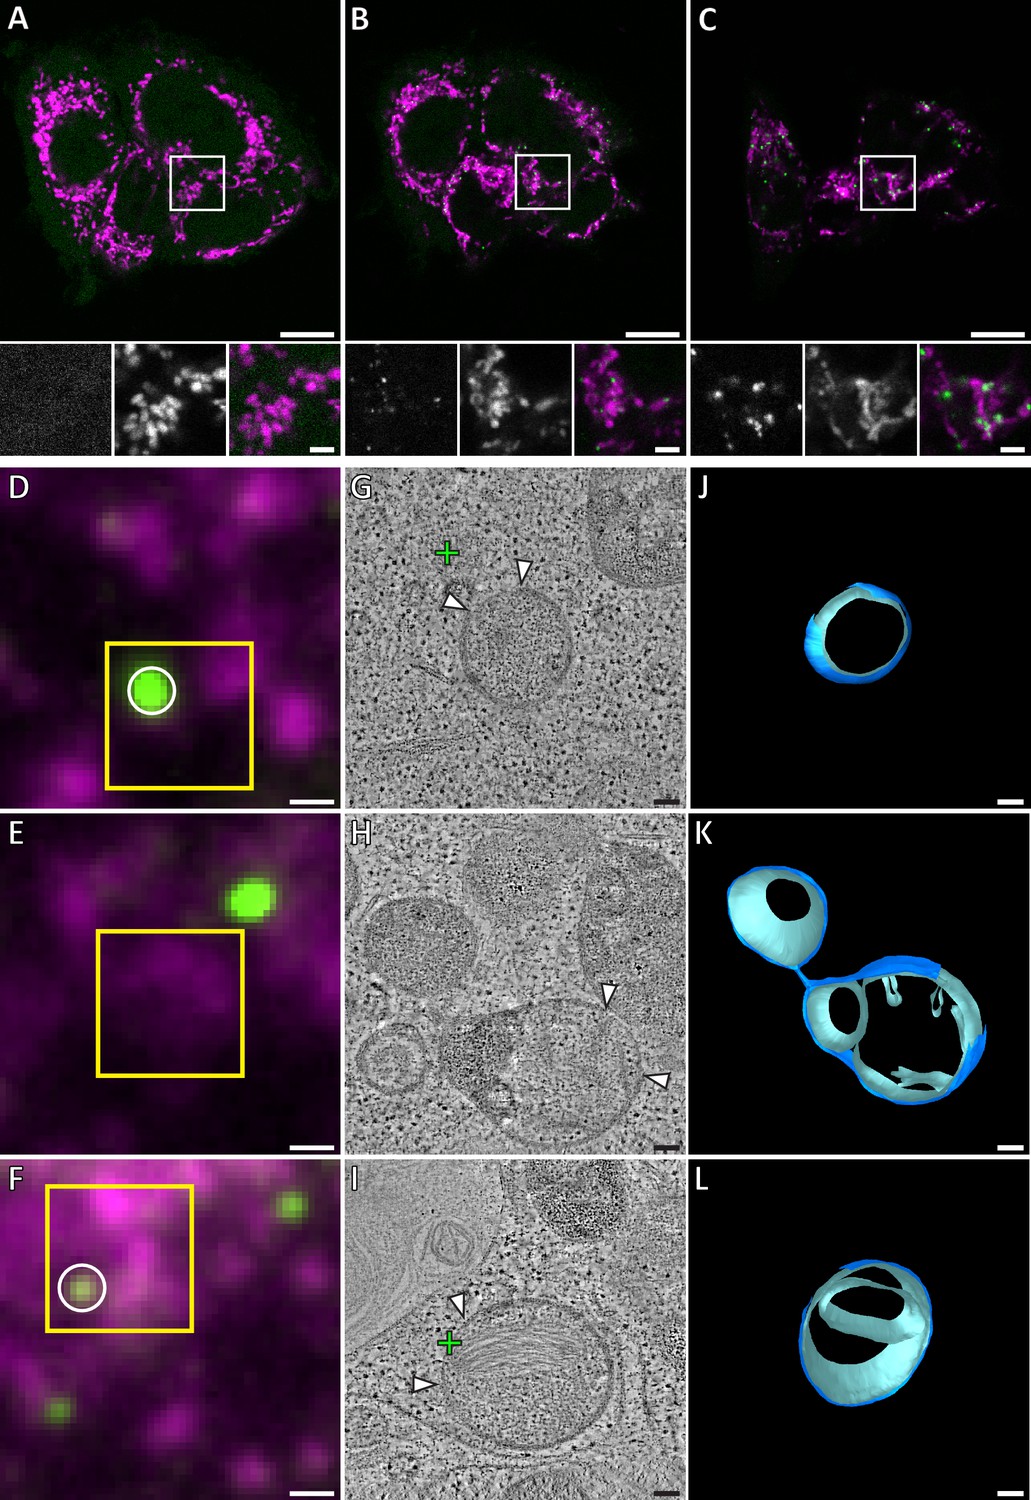
Correlative microscopy of resin-embedded HeLa cells overexpressing GFP-Bax.
Gallery of GFP-Bax locations and the associated mitochondrial morphologies, 16 hr post-transfection with GFP-Bax, in the presence of Q-VD-OPh. (A–D) FM images of sections of resin-embedded cells. GFP-Bax (green) and MitoTracker Deep Red (magenta). Yellow squares indicate the field of view imaged by ET. White circles indicate GFP-Bax signals localized in electron tomograms. (E–H) Virtual slices from electron tomograms acquired at areas indicated by yellow squares in A-D, respectively. Red circles mark representative ribosomes in intermembrane space. White arrowheads indicate membrane ruptures. Green crosses indicate predicted positions of GFP-Bax signal centroids indicated by white circles in fluorescence micrographs. (I–L) 3D segmentation models of mitochondria in E-H, respectively. Outer membranes are in dark blue, inner membranes in light blue and ribosomes in the intermembrane space in white. Scale bars: 500 nm (A–D), 100 nm (E–L).
Figure 2—figure supplement 1
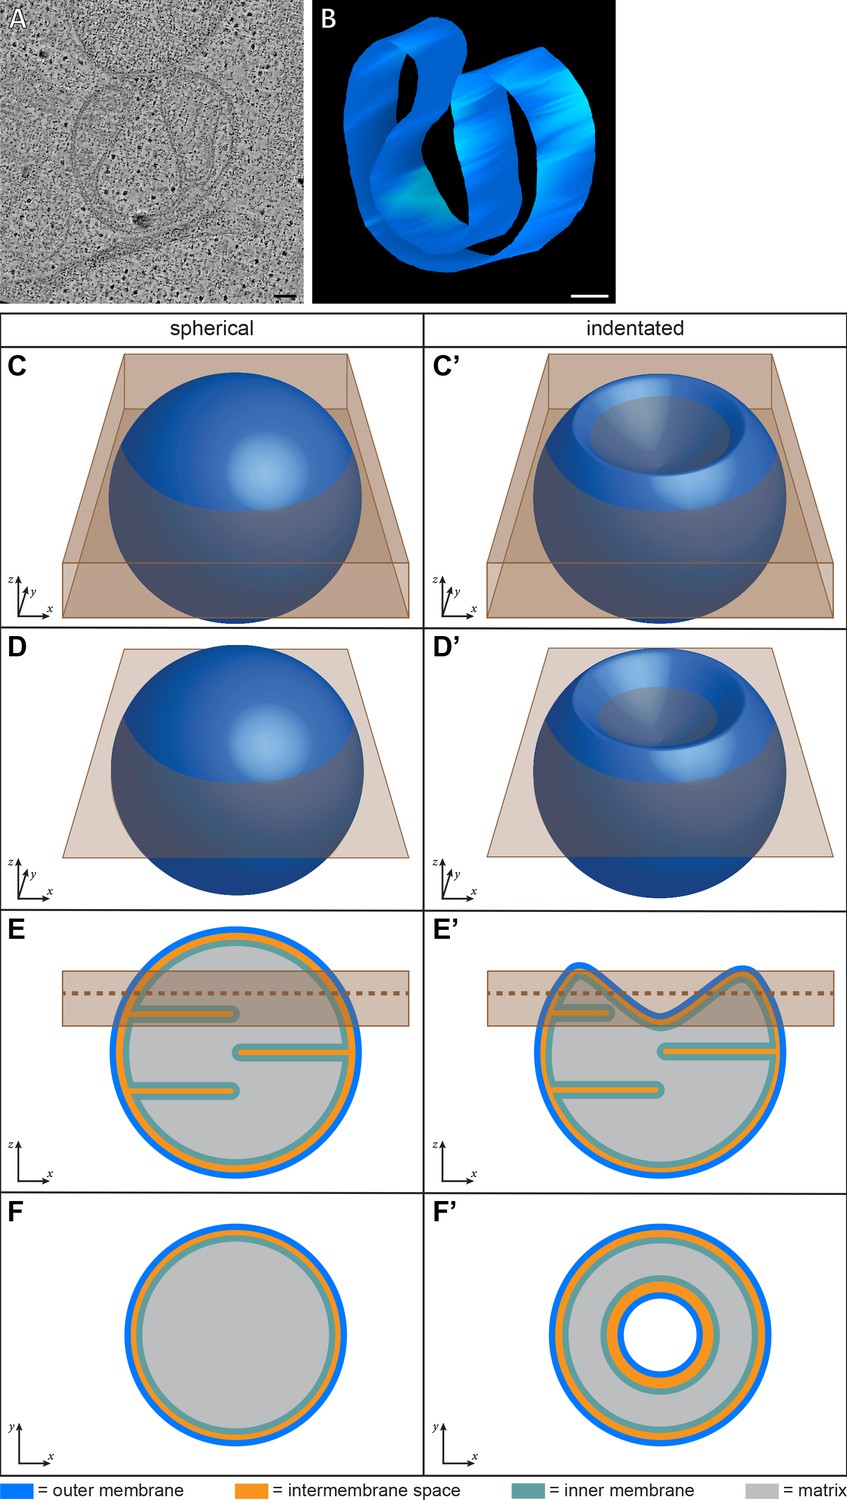
Representation of mitochondrial morphology in different views.
(A) Virtual slice from electron tomogram of HeLa cells (16 hr post-transfection with GFP-Bax). (B) 3D segmentation model of outer membrane in A. (C–F’) The thin samples used in our experiments are prepared by sectioning or cryo-FIB milling and represent only a partial volume of the cell. These diagrams depict how two theoretical mitochondria, spherical (left column) and indented (right column), would appear in ET data of thin samples. (C–D’) Three-dimensional representation of an entire mitochondrion. In C, C’, the brown rectangular prism represents the volume of the mitochondrion contained in a thin sample. In D, D’, the brown plane intersecting the mitochondrion represents the location of the virtual slice shown in F, F’. (E, E’) Side view of a virtual slice bisecting the mitochondrion. Brown box represents the location of the brown rectangular prism in C, C’. Brown dotted-line represents the location of the brown plane in D, D’. (F, F’) Top view of a virtual slice through the mitochondrion at the brown plane in D, D’ and the brown dotted-line in E, E’. Outer membranes are in dark blue, intermembrane space in orange, inner membranes in light blue, and matrix in gray. Arrows provide relative spatial orientation for each view. Scale bars: 100 nm.
Figure 2—figure supplement 2
Drug-induced GFP-Bax recruitment to mitochondria in HCT116 cells causes outer membrane ruptures and inner membrane rearrangement similar to those induced in HeLa cells upon GFP-Bax overexpression.
Live confocal FM of Bax/Bak DKO HCT116 cells stably expressing GFP-Bax (green), treated with ABT-737 and Q-VD-OPh for 3 hr. Cells were stained with MitoTracker Deep Red (magenta) prior to treatment. Cells were imaged every 30 min for 3 hr after treatment. FM images shown are from (A) 30 min, (B) 1 hr, and (C) 2 hr 30 min following treatment. White squares indicate areas shown magnified below A-C. The three magnified images correspond to: GFP-Bax channel (left), MitoTracker Deep Red channel (middle), and merge (right). (D–F) Correlative microscopy: FM image of section of resin-embedded Bax/Bak DKO HCT116 cells stably expressing GFP-Bax (green) that were treated with ABT-737 and Q-VD-OPh for 3 hr. GFP-Bax (green), MitoTracker Deep Red (magenta). Yellow squares indicate the field of view imaged by ET. White circles indicate GFP-Bax signals localized in electron tomograms. (G–I) Virtual slices from electron tomograms acquired at areas indicated by yellow square in FM images. White arrowheads indicate ruptured membranes. Green crosses indicate predicted positions of GFP-Bax signal centroids indicated by white circles in fluorescence micrographs. (J–L) 3D segmentation model of mitochondria in G-I, respectively. Outer membranes in dark blue, inner membranes in light blue. Scale bars: 10 µm (A-C, upper panels), 2 µm (A-C, lower panels), 500 nm (D–F), 100 nm (G–L).
Figure 3 with 2 supplements
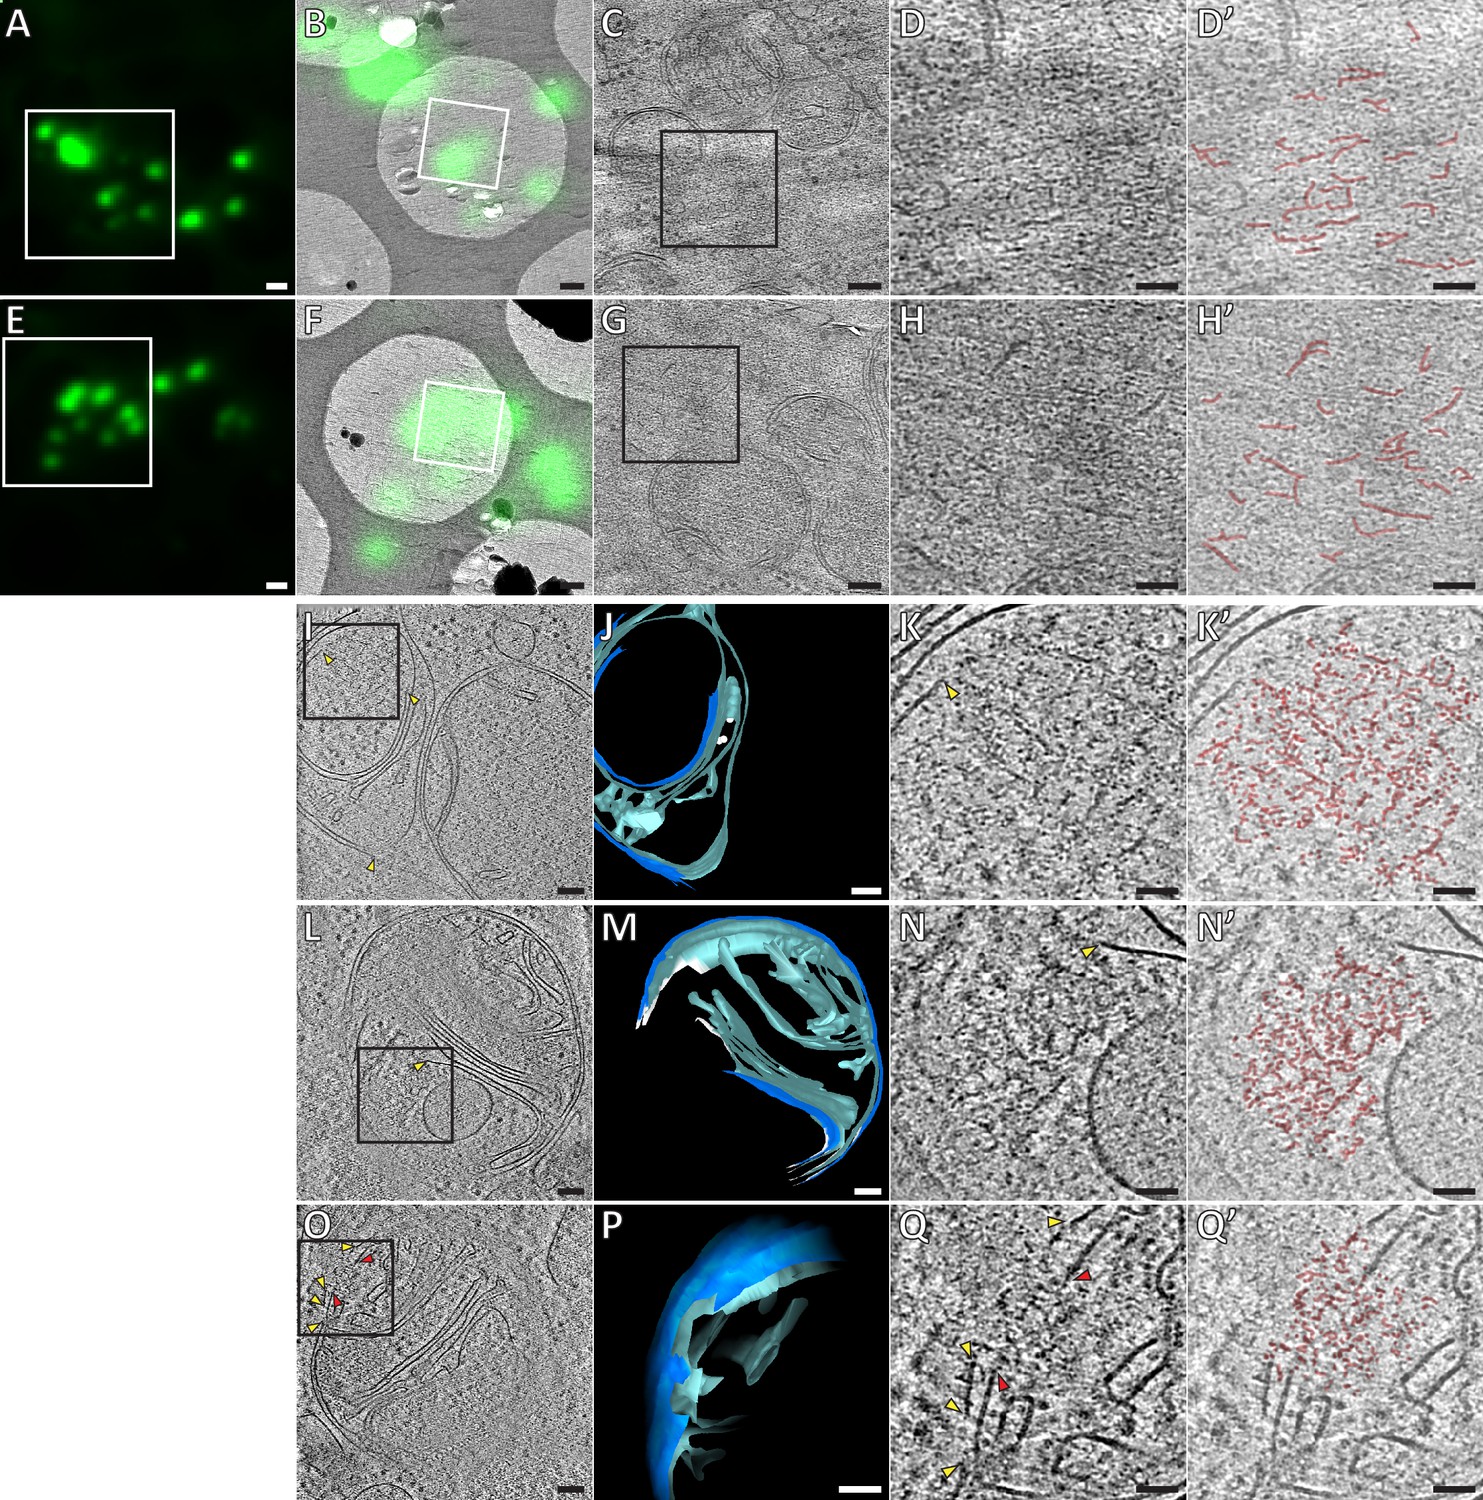
Ultrastructure of GFP-Bax clusters in HeLa cells visualized by correlative cryo-microscopy of vitreous sections, and by cryo-ET of FIB-milled cells.
(A, E) Cryo-FM of vitreous sections of HeLa cells (high-pressure frozen 16 hr post-transfection with GFP-Bax). GFP-Bax signal in green. White squares indicate areas shown in B and F, respectively. (B, F) Cryo-EM overview images of areas shown in white squares in A and E, respectively. The corresponding cryo-FM images, transformed according to correlation procedure, are overlaid in green. White squares indicate areas imaged by cryo-ET. (C, G) Virtual slices through electron cryo-tomograms corresponding to white squares in B and F, respectively. Black squares indicate areas magnified in D and H, respectively. (D, H) Magnifications of virtual slices shown in C and G, respectively, areas corresponding to black squares. (D’, H’): Annotation of images in D and H, respectively. Some of the structural features of the GFP-Bax cluster ultrastructure are highlighted in red. (I, L, O) Virtual slices through electron cryo-tomograms of HeLa cells (plunge-frozen 16 hr post-transfection with GFP-Bax), targeted by cryo-FM (see Figure 3—figure supplement 1) and thinned by cryo-FIB milling. Note that L and O show different virtual slices of the same mitochondrion rotated by 180° around the image y-axis. Black squares indicate areas magnified in K, N and Q, respectively. Yellow and red arrowheads indicate ruptured outer and inner membranes, respectively. (J, M and P) 3D segmentation model of mitochondria seen in I, L and O, respectively. Outer membranes are in dark blue, inner membranes in light blue and ribosomes in intermembrane space in white (J). White borders (M) indicate end of segmentation (see Materials and methods). Note that M and P show the same mitochondrion at different viewing angles and magnifications. (K, N and Q) Magnifications of virtual slices shown in I and L, respectively, areas corresponding to the black squares. Yellow and red arrowheads indicate ruptured outer and inner membranes, respectively. (K’, N’ and Q’) Annotation of images in K, N and Q, respectively. Some of the structural features of the cluster ultrastructure are highlighted in red. Scale bars: 1 µm (A, E), 500 nm (B, F), 100 nm (C, G, I, J, L, M, O, P), 50 nm (D, D’, H, H’, K, K’, N, N’, Q, Q’).
Figure 3—figure supplement 1
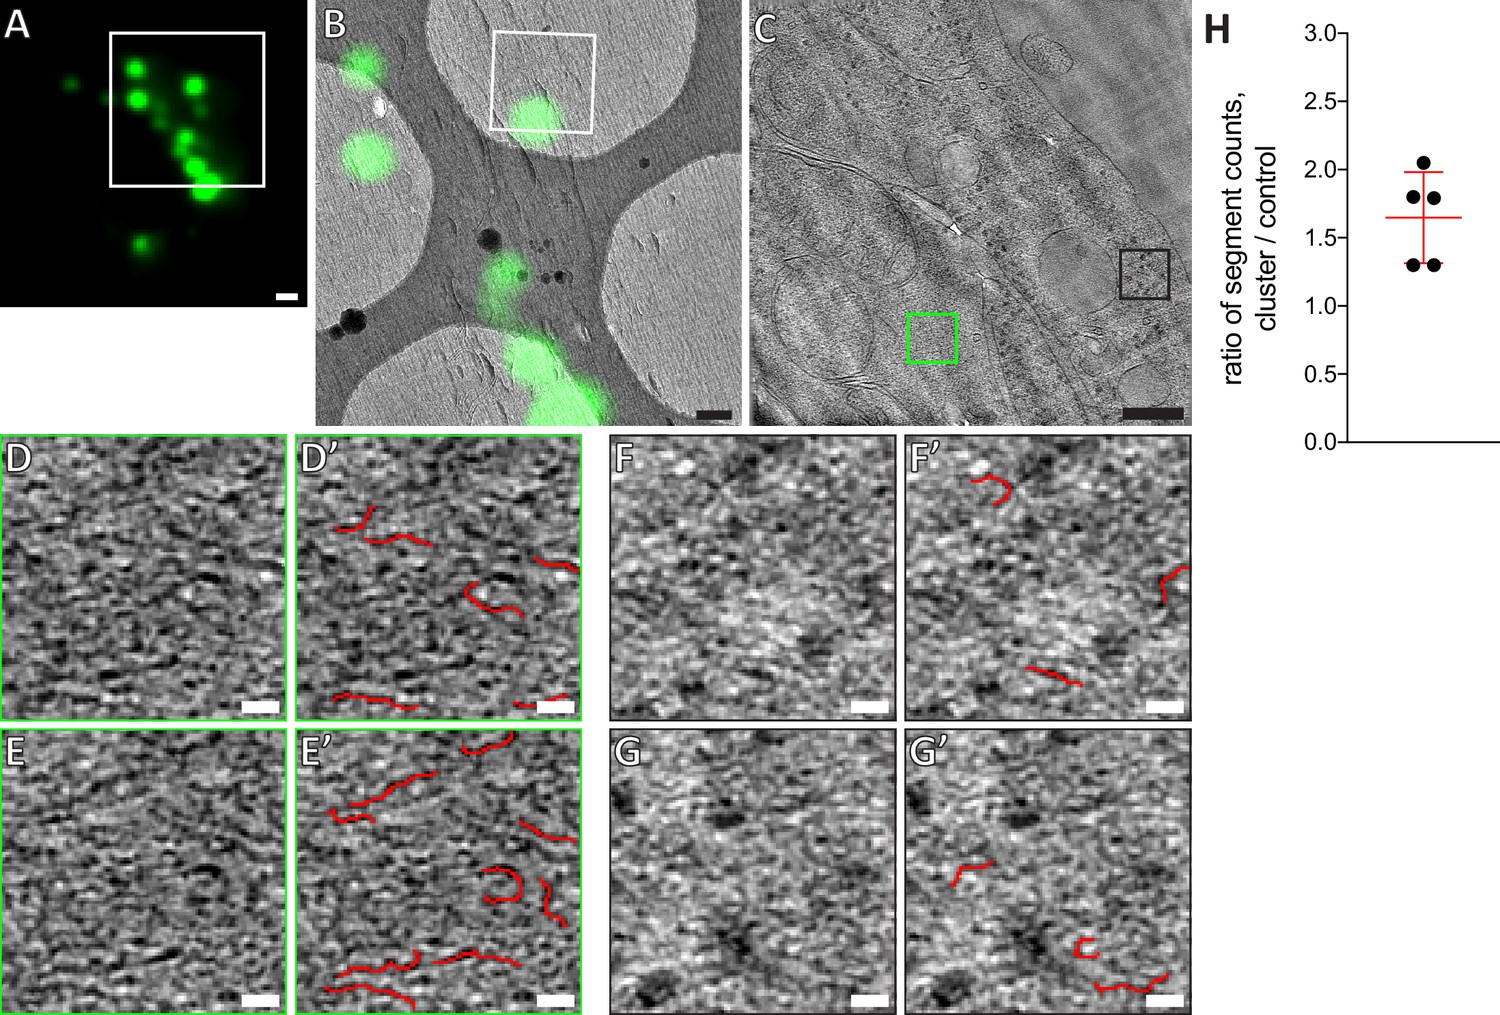
Analysis of GFP-Bax clusters versus control regions in vitreous sections.
(A) Cryo-FM (GFP channel) of vitreous section of HeLa cells (high-pressure frozen 16 hr post-transfection with GFP-Bax). White square indicates area shown in B. (B) Cryo-EM overview image of area shown in white square in A. The corresponding cryo-FM image, transformed according to correlation procedure, is overlaid in green. White square indicates area imaged by cryo-ET. (C) Virtual slice through electron cryo-tomogram corresponding to white square in B. Green and black squares indicate locations on the tomogram that were analyzed by ridge detection as shown in D, E and F, G respectively. (D, E) Maximum intensity projection images of two sets of 10 virtual slices taken from region of GFP-Bax cluster, indicated by green square in C. (D’, E’) Application of ridge detection plugin on images in D and E, respectively. Detected segments are highlighted in red. (F, G) Maximum intensity projection images of two sets of 10 virtual slices taken from control region without GFP-Bax signal, indicated by black square in C. (F’, G’) Application of ridge detection plugin on images in F and G, respectively. Detected segments are highlighted in red. (H) Ratio of ridge detection segment counts on five areas of different GFP-Bax clusters to control regions in the same tomogram (see Materials and methods). p=0.0066 for the ratio being significantly different from 1. Scale bars: 1 µm (A), 500 nm (B), 200 nm (C), 20 nm (D, D’, E, E’, F, F’, G, G’).
Figure 3—figure supplement 2
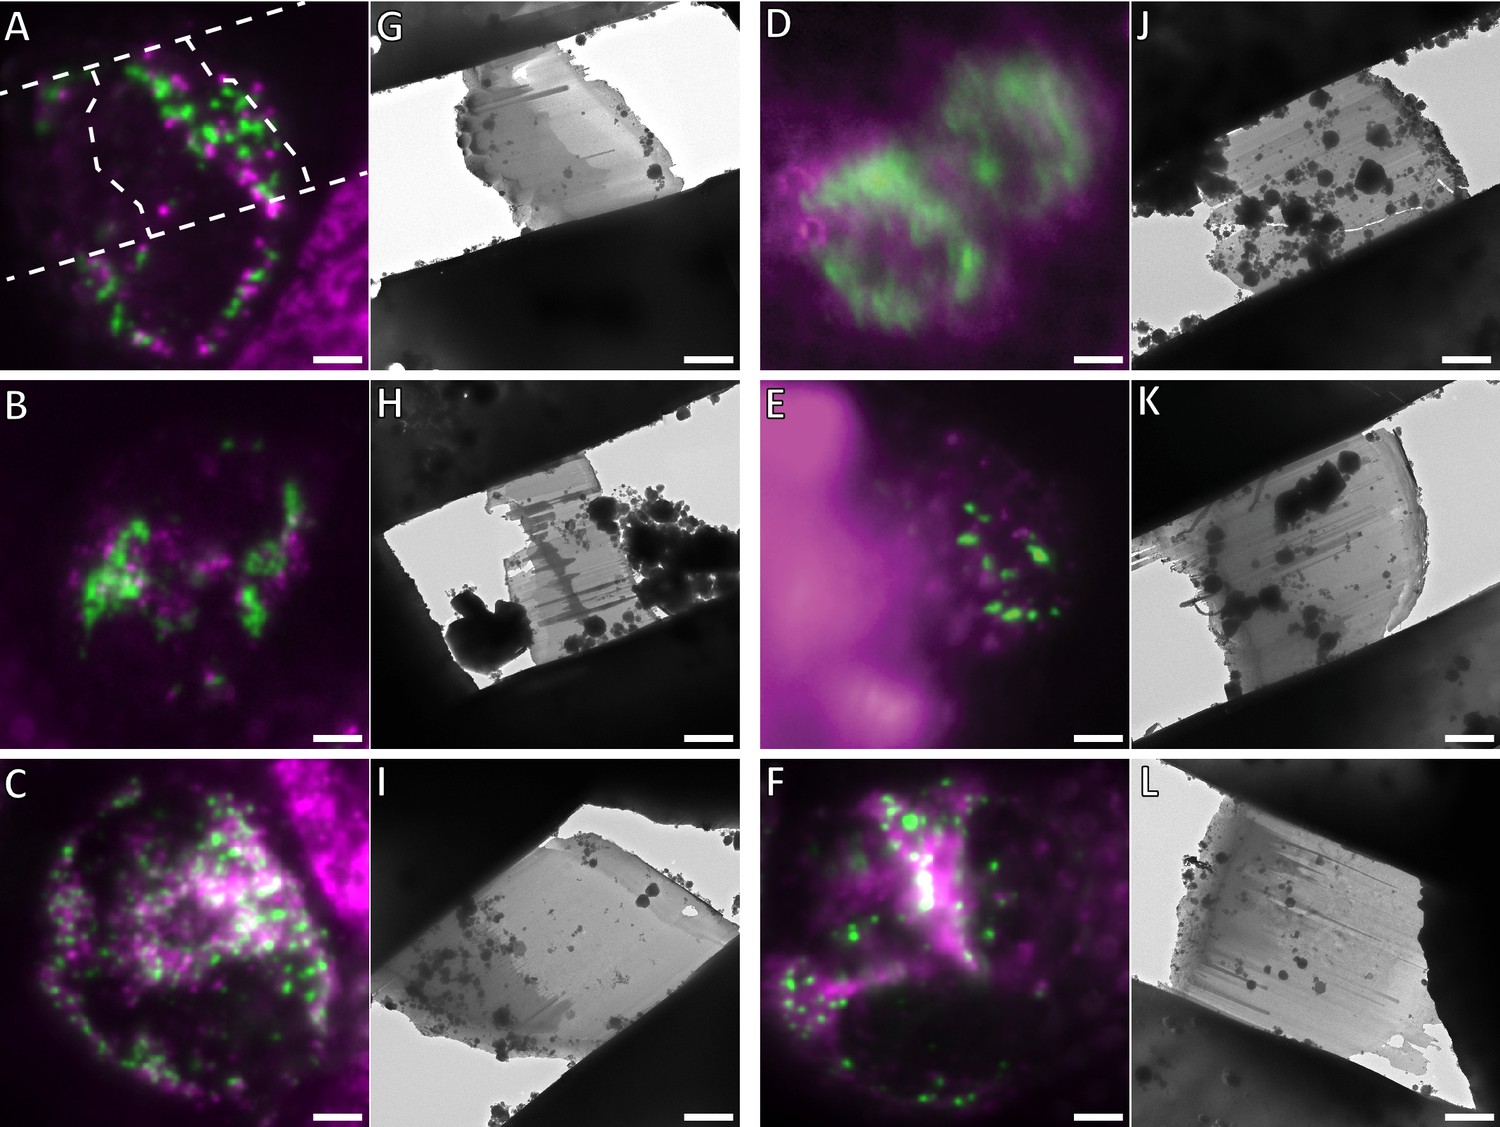
Cryo-FM targeted cryo-FIB milling of human apoptotic cells.
Shown are all apoptotic cells that were used to acquire the cryo-ET data set presented in this study. A-E and G-K are HeLa cells that were grown on EM grids and plunge-frozen 16 hr after transfection with GFP-Bax. F and L show a Bax/Bak DKO HCT116 cell stably expressing GFP-Bax, that was grown on an EM grid and plunge-frozen 3 hr after treatment with ABT-737. GFP-Bax (green), MitoTracker Deep Red (magenta). (A–F) Cryo-FM of cells. Cells were selected for cryo-FIB milling based on the presence of GFP-Bax punctae. In A, the outlines of the resulting lamella are indicated by white dashed lines. (G–L) Cryo-EM overview images of the lamellae resulting from cryo-FIB milling of the cells shown in A-F, respectively. Approximate lamella thicknesses, estimated based on reconstructed tomograms, are: 150 nm (G), 240 nm (H), 200 nm (I), 280 nm (J), 180 nm (K), 280 nm (L). Scale bars: 5 µm (A–L).
Figure 4

Mitochondrial outer membrane ruptures are accompanied by rearrangements of the inner membrane.
(A-C) Virtual slices through electron cryo-tomograms of HeLa cells (16 hr post-transfection with GFP-Bax), thinned by cryo-FIB milling. Black squares indicate areas magnified in D-I, respectively. (D–I) Magnifications of the virtual slices shown in A-C, respectively, areas corresponding to black squares. White arrowheads indicate ruptured membranes. (J–L) 3D segmentation model of mitochondria seen in A-C, respectively. Outer membranes are in dark blue, inner membranes in light blue. (M) Quantification of rupture sizes, grouped according to inner membrane morphology category. Data points are from both ET of resin-embedded HeLa cells and from cryo-ET of cryo-FIB milled HeLa cells, all 16 hr post-transfection with GFP-Bax. Schematic representation of each category is shown above columns. Note that the 'lamellar cristae' category contains 10 ruptures from 9 mitochondria. p=0.0024 for lamellar cristae vs. unfolded cristae. The red lines indicate the mean and the standard deviation. For numerical data see Figure 4—source data 1. (N) The percentage of mitochondrial surface area consisting of exposed inner membrane, plotted for mitochondria with unfolded cristae (indicated by schematic in upper right corner). The red lines indicate the mean and the standard deviation. For numerical data see Figure 4—source data 2. Scale bars: 100 nm (A–C and J–L), 20 nm (D–I).
-
Figure 4—source data 1
Numerical data presented in the graph shown in Figure 4M.
- https://doi.org/10.7554/eLife.40712.013
-
Figure 4—source data 2
Numerical data presented in the graph shown in Figure 4N.
- https://doi.org/10.7554/eLife.40712.014
Figure 5
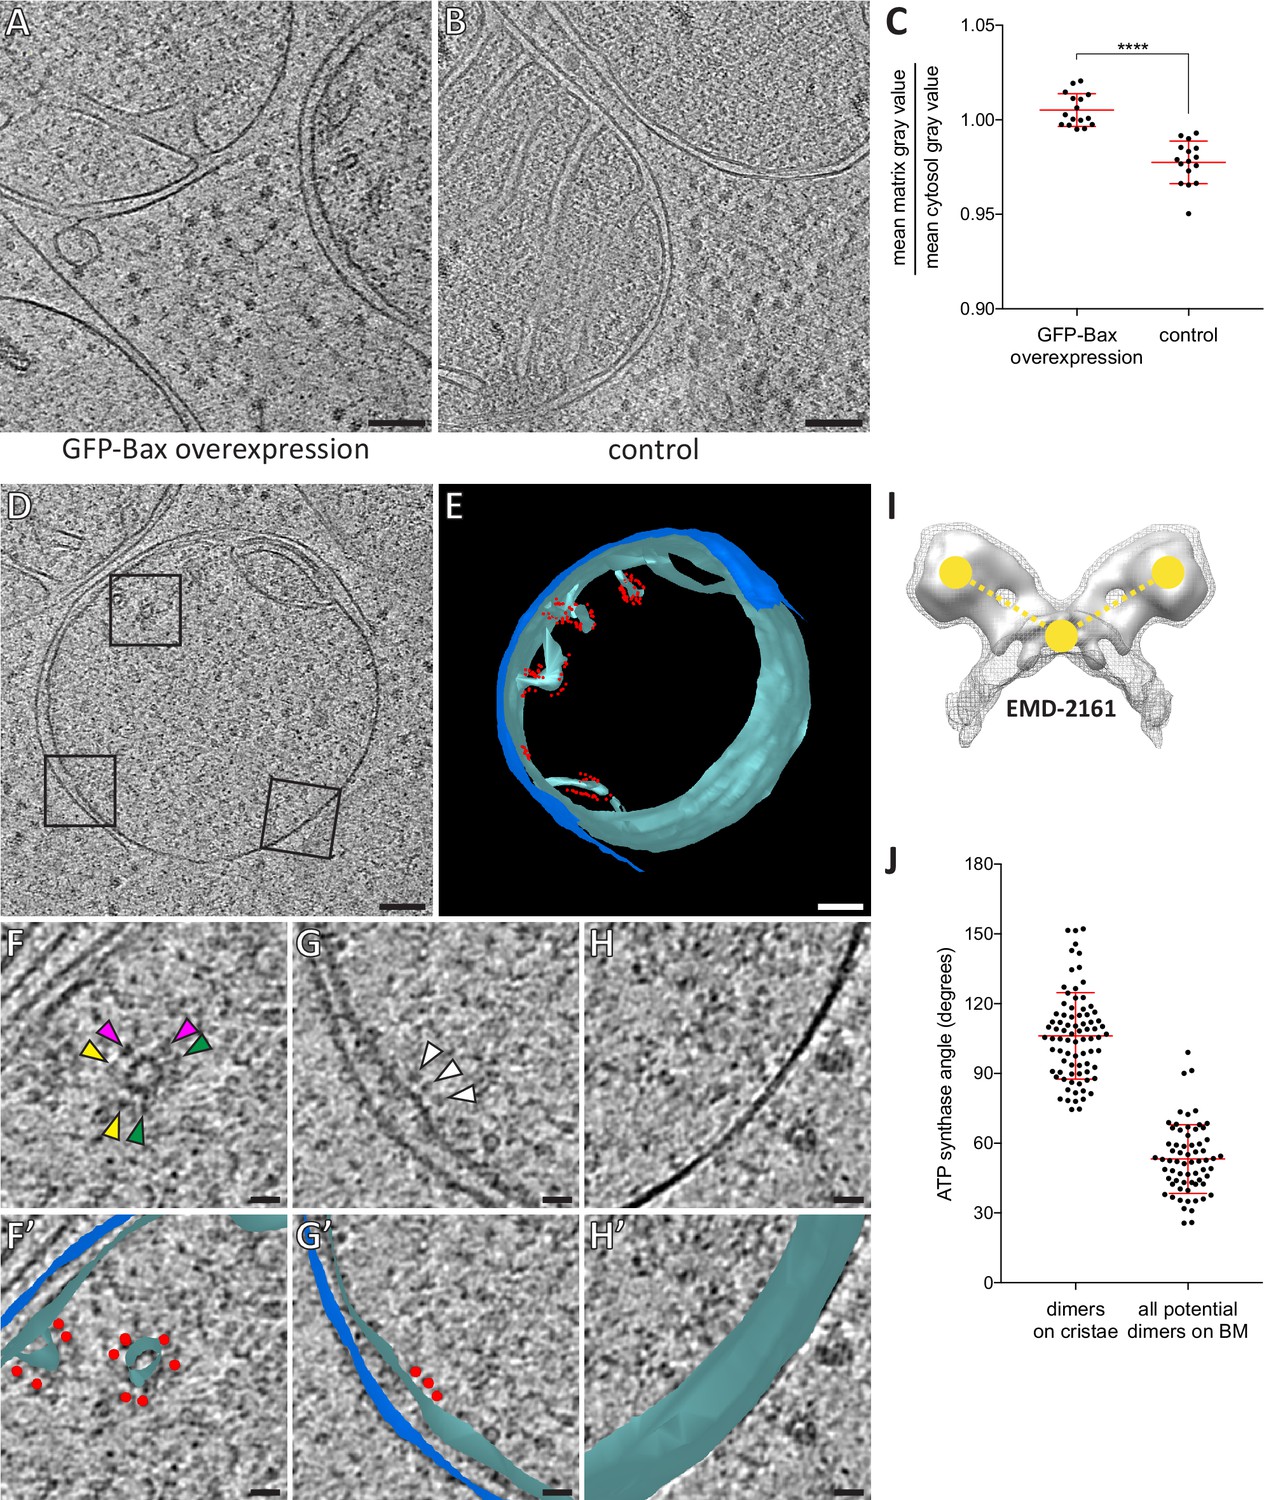
Dilution of the mitochondrial matrix and organization of ATP synthases visualized by cryo-ET of cryo-FIB milled HeLa cells.
(A) Virtual slice through an electron cryo-tomogram of a HeLa cell (16 hr post-transfection with GFP-Bax) thinned by cryo-FIB milling. (B) Virtual slice through an electron cryo-tomogram of a control HeLa cell thinned by cryo-FIB milling, showing typical mitochondria in absence of GFP-Bax expression. (C) Quantitative analysis of the ratio between average pixel gray values in the matrix and average pixel gray values in the cytosol. A low value is attributed to a darker pixel, and a high value is attributed to a lighter pixel. p<0.0001 for comparison between mitochondria in GFP-Bax overexpressing and control HeLa cells. The red lines indicate the mean and the standard deviation. For numerical data see Figure 5—source data 1. (D) Virtual slice through an electron cryo-tomogram of a HeLa cell (16 hr post-transfection with GFP-Bax), thinned by cryo-FIB milling. Note that this is a different virtual slice of the tomogram shown in Figure 4C. Black squares indicate areas magnified in F-H. (E) 3D segmentation model of mitochondrion seen in D. Outer membranes are in dark blue, inner membranes in light blue and ATP synthase heads in red. (F–H) Magnified areas of the virtual slice shown in D, corresponding to the black squares. White arrowheads indicate ATP synthase heads. Arrowheads of matching color in F denote dimers of ATP synthases. (F’–H’) Images from F-H shown with the segmentation model from E. Outer membranes are in dark blue, inner membranes in light blue, and ATP synthase heads in red. (I) Structure of the yeast ATP synthase dimer (EMD-2161, Davies et al., 2012), to illustrate how we measured the angle enclosed by ATP synthases heads and membrane (yellow points and dashed lines) for our analysis. (J) ATP synthase angles measured in dimers in cristae membranes, and between neighboring ATP synthases in the boundary membrane (BM). The red lines indicate the mean and the standard deviation. For numerical data see Figure 5—source data 2. Scale bars: 100 nm (A, B, D, E), 20 nm (F, F’, G, G’, H, H’).
-
Figure 5—source data 1
Numerical data presented in the graph shown in Figure 5C.
- https://doi.org/10.7554/eLife.40712.018
-
Figure 5—source data 2
Numerical data presented in the graph shown in Figure 5J.
- https://doi.org/10.7554/eLife.40712.019
Figure 6
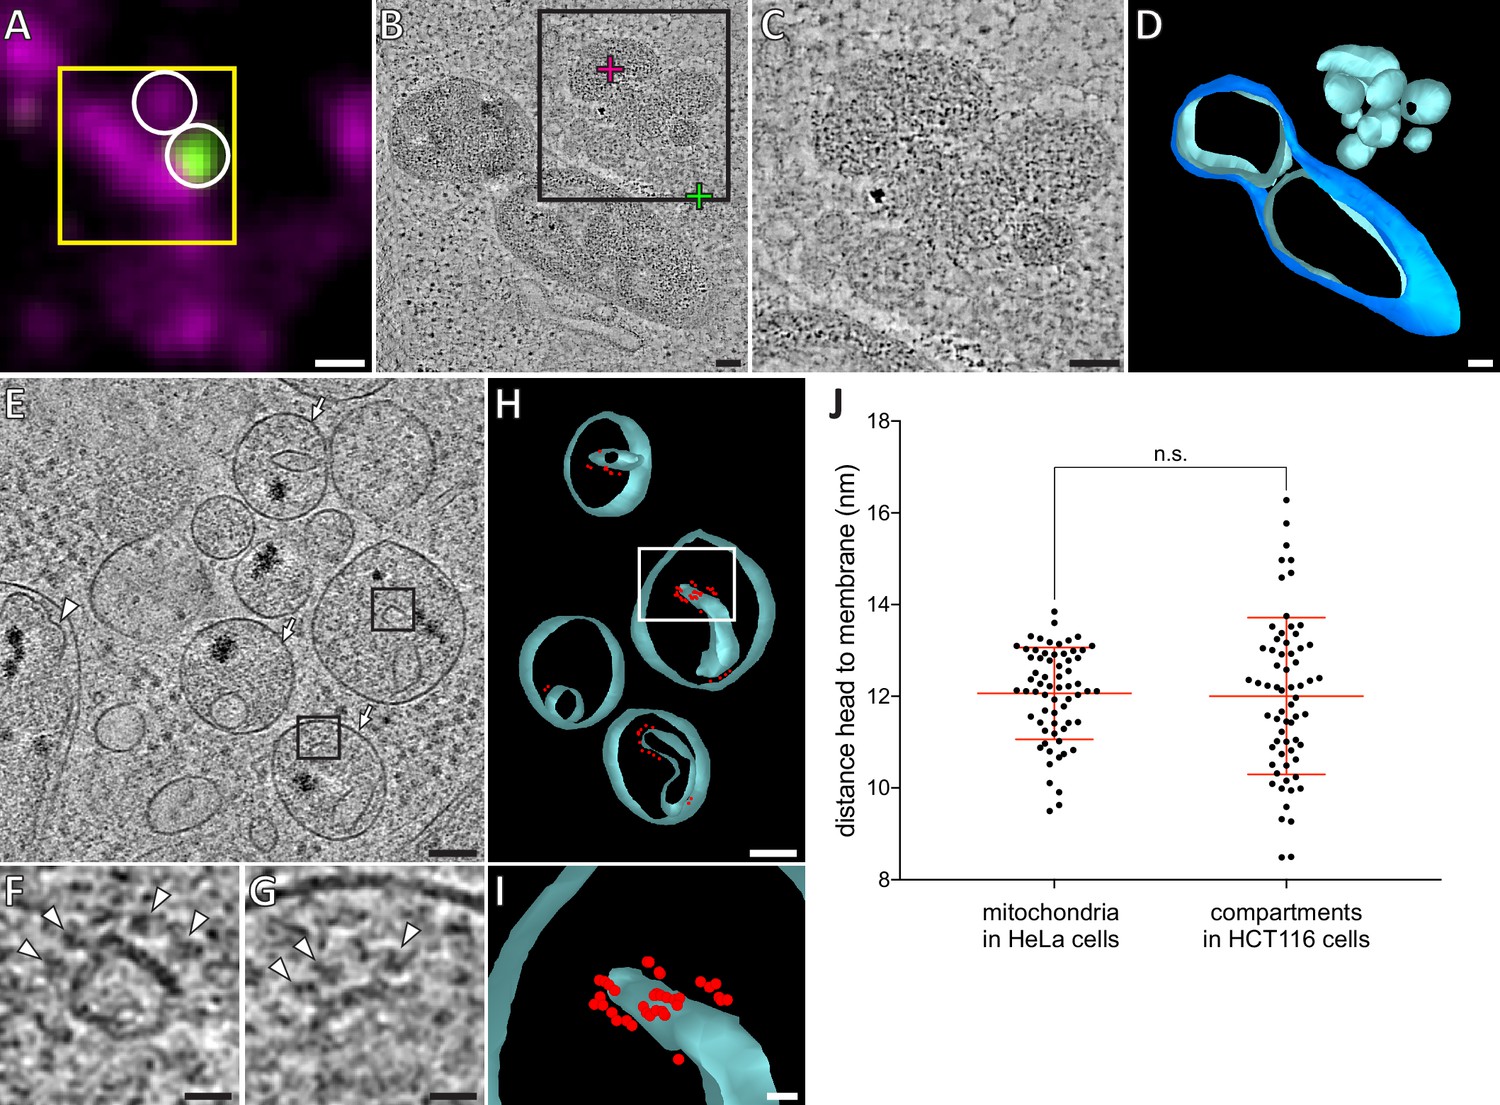
HCT116 cells treated with the apoptotic drug ABT-737 contain inner membrane compartments that are lacking the enclosing outer membranes.
(A) FM of a section of resin-embedded Bax/Bak DKO HCT116 cells stably expressing GFP-Bax, treated with ABT-737 for 3 hr. GFP-Bax (green), MitoTracker Deep Red (magenta). Yellow square indicates the field of view imaged by ET, white circles indicate fluorescent signals of interest localized in electron tomograms. (B) Virtual slice through an electron tomogram acquired at area indicated by the yellow square in A. Green and magenta crosses indicate predicted position of GFP-Bax and MitoTracker Deep Red signal centroids, respectively, indicated by white circles in fluorescence micrographs. Black square indicates area magnified in C. (C) Magnified area of the virtual slice shown in B, corresponding to the black square. The image shows an accumulation of single membrane compartments near the GFP-Bax clusters. (D) 3D segmentation model of mitochondria and single-membrane compartments seen in B. Outer membranes are in dark blue, inner membranes in light blue. (E) Virtual slice through an electron cryo-tomogram of a cryo-FIB milled Bax/Bak DKO HCT116 cell stably expressing GFP-Bax treated with ABT-737 for 3 hr. Arrows indicate compartments reminiscent of mitochondrial inner membranes that appear to have no outer membrane.Arrowhead indicates an inner membrane within an intact mitochondrion. (F, G) Magnified areas of the virtual slice shown in E, corresponding to the black squares. White arrowheads indicate putative ATP synthase heads. (H) 3D segmentation model of compartments seen in E. Membranes are in light blue, putative ATP synthase heads in red. White box indicates magnified area in I. (I) Magnified area from white box in H, depicting the arrangement of putative ATP synthase heads. (J) Measured distances between head and membrane. Comparison between ATP synthases identified in mitochondria in HeLa cells, and putative ATP synthases in the compartments without outer membrane in HCT116 cells. The red lines indicate the mean and the standard deviation. For numerical data see Figure 6—source data 1. Scale bars: 500 nm (A), 100 nm (B–E, H), 20 nm (F, G, I).
-
Figure 6—source data 1
Numerical data presented in the graph shown in Figure 6J.
- https://doi.org/10.7554/eLife.40712.021
Figure 7
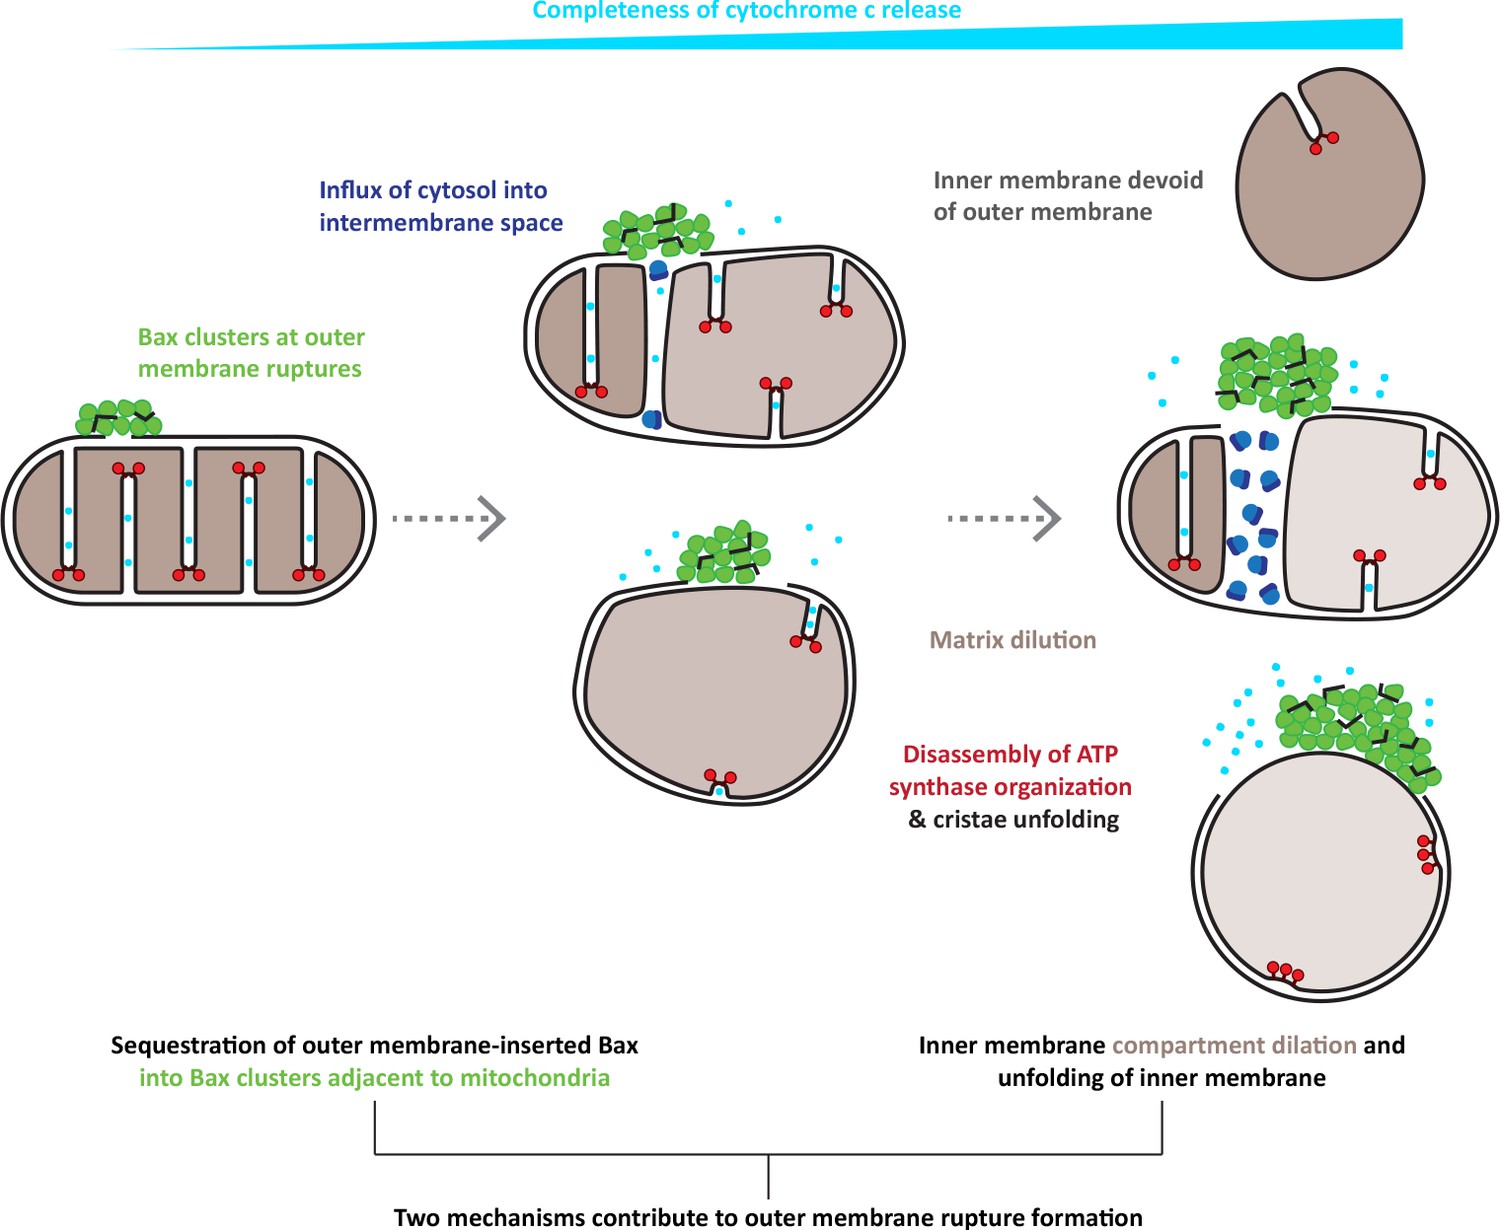
Model for the interplay of inner and outer membrane reorganization during Bax-mediated steps of apoptosis.
Bax clusters form at outer membrane ruptures. Clusters display a higher order organization of their components. Ruptures allow influx of ribosomes and thus mixing of cytosolic and intermembrane content. As rupture size increases, the inner membrane remodels through fragmentation and cristae unfolding. Dilution of the mitochondrial matrix likely supports dilation of the inner membrane compartment. Inner membrane reshaping is accompanied by disassembly of ATP synthase dimers into monomers and a complete clearance of ATP synthases from regions of inner membrane that are exposed to the cytosol, and that are maximally flattened. The degree of inner membrane exposure varies, and is maximal in HCT116 cells, where inner membrane compartments devoid of any outer membrane can be found.
Videos
Video 1
Electron cryo-tomogram of GFP-Bax clusters obtained by correlative microscopy of vitreous sections, corresponding to Figure 3C–D’.
Movie through virtual slices of electron cryo-tomogram. Movie pauses at the virtual slice shown in Figure 3D and D’ to indicate structural features highlighted in red. Scale bar: 50 nm.
Video 2
Electron cryo-tomogram of GFP-Bax clusters obtained by correlative microscopy of vitreous sections, corresponding to Figure 3G–H’.
Movie through virtual slices of electron cryo-tomogram. Movie pauses at the virtual slice shown in Figure 3H and H’ to indicate structural features highlighted in red. Scale bar: 50 nm.
Video 3
Electron cryo-tomogram of GFP-Bax cluster obtained from cryo-FIB milled cells, corresponding to Figure 3I–K’.
Movie through virtual slices of electron cryo-tomogram. 3D segmentation model of mitochondrion is shown as an overlay. Outer membranes in dark blue, inner membranes in light blue, and ribosomes in intermembrane space in white. Movie pauses at the virtual slice shown in Figure 3K and K’ to indicate structural features highlighted in red. Scale bar: 50 nm.
Video 4
Electron cryo-tomogram of GFP-Bax clusters and inner membrane rupture obtained from cryo-FIB milled cells, corresponding to Figure 3L–Q’.
Movie through virtual slices of electron cryo-tomogram. 3D segmentation model of mitochondrion is shown as an overlay. Outer membranes are in dark blue, inner membranes in light blue. White borders indicate end of segmentation (see Materials and methods). Movie pauses at the virtual slice shown in Figure 3N and N’, and at the virtual slice shown in Figure 3Q and Q’ to indicate structural features highlighted in red. Scale bar: 50 nm.
Tables
Key resources table
| Reagent type (species) or resource | Designation | Source or reference | Identifiers | Additional information |
|---|---|---|---|---|
| Cell line (Homo sapiens) | Bax/Bak DKO HCT116 GFP-Bax | this paper | Cell line generated by transfection of GFP-Bax and selection for stable expression in Bax/Bak DKO HCT116 line generated in PMID:22056880 | |
| Cell line (Homo sapiens) | HeLa/wtOTC, TetOn promoter | PMID:24149988 | Cell line maintained in Richard Youle lab. | |
| Cell line (Homo sapiens) | HeLa control/Fsp27-EGFP | other | Cell line stably expressing Fsp27-EGFP from tet-inducible promoter. Obtained from Koini Lim (David Savage lab). | |
| Antibody | Mouse anti-cytochome c (monoclonal) | BD Pharmingen | BD Pharmingen:556432 | (1:250) |
| Antibody | Rabbit anti-TOM20 (polyclonal) | Santa Cruz Biotechnology | Santa Cruz:sc-11415 | (1:250) |
| Antibody | Goat anti-rabbit Alexa Fluor 405 nm | Invitrogen | Invitrogen:A31556 | (1:200) |
| Antibody | Donkey anti-mouse Alexa Fluor 647 nm | Invitrogen | Invitrogen:A31571 | (1:200) |
| Recombinant DNA reagent | hBax-C3-EGFP | Addgene | Addgene:19741 | |
| Chemical compound, drug | ABT-737 | Cayman | Cayman:11501 | assay concentration = 10 µM |
| Chemical compound, drug | Doxycycline | Takara | Takara:631311 | assay concentration = 1 µg/mL |
| Chemical compound, drug | Hygromycin B | Invitrogen | Invitrogen:10687010 | assay concentration = 0.2 µg/mL |
| Chemical compound, drug | Oleic acid | Sigma | Sigma:O3008 | assay concentration = 0.4 mM |
| Chemical compound, drug | Q-VD-Oph | APExBIO | APExBIO:A1901 | assay concentration = 10 µM |
| Commercial assay or kit | Lowicryl HM20 | Polysciences, Inc. | Polysciences, Inc.:15924–1 | |
| Software, algorithm | Correlative Microscopy, MATLAB-based scripts | PMID:22863005; PMID:24275379; Mathworks | https://www.embl.de/download/briggs/cryoCLEM/index.htm | |
| Software, algorithm | IMOD | PMID:8742726 | http://bio3d.colorado.edu/imod/ | |
| Software, algorithm | SerialEM | PMID:16182563 | http://bio3d.colorado.edu/SerialEM/ | |
| Software, algorithm | Ridge Detection 1.4.0 | DOI:10.5281/zenodo.845874 | https://imagej.net/Ridge_Detection | |
| Other | Specimen carrier, aluminum, B | Engineering Office M. Wohlwend | Engineering Office M. Wohlwend: Art. 1314 | |
| Other | Specimen carrier, copper gold-coated | Engineering Office M. Wohlwend | Engineering Office M. Wohlwend: Art. 1322 | |
| Other | EM grids, copper, 200 mesh carbon support | Agar Scientific Ltd. | Agar Scientific Ltd:S160 | |
| Other | EM grids, copper, 200 mesh, R 3.5/1 holey carbon | Quantifoil | ||
| Other | EM grids, gold, 200 mesh, R 2/2 holey carbon | Quantifoil | ||
| Other | MitoTracker Deep Red | Thermo | Thermo:22426 | assay concentration = 20 nM |
| Other | Sapphire disks, 3 mm | Engineering Office M. Wohlwend | Engineering Office M. Wohlwend: Art. 405 | |
| Other | TetraSpeck microspheres,50 nm | Invitrogen | custom order, (diluted 1:100 in PBS) | |
| Other | TetraSpeck microspheres, 100 nm | Invitrogen | T7279 | (diluted 1:50 in PBS) |
| Other | X-tremeGENE 9 | Roche | Roche:06365787001 | 3 µL reagent: 1 µg DNA |
Additional files
-
Supplementary file 1
Sample sizes from which the analyzed electron tomography data sets were generated.
Counts include only samples that have contributed to the final data presented in this study. Additional samples and data have been excluded based on either one or more of the following criteria: poor vitrification/sample quality, poor tilt series acquisition quality, poor tomographic reconstruction, no structure of interest contained in the tomographic volume.
- https://doi.org/10.7554/eLife.40712.023
-
Transparent reporting form
- https://doi.org/10.7554/eLife.40712.024
Download links
A two-part list of links to download the article, or parts of the article, in various formats.
Downloads (link to download the article as PDF)
Open citations (links to open the citations from this article in various online reference manager services)
Cite this article (links to download the citations from this article in formats compatible with various reference manager tools)
Molecular and topological reorganizations in mitochondrial architecture interplay during Bax-mediated steps of apoptosis
eLife 8:e40712.
https://doi.org/10.7554/eLife.40712


