Mismatch repair-signature mutations activate gene enhancers across human colorectal cancer epigenomes
- Case Western Reserve University, United States
- Cleveland Clinic, United States
Figures
Figure 1 with 2 supplements
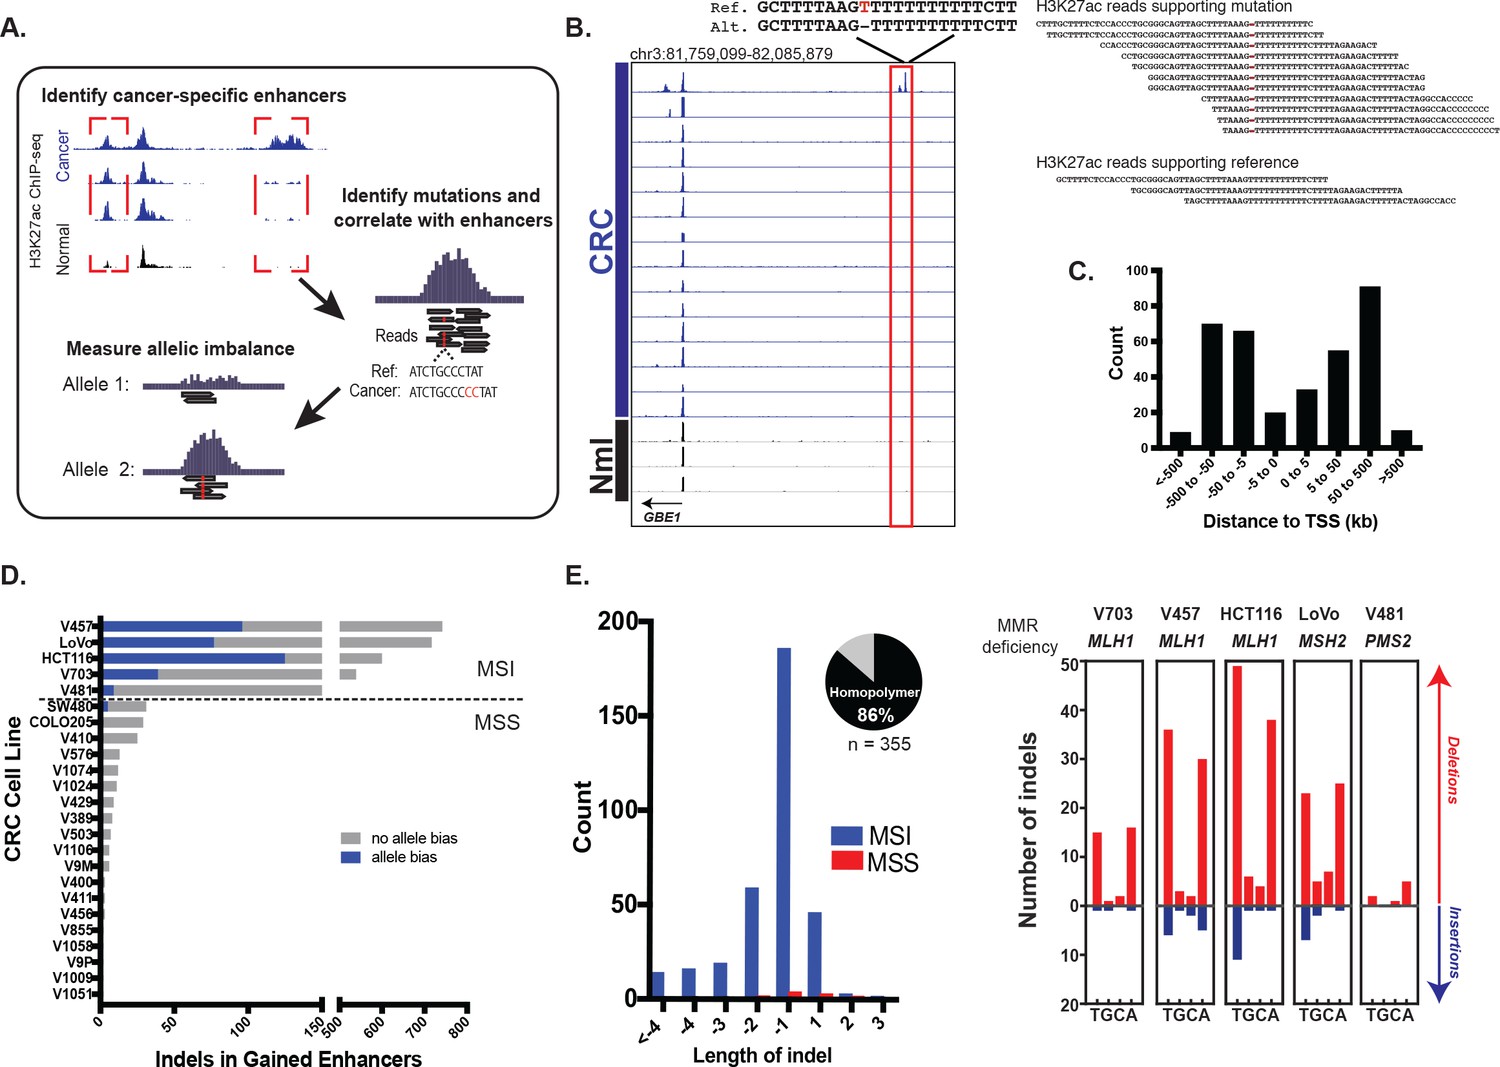
Identification of functional enhancer mutations from H3K27ac ChIP-seq data.
(A) Overview of approach. (B) (left) Genome Browser snapshot of a putative enhancer-activating indel detected at a CRC-specific H3K27ac peak. Y-axis scales are all 0 to 25. (right) H3K27ac ChIP-seq reads covering indel locus. (C) Distribution of CRC-specific H3K27ac peaks containing indels relative to transcription start sites. (D) Number of gained enhancer-associated indels with and without allele bias detected in each CRC cell line. Enhancer mutations are provided in Figure 1—source data 1. (E) (left) Distribution of indel lengths detected in gained enhancers in MSI and MSS CRC samples. Pie chart shows the fraction of indels detected in homopolymers. (right) Number of insertion (blue) and deletion (red) mutations in homopolymers of T, G, C, or A in MSI cell lines.
-
Figure 1—source data 1
Enhancer indel mutations detected from H3K27ac ChIP-seq data in cell lines and primary tumors.
- https://doi.org/10.7554/eLife.40760.005
Figure 1—figure supplement 1
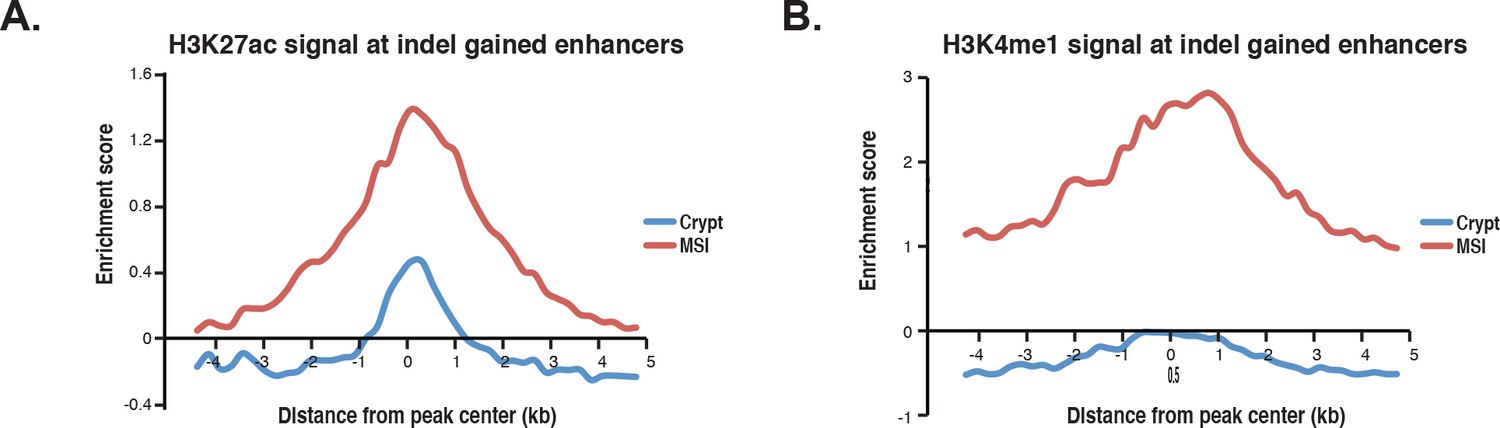
Enhancer histone profiles at indel gained enhancers.
(A) Aggregate plot of H3K27ac signal in MSI lines harboring putative enhancer-activating indels and in normal crypt cells. (B) Same, but plotting the H3K4me1 signal.
Figure 1—figure supplement 2
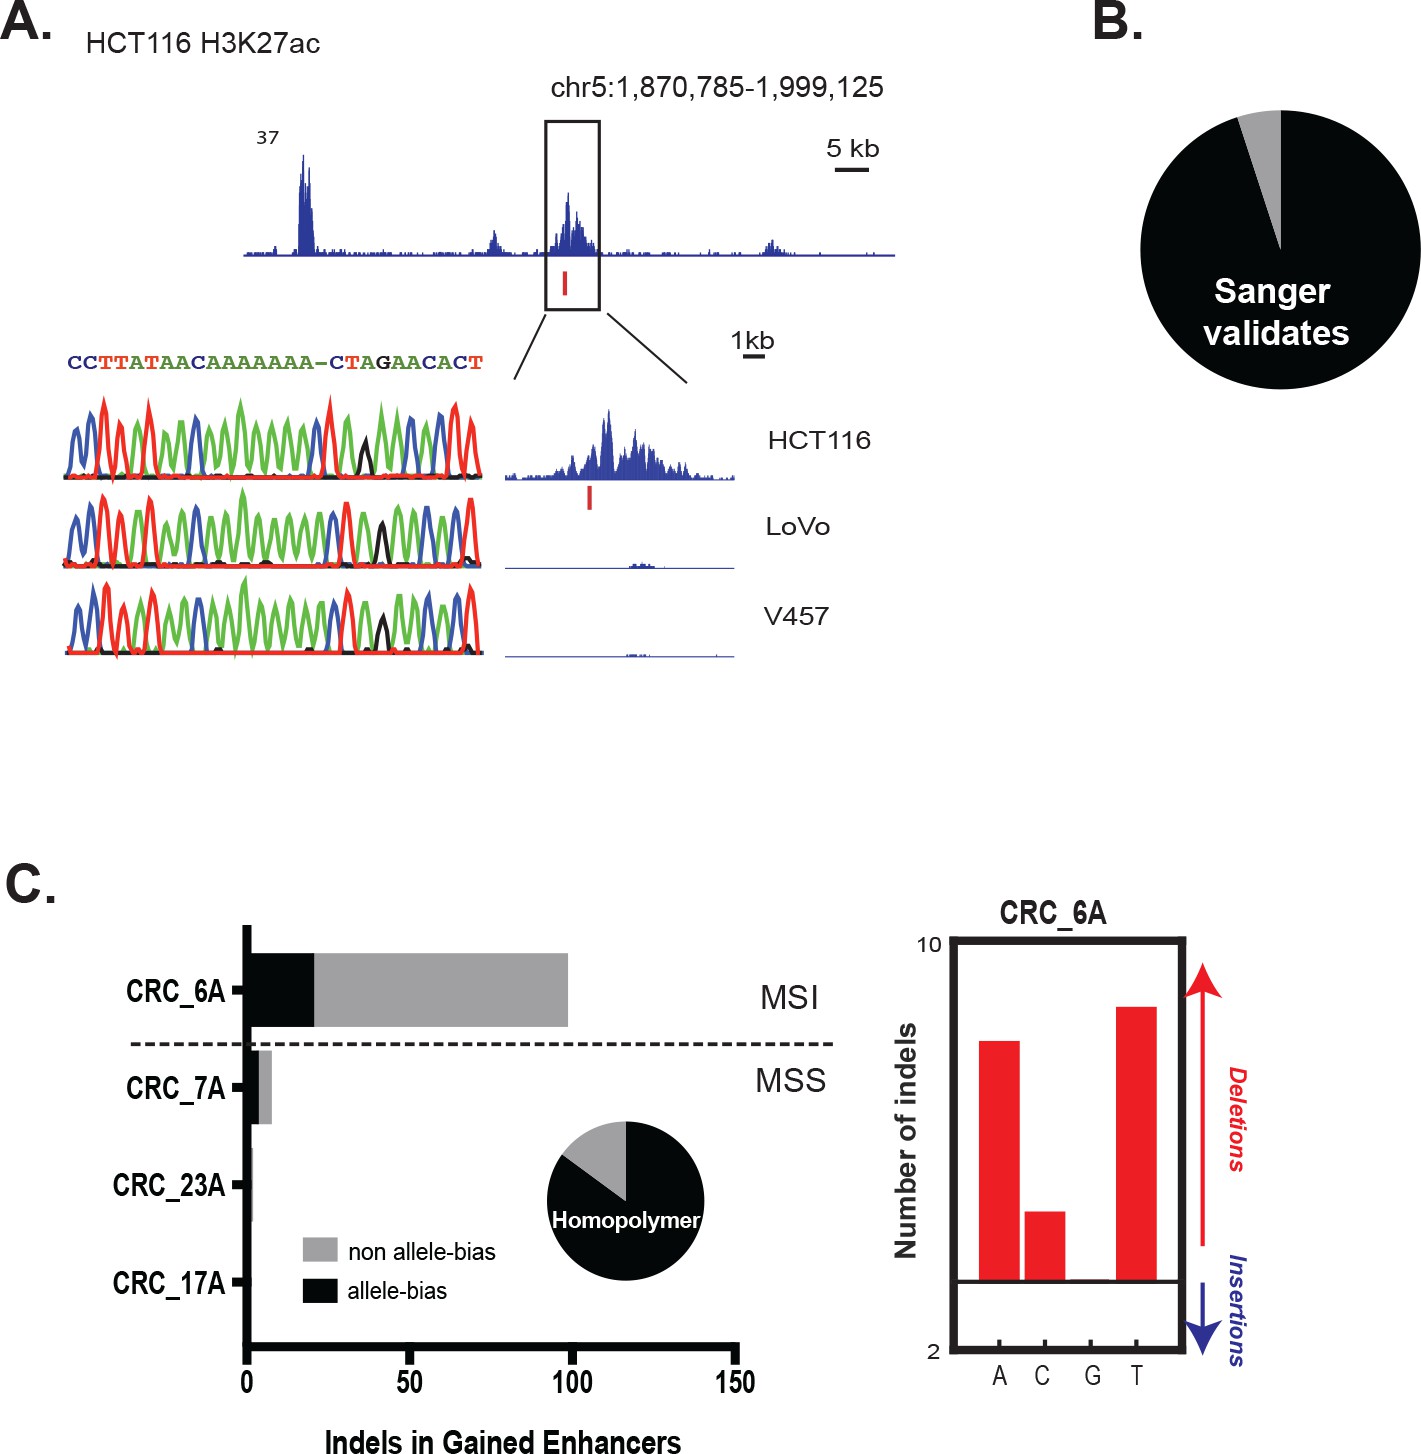
Validation of enhancer indels.
(A) Example of a gained enhancer indel confirmed by Sanger sequencing. (top) Genome Browser snapshot of a putative enhancer-activating indel detected in HCT-116 cells. (bottom) Sanger traces of the locus and zoomed in view of the peak for HCT-116 cells, and two non-indel cell lines (LoVo and V457). Y-axis scales are all 0 to 24. (B) Fraction of enhancer indels (19/20) validated by Sanger sequencing. (C) (left) Number of enhancer indels detected in four primary tumors. Pie chart shows fraction of indels detected in the CRC_6A sample that lie in homopolymers (17/20, or 85%). (right) Number of indels in homopolymers of A,C,G, or T in the CRC_6A sample.
Figure 2 with 1 supplement
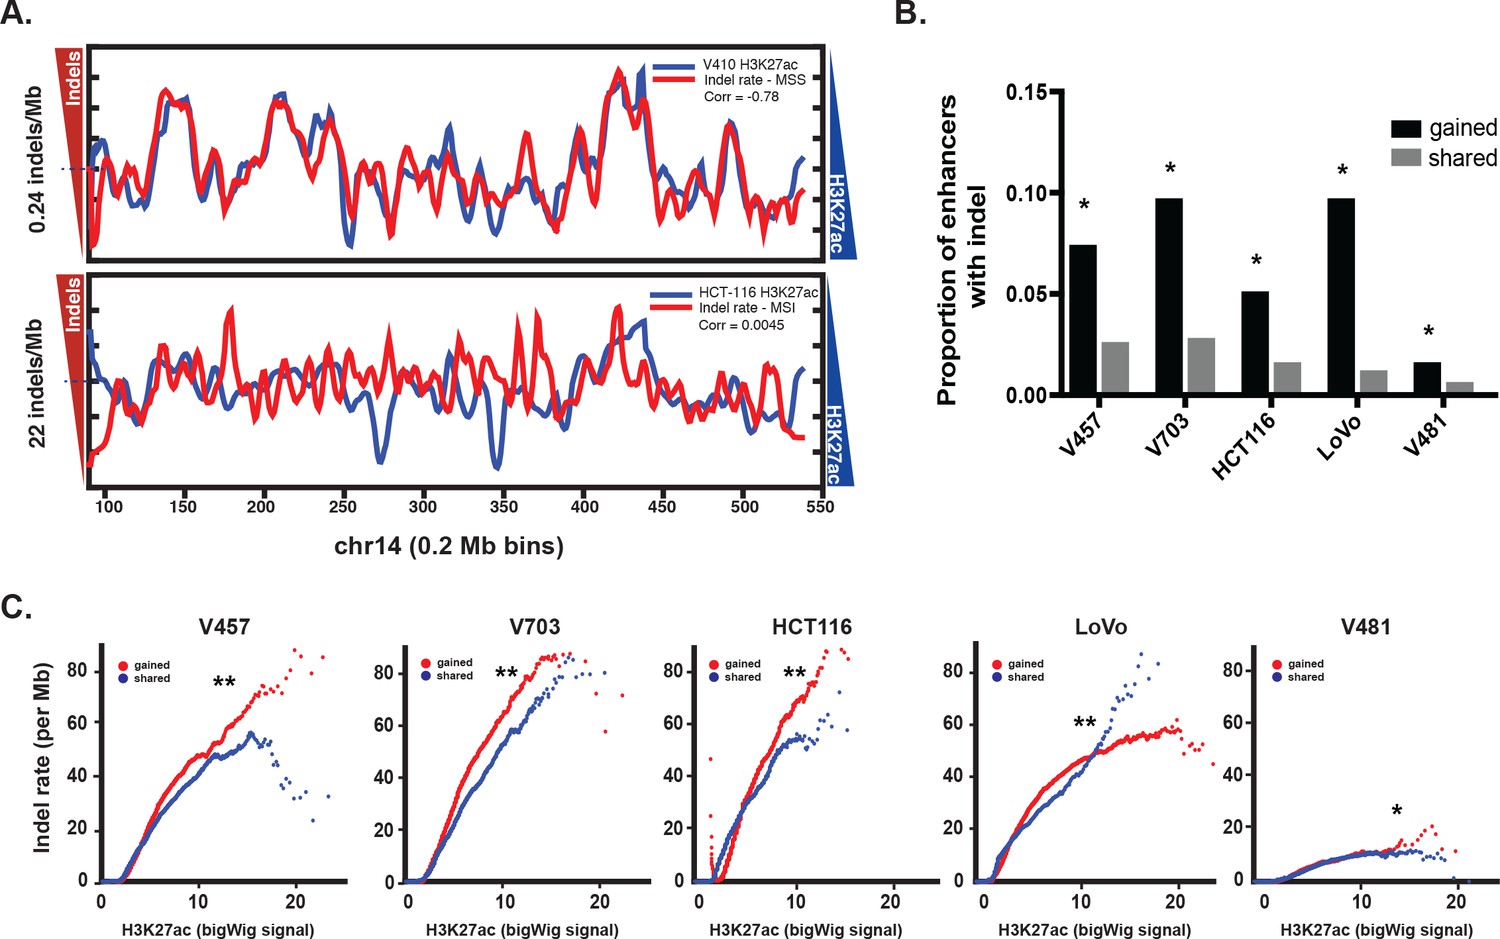
Enrichment of MSI indels in gained enhancers.
(A) MSS (top) and MSI (bottom) mutations (red) are overlaid on H3K27ac profiles (blue) of representative MSS (V410) and MSI (HCT-116) lines in 0.2 Mb bins on chromosome 14. Median mutation rates are shown next to left Y axis. The H3K27ac signal is inverted to better show anti-correlation. Pearson correlation values are shown. (B) Proportion of gained enhancers (black) and enhancers shared with normal crypt (grey) with at least one allele-biased indel. *p<1e-10, Z-test for two proportions. (C) Rate of allele-biased indels in gained (red) and shared (blue) enhancers, as a function of H3K27ac signal. **, p<1e-10; *p<0.05, t-test (Figure 2—source data 1).
-
Figure 2—source data 1
H3K27ac signal and mutation rate for MSS and MSI samples, in 0.5 Mb genomic bins.
- https://doi.org/10.7554/eLife.40760.008
-
Figure 2—source data 2
Indel rate and H3K27ac signal for gained enhancers and enhancers shared with crypt, for 5 MSI cell lines.
- https://doi.org/10.7554/eLife.40760.009
Figure 2—figure supplement 1
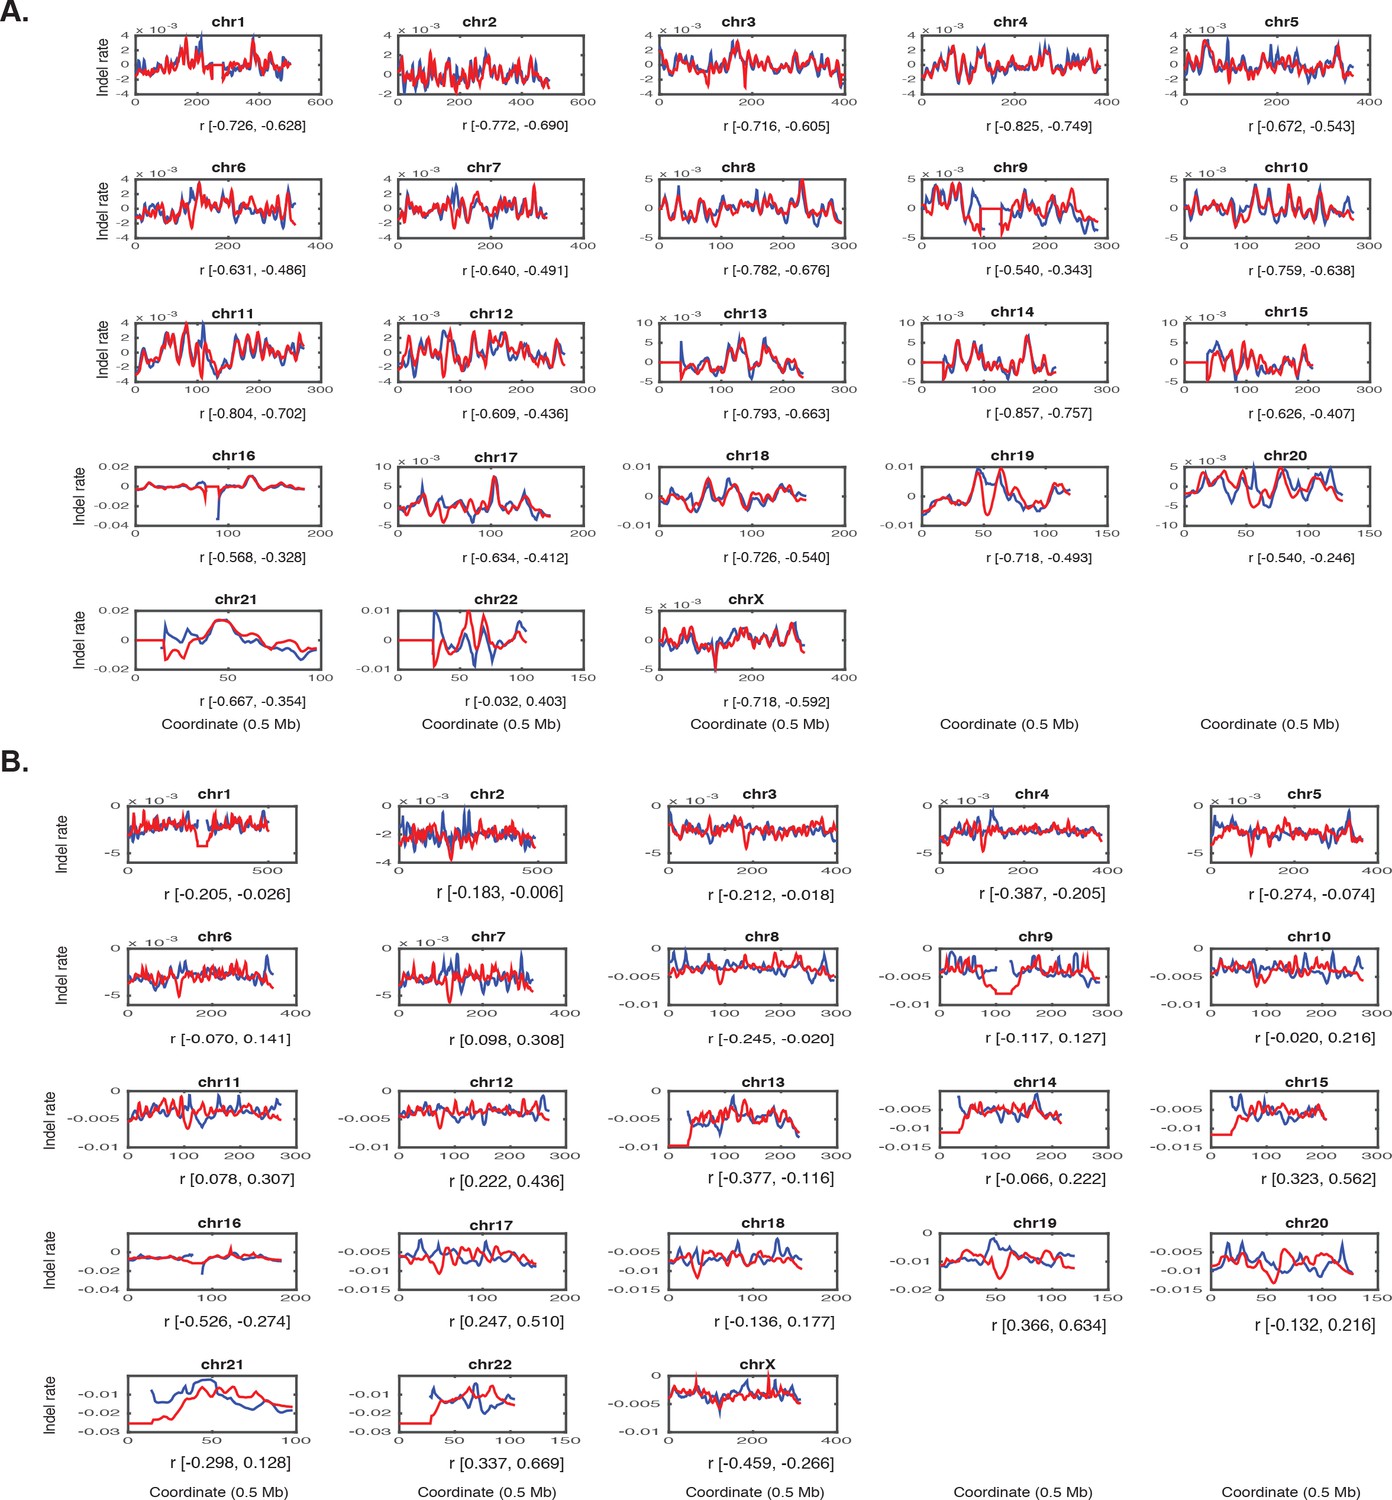
Genome-wide correlations of H3K27ac signal and mutation rate.
(A) MSS mutations (red) overlaid on H3K27ac profiles (blue) of representative MSS (V410) line in bins of 0.5 Mb, for chromosomes 1–22 and X. Ninety-five percent confidence intervals for Pearson correlation coefficient are reported. (B) Same, but for MSI mutations overlaid on HCT-116 H3K27ac. See Figure 2—source data 1.
Figure 3 with 1 supplement
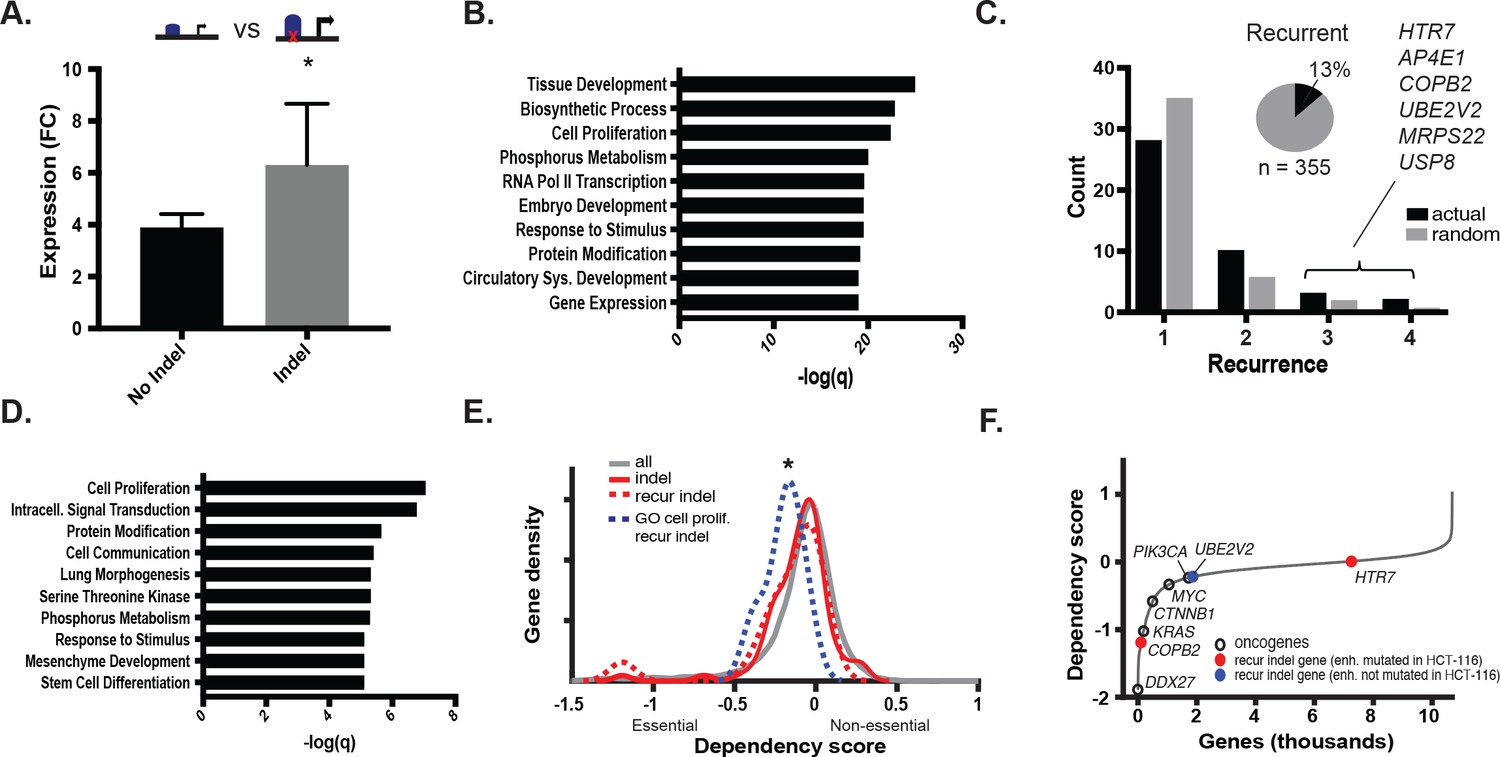
MSI enhancer indels impact target gene expression.
(A) Mean fold-change of expression (CRC/crypts) of genes associated with gained enhancers containing indels (grey; n = 352 sample-gene pairs) versus the same genes in cell lines with gained enhancers but lacking indels (black; n = 2384 sample-gene pairs). *p<0.01, 2-sample t-test (Figure 3—source data 1). (B) Enriched GO terms associated with enhancer indel genes. (C) (black) Distribution of number of TCGA samples with recurrent indel and (grey) average recurrence distribution from random sampling of TCGA indels (p<0.05, χ2 test). Listed genes have indels recurrent in three or more TCGA samples. Pie chart shows fraction of enhancer indels that are recurrent in at least one primary CRC tumor (Figure 3—source data 2). (D) Enriched GO terms associated with recurrent enhancer indel genes. (E). Distribution of dependency scores in HCT-116 cells for all expressed genes (grey; n = 13,584), indel genes (red; n = 100), recurrent indel genes (dotted-red; n = 17), and recurrent indel genes with ‘Cell Proliferation’ annotation (dotted-blue; n = 5). *p<0.05 for ‘Cell Proliferation’ recurrent indel gene versus all expressed genes, Wilcox ranksum test. (F) Genes ranked by dependency scores, showing select oncogenes (black circles), and recurrent indel genes with (red circles) and without (blue circles) enhancer mutation in HCT-116 cells. Data for recurrent indel genes shown in ‘C’ (USP8, AP4E1, MRPS22) were not available.
-
Figure 3—source data 1
Expression of predicted target genes of enhancer indels, recurrence of indels in primary tumors, and enriched GO terms.
- https://doi.org/10.7554/eLife.40760.011
-
Figure 3—source data 2
Expression of predicted target genes for all gained enhancers with an allele-biased indel, and distribution of recurrent enhancer indels in gained and shared enhancers.
- https://doi.org/10.7554/eLife.40760.012
Figure 3—figure supplement 1
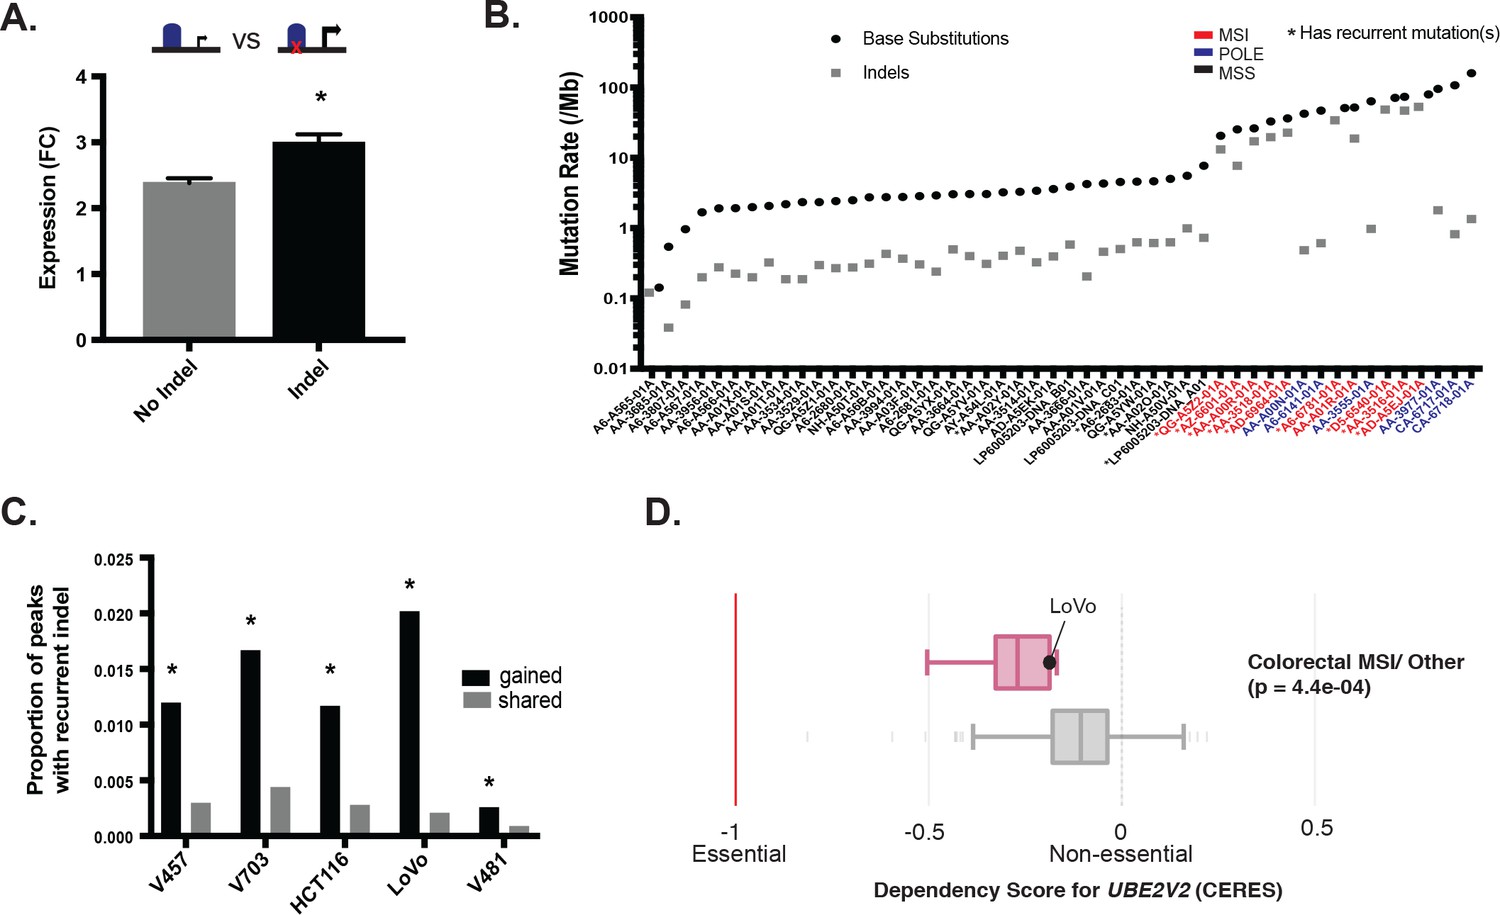
Recurrent MSI enhancer indels are enriched in gained enhancers.
(A) Mean fold-change of expression (CRC/crypts) of genes corresponding to all gained enhancers containing indels (n = 10,971 gene-sample pairs; grey), versus the same genes in cell lines with gained enhancers but lacking indels (n = 58,412 gene-sample pairs; black). *p<0.05, 2-sample t-test. (B) Rate of substitutions and indels detected in cohort of 50 primary CRC samples, ordered by total mutation rate. (C) Proportion of gained enhancers (black) and enhancers shared with normal crypt (grey) with at least one indel recurrent in primary CRC tumors. *p<0.05, Z-test of proportions. (D) Distribution of dependency scores for UBE2V2 in MSI lines (red) compared to all other lines (grey), from the DepMap CRISPR-knockout screen. Black dot indicates score for LoVo cell line. P value is from 2-sample t-test.
Figure 4
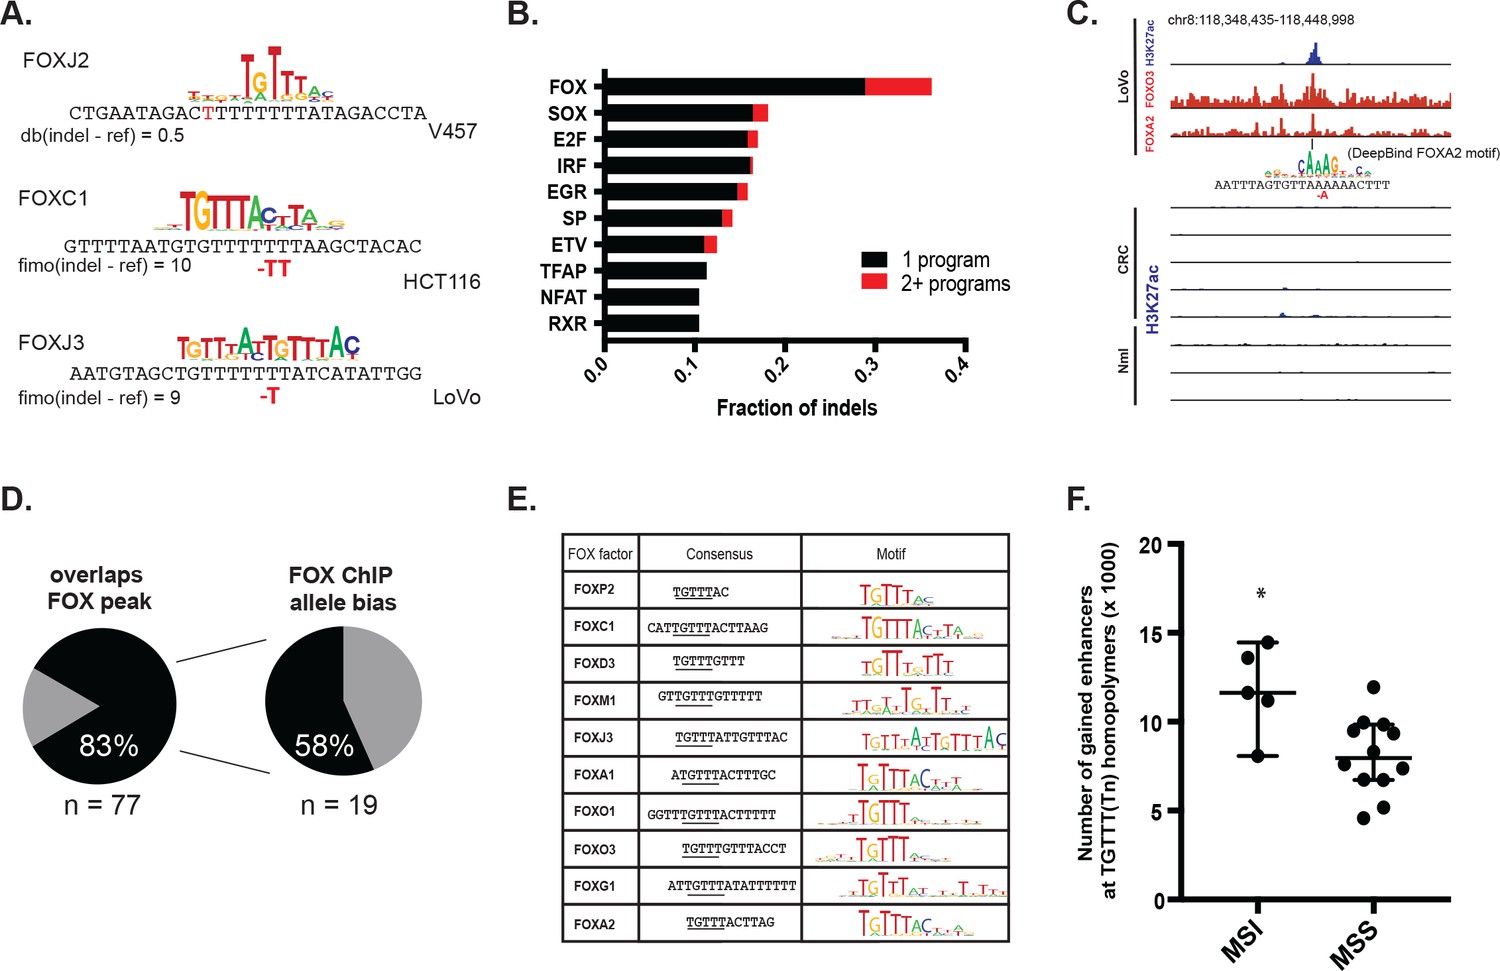
MSI enhancer indels recruit FOX factors.
(A) Examples of FOX motifs at MSI indels, with change in affinity scores. (B) Fraction of indels predicted to increase transcription factor affinity by TF family, supported by one (black) or multiple (red) computational programs. (Figure 4—source data 1). (C) Genome Browser snapshot of MSI enhancer indel overlapping FOXA2 and FOXO3 peaks in LoVo cells. Motif of FOXA2 generated by DeepBind, which predicts increased binding of FOXA2 to the indel alelle, is shown. (D) (left) Fraction of LoVo enhancer indels overlapping a FOX factor peak. (right) Fraction of indels in FOX factor peaks and with >3 FOX ChIP read coverage showing allele-bias. (E) Motifs of FOX factors expressed in MSI lines and predicted to bind preferentially to indel alleles. (F) Number of gained enhancers at TGTTT(Tn) motif in MSI versus MSS lines. *p<0.05, Wilcox ranksum test.
-
Figure 4—source data 1
Transcription factors predicted to bind more favorably to enhancer indels, based on three computational programs.
- https://doi.org/10.7554/eLife.40760.015
Figure 5
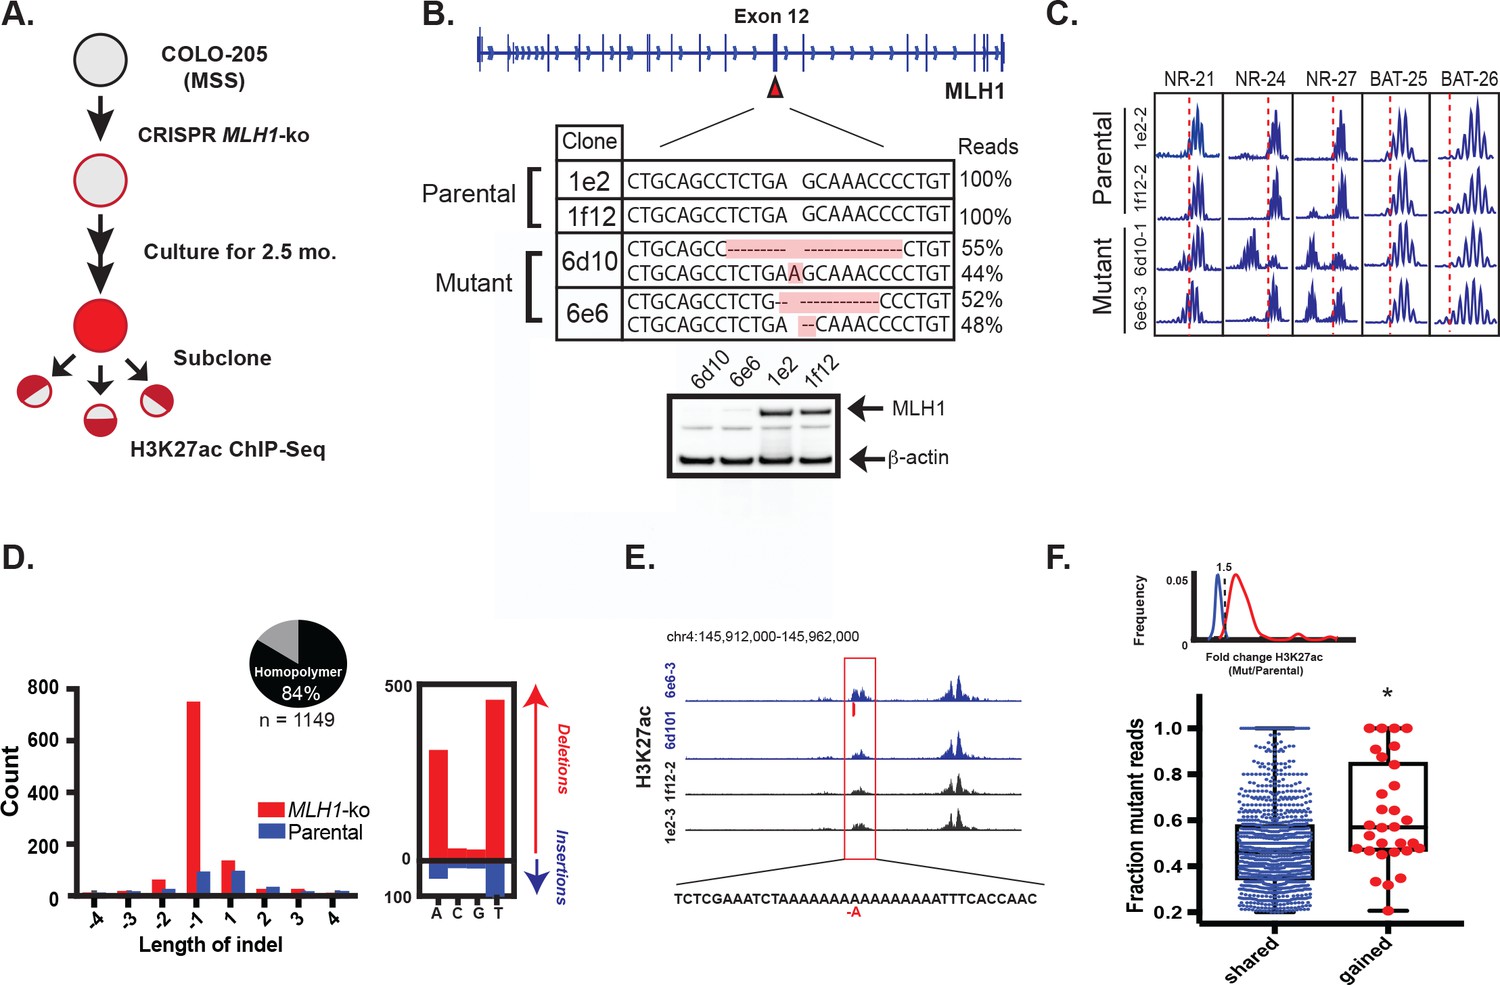
MLH1 inactivation induces MSI and yields enhancer mutations.
(A) Overview of MSI induction experiment. (B) CRISPR-mediated knockout of MLH1. Mutations highlighted in orange. (bottom) Western blot analysis of MLH1 in MLH1 wildtype and mutant clones. Beta-actin is shown as a loading control. (C) PCR assay of five MSI markers in MLH1+/+ and MLH1-/- clones. (D) Distribution of enhancer indel lengths. Pie chart represents fraction of indels affecting homopolymers. (right) Count of homopolymer insertion (blue) and deletion (red) mutations by mononucleotide repeat. (E) Genome browser snapshot of indel (red bar) associated with increase in H3K27ac signal. Y-axis scales are all 0 to 90. (F) Mutant allele fraction at indels in shared and gained H3K27ac peaks. (top) Density of H3K27ac signal fold change (MLH1-/-/MLH1+/+) for shared (blue) and gained (red) peaks in MLH1-/- cells, relative to MLH1+/+ cells. (bottom) Dot plot of the mutant allele fraction for indels in shared (n = 1087) and gained (n = 30) peaks. *p<0.001, Wilcox ranksum test (Figure 5—source data 1).
-
Figure 5—source data 1
Enhancer indels detected from H3K27ac ChIP-seq of MLH1-/- and MLH1+/+ cells, cultured for 2.5 months.
- https://doi.org/10.7554/eLife.40760.018
Figure 6
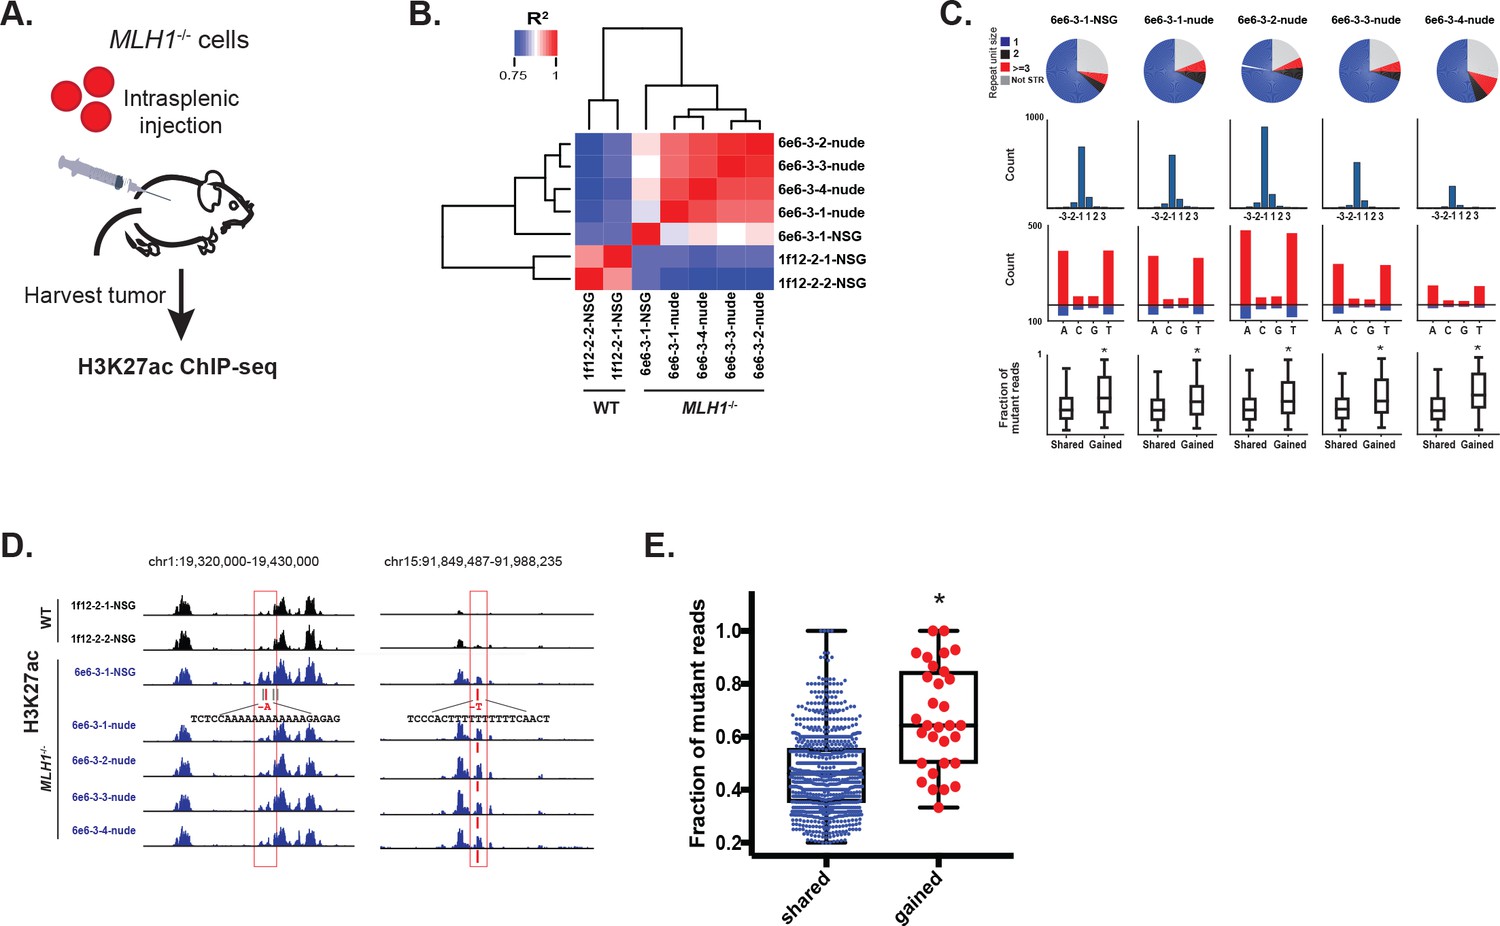
MSI enhancer indels are propagated in tumors.
(A) Overview of mouse tumor formation assay. (B) Heatmap of R2 values from Pearson correlation of H3K27ac signal at enhancers. (C) (top) Pie charts show distribution of types of mutations (mono-, di-, tri-nucleotide or higher, and non-short tandem repeat). (2nd row) Histogram of indel sizes. (3rd row) Bar plots of homopolymer indel frequency by mononucleotide repeat. (bottom) Boxplots of the mutant allele fraction distribution for indels in gained peaks and peaks shared with wildtype tumors. *p<0.001, Wilcox ranksum test. (D) Genome Browser snapshots of indels (red bars) detected in MLH1-/- tumors and associated with increased H3K27ac signal (left, Y-axis scales are all 0–156; right, Y-axis scales are all 0–95). (E) Dot plot of the mutant allele fraction for homopolymer indels in shared (n = 894) peaks and those correlating with gained H3K27ac enrichment (n = 31). *p<0.001, Wilcox ranksum test. See Figure 6—source data 1.
-
Figure 6—source data 1
Enhancer indels detected from H3K27ac ChIP-seq of tumors derived from MLH1-/- and MLH1+/+ cells introduced through intrasplenic injection into mice.
- https://doi.org/10.7554/eLife.40760.020
Tables
Table 1
Top motifs enriched at indels.
The logo displayed is for representative factors from each TF family (FOXC1, IRF1, SOX2, SP1, and EGR1). The total number of indels is 355.
| TF (% of indels) | Motifs |
|---|---|
| FOX (20%) |  |
| IRF (4%) |  |
| SOX (4%) |  |
| SP (4%) |  |
| EGR (3%) |  |
Key resources table
| Reagent type or resource | Designation | Source or reference | Identifiers | Additional information |
|---|---|---|---|---|
| Cell line (Homo-sapiens) | LoVo | ATCC | RRID:CVCL_0399 | |
| Cell line (Homo-sapiens) | Colo-205 | ATCC | RRID:CVCL_0218 | |
| Cell line (Homo-sapiens) | 6d10-1 | This paper | Derived from Colo-205. These cells were CRISPR-edited to knock out MLH1 (to get MLH1-/- cells), cultured for 2.5 months, then subcloned. | |
| Cell line (Homo-sapiens) | 6e6-3 | This paper | Derived from Colo-205. These cells were CRISPR-edited to knock out MLH1 (to get MLH1-/- cells), cultured for 2.5 months, then subcloned. | |
| Cell line (Homo-sapiens) | 1e2-3 | This paper | Derived from Colo-205. These cells were from the same nucleofected pool as MLH1-ko clones but were not edited (are MLH1+/+ cells), cultured for 2.5 months, then subcloned. | |
| Cell line (Homo-sapiens) | 1f12-2 | This paper | Derived from Colo-205. These cells were from the same nucleofected pool as MLH1-ko clones but were not edited (are MLH1+/+ cells), cultured for 2.5 months, then subcloned. | |
| Antibody | anti-MLH1 (mouse monoclonal) | BD Pharmingen | RRID:AB_394040 | (1:250) |
| Antibody | anti-beta actin (rabbit polyclonal) | Abcam | RRID:AB_2305186 | (1:1000) |
| Antibody | anti-rabbit IgG (H + L) (goat polyclonal) | ThermoFisher | RRID:AB_228341 | (1:20000) |
| Antibody | anti-H3K27ac (rabbit polyclonal) | Abcam | RRID:AB_2118291 | (1:50) |
| Software, algorithm | indel calling pipeline | This paper | Stores scripts used to call indel mutations from H3K27ac ChIP-seq data. Available at https://github.com/scacherilab/indel_calling_pipeline (Saiakhova, 2019; copy archived at https://github.com/elifesciences-publications/indel_calling_pipeline). |
Additional files
-
Transparent reporting form
- https://doi.org/10.7554/eLife.40760.023
Download links
A two-part list of links to download the article, or parts of the article, in various formats.
Downloads (link to download the article as PDF)
Open citations (links to open the citations from this article in various online reference manager services)
Cite this article (links to download the citations from this article in formats compatible with various reference manager tools)
Mismatch repair-signature mutations activate gene enhancers across human colorectal cancer epigenomes
eLife 8:e40760.
https://doi.org/10.7554/eLife.40760


