Cryptic genetic variation shapes the adaptive evolutionary potential of enzymes
- University of British Columbia, Canada
- Australian National University, Australia
- Uppsala University, Sweden
Figures
Figure 1 with 1 supplement

Comparative directed evolution of metallo-β-lactamases (MBLs).
(A) Catalytic efficiencies (kcat/KM) of six metallo-β-lactamases (MBLs) for β-lactamase and PMH activities. Data are presented in Supplementary file 1B. The phylogenetic relationships are shown with bootstrap values indicated at each node. (B) Comparison of the overall 3D structures and biophysical properties of NDM1 (blue, PDB ID: 3SPU) and VIM2 (green, PDB ID: 1KO3). (C) Overview of the comparative directed evolution experiment of MBLs toward PMH activity. (D) PMH fitness (PMH activity in cell lysate) improvements of four MBLS during directed evolution. Data are presented in Supplementary file 1G. (E) The mutations fixed in NDM1 and VIM2 over ten rounds of directed evolution. The structural location of the mutations is mapped on the wild-type structures of NDM1 and VIM2, respectively, with the C-α atoms of the mutated residues shown as spheres (upper panel). Mutations are presented on a partial alignment between NDM1 and VIM2 sequences (bottom panel). A full alignment of MBLs and the mutations of the individual variants are presented in Figure 1—figure supplement 1 and Supplementary file 1F.
Figure 1—figure supplement 1
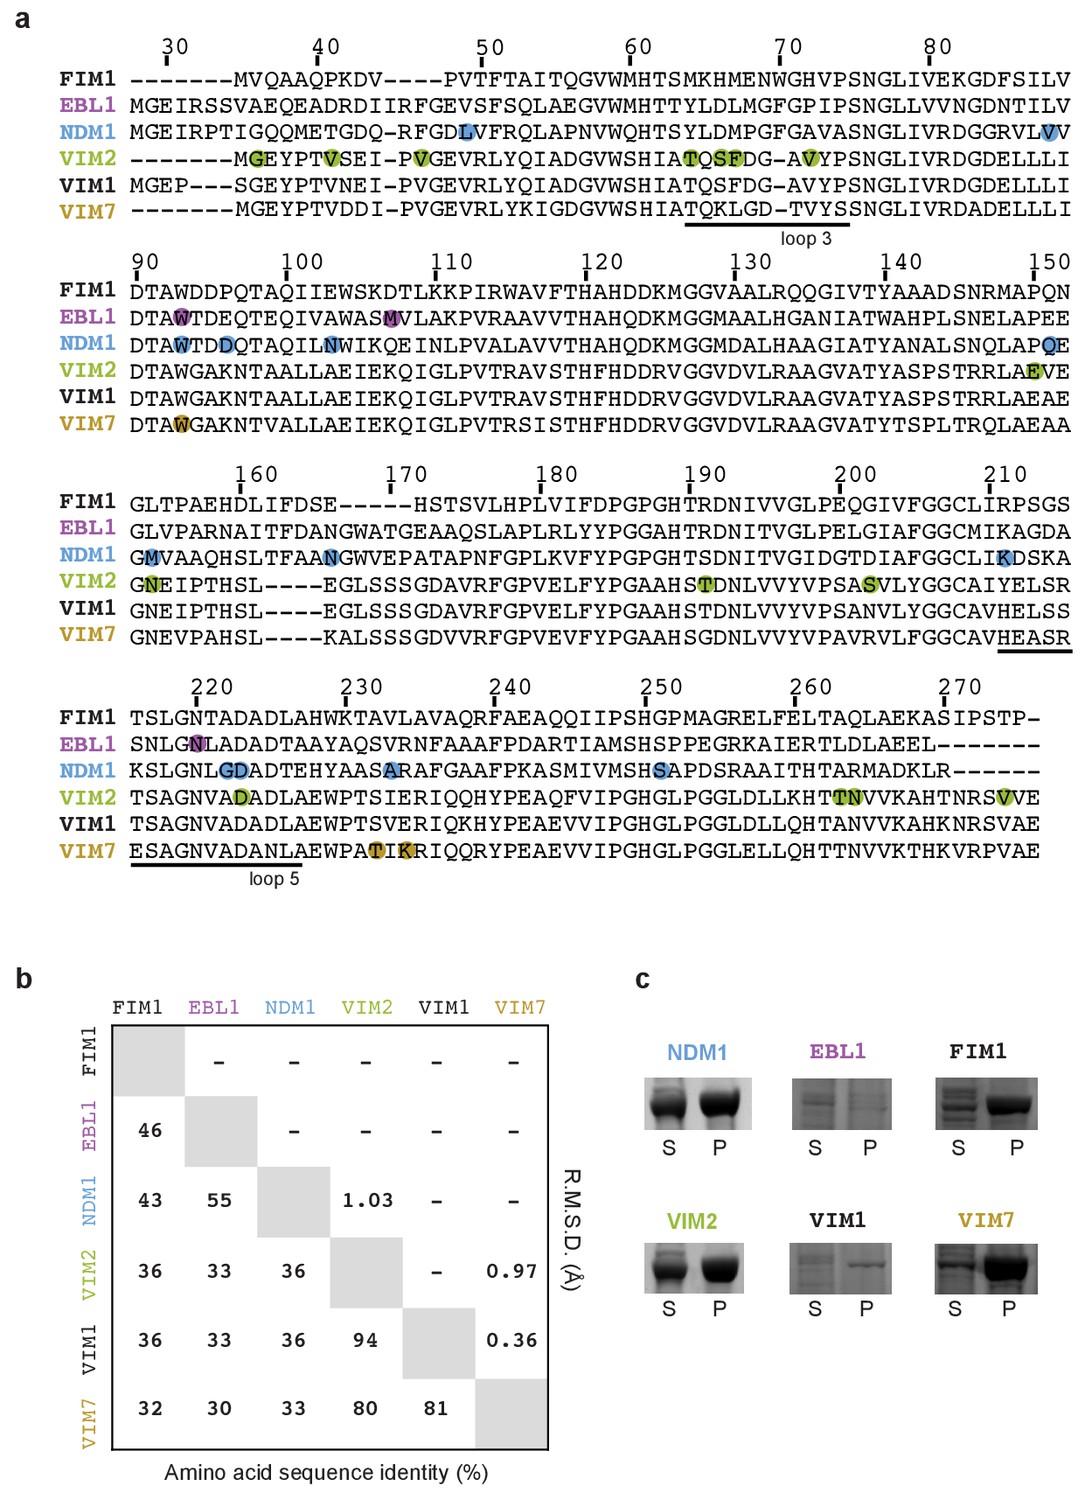
Sequence comparison between metallo-β-lactamases.
(A) Sequence alignment of selected metallo-β-lactamases. Residue number is based on the NDM1 sequence (PDB-ID 3spu). Positions that were mutated and selected during the directed evolution of PMH activities are highlighted in color. Actual mutations are listed in Supplementary file 1B. (B) Sequence identity and structure similarity among selected B1 β-lactamases. A multiple sequence alignment of the nine B1 β-lactamases using ClustalW2 (standard parameters), which was then used to calculate the pairwise sequence identities using the web-based program SIAS (hcp://imed.med.ucm.es/Tools/sias.html) with gaps taken into account. To determine pairwise structural similarity, we computed the root mean standard deviation (RMSD) between all structure pairs using the align command PyMOL. (C) SDS-PAGE images of protein expression in the supernatant (S) and pellet (P) fractions of the cell lysate. Images for NDM1 and Vim2 are the same as the ones used in Figure 3—figure supplement 1.
Figure 2 with 2 supplements
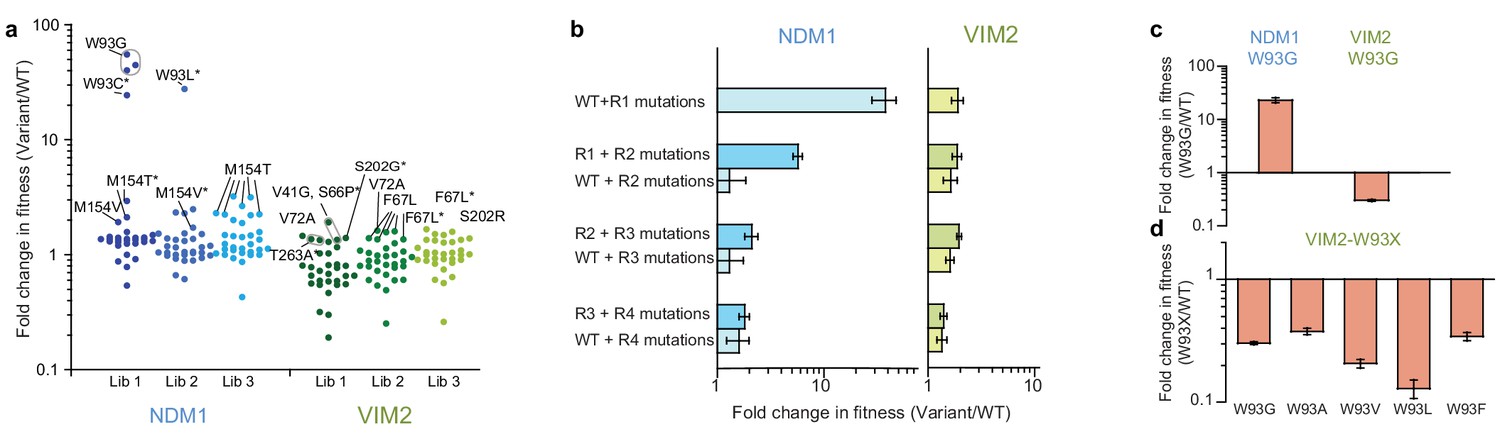
Accessibility of adaptive mutations from each starting point.
(A) Additional screenings of NDM1 and VIM2 round one libraries. Activities of the top 30 variants isolated from additional screenings of three independently generated mutagenized libraries and normalized on the PMH fitness of NDM1-WT and VIM2-WT, respectively; presented as scatterplots. Mutants are labeled when variants possess a mutation previously encountered in the original directed evolution or if this mutation is located at the same position. Asterisks indicate that the variant has other mutations in addition to the labeled one. Mutations and activities of all improved variants are listed in Supplementary file 1H. The activities of all 2160 variants in the round one additional screenings are presented in Figure 2—figure supplement 1. (B) Epistasis analysis of mutations. Mutations occurring in the NDM1 and VIM2 trajectories were introduced into their respective wild-type sequence and the resulting PMH fitness was compared to the original PMH fitness change observed during the trajectory. (C) Fold change in PMH fitness induced by mutation W93G in NDM1-WT and VIM2-WT, respectively. (D) Fold change in PMH fitness induced by mutation of Trp93 in VIM2 to various hydrophobic residues. A full description of the lysate activities is presented in Supplementary file 1G. Errors bars represent the propagated standard deviation from triplicate measurements.
Figure 2—figure supplement 1

Screening of additional libraries.
Three additional mutagenized libraries were generated by performing error-prone PCR and cloning to the expression vector from each wild-type gene. The three libraries were transformed into E. coli BL21 (DE3), and pre-screened with 4 μg/ml ampicillin on agar plates. (A, B) 720 variants from each library (in total 2160 variants) were picked from the agar plates, and the cell lysate activity of variants was measured. The activity of variants is normalized to the wild-type enzyme. (C, D) Top 30 variants from each library were picked and re-assayed with triplicate. Mutations of positive variants are presented in Supplementary file 1G.
Figure 2—figure supplement 2
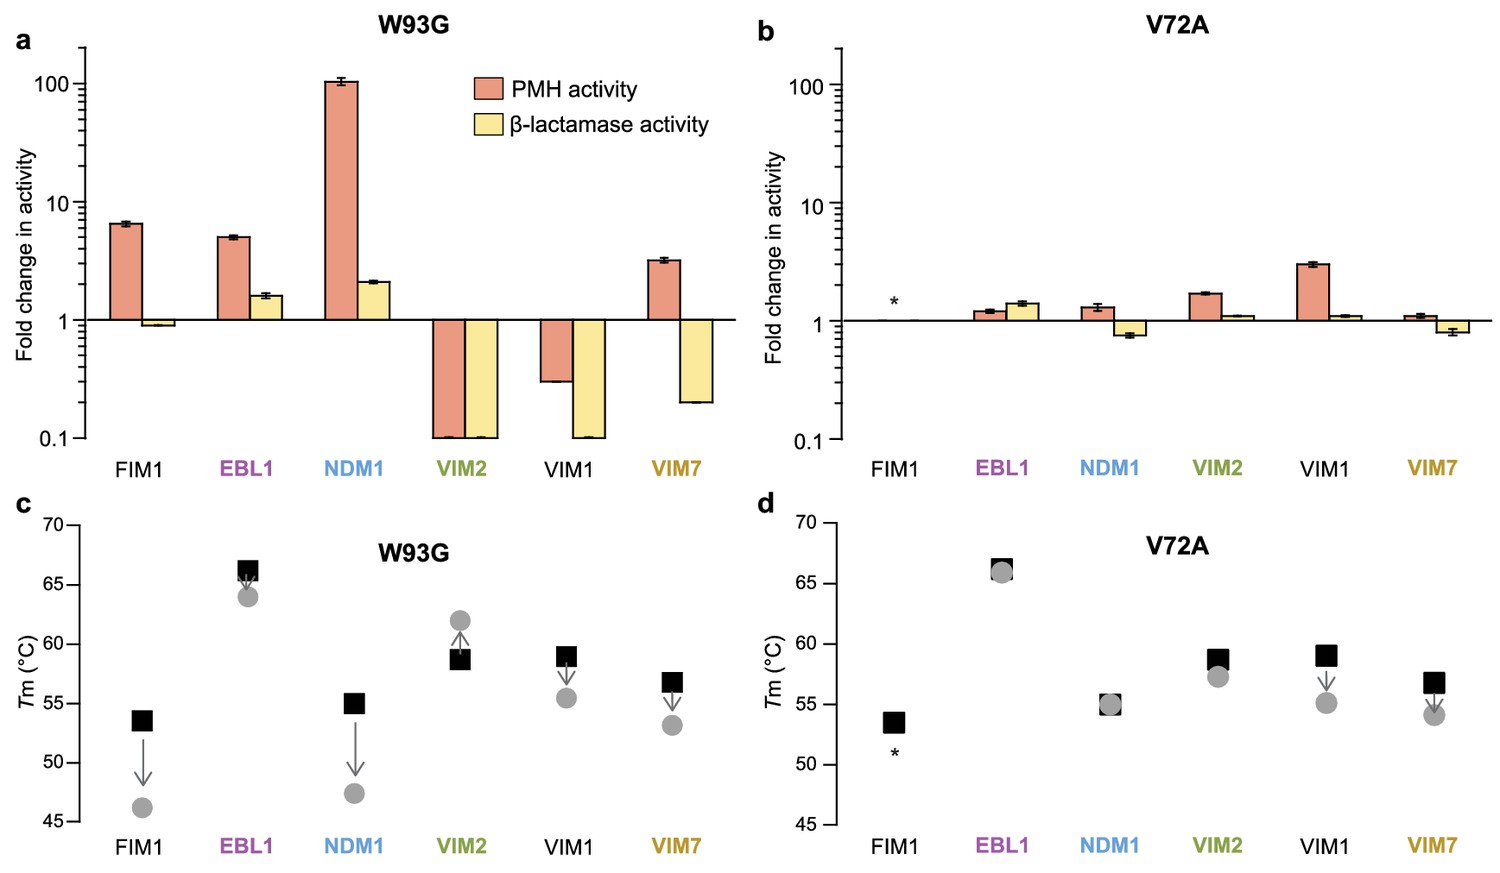
Differential effects of mutations (W93G and V72A) on six metallo-β-lactamases.
Fold change in PMH and β-lactamase activity of variants. (A) W93G and (B) V72A variants compared to the variants containing a Trp93 and Val72. Activity levels of purified enzymes were measured at single enzyme (5 μM for PMH and 1 nM for β-lactamase activity) and substrate (500 μM for PMH and 100 μM for β-lactamase activity) concentrations. The wild-type NDM1 contains an Ala at position 72; the activity presented is the ratio of the wild-type to the A72V variant. The wild-type EBL1 contains a Pro at position 72; the activity presented is the ratio of the P72A to the P72V variant. Errors bars represent the standard deviation calculated from three measurements. Changes in melting temperature (Tm) of (C) W93G and (D) V72A. Black squares denote the wild-type enzyme, and grey circles denote the mutant. Arrows indicate the change of melting temperature by the mutation. The melting temperature was calculated from the midpoint of the thermal denaturation curve of purified proteins. Asterisks indicate that the fold change in activity and change in Tm could not be determined, because one of the variants was not soluble. The catalytic activities and Tm of each mutant are listed in Supplementary file 1H.
Figure 3 with 3 supplements
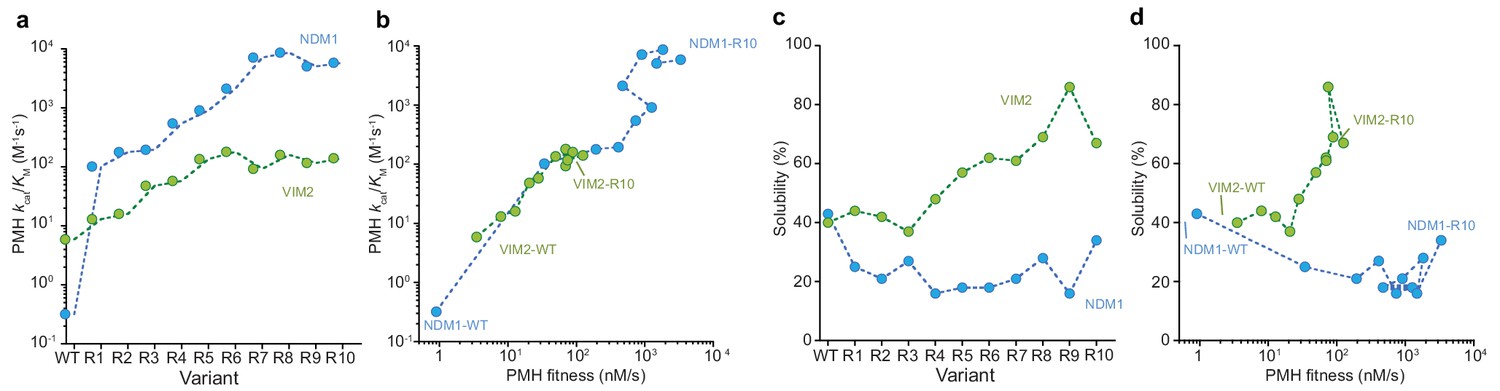
Molecular and phenotypic changes along the NDM1 and VIM2 evolutionary trajectories.
(A) Catalytic efficiencies (kcat/KM) of purified variants for PMH activity. (B) Correlation between PMH fitness (cell lysate activity) and catalytic efficiency (kcat/KM in M−1s−1) of purified enzymes along the evolutionary trajectories. (C) Changes in solubility during evolution. SDS-PAGE images of the soluble and insoluble protein expressions for each variant are presented in Figure 3—figure supplement 1. (D) Correlation between PMH fitness and solubility along the evolutionary trajectories. Individual catalytic, thermostability, and solubility parameters are listed in Supplementary file 2.
Figure 3—figure supplement 1
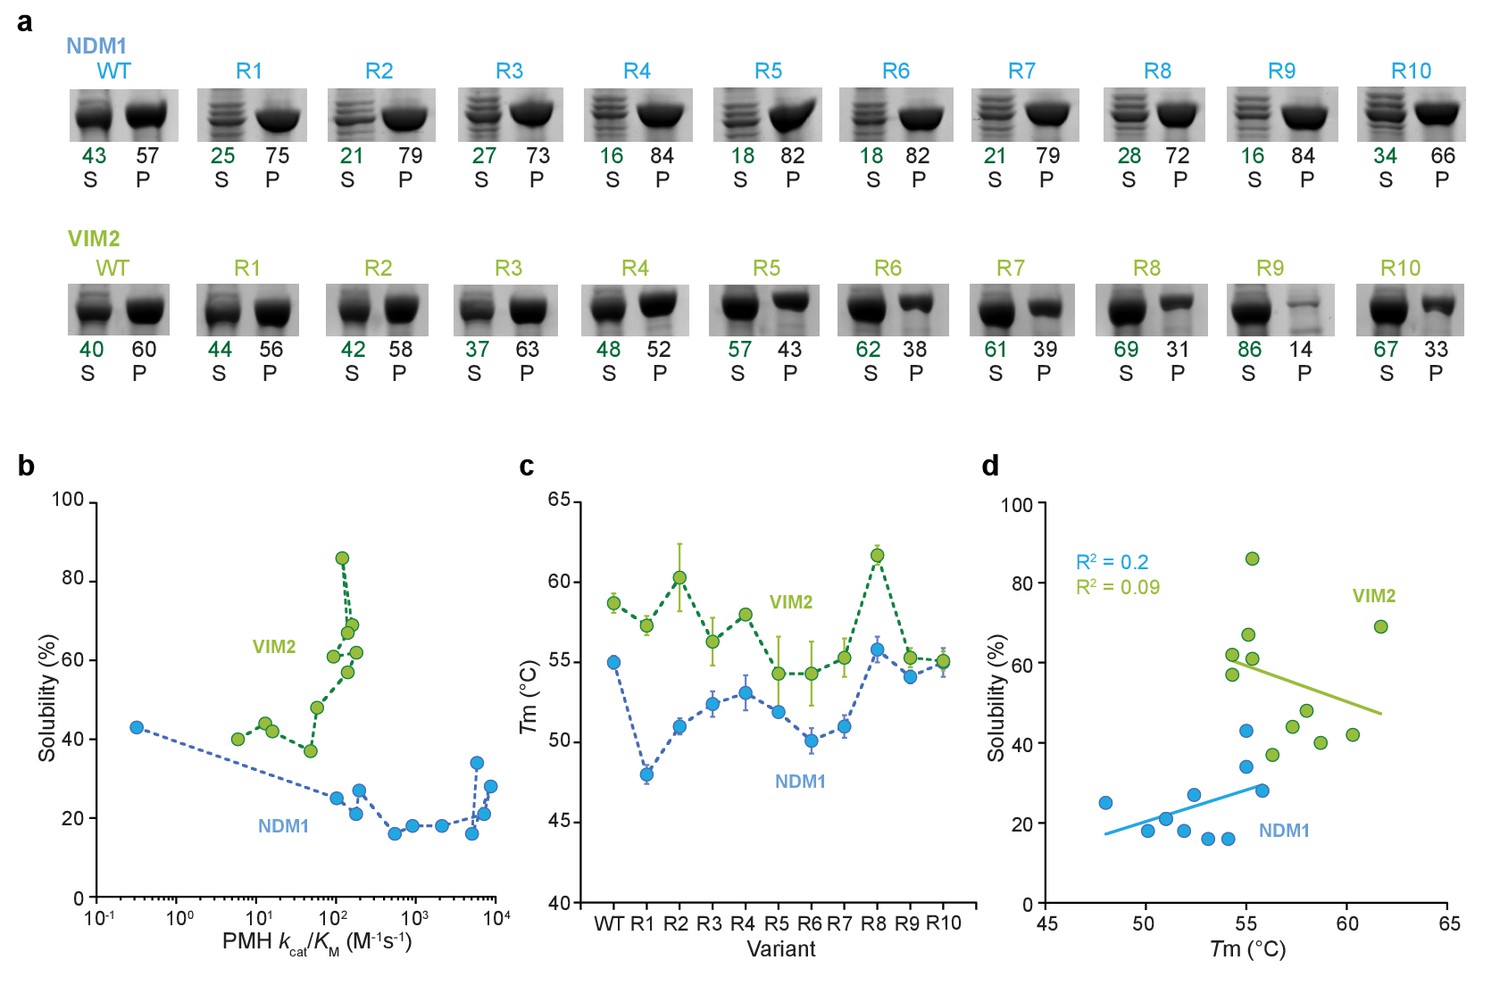
Solubility and melting temperature of variants.
(A) SDS-PAGE images of protein expression in the supernatant (S) and pellet (P) fractions of the cell lysate. The numbers below indicate the percentage of protein in the soluble and insoluble fraction, which is calculated from the relative intensities of the supernatant and pellet bands. (B) Correlation between solubility and catalytic efficiency along the evolutionary trajectories. (C) Melting temperature (Tm) of all variants along the evolutionary trajectory as calculated from the midpoint of the denaturation curve in a thermal shift assay. Error bars represent standard deviation from three independent assays. (D) Correlation between solubility and melting temperature (Tm) of NDM1 and VIM2 variants.
Figure 3—figure supplement 2
Oligomerization states of NDM1 and VIM2.
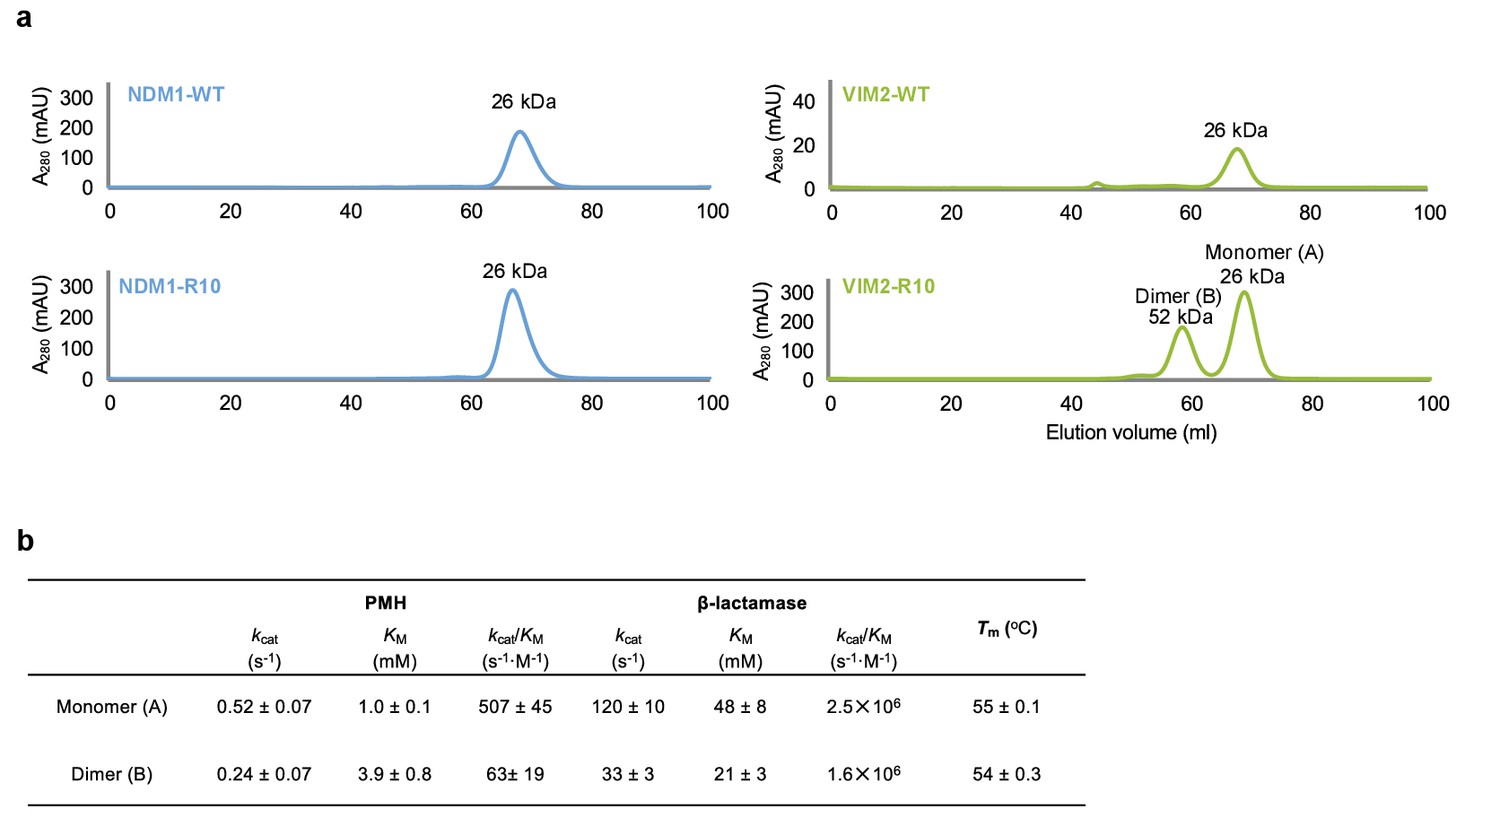
(A) Size-exclusion chromatography (SEC) elution profile of NDM1-WT, NDM1-R10, VIM2-WT and VIM2-R10 (Superdex 75, GE Healthcare). Protein sizes were identified based on the calibration curve on the manufacturer’s instruction (GE Healthcare) for gel filtration calibration kits LMW (low molecular weight). VIM-R10 showed two peaks that correspond to monomeric and dimeric states. (B) Kinetic parameters and melting temperature (Tm) of monomer and dimer states of VIM2-R10.
Figure 3—figure supplement 3

Effect of expression temperature on cell lysate PMH fitness (cell lysate activity in nM/s).
Variants of NDM1 (blue) and VIM2 (green) were expressed at (A) 20°C, (B) 30°C, and (C) 37°C. Cell lysate preparation and PMH fitness measurement were performed identically for all expression temperatures.
Figure 4 with 1 supplement
The structural basis for improved PMH activity.
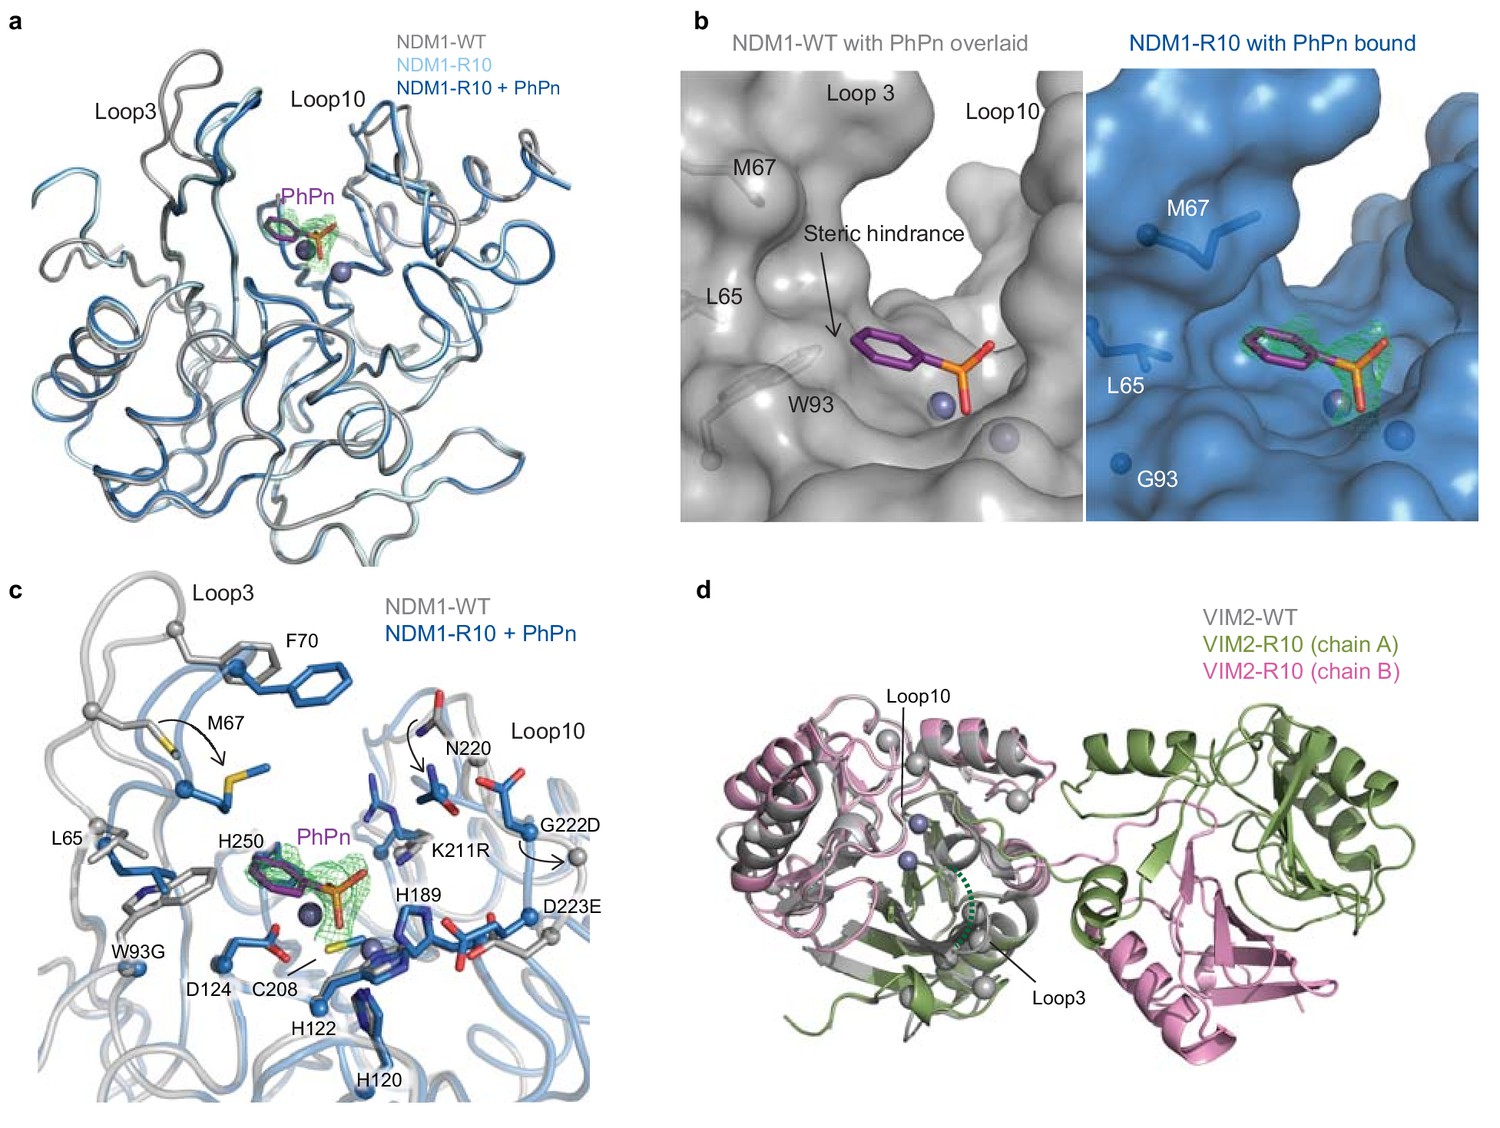
(A) Structural overlay of NDM1-WT (grey, PDB ID: 3SPU) and NDM1-R10 in the apo form (cyan, PDB ID: 5JQJ) and NDM1-R10 in complex with the PMH hydrolysis product, phenylphosphonate (PhPn, magenta sticks) (blue, PDB ID: 5K4M). The active site metal ions are shown as spheres. (B) Surface views of the active site of NDM1-WT and NDM1-R10 with the PMH product. The product in the NDM1-WT structure is overlaid from the NDM1-R10 structure. The mFo-dFc omit electron density for the phenylphosphonate is shown (green mesh), contoured at 2.5σ. (C) Comparison of active site residues between NDM1-WT and NDM1-R10. (D) Structural overlay of monomeric VIM2-WT (grey, PDB ID: 1KO3) and domain swapped-dimeric VIM2-R10 (green and pink, PDB-ID: 6BM9). The disordered loop three in VIM-R10 is indicated as a dashed green line. The mutations accumulated during the VIM2 trajectory are depicted as light grey spheres. The mFo-Fc omit electron density of the structure can be found in Figure 4—figure supplement 1.
Figure 4—figure supplement 1
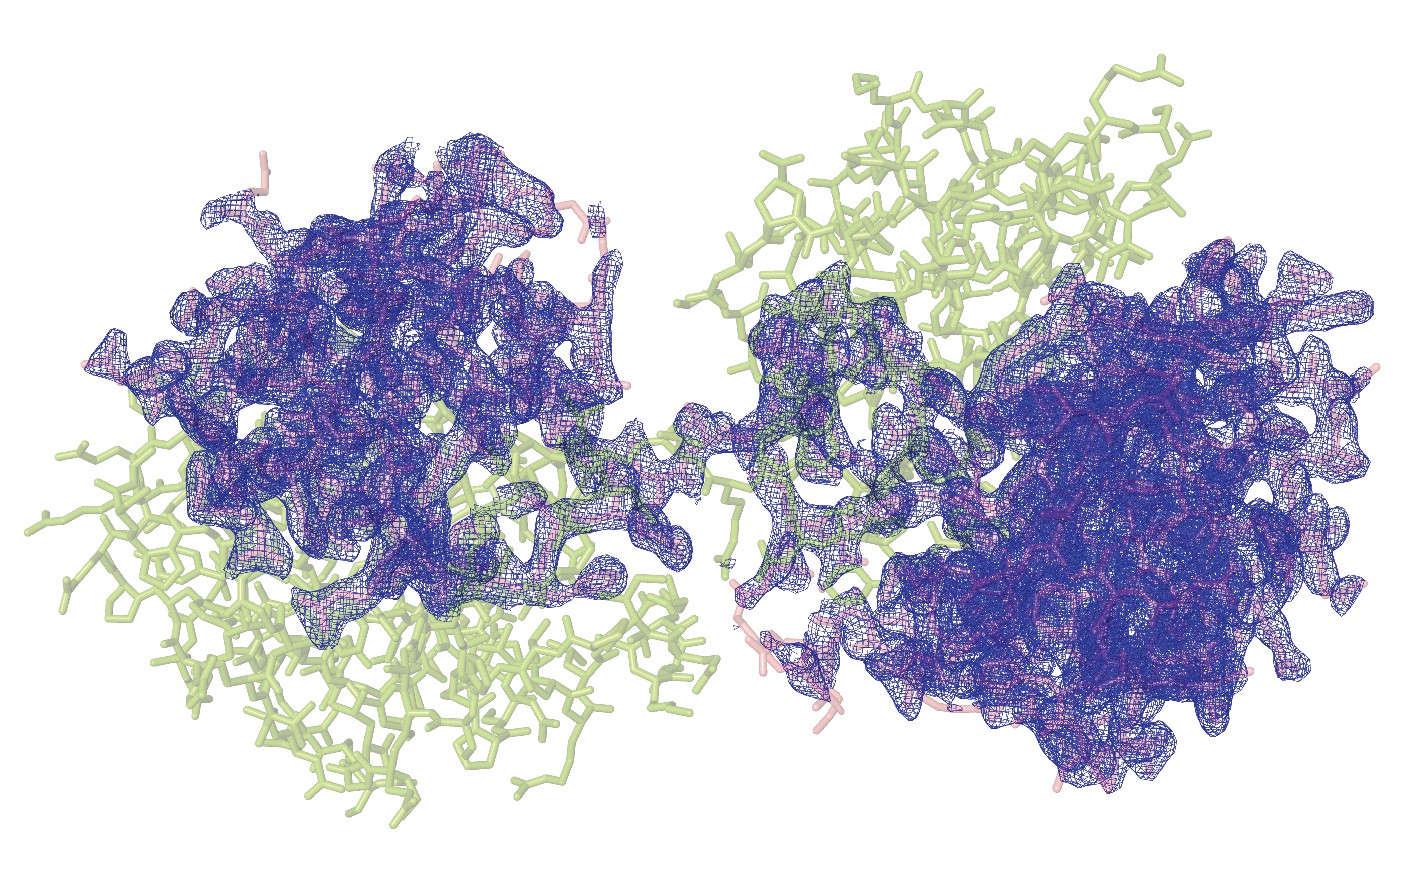
Structure of the domain swapped-dimeric VIM2-R10.
A stick representation of the structure of the domain swapped-dimeric VIM2-R10 (PDB-ID: 6BM9). Chain A is highlighted as green, and chain B as pink. The mFo-dFc omit electron density of chain B is shown (blue mesh), contoured at 2.5σ.
Figure 5 with 2 supplements
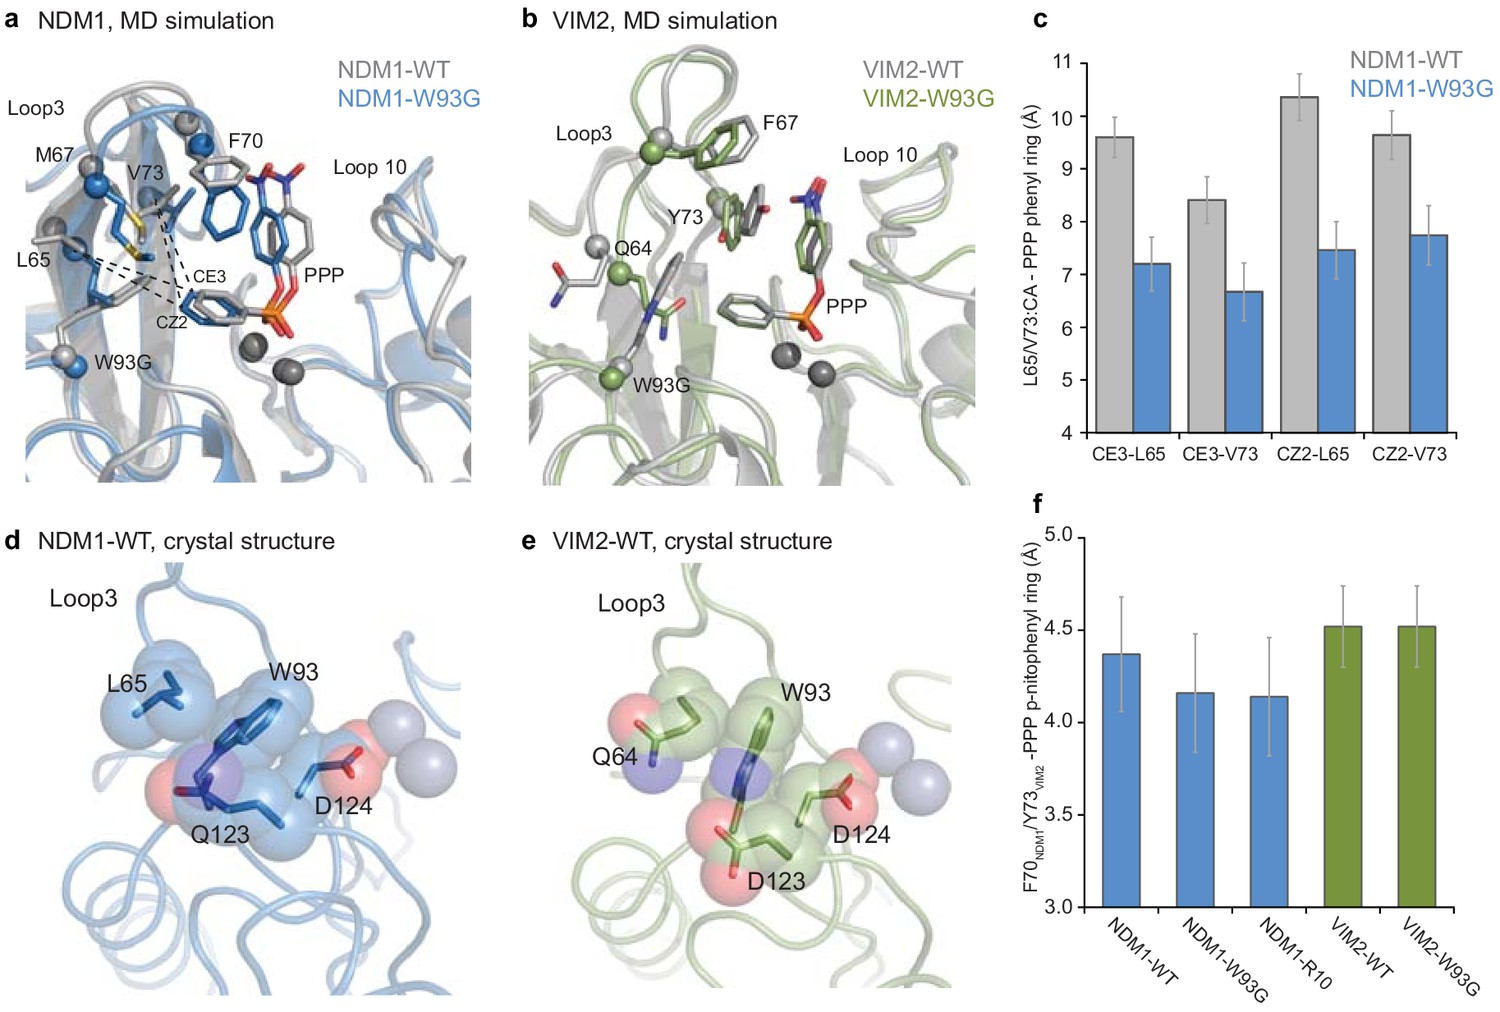
Comparisons of the structural changes induced by mutation W93G.
Representative structures from MD simulations of (A) NDM1-WT (grey) and NDM1-W93G (blue), and (B) VIM2-WT (grey) and VIM2-W93G (green). (C) Changes in hydrophobic interactions between the phenyl ring of the PMH substrate (CE3 and CZ2 atoms) and residue Leu65 and Val73 (α-carbon) of NDM1 upon W93G, during the MD simulations. (D and E) Comparison of the position of Trp93 and second shell residues in the (D) NDM1-WT (PDB-ID: 3SPU) and (E) VIM2-WT (PDB-ID: 1KO3) crystal structures. (F) Average distance between the p-nitrophenyl ring of the PMH substrate and the side chain rings of Phe70 in NDM1, and Tyr73 in VIM2, when the two rings form a π-π interaction during the MD simulations.
Figure 5—figure supplement 1
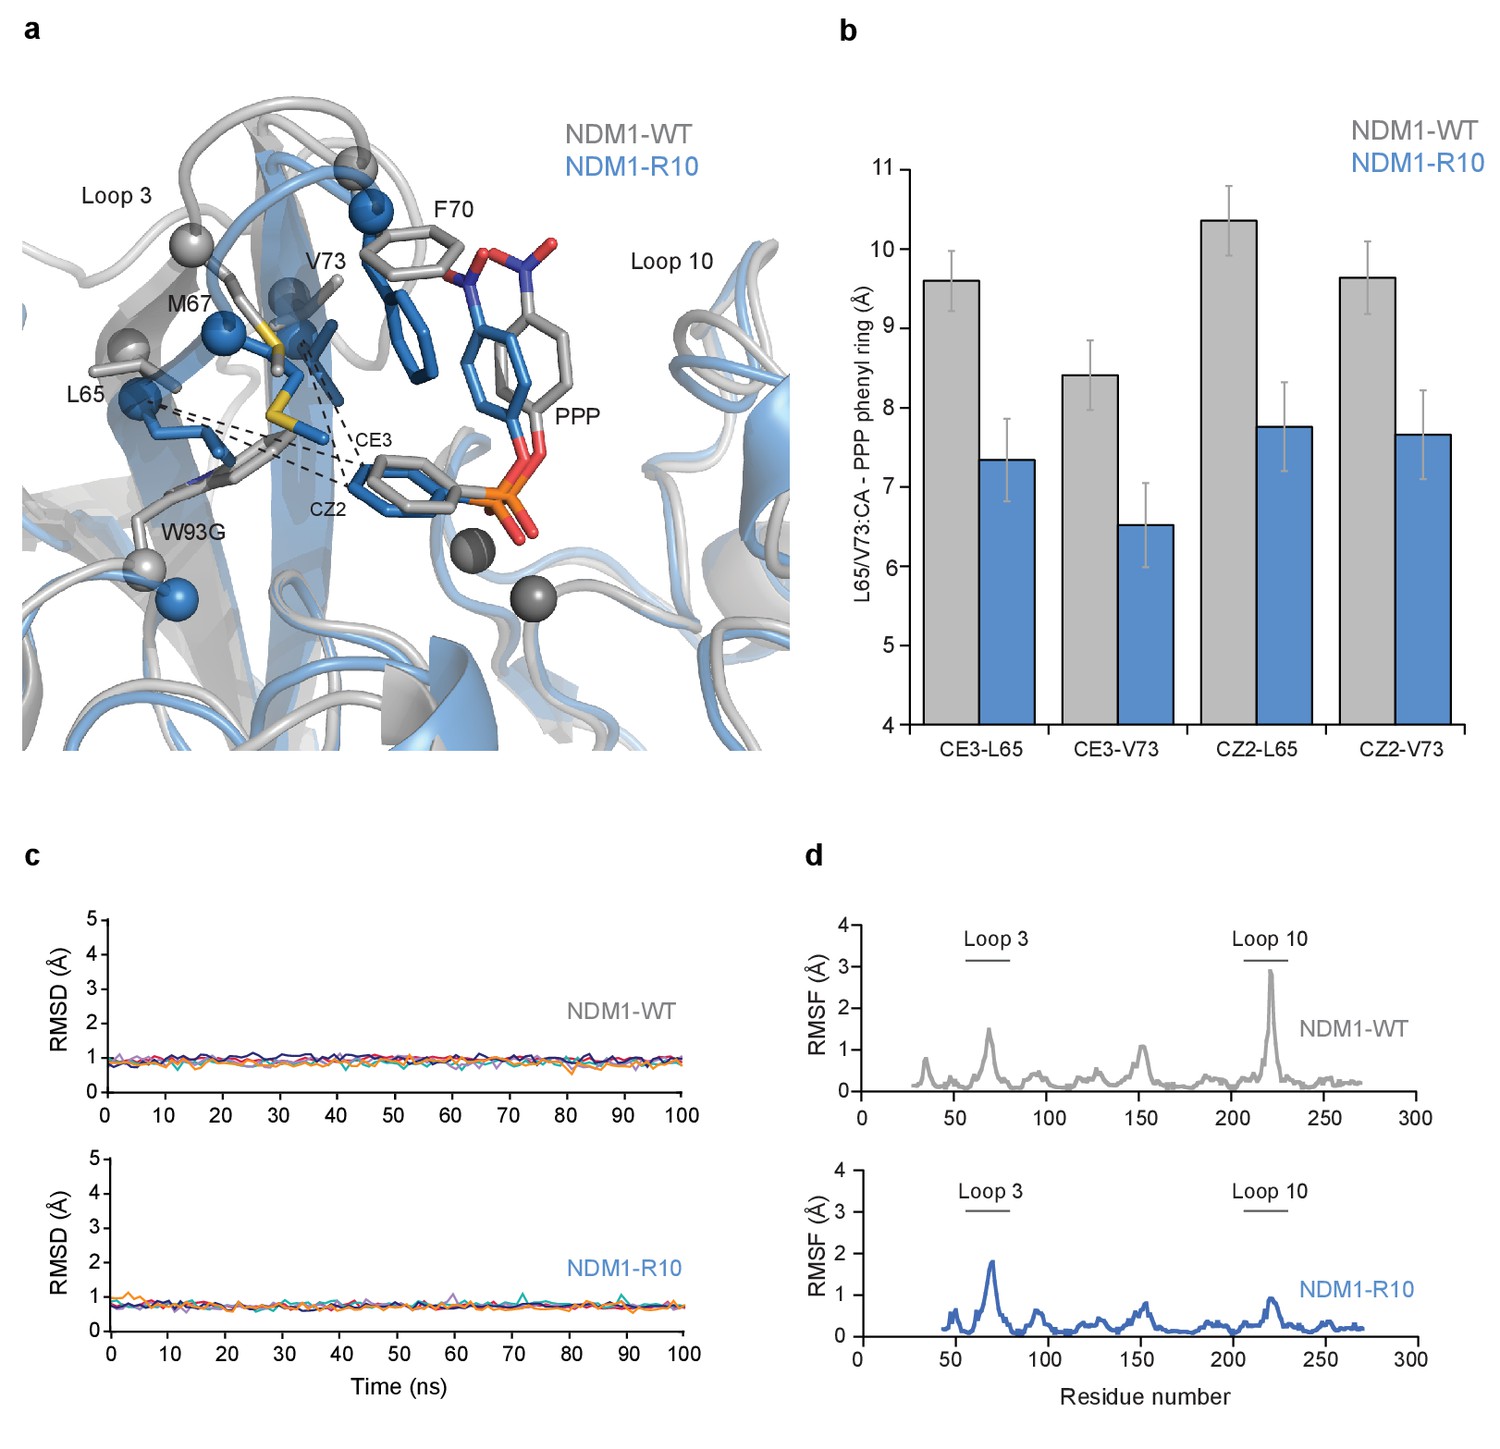
The molecular dynamics (MD) simulations of NDM1-WT and NDM1-R10.
(A) Overlay of representative structures from the MD simulations of NDM1-WT (grey) andNDM1-W93G (blue) in complex with the PPP substrate (B) The average distance between the substrate and active site residues Leu65 and Val73 during the MD simulation of NDM1-WT and R10. (C) Root-mean square deviations (RMSD, Å) of all C-α atoms from the MD simulations of the NDM1-WT and NDM1-R10 in complex with PPP. The relevant enzyme variants are indicated on each panel. The data is presented individually for five independent 100 ns trajectories in each system, and for clarity the data was plotted using cspline smoothing function implemented in Gnuplot. (D) Root-mean square fluctuations (RMSF, Å) of C-α atoms calculated from the last 50 ns of all five 100 ns simulations of NDM1-WT and NDM1-R10 in complex with the PPP substrate.
Figure 5—figure supplement 2

The molecular dynamics (MD) simulations of NDM1-WT, NDM1-W93G, VIM2-WT, and VIM2-W93G.
(A) Root-mean square deviations (RMSD, Å) of all the C-α atoms from the MD simulations of NDM1-WT, NDM1-W93, VIM2-W93G in complex with PPP. The relevant enzyme variants are indicated on each panel. The data is presented individually for five independent 100 ns trajectories in each system, and for clarity, the data was plotted using cspline smoothing function implemented in Gnuplot. (B) Root-mean square fluctuations (RMSF, Å) of C-α atoms during the MD simulations. The data was calculated from the last 50 ns of all five 100 ns simulations of each of the four enzyme-PPP complexes (specific variant indicated in each panel).
Additional files
-
Supplementary file 1
Description of enzymes and directed evolution rounds.
(A) Information about the enzymes characterized in this study. (B). Catalytic parameters of enzymes characterized in this study for PMH and β-lactamase activities. (C) Mutation rate in the NDM1-wt and VIM2-wt naive libraries. (D) Mutations identified in the naive library of VIM2-wt. (E) Mutations identified in the naive library of NDM1-wt. (F) Information on the directed evolution procedure and mutations that were accumulated during directed evolution. (G) PMH fitness values (cell lysate activity) of evolved and designed mutants. (H) Variants identified in the screening of additional round 1 libraries 1–3. (I) Changes in catalytic activity of purified MBL mutants compared to their respective wild-type enzymes, and melting temperature.
- https://doi.org/10.7554/eLife.40789.016
-
Supplementary file 2
Kinetic parameters of all variants.
(A) Catalytic parameters of VIM2 variants. (B) Individual catalytic parameters of NDM1 variants. (C) Solubility and melting temperature of NDM1 and Vim2 variants.
- https://doi.org/10.7554/eLife.40789.017
-
Supplementary file 3
Crystallographic information.
Crystallographic data collection and refinement statistics.
- https://doi.org/10.7554/eLife.40789.018
-
Supplementary file 4
Molecular dynamics information.
(A) Parameters used to describe the Zn2+ ions in our MD simulations. (B) List of relevant ionized states as well as the protonation patterns of histidine residues in our molecular dynamics simulations. All other residues were kept in their unionized forms as they were outside the simulation sphere (see main text).
- https://doi.org/10.7554/eLife.40789.019
-
Transparent reporting form
- https://doi.org/10.7554/eLife.40789.020
Download links
A two-part list of links to download the article, or parts of the article, in various formats.
Downloads (link to download the article as PDF)
Open citations (links to open the citations from this article in various online reference manager services)
Cite this article (links to download the citations from this article in formats compatible with various reference manager tools)
Cryptic genetic variation shapes the adaptive evolutionary potential of enzymes
eLife 8:e40789.
https://doi.org/10.7554/eLife.40789


