Genome-wide Estrogen Receptor-α activation is sustained, not cyclical
- University of Cambridge, United Kingdom
Figures
Figure 1 with 4 supplements
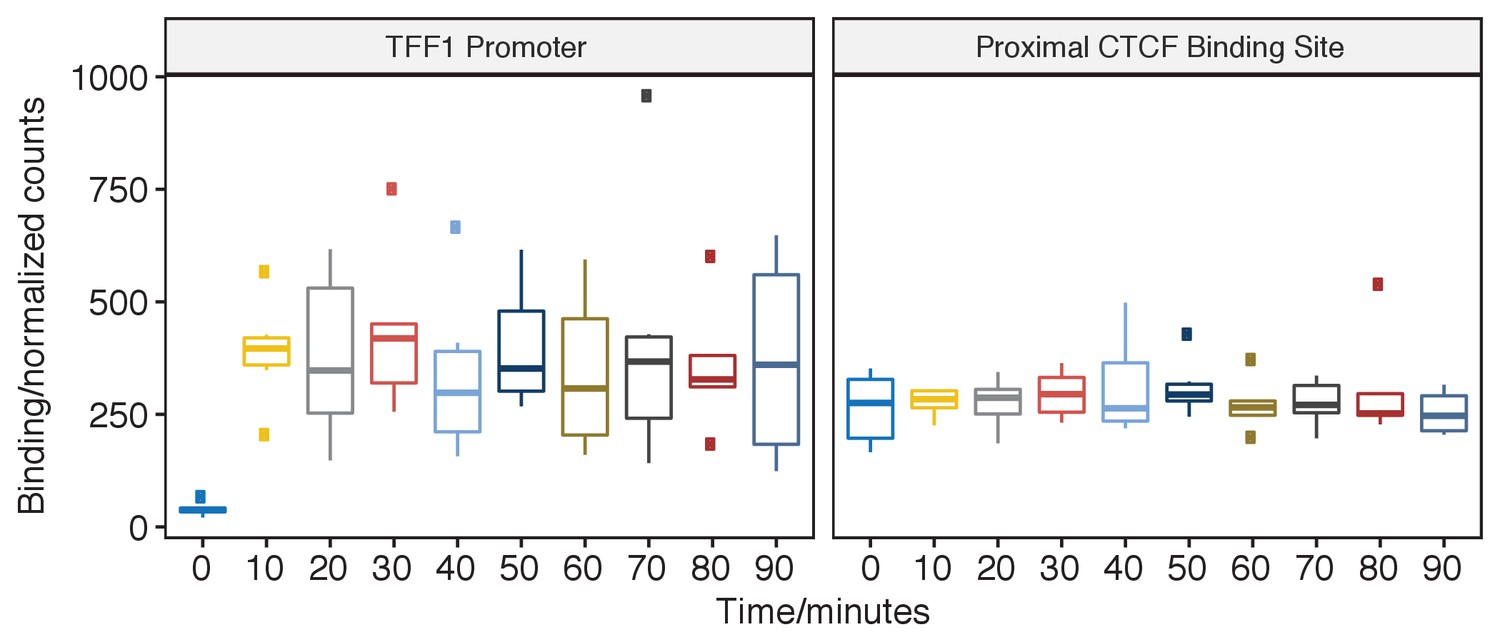
pfChIP-seq signal at the TFF1 promoter and proximal CTCF binding site.
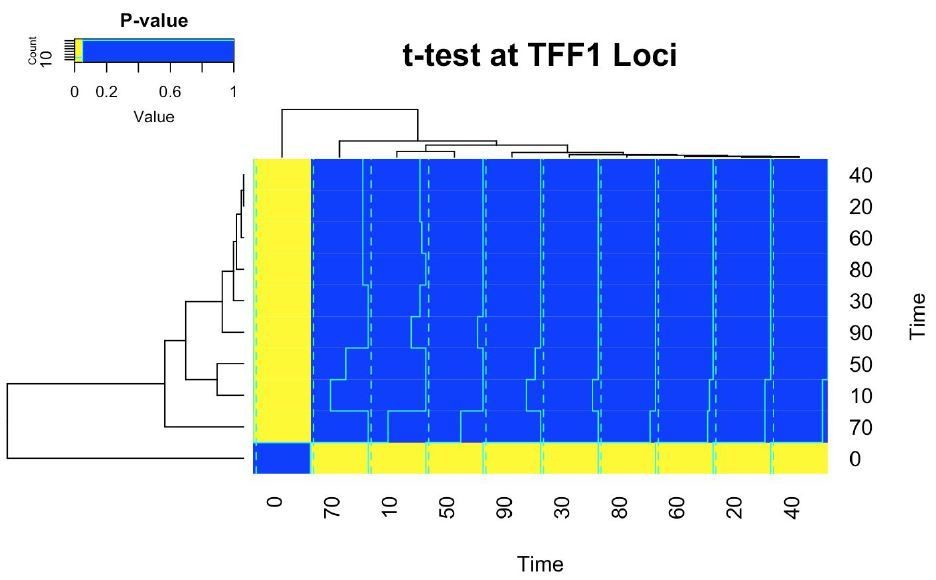
Binding of ER at the TFF1 promoter has been the classical focus of study before genome-wide technology and the predicted site for oscillations in ER binding. ER binding is minimal at 0 min; however, by 10 min, the ER has rapidly and robustly bound to give a sustained signal at the TFF1 promoter. In contrast, the closest CTCF binding site demonstrates a constant, estra-2-diol-independent, signal with significantly less variance. Pairwise comparison found no significant changes in binding at the TFF1 promoter (t-test, two-sided, FDR < 0.05) except for when comparing against the 0 min time point.
Figure 1—figure supplement 1
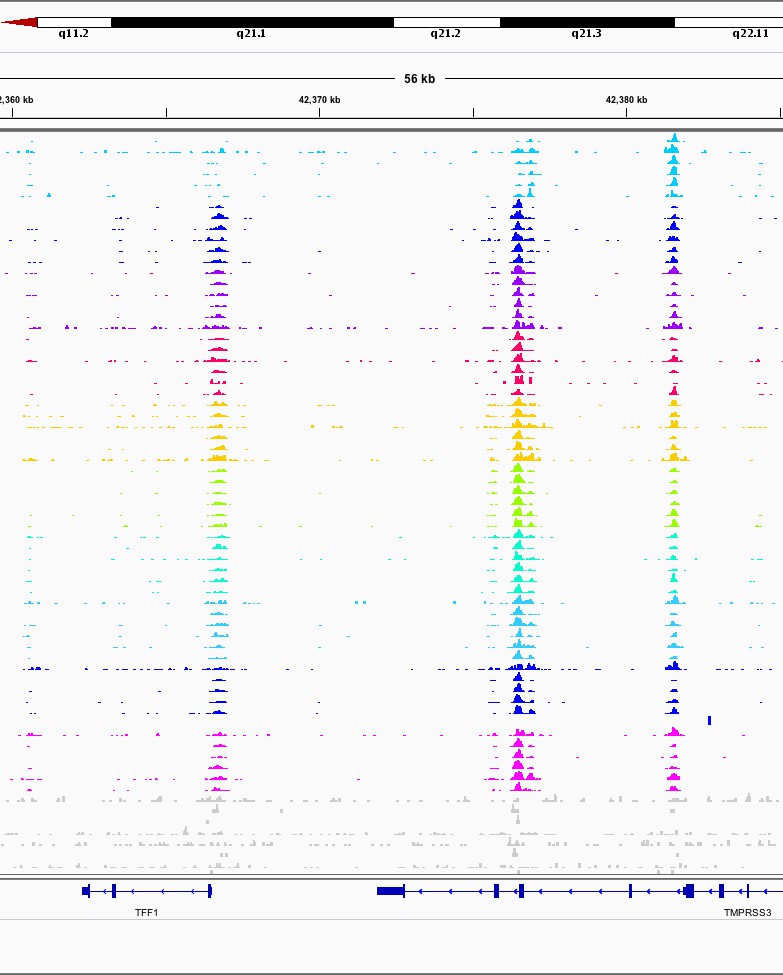
TFF1 Promoter and Enhancer.
Illustrative screenshot of aligned reads from one lane of sequencing after demultiplexing. Key features are the pile-up of reads at the TFF1 promoter (left) and enhancer (middle) and the CTCF control peak (right). From top to bottom is 0 to 90 min in 10 min intervals, six replicates of each. Light gray samples are input controls. Row height normalized to maximum read count in region. .
Figure 1—figure supplement 2

Normalization plots for each time point as generated by Brundle (Guertin et al., 2018).
Each point represents a CTCF control binding site. After establishing the normalization factor for parity of CTCF binding, the ER binding was corrected using the same parameters. As expected, the levels of normalization required varies between time points and correction is greatest for the largest magnitude peaks.
Figure 1—figure supplement 3
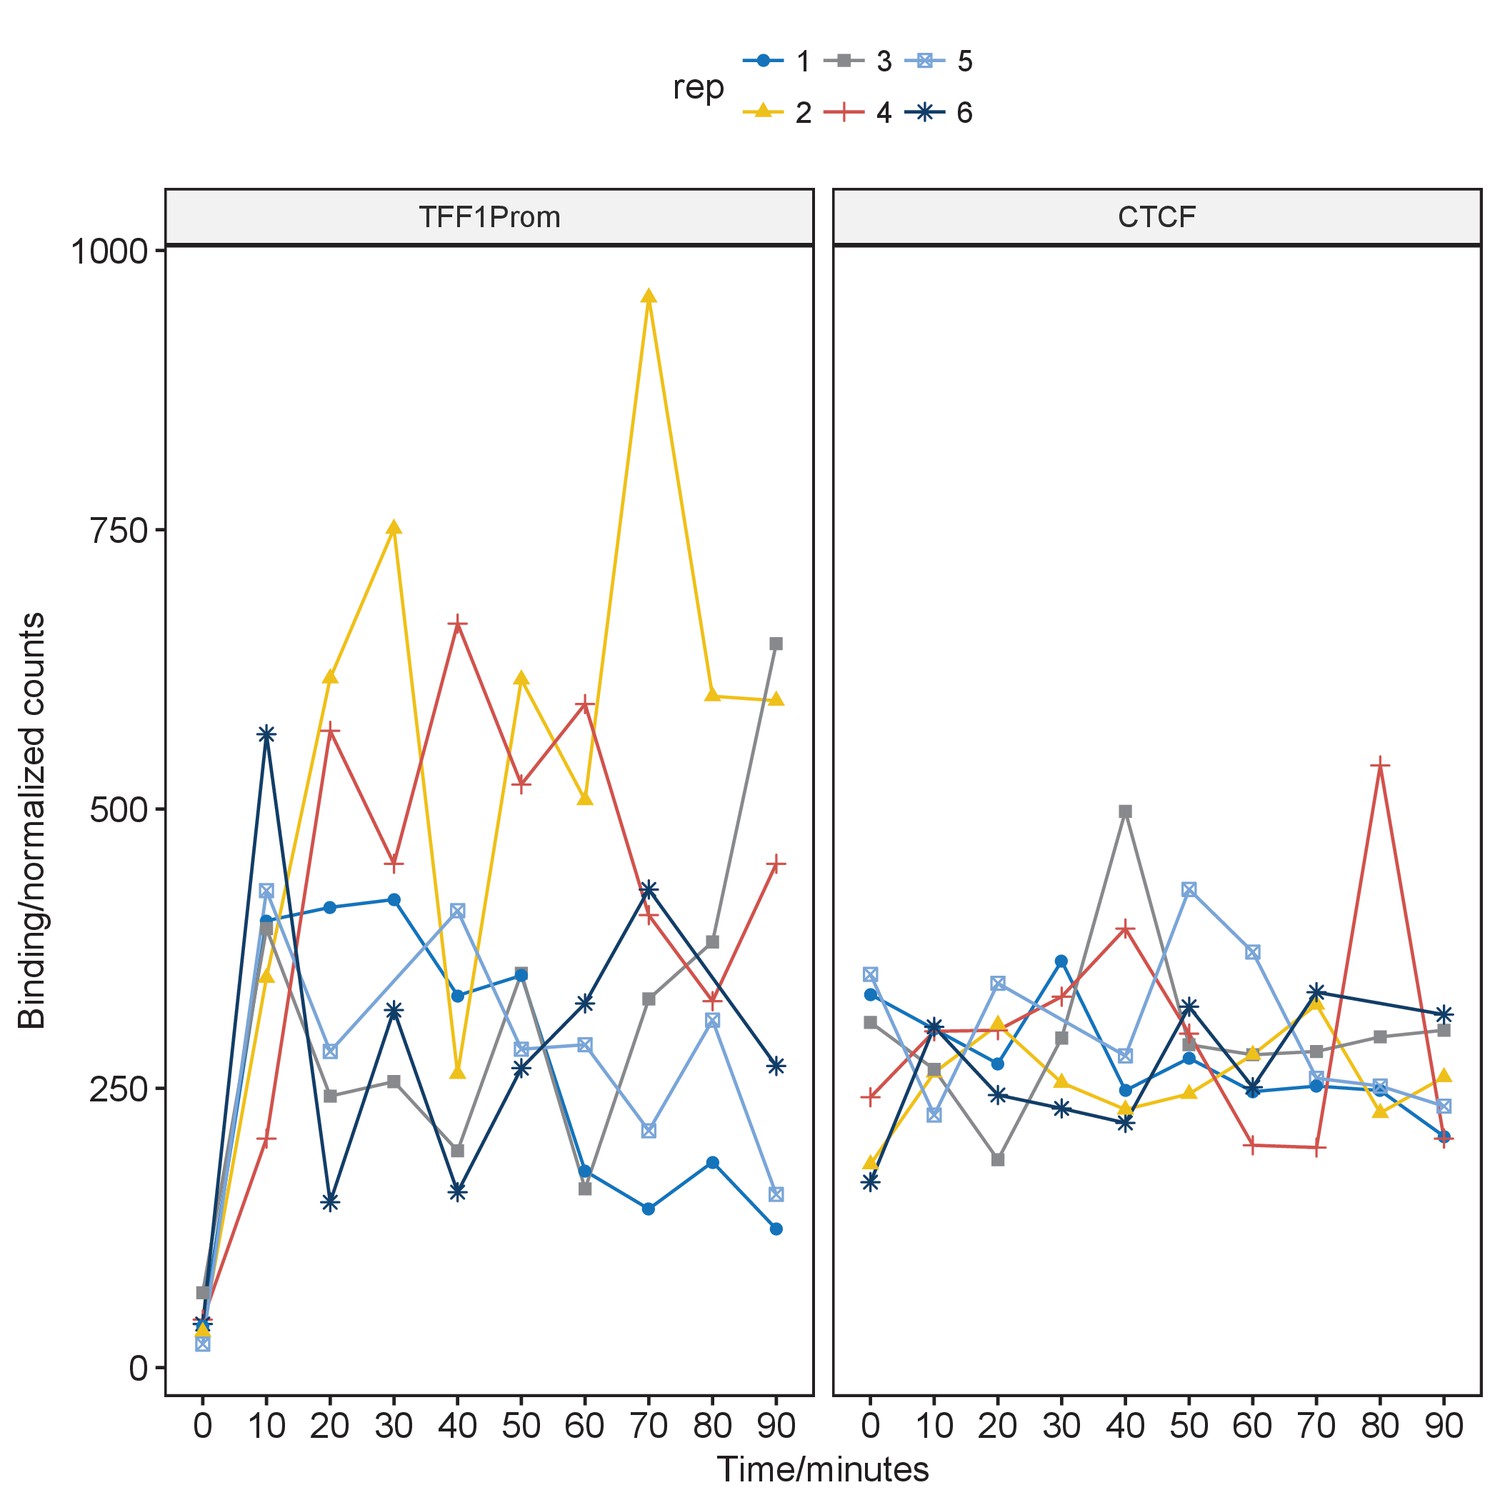
Line plot of pfChIP-seq signal at the TFF1 promoter and proximal CTCF binding site.
https://doi.org/10.7554/eLife.40854.006
Figure 1—figure supplement 4
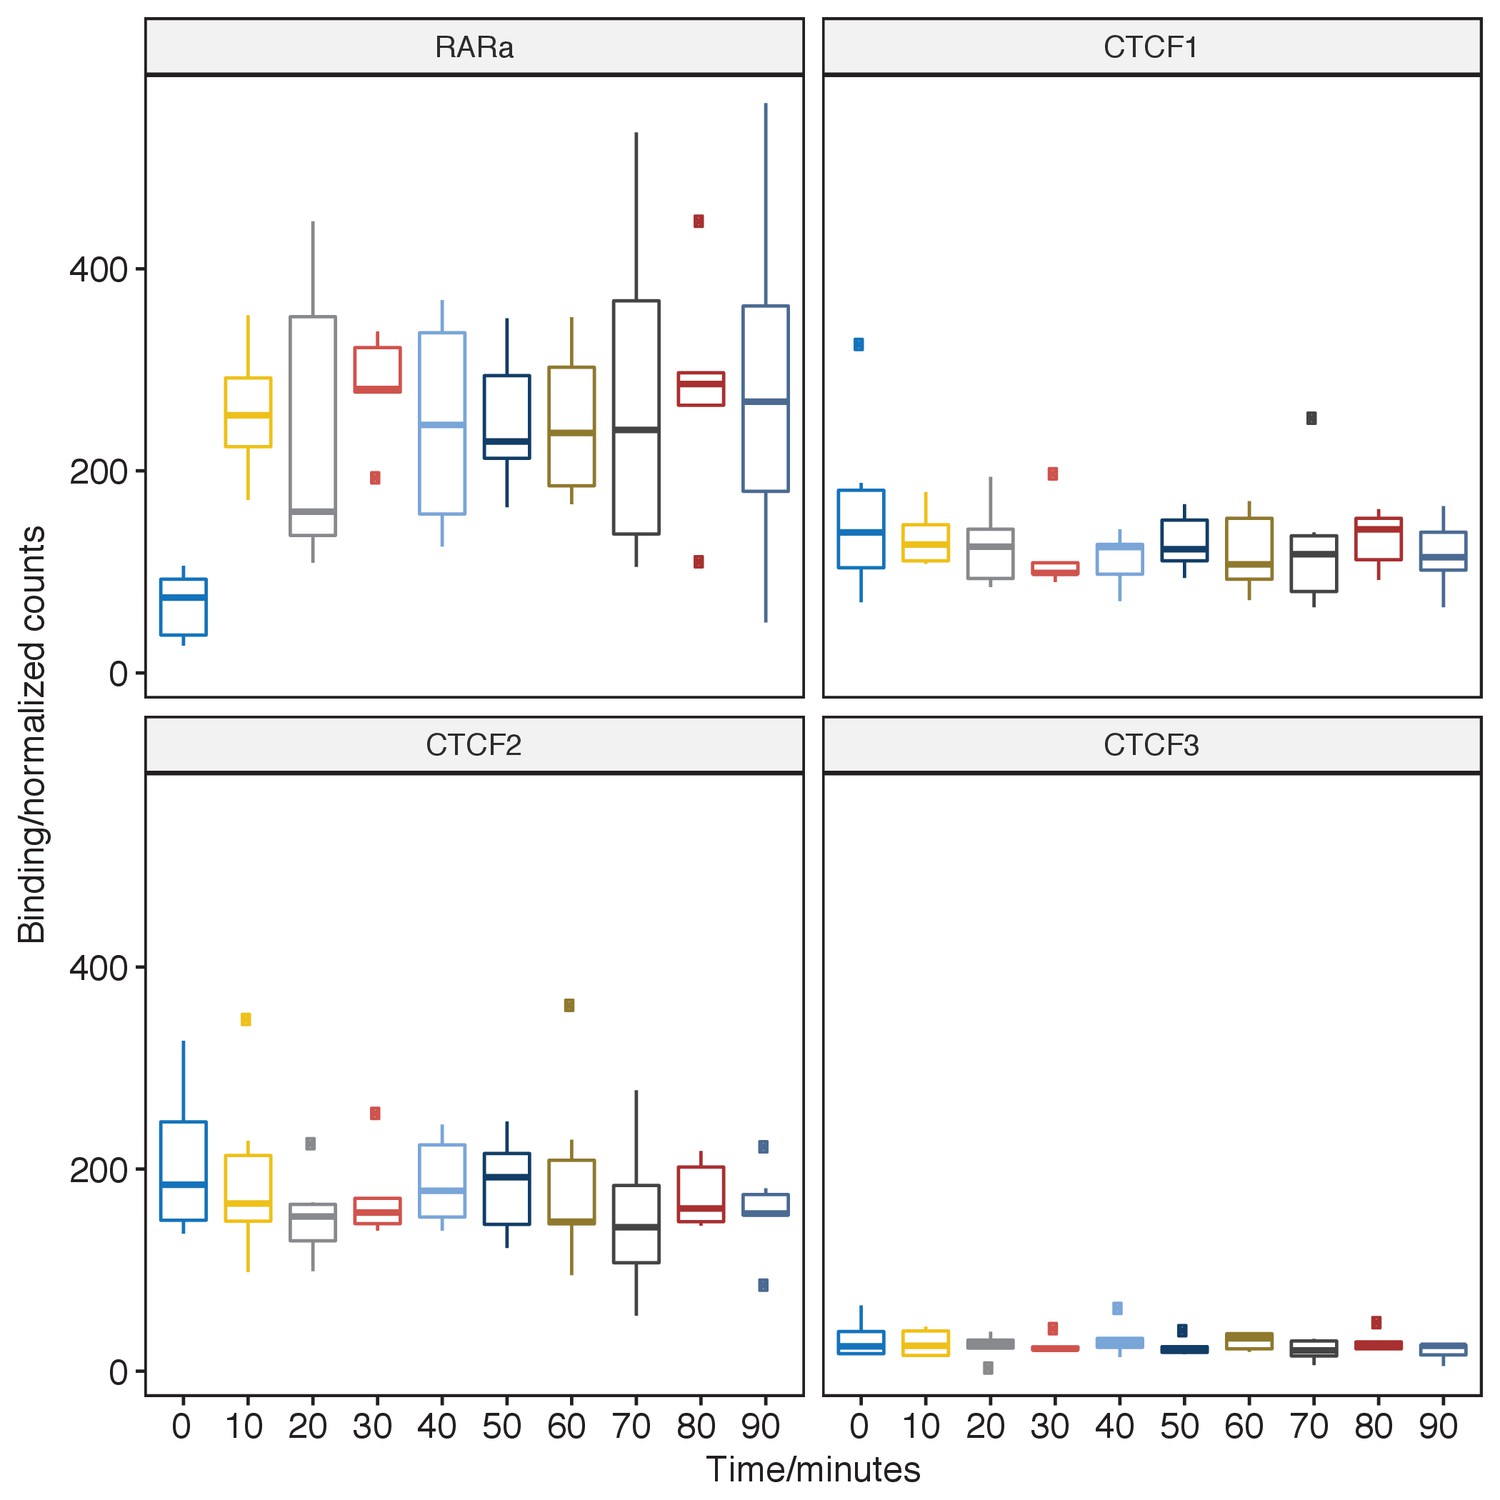
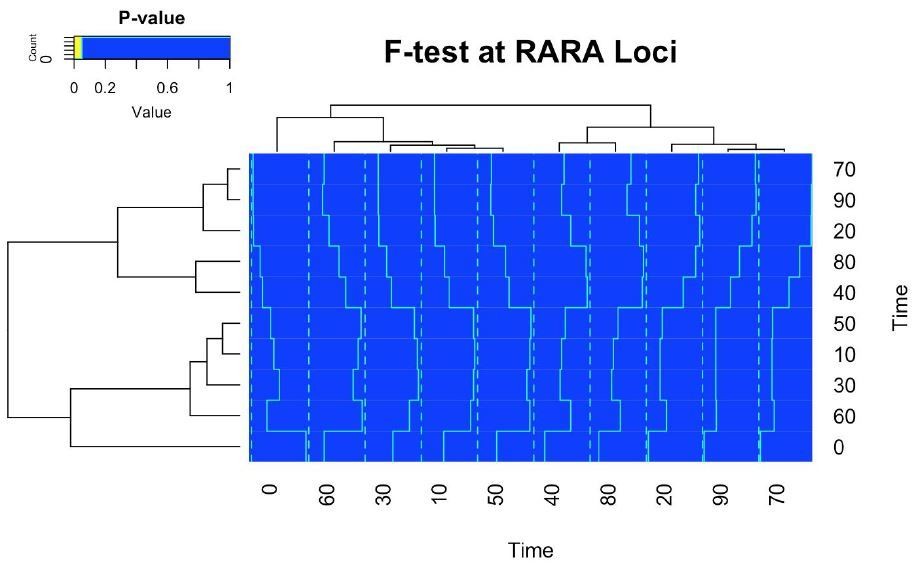
Plot of pfChIP-seq signal at the RARA promoter and proximal CTCF binding site.
https://doi.org/10.7554/eLife.40854.007
Figure 2 with 2 supplements
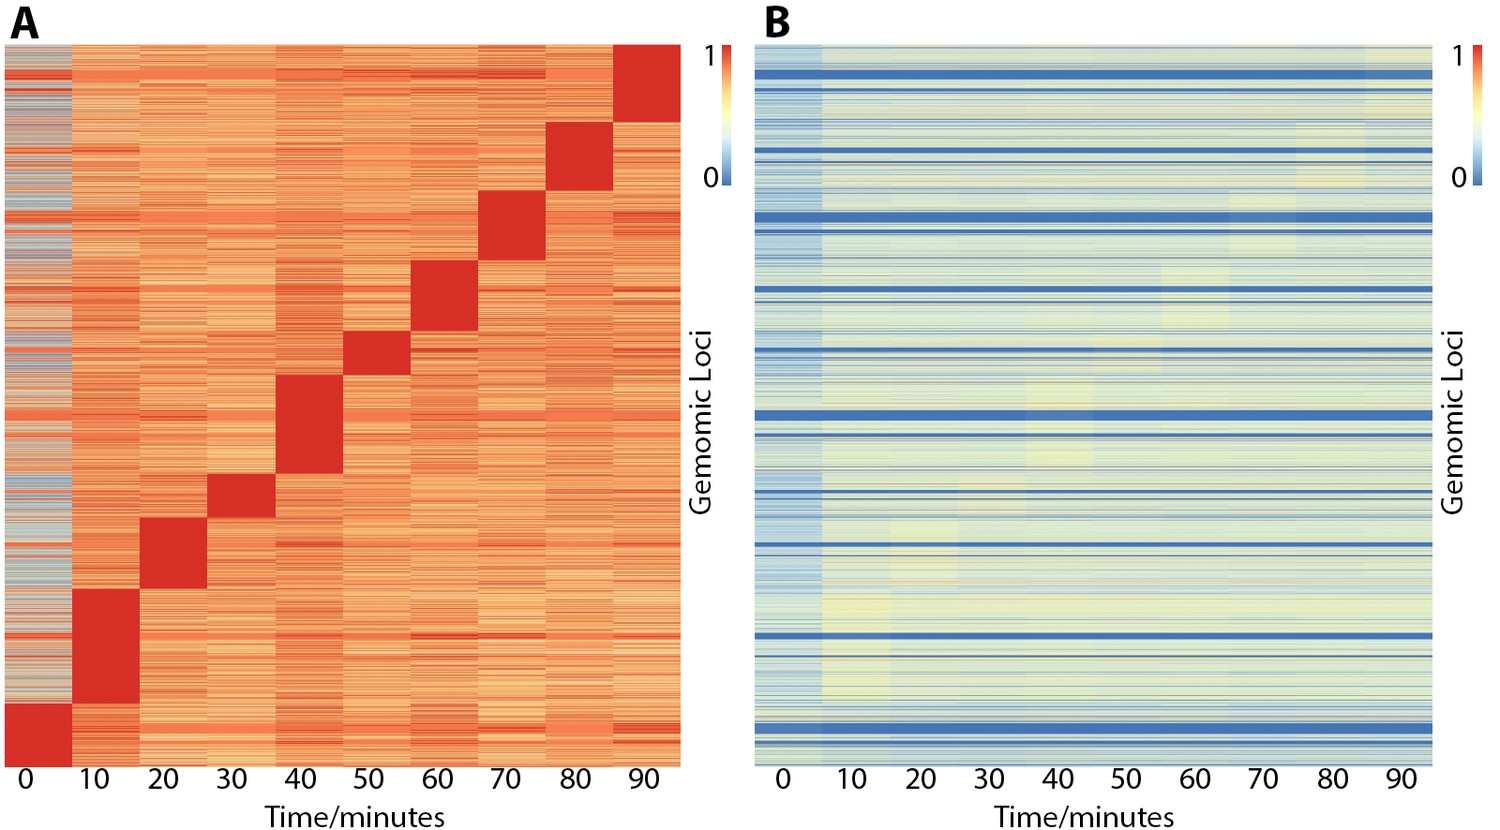
Heatmaps showing ER binding affinity from 0 to 90 min after stimulation with estra-2-diol normalized in two different ways.
Row order is the same in both plots. (A) Normalized by row to time point with maximal binding. Data suggests that genomic loci may influence the time point maximal binding; however, normalizing to CTCF control peaks (B) demonstrates the effect is potentially overemphasized by normalization choice and that binding affinity is the biggest variable. In contrast, both plots (A and B) show minimal ER binding affinity is found at 0 min, consistent with the literature response of MCF7 cells to treatment of estra-2-diol.
Figure 2—figure supplement 1
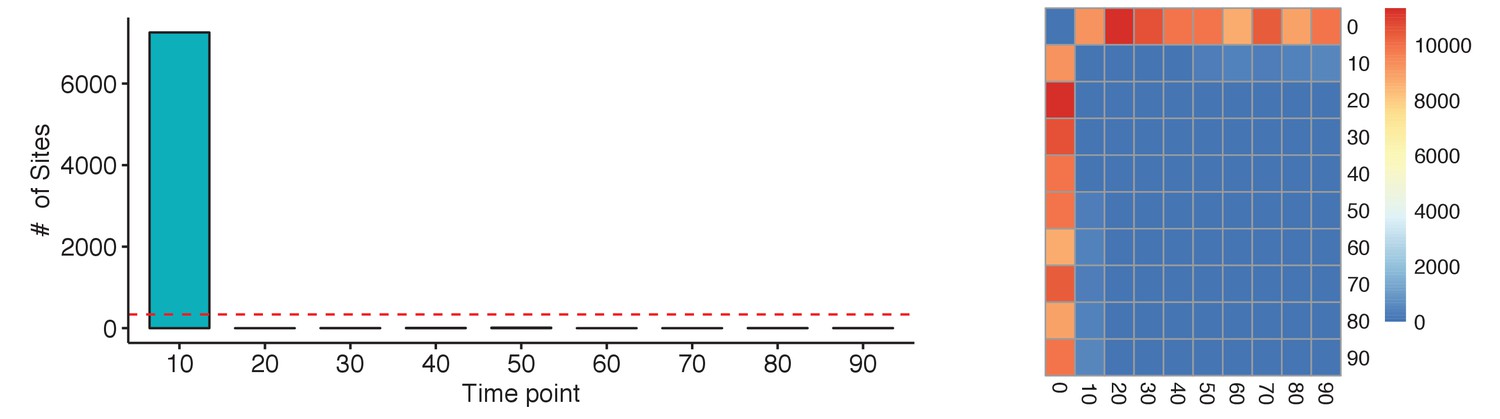
(Left) Analysis of each time point to the previous time point only shows a significant numbers of changes in ER binding between 0 and 10 min.
The red-dotted line represents the false discovery rate for the data set. (Right) The same analysis between all possible contrasts shows the same results. The majority of events occur between 0 min and other time points. A small numbers of contrasts do find significant changes in binding, but always below the level of potential false positives.
Figure 2—figure supplement 2
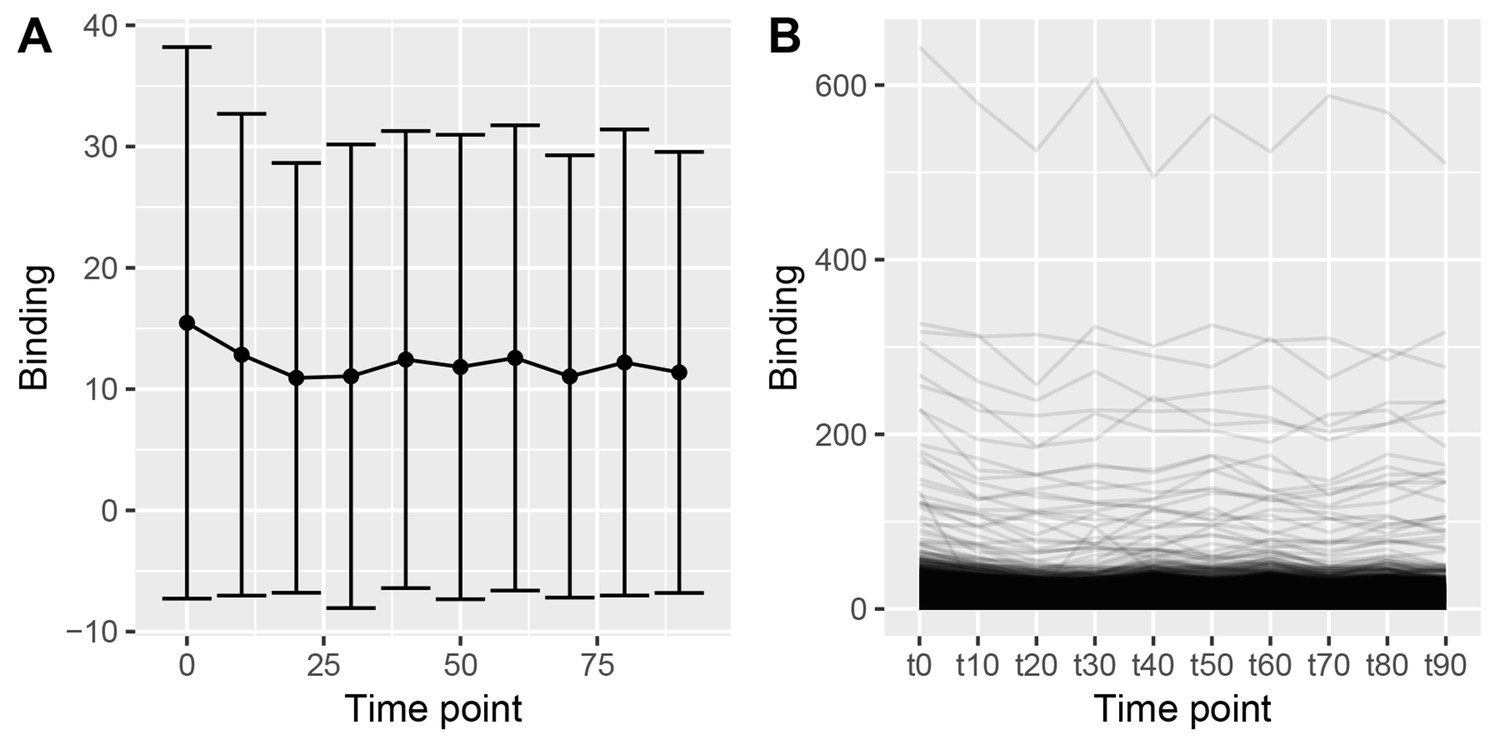
(Left) Class average of ER binding in the block of binding events that show maximum binding at 0 min in Figure 2.
While there is a clear maximum at 0 min, this effect is dominated by the variance of the data. (Right) The individual traces of each of these binding events show low level binding with a very shallow peak at 0 min.
Figure 3 with 2 supplements
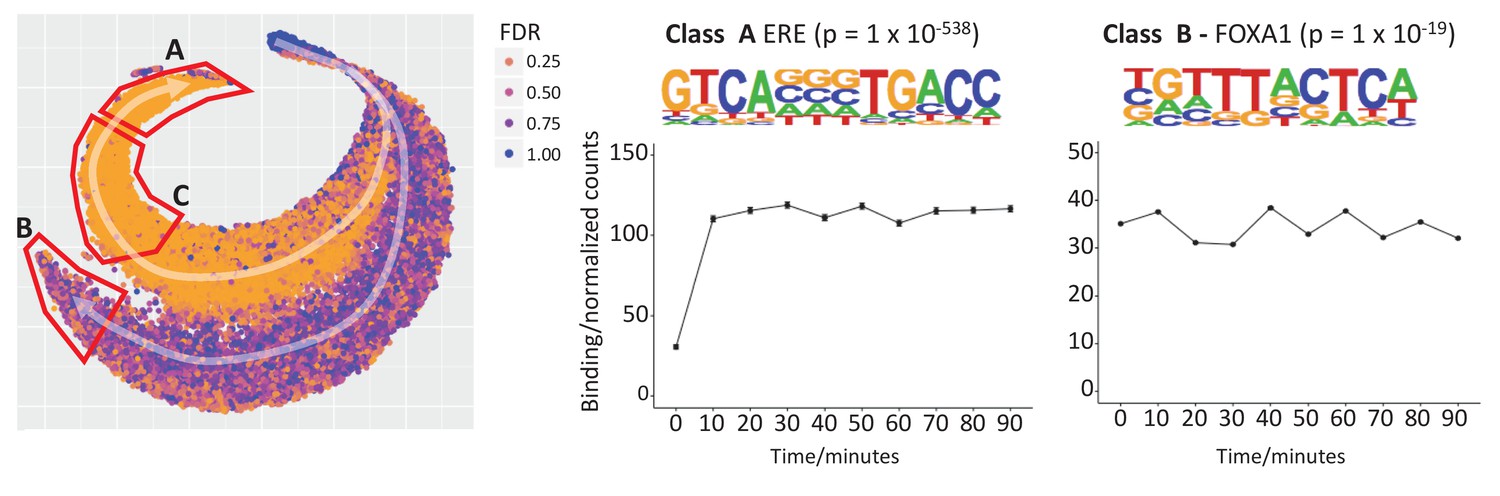
t-SNE plot to explore temporal patterns in ER binding affinity.
Two trajectories, A and B, are highlighted with white arrows and starting a single cluster of peaks. Points are colored by FDR value computed by Brundle/DiffBind for the 0 vs 10 min contrast. Trajectory A demonstrates increasing ER affinity in response to estra-2-diol at 10 min. Trajectory B shows increasing affinity for all times points, that is estra-2-diol independent binding, but the maximum signal is of a lower intensity than that of Trajectory A. De novo motif analysis for Class A (the peaks found at the end of trajectory A) gave strongest enrichment for the ERE (p = 1 × 10-538). The same analysis of Class C provided a partial ERE (not shown), consistent with ER affinity being a function of how conserved the ER binding site is with respect to ideal ERE. Analysis of Class B gave FOXA1 as the most significantly enriched motif (p = 1 × 10-19).
Figure 3—figure supplement 1
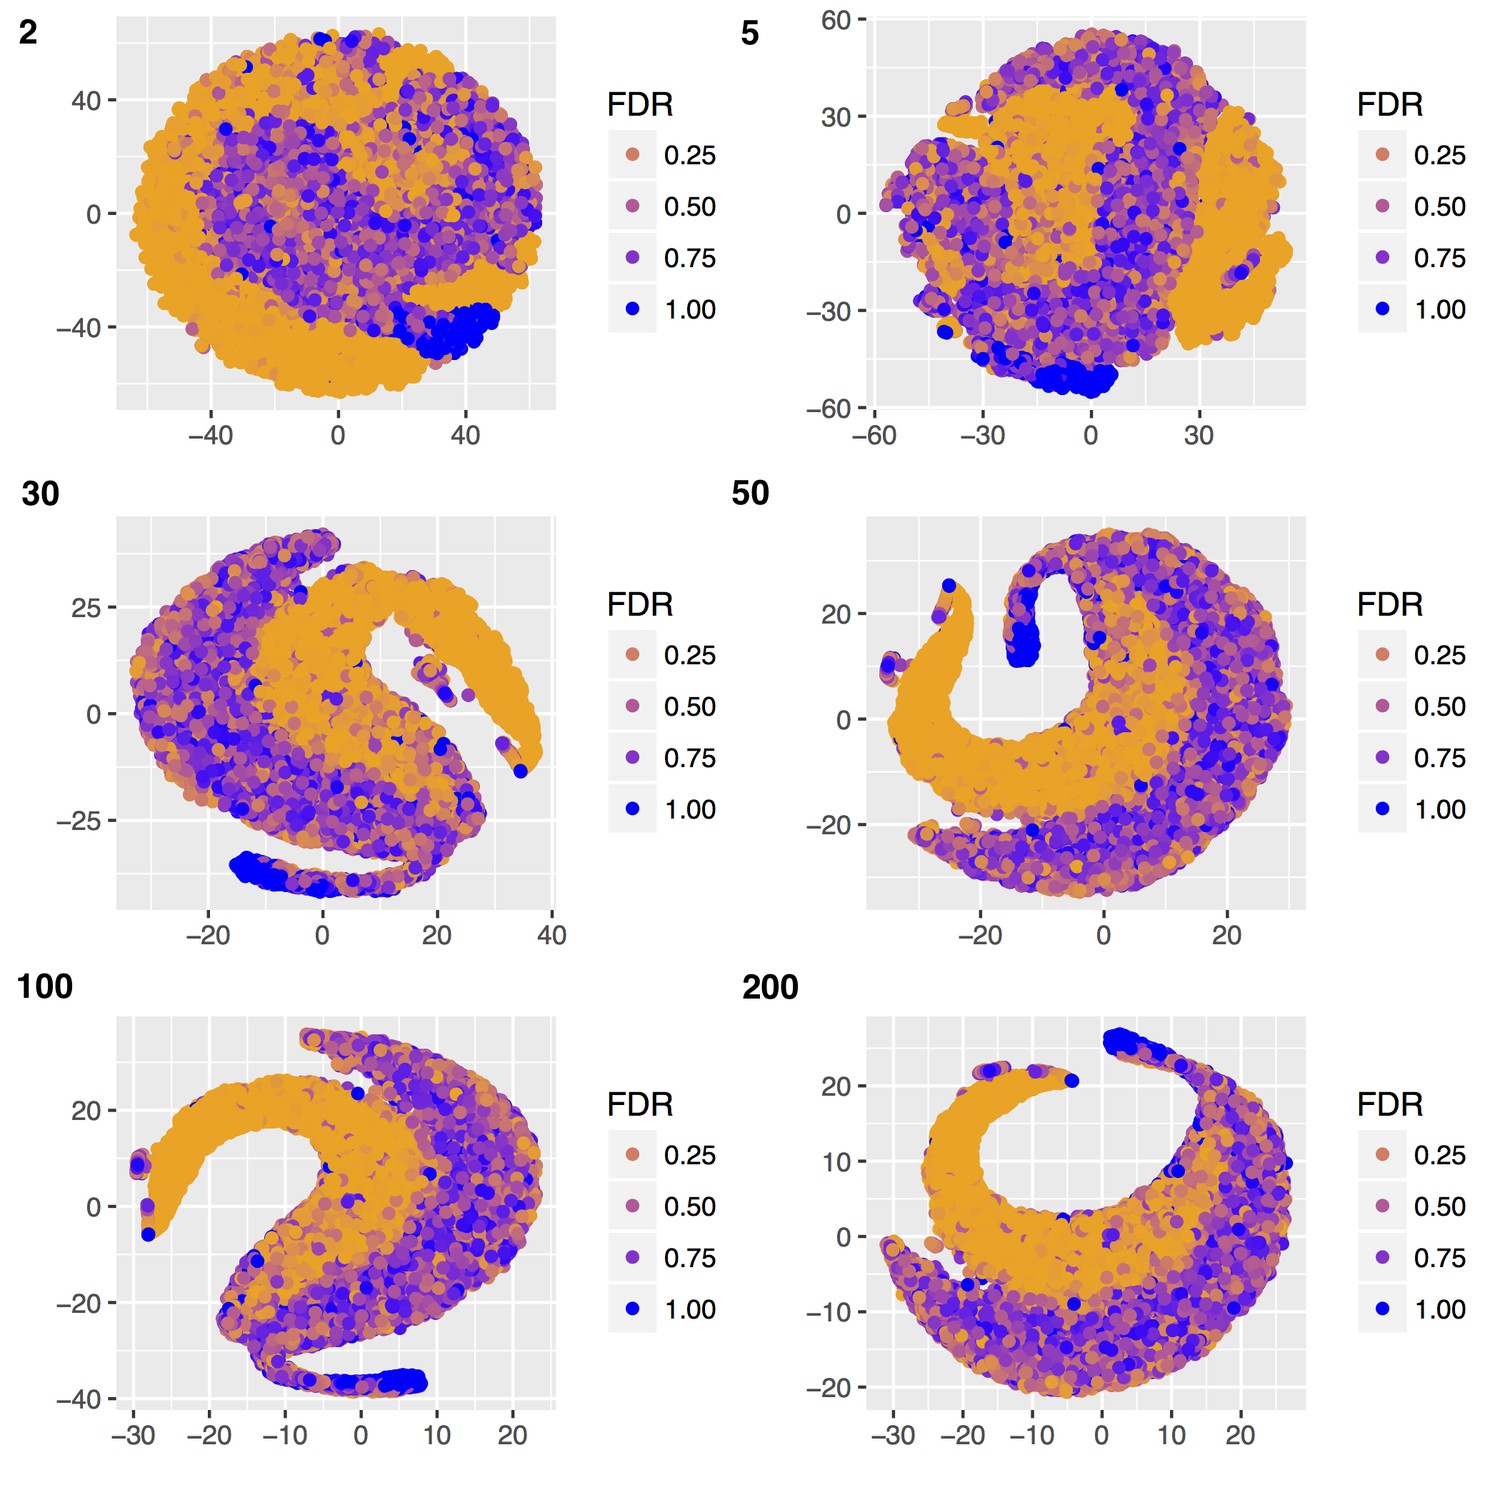
Multiple t-SNE plots of ER binding affinity changes in response to estra-2-diol at increasing perplexity (top left of each figure).
For perplexity 30–200, two consistent trajectories are seen, with exact pattern depending on random seed provided. A perplexity of 200 was used to render Figure 3.
Figure 3—figure supplement 2

Analysis of the ER data stream gave similar profiles at the TFF1.
(A) and RARA (B) promoters. Visualising the individual replicates provided no evidence of ER cycling within replicates (C). Genome-wide tSNE analysis of the ER data stream gave two trajectories that matched those previously found using pfChIP-seq (D). Genome-wide average of ER binding profiles demonstrated a sustained, not cyclical, response (E).
Figure 4
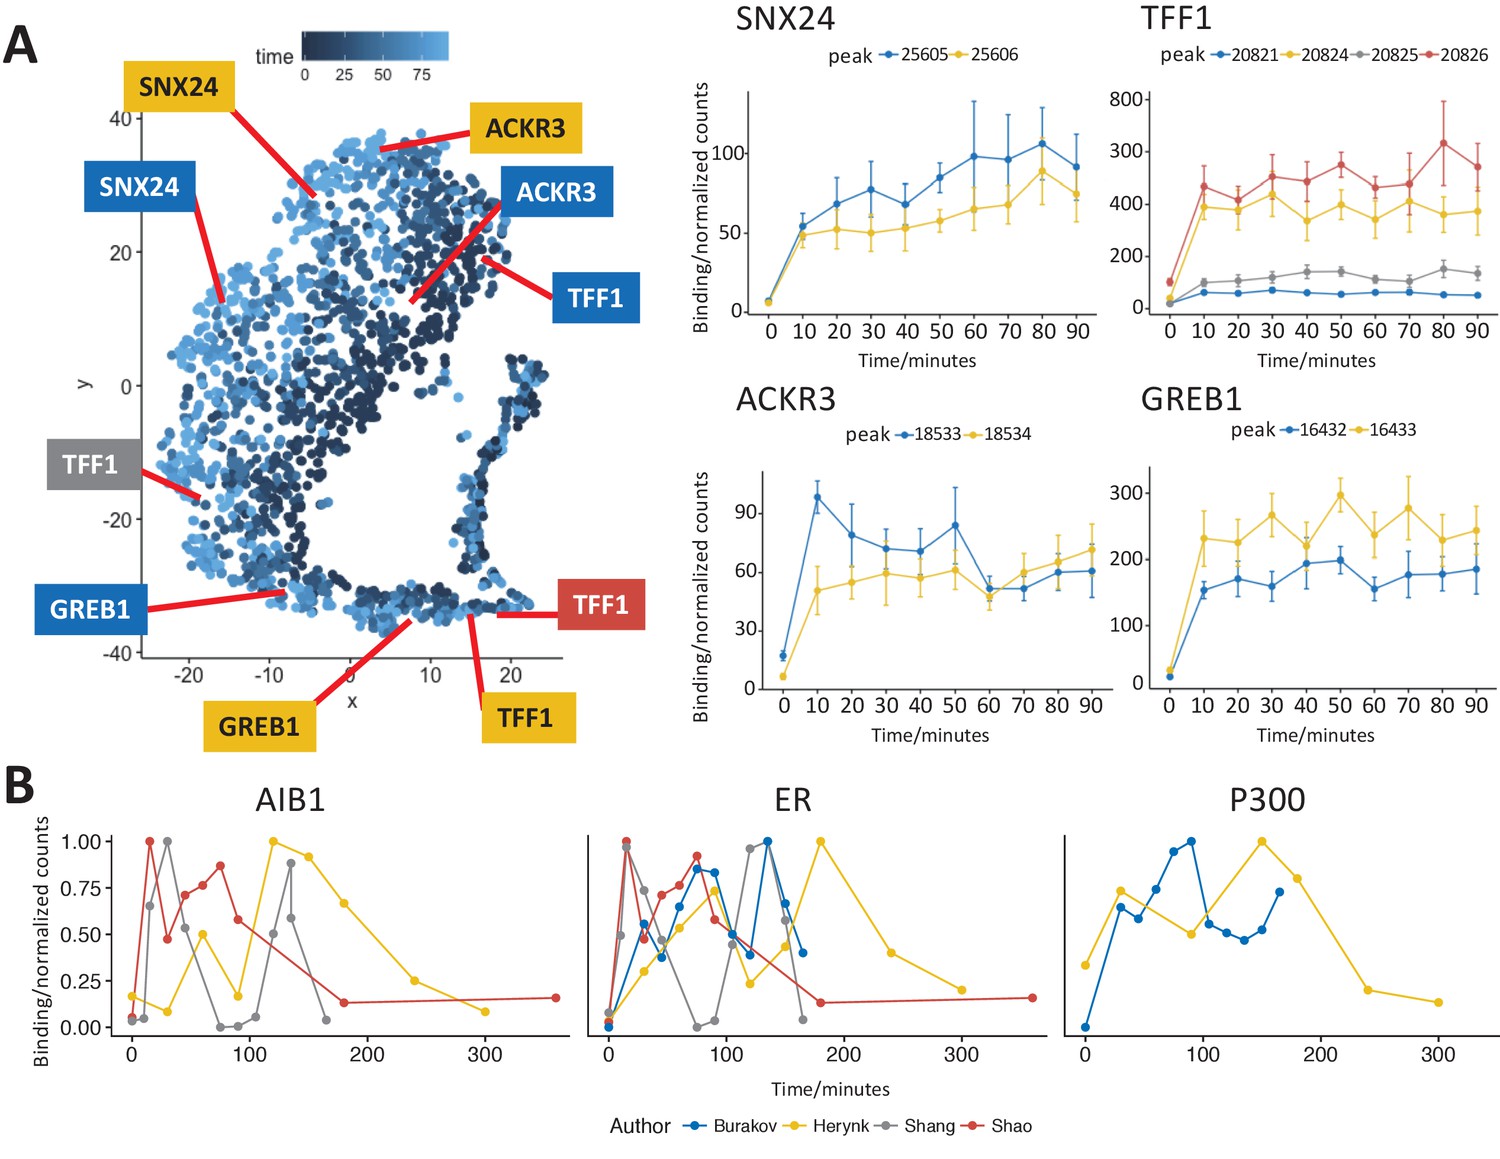
t-SNE analysis of the most strongly bound ER sites (Class A) and comparison to previously published data.
(A) t-SNE plot of Class A from Figure 3, points colored by time of maximum value. Profiles for binding sites near the transcription start site of two well studied ER target genes, TFF1 and GREB1, gave a robust sustained response to estra-2-diol. Binding sites near SNX24 and ACKR3 TSS are shown to examples of ER binding affinity profiles that indicate potential early or late maximal binding. Peak coordinates are provided in Supplementary file 1. (B) Analysis of ER and cofactor binding at the TFF1 promoter in four studies (Burakov et al., 2002; Herynk et al., 2010; Shang et al., 2000; Shao et al., 2004). Data was either read directly from plots within the original publication or using ImageJ (Schneider et al., 2012) to calculate band density. To ensure data was comparable, data was normalized to the maximum value and all studies were chosen for replicating the conditions in Shang et al.’s original study.
Author response image 1
Author response image 2
Additional files
-
Source code 1
R Markdown source code for the analysis of the Supplementary files 1–6.
- https://doi.org/10.7554/eLife.40854.015
-
Supplementary file 1
Table of ER pfChIP-Seq binding matrix.
- https://doi.org/10.7554/eLife.40854.016
-
Supplementary file 2
Table of GREAT analysis results.
- https://doi.org/10.7554/eLife.40854.017
-
Supplementary file 3
Table of CTCF pfChIP-Seq binding matrix.
- https://doi.org/10.7554/eLife.40854.018
-
Supplementary file 4
Quantitative analysis of published ER time series data.
- https://doi.org/10.7554/eLife.40854.019
-
Supplementary file 5
Table of ER ChIP-Seq binding matrix without parallel-factor normalization.
- https://doi.org/10.7554/eLife.40854.020
-
Supplementary file 6
Table of CTCF ChIP-Seq binding matrix without parallel-factor normalization.
- https://doi.org/10.7554/eLife.40854.021
-
Transparent reporting form
- https://doi.org/10.7554/eLife.40854.022
Download links
A two-part list of links to download the article, or parts of the article, in various formats.
Downloads (link to download the article as PDF)
Open citations (links to open the citations from this article in various online reference manager services)
Cite this article (links to download the citations from this article in formats compatible with various reference manager tools)
Genome-wide Estrogen Receptor-α activation is sustained, not cyclical
eLife 7:e40854.
https://doi.org/10.7554/eLife.40854


