Spatial control of neuronal metabolism through glucose-mediated mitochondrial transport regulation
- University of California, San Diego, United States
Figures
Figure 1

Schematic diagram of a simplified model for glucose-mediated mitochondrial transport regulation.
(a) Myelinated axonal region, with glucose entry localized at the nodes of Ranvier. Mitochondria accumulate at nodes due to the higher glucose concentration (b) Unmyelinated axonal region, subject to a linear glucose gradient. Glucose permeability is uniform throughout, with mitochondrial accumulation occuring at the region of high external glucose (c) Key steps of the metabolic pathway linking glucose availability and mitochondrial halting. (d) Mitochondrial transport states and rates of transition between them ( represents retrograde and anterograde motion, represents the stationary state).
Figure 2

Mitochondrial and glucose distributions from simulations with discrete motile mitochondria.
(a) Glucose distribution and positions of individual mitochondria (b) Normalized mitochondrial distribution, , obtained from simulating discrete mitochondrial motion (histogram compiled from 100 independent simulations), compared to numerical calculation of steady state continuous mitochondrial disribution (black curve). Results shown are for parameter values: , , .
Figure 3
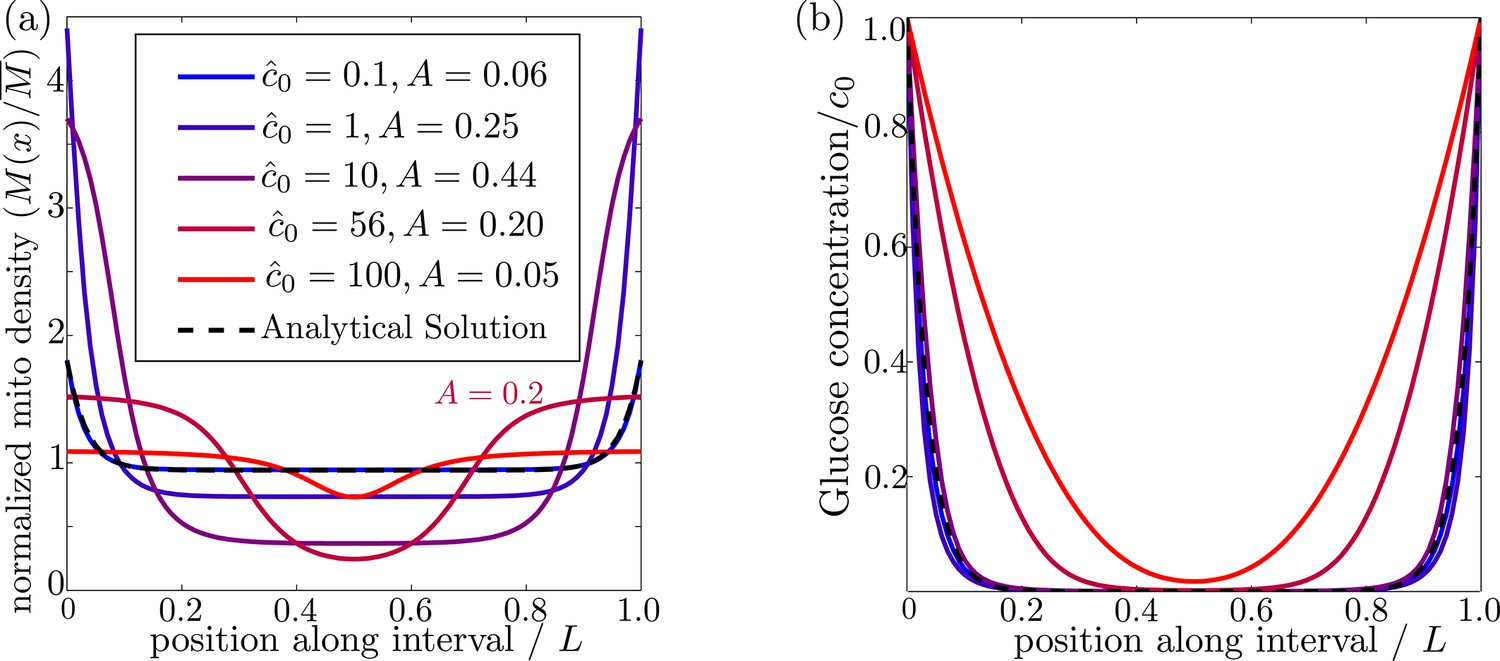
Effect of external glucose concentration on intracellular glucose and mitochondrial distributions.
(a) Normalized mitochondrial distribution (), for different values of edge concentration . The curve with illustrates the accumulation cutoff . (b) Glucose distribution normalized by edge concentration (). The black dashed line in both panels indicates the analytical solution for the low glucose limit (Materials and methods, Equation 13). Source data provided in ‘Figure 3—source data 1’.
-
Figure 3—source data 1
Matlab code to calculate and plot steady-state distributions with localized glucose entry.
- https://doi.org/10.7554/eLife.40986.007
Figure 4
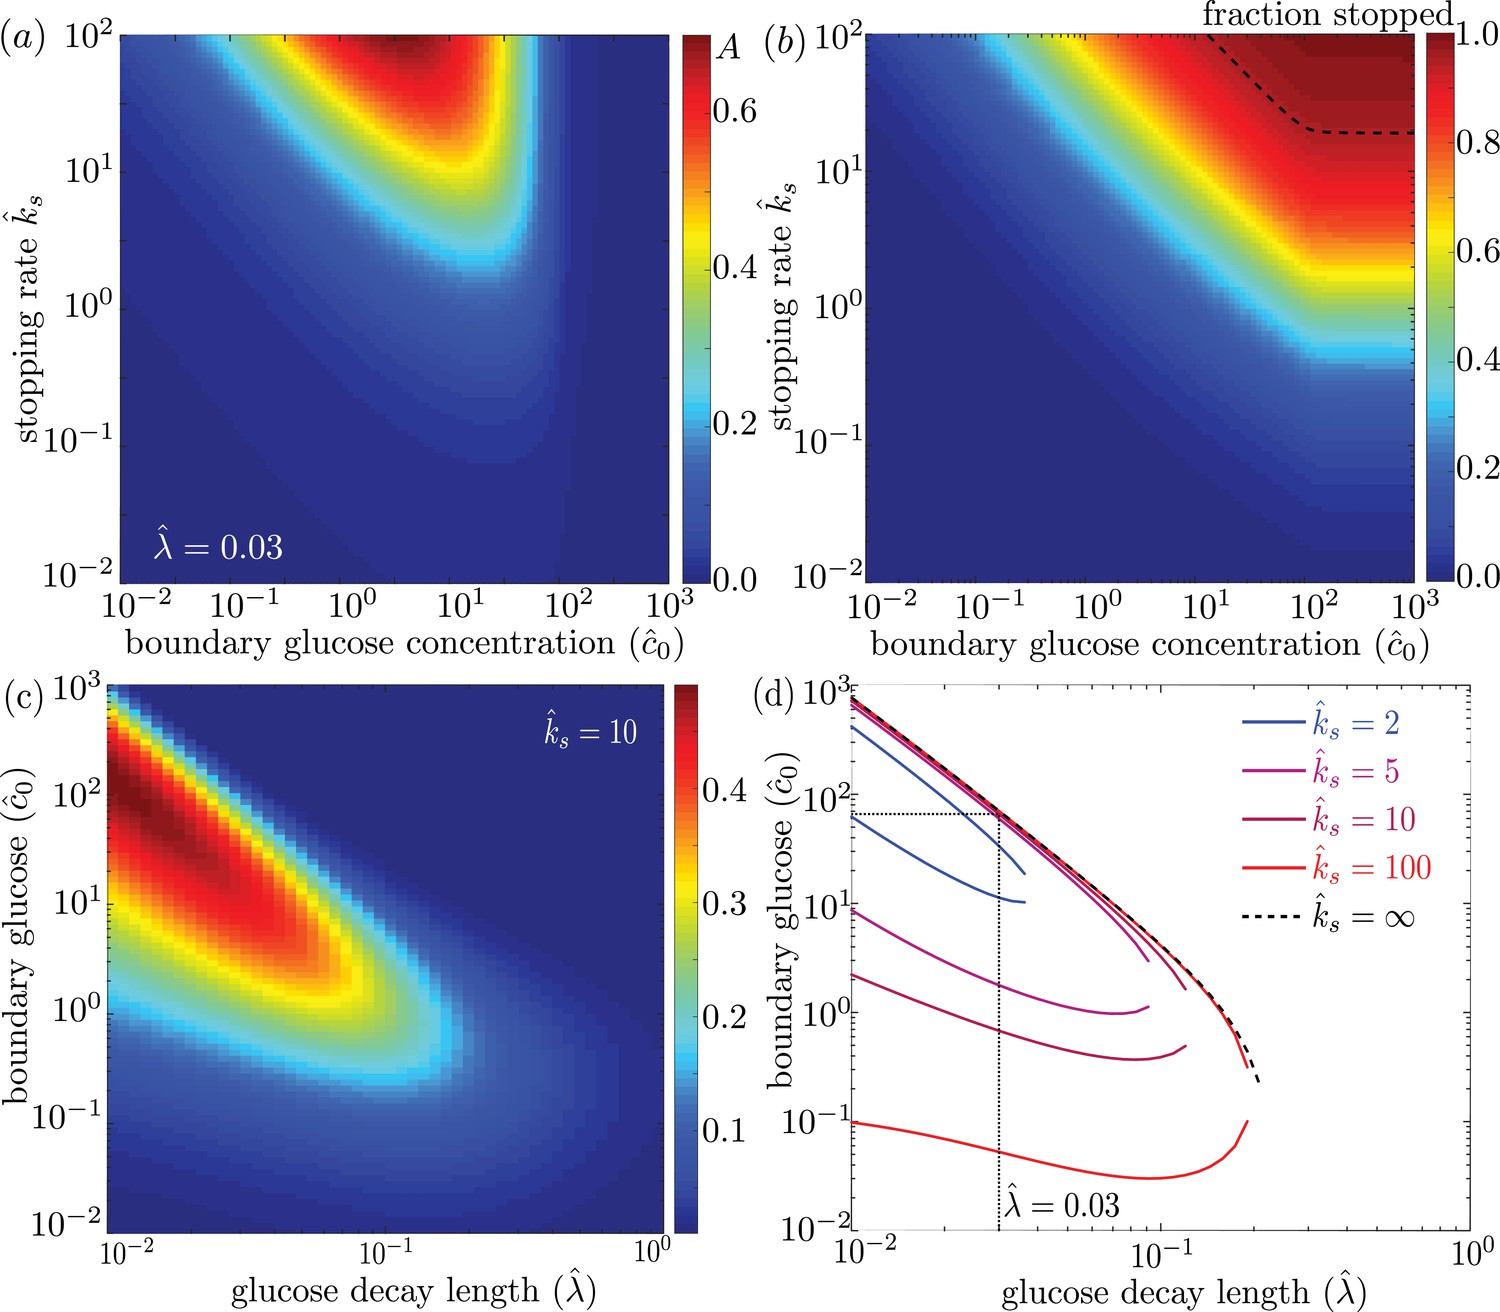
Effect of model parameters on mitochondrial accumulation at regions of localized glucose entry.
(a) Accumulation metric as a function of boundary glucose levels and mitochondrial stopping rate. (b) Fraction of mitochondria in the stopped state. Black dashed line indicates parameters corresponding to 95% stopped mitochondria. (c) Accumulation metric as a function of glucose levels and decay length . (d) Phase diagram for mitochondrial accumulation, showing upper and lower concentration cutoffs for accumulation above the cutoff of . Dashed black line shows limit of high stopping rate . Dotted black line indicates estimate of for physiological parameters, and corresponding upper concentration cutoff. Source data provided in ‘Figure 4—source datas 1–3’.
-
Figure 4—source data 1
Matlab code to calculate and plot mitochondrial accumulation with localized glucose entry.
- https://doi.org/10.7554/eLife.40986.009
-
Figure 4—source data 2
Calculated mitochondrial accumulation data for Figure 4a-b
- https://doi.org/10.7554/eLife.40986.010
-
Figure 4—source data 3
Calculated mitochondrial accumulation data for Figure 4c-d
- https://doi.org/10.7554/eLife.40986.011
Figure 5
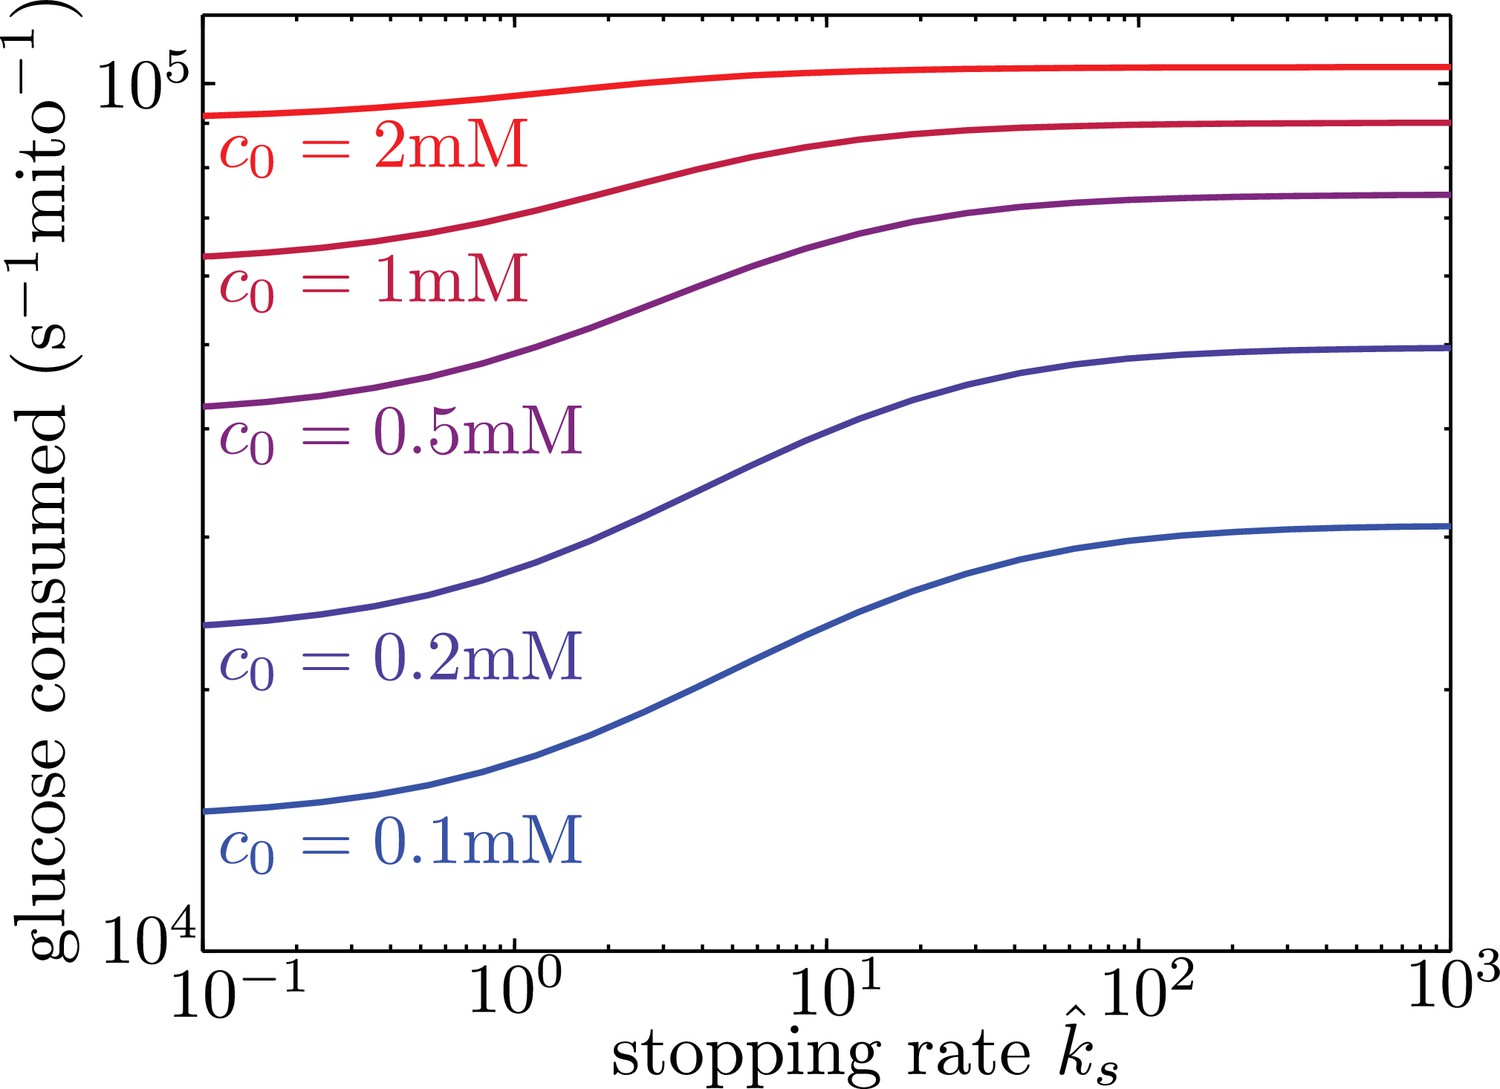
Mitochondrial stopping increases overall metabolic flux.
Total glucose consumption per mitochondrion, averaged over the full interval, is shown for different edge glucose concentrations () as a function of the mitochondrial stopping rate . The limit of small corresponds to uniform mitochondria distribution. Parameters for the model are taken from Table I. Source data is provided in ‘Figure 5—source data 1’.
-
Figure 5—source data 1
Matlab code to calculate and plot total glucose consumption with localized glucose sources.
- https://doi.org/10.7554/eLife.40986.013
Figure 6 with 1 supplement
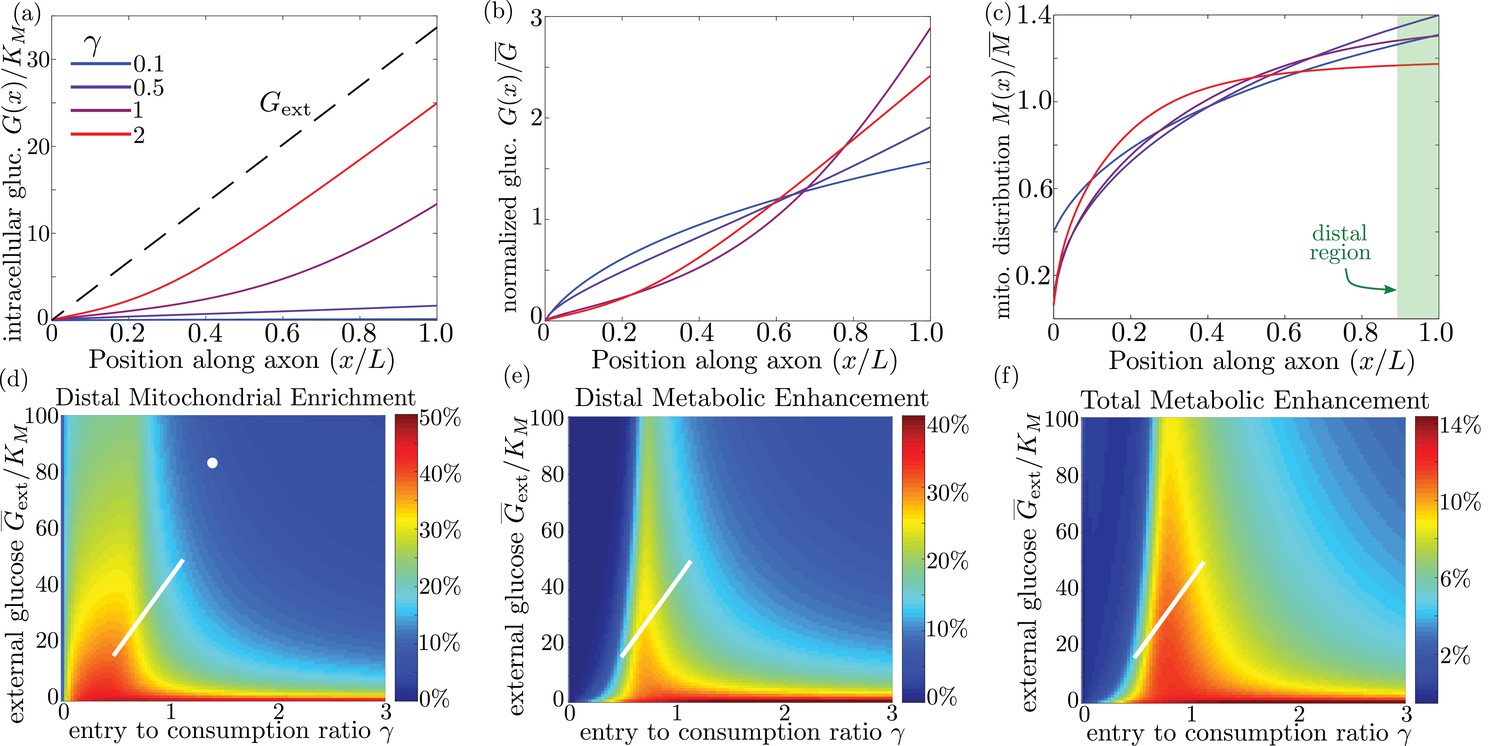
Mitochondrial and glucose organization in a region with uniform glucose permeability, subjected to a gradient of external glucose.
(a) Internal glucose levels for the steady state solution with ( mM) and varying ratios of entry to consumption rate . Black dashed line shows external glucose levels. (b) Corresponding normalized distribution of internal glucose. (c) Corresponding normalized mitochondrial distribution. Shaded box indicates distal region used for calculating mitochondrial enrichment and metabolic enhancement in panels (d-e). (d) Mitochondrial enrichment in the distal 10% of the interval at highest external glucose, compared to a uniform distribution. White dot marks estimated parameter values for neuronal cell culture experiments ( mM). (e) Enhancement in metabolic flux in the distal region at high glucose, compared to a uniform mitochondrial distribution. (f) Enhancement in metabolic flux over full interval. White line in (d–f) shows estimated parameter range for physiological glycemic levels mM. Parameter values , used throughout. Source data is provided in ‘Figure 6—source datas 1–3’.
-
Figure 6—source data 1
Matlab code to calculate and plot results for model with linear glucose gradient.
- https://doi.org/10.7554/eLife.40986.016
-
Figure 6—source data 2
Calculated results for linear glucose gradient, with glucose-dependent mitochondrial halting.
- https://doi.org/10.7554/eLife.40986.017
-
Figure 6—source data 3
Calculated results for linear glucose gradient, with uniformly distributed mitochondria.
- https://doi.org/10.7554/eLife.40986.018
Figure 6—figure supplement 1

High stopping rate limit for model with uniform glucose permeability.
For the high ks limit, we show (a) mitochondrial enrichment in the distal region and (b) metabolic enhancement in the distal region. In this limit, mitochondrial accumulation occurs for arbitrarily low values of as nearly all mitochondria are in the stopped state even at very low internal glucose concentrations. However, metabolic enhancement still occurs only within a narrow range of values.
Appendix 2—figure 1
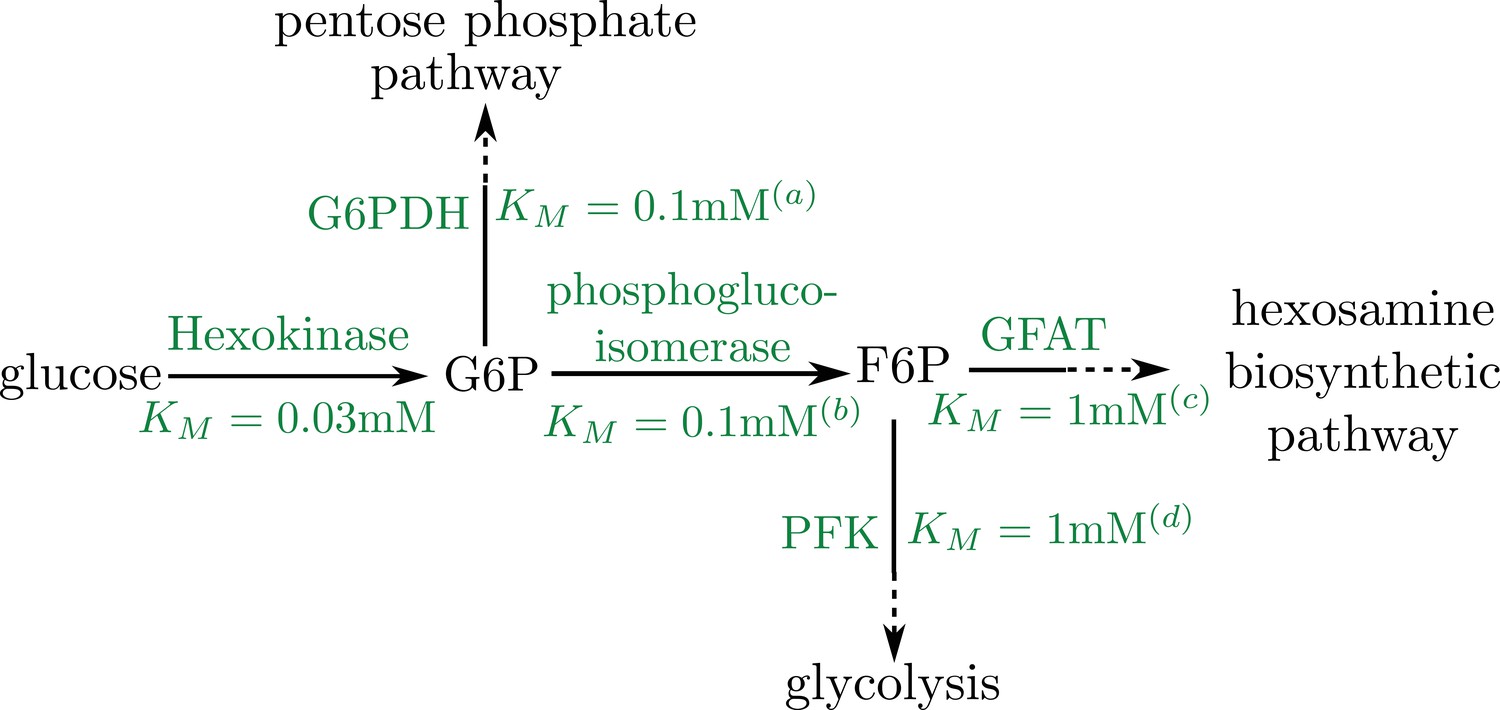
Schematic of early pathway branches in glucose metabolism, showing the branching of the pentose phosphate pathway and glycolysis from the hexosamine biosynthetic pathway that leads to UDP-GlcNAc formation.
Saturation concentrations are labeled for each of the initial branching reactions. Note that in both cases, the splitting branches have comparable values of KM (a) Duffieux, 2000; (b) Kahana et al., 1960; (c) Li et al., 2007; (d) Urbina and Crespo, 1984.
Appendix 3—figure 1
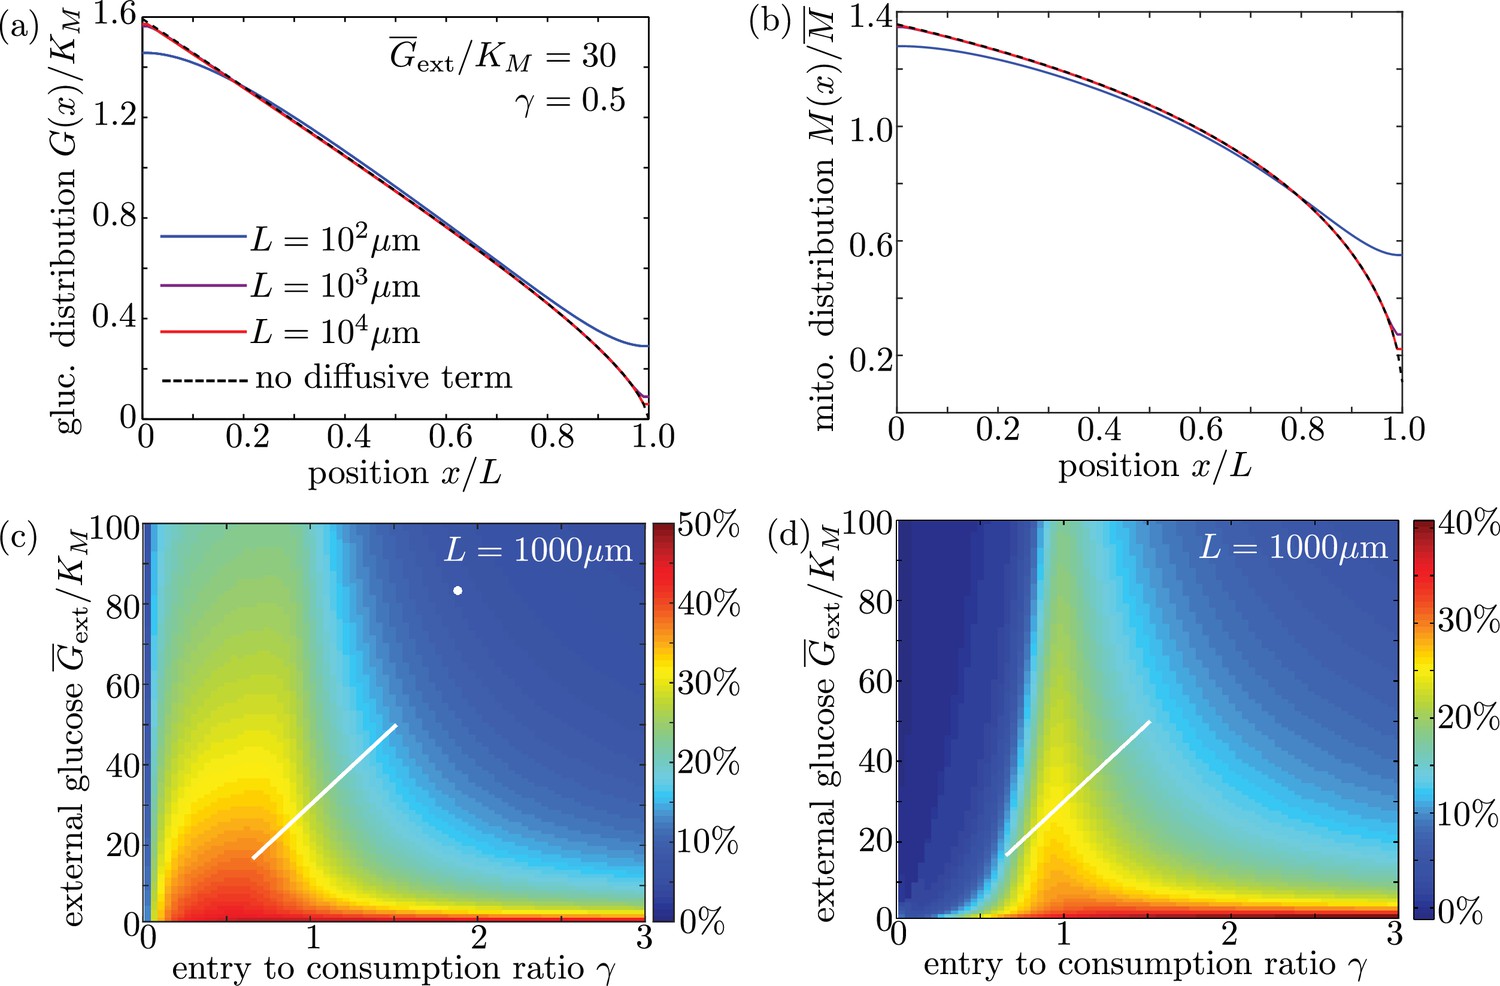
Long cell length limit can be approximated by a simplified model without diffusive transport.
(a-b) Steady-state intracellular glucose and mitochondrial distributions from numerical solutions of Equation 6 using different values of interval length . Black dashed line shows solution of the simplified model with the diffusive term removed. (c) Mitochondrial enrichment in the distal 10% of the interval subject to highest external glucose, as compared to a uniform distribution. White line indicates physiological brain glucose levels, while white dot indicates glucose levels in cultured neurons (Pekkurnaz et al., 2014). (d) Enhancement in metabolic flux in the distal 10% of the interval, compared to uniform mitochondrial distribution. Plots (c) and (d) are obtained from solutions of the full model with diffusive transport and are indistinguishable from (Figure 6d–e) for an interval length of 1000 µm.
-
Appendix 3—figure 1—source data 1
Matlab code to calculate and plot results for finite length domains with limited glucose permeability.
- https://doi.org/10.7554/eLife.40986.025
-
Appendix 3—figure 1—source data 2
Calculated data for domain length 100 $\mu$m.
- https://doi.org/10.7554/eLife.40986.026
-
Appendix 3—figure 1—source data 3
Calculated data for domain length 1000 $\mu$m.
- https://doi.org/10.7554/eLife.40986.027
-
Appendix 3—figure 1—source data 4
Calculated data for domain length 1000 $\mu$m with uniformly distributed mitochondria.
- https://doi.org/10.7554/eLife.40986.028
-
Appendix 3—figure 1—source data 5
Calculated data for domain length 10000 $\mu$m.
- https://doi.org/10.7554/eLife.40986.029
Tables
Table 1
Physiological parameter values estimated from published data.
https://doi.org/10.7554/eLife.40986.005| Cytoplasmic glucose diffusivity | D | 140 µm2/s |
| glucose turnover per mitochondrion | kg | 1.3 × 10⁵s−1 |
| axon radius | r | 0.4 µm |
| internodal distance | L | 250 µm |
| mitochondrial density | 0.3 µm−3 | |
| hexokinase Michaelis-Menten constant | KM | 0.03 mM |
| brain glucose levels | c0 | 0.7 − 1.3 mM |
| ratio of stopped to moving mitochondria at high glucose | ks/kw | 19 |
| glucose permeability | P | 20 nm/s |
| glucose transporter (GLUT3) Michaelis-Menten constant | KMP | 3 mM |
-
Source: see Appendix 1 for details of parameter estimates.
Additional files
-
Transparent reporting form
- https://doi.org/10.7554/eLife.40986.019
-
Appendix 3—figure 1—source data 1
Matlab code to calculate and plot results for finite length domains with limited glucose permeability.
- https://doi.org/10.7554/eLife.40986.025
-
Appendix 3—figure 1—source data 2
Calculated data for domain length 100 $\mu$m.
- https://doi.org/10.7554/eLife.40986.026
-
Appendix 3—figure 1—source data 3
Calculated data for domain length 1000 $\mu$m.
- https://doi.org/10.7554/eLife.40986.027
-
Appendix 3—figure 1—source data 4
Calculated data for domain length 1000 $\mu$m with uniformly distributed mitochondria.
- https://doi.org/10.7554/eLife.40986.028
-
Appendix 3—figure 1—source data 5
Calculated data for domain length 10000 $\mu$m.
- https://doi.org/10.7554/eLife.40986.029
Download links
A two-part list of links to download the article, or parts of the article, in various formats.
Downloads (link to download the article as PDF)
Open citations (links to open the citations from this article in various online reference manager services)
Cite this article (links to download the citations from this article in formats compatible with various reference manager tools)
Spatial control of neuronal metabolism through glucose-mediated mitochondrial transport regulation
eLife 7:e40986.
https://doi.org/10.7554/eLife.40986


