Molecular basis of synaptic specificity by immunoglobulin superfamily receptors in Drosophila
- University of Chicago, United States
- Jagiellonian University, Poland
Figures
Figure 1 with 1 supplement
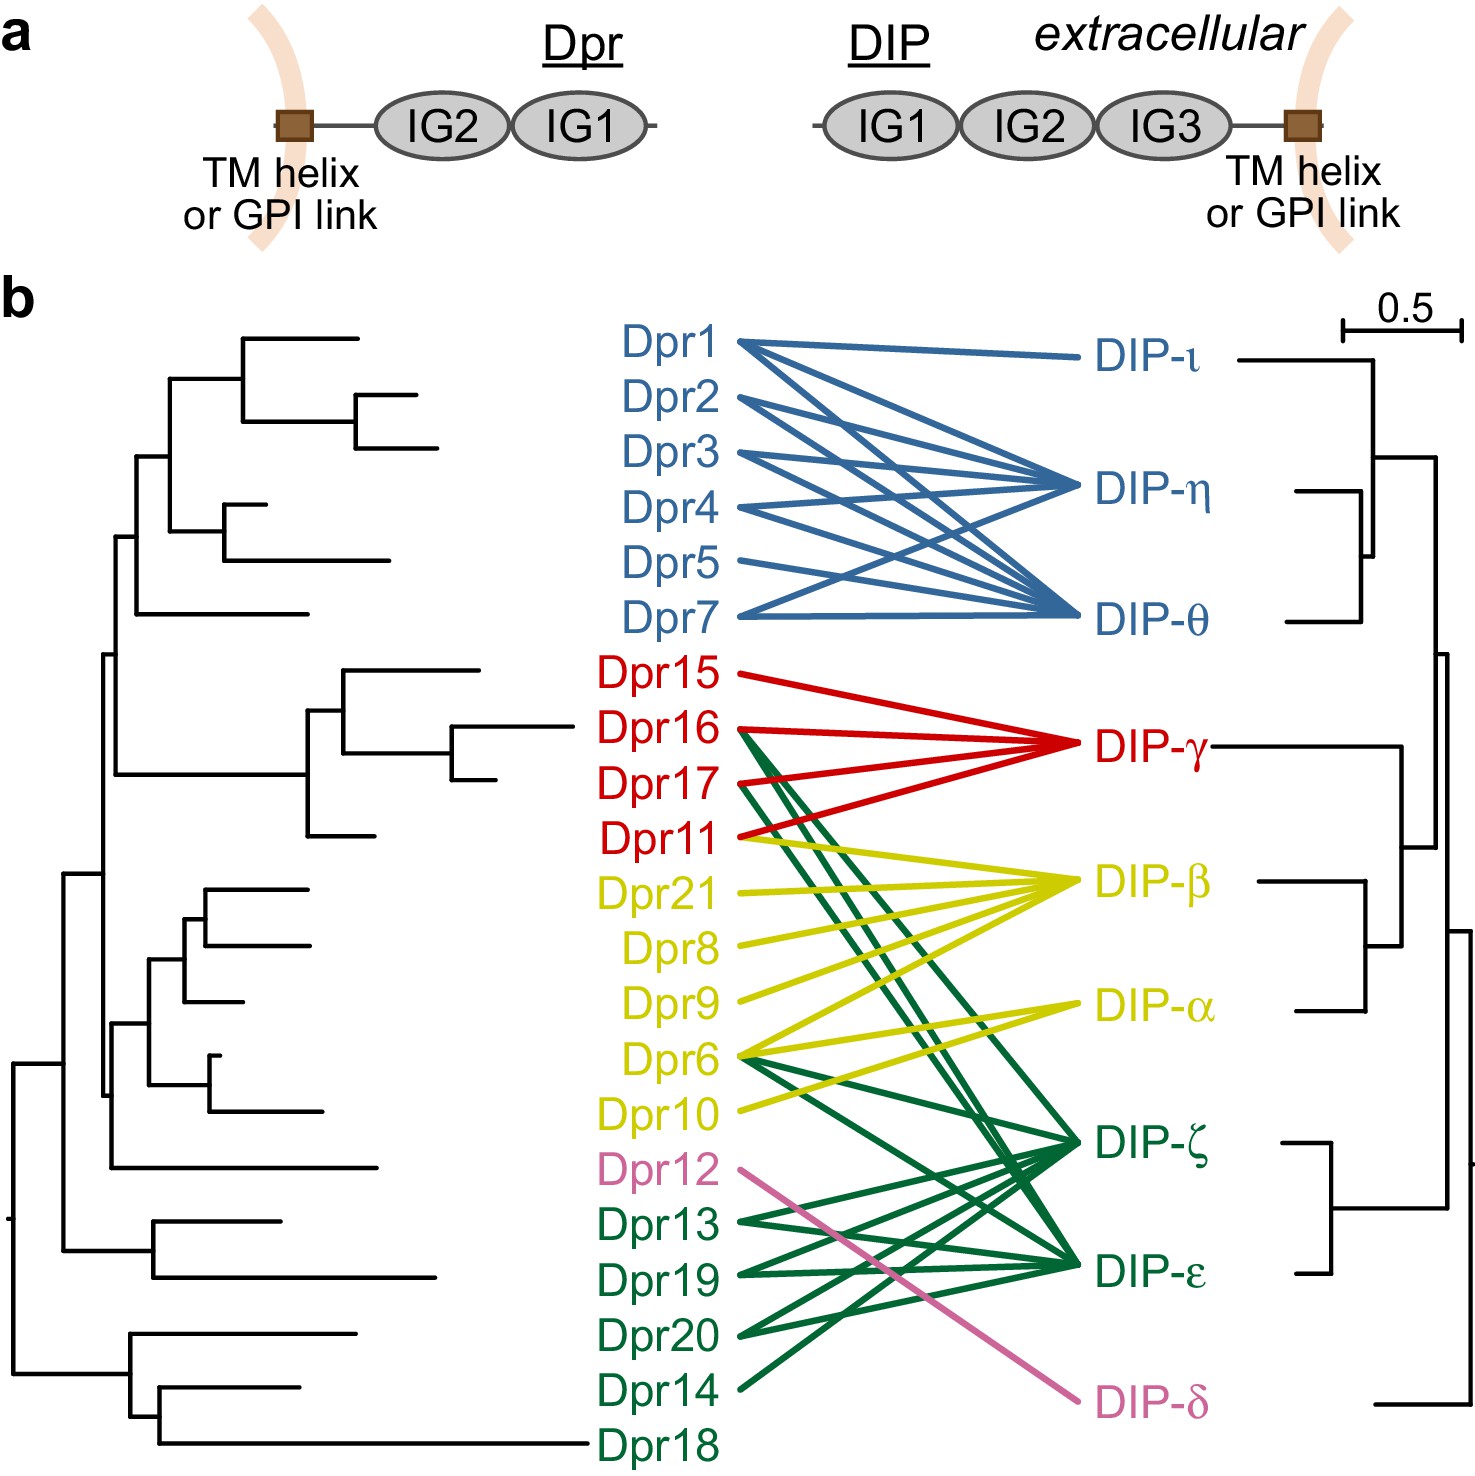
Dprs and DIPs can be classified into five classes based on sequence relationships and their interactions.
(a) Cellular topologies and domain compositions of Dprs and DIPs. (b) Phylogenetic tree of Dprs and DIPs based on sequence alignments covering all IG domains. The colored lines indicate observed interactions mediated by IG1s. The scale bar represents 0.5 substitutions per site.
Figure 1—figure supplement 1
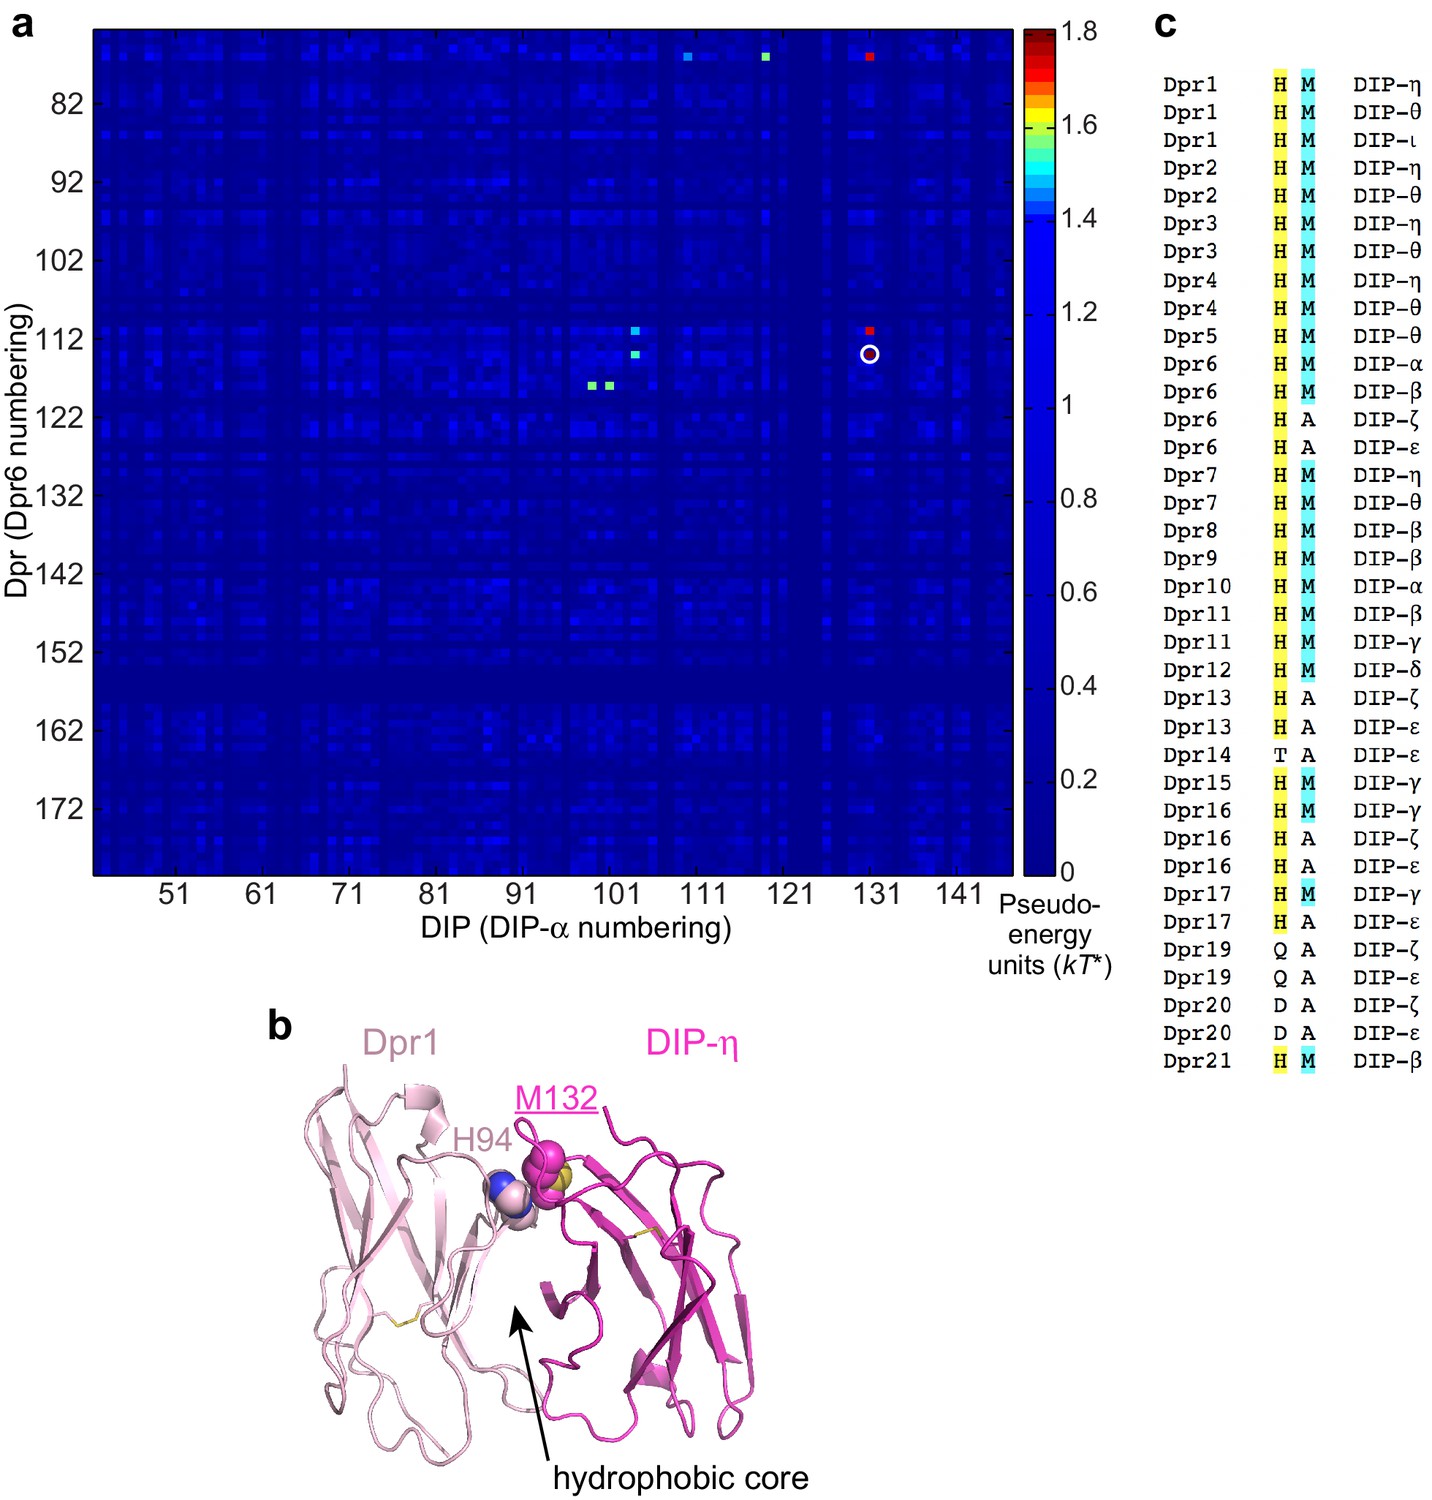
Statistical Analysis of artificial chimeras of cognate Dpr/DIP sequences.
(a) Statistical Coupling values (SCA version 5) between Dpr and DIP positions. Strongest coupling is labeled with a white circle. (b) The role of the coupled residues in the Dpr6–DIP-α complex structure. H94 (Dpr1) and M132 (DIP-η) side chains pack closely. (c) Dpr and DIP amino acids at the strongest coupled sites. His in Dprs and Met in DIPs at this position pair tend to co-exist in productive complexes.
Figure 2

Structural comparison of three heterodimeric Dpr–DIP complexes.
(a) Dpr1–DIP-η, Dpr6–DIP-α, and Dpr11–DIP-γ structures overlaid by aligning Dpr IG1 domains. (b) Side-by-side comparison of the structures.
Figure 3 with 1 supplement
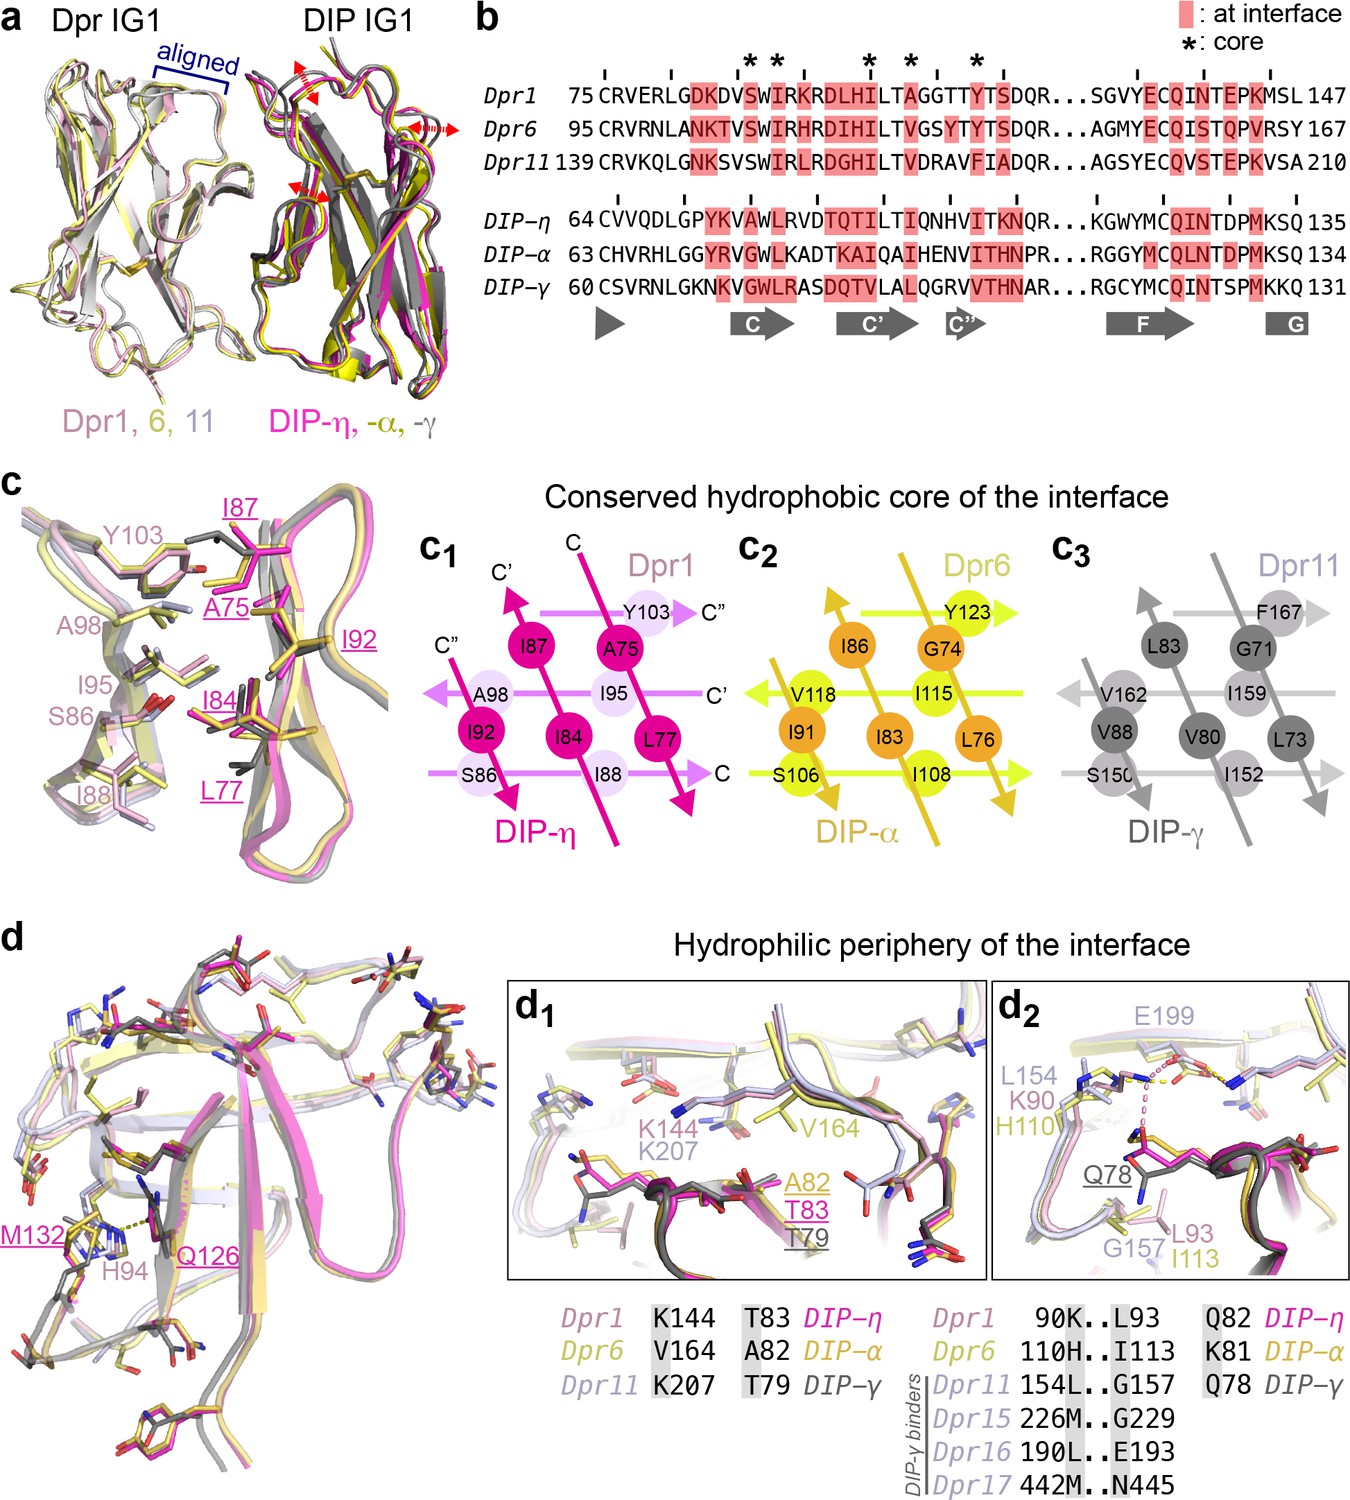
Conserved and variable features of interaction surfaces in the heterodimeric Dpr–DIP complexes.
(a) Three heterophilic complexes overlaid by aligning the GFCC’C’ sheets of the Dpr subunits. Displacement of the DIP subunits is illustrated with arrows. (Also see Figure 3—figure supplement 1b.) (b) Sequence alignment of parts of the IG1 domains from Dprs 1, 6, 11 and DIPs-η, α, and γ. Amino acids within 4 Å of the heterophilic partner, that is at van der Waals or hydrogen bonding distances at the Dpr–DIP interface, are labeled in red boxes. * indicates core interface positions in Dprs and DIPs. (c) The conserved hydrophobic core at the interface. The coloring scheme in Figure 2 is used to distinguish Dprs and DIPs. Lighter colors present Dprs. Labels for DIP residues are underlined. Labels in light pink and magenta are for Dpr1 and DIP-η, respectively. Schematics in c1 to c3 show the conserved knob-and-hole interactions at the hydrophobic core. (d) The hydrophilic periphery of the interface. Labels for DIP residues are underlined. d1 and d2 show highly variable positions at the Dpr–DIP interface. For additional structural images, see Figure 3—figure supplement 1.
Figure 3—figure supplement 1
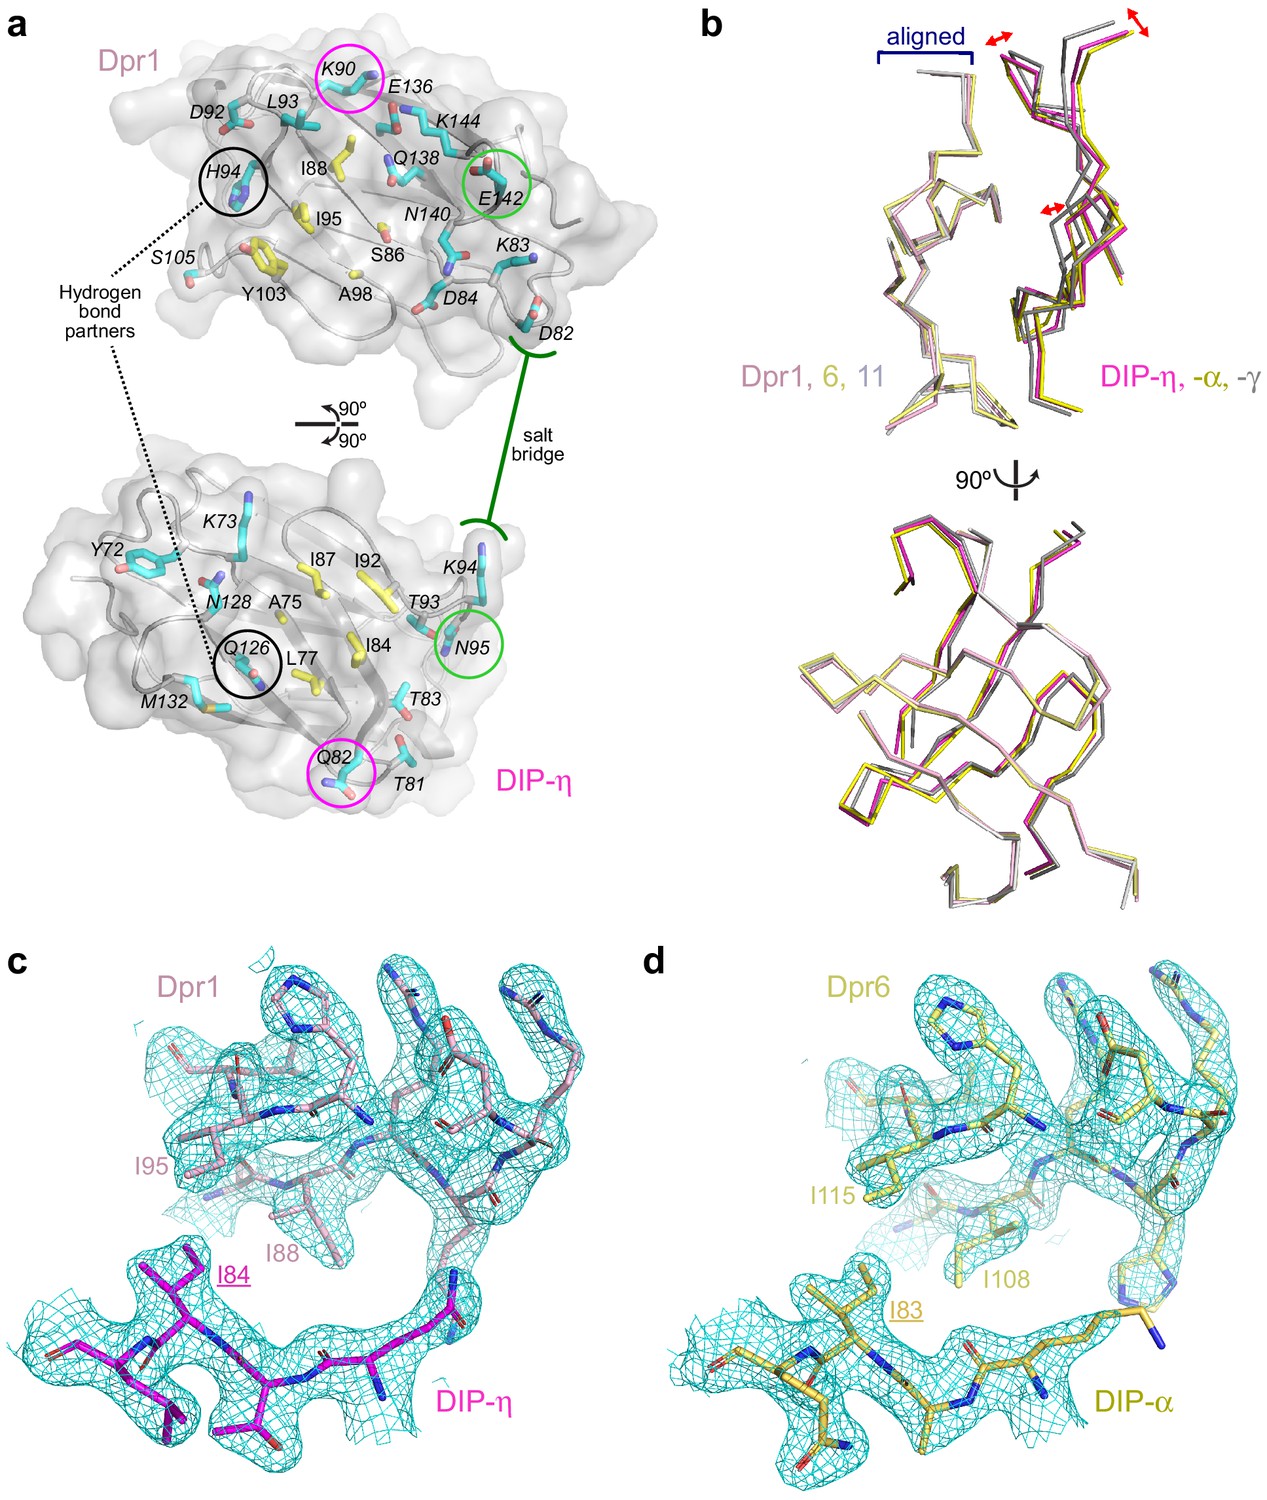
Conserved and variable features of interaction surfaces in the heterodimeric Dpr–DIP complexes.
(a) All interface amino acids labeled on an open-book view of the Dpr–DIP interface, based on the Dpr1-DIP-η structure. Core side chains, defined in Figure 3c1–3 are yellow, and the periphery side chains are The three hydrogen bonding side chains in Dpr1–DIP-η complex, are all in the periphery and are marked within black, purple and light green circles. One salt bridge is also labeled. (b) When only the amino acids at the interface of Dprs are aligned, their cognate DIPs are displaced from each other, most significantly for Dpr11-bound DIP-γ. This is most significant in the image above, where DIP-γ pivots away from the interface. At the orthogonal view (below), the displacement of DIP-γ is not noticeable. (c,d) 2mFo–DFc electron density maps from phenix.refine show that rotamers at the interface are well defined by electron density. Maps are contoured at 1.4 σ. Equivalent amino acids Dpr1 I88 (c) and Dpr6 I108 (d) are in different rotameric states, supported by electron density. .
Figure 4 with 4 supplements
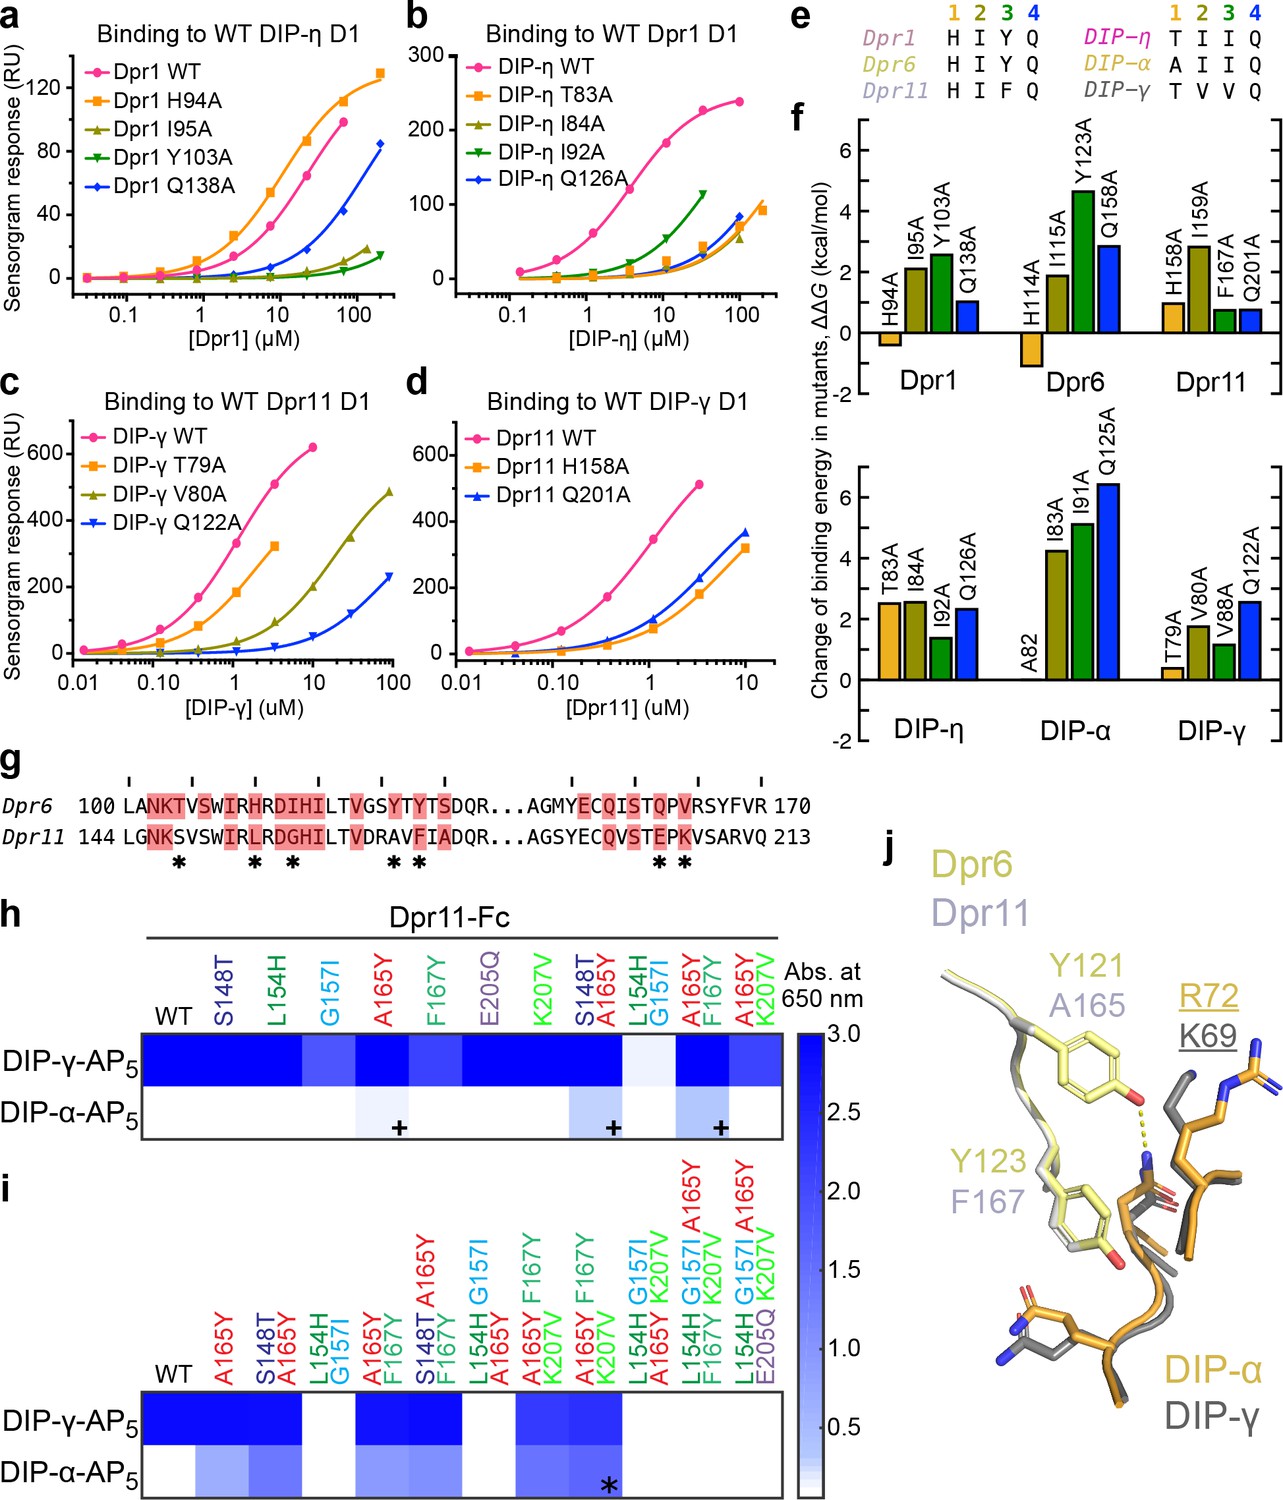
Energetics and engineering of Dpr–DIP interfaces.
(a–d) Corresponding sets of Dpr and DIP interface residues are mutated in Dpr1 (a), DIP-η (b), Dpr11 (c) and Carrillo et al., 2015), DIP-γ (d) and Carrillo et al., 2015), Dpr6 and DIP-α (Carrillo et al., 2015). Binding isotherms for wild-type and mutants tested in this study are plotted with fits to a 1:1 interaction model. (e) The amino acids at the four mutated sites in six Dpr and DIP heterophilic partners. (f) Effects of alanine mutagenesis at the four sites in energy terms (from Figure 4—figure supplement 2a). (g) Comparison of Dpr6 and Dpr11 IG1 sequences. * highlights variable amino acids at the interface. (h,i) Binding of Dpr11 mutants to the native partner DIP-γ and the engineering target DIP-α using ECIA in two cycles. (j) Comparison of the interactions of conversion mutation sites (A165Y and F167Y) between the Dpr6–DIP-α and Dpr11–DIP-γ complexes.
Figure 4—figure supplement 1
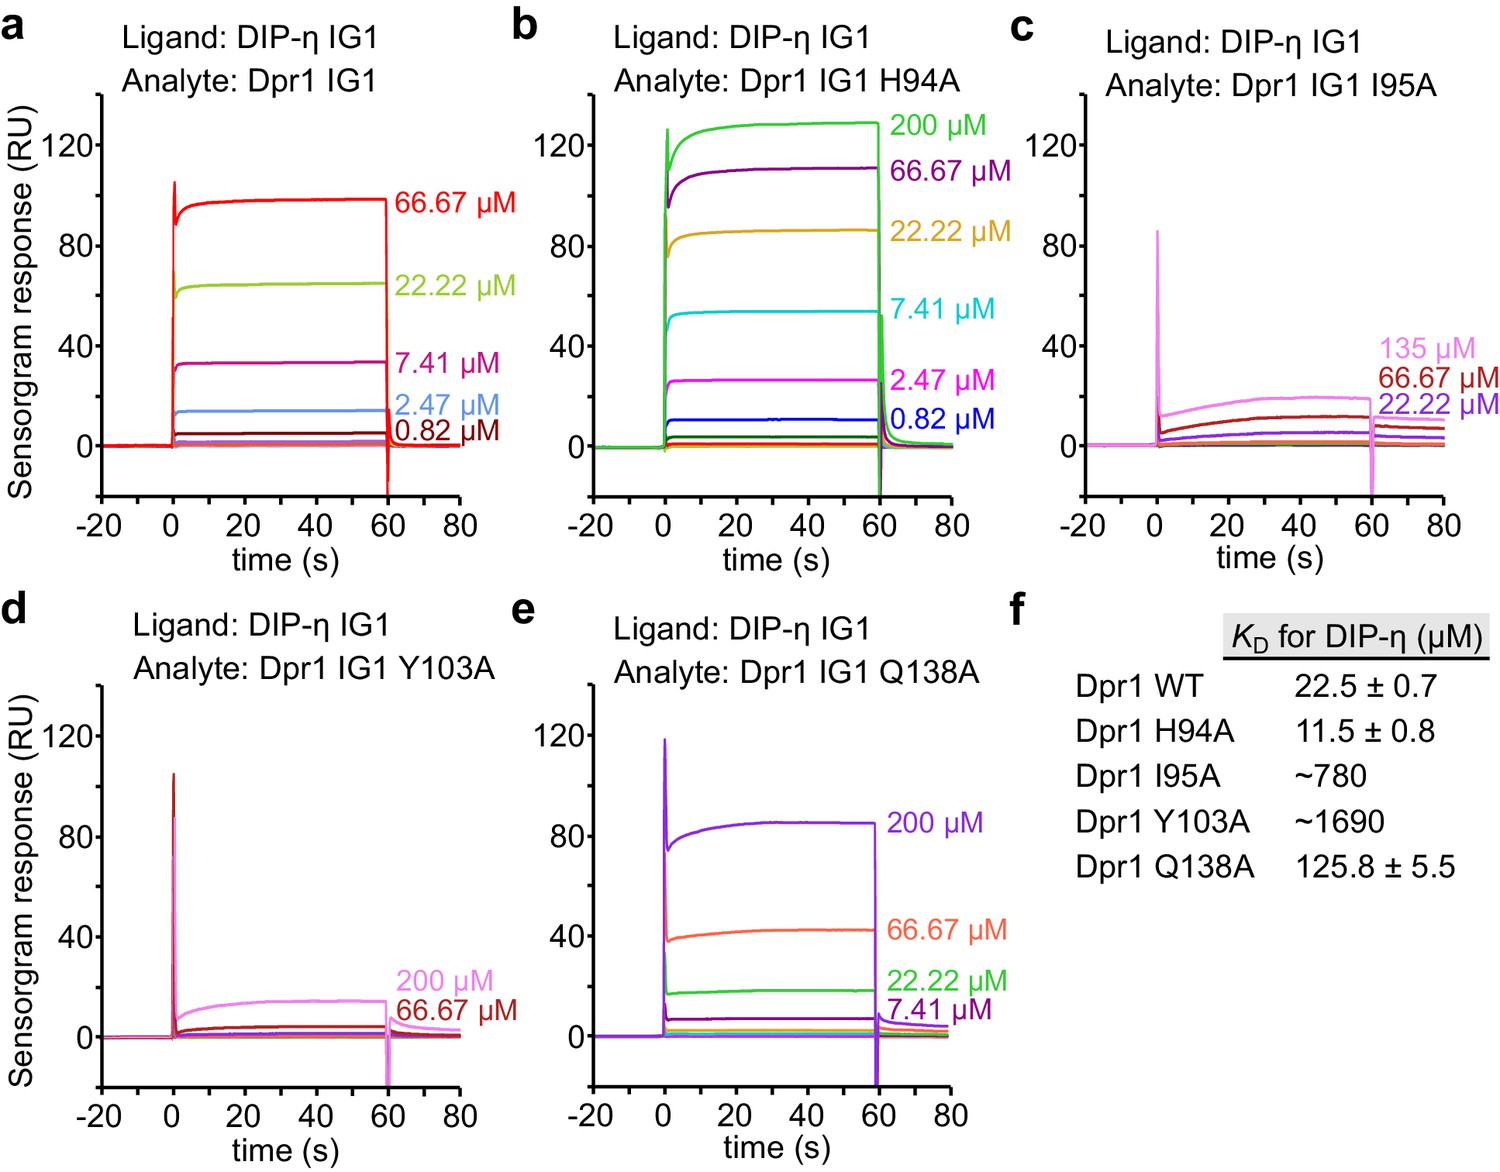
SPR data for Dpr1 mutants binding to DIP-η.
(a–e) SPR sensorgrams for immobilized DIP-η D1 (ligand) against Dpr1 WT and mutants (analytes). Binding isotherms are depicted in Figure 4a. (f) Table of dissociation constants for heterophilic IG1-IG1 interaction. This set of SPR results are likely to be significantly affected by the competing DIP-η homodimeric interaction on the chip, and the true heterophilic KD values may be much lower (see Figure 4—figure supplement 3 for WT DIP-η-Dpr1 binding.).
Figure 4—figure supplement 2
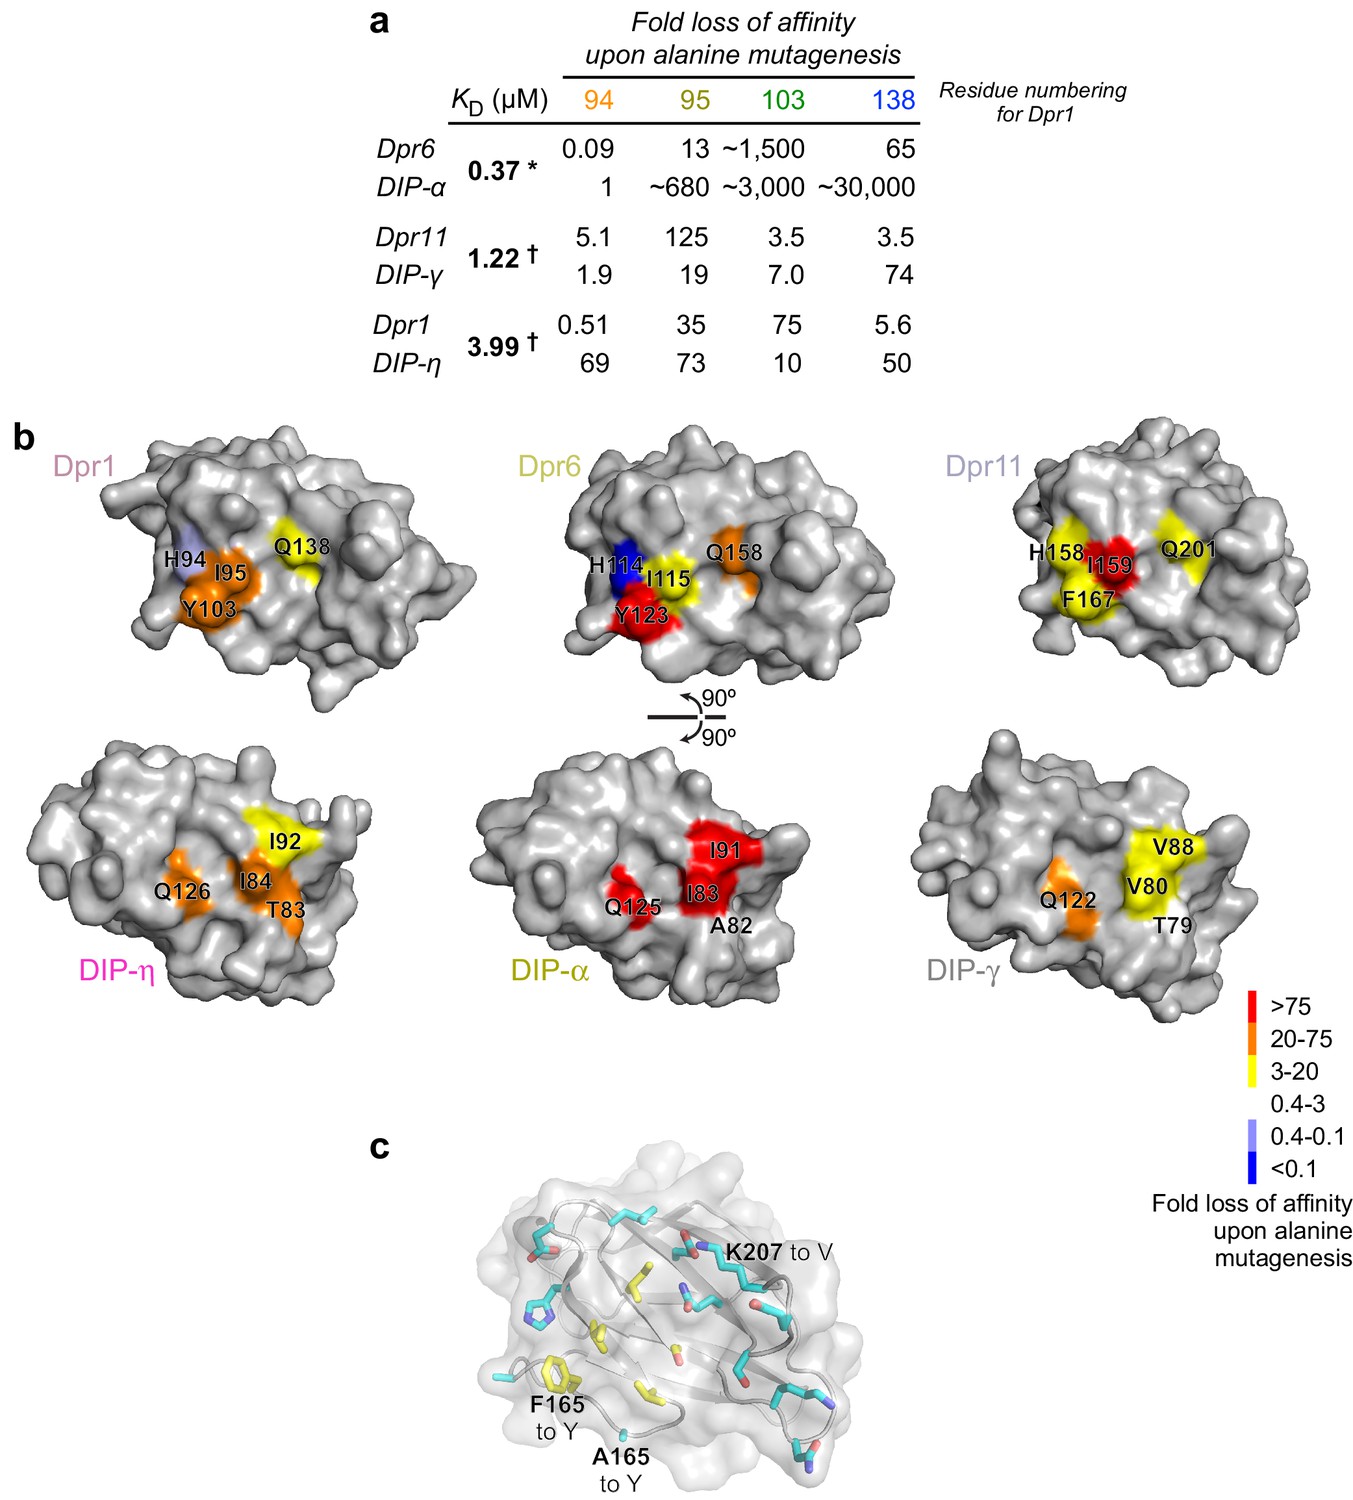
Mapping of binding energetics onto structure.
(a) Fold loss of affinity for mutants measured here and in Carrillo et al. (2015). * Full ectodomain binding result. † IG1-IG1 binding result. (b) Structural mapping of binding energy contributed by four positions among three Dprs and three DIPs. (c) Positions mutated in Dpr11 to allow it to bind DIP-α in the mutant A165Y F167Y K207V mapped onto the surface of Dpr11 IG1.
Figure 4—figure supplement 3
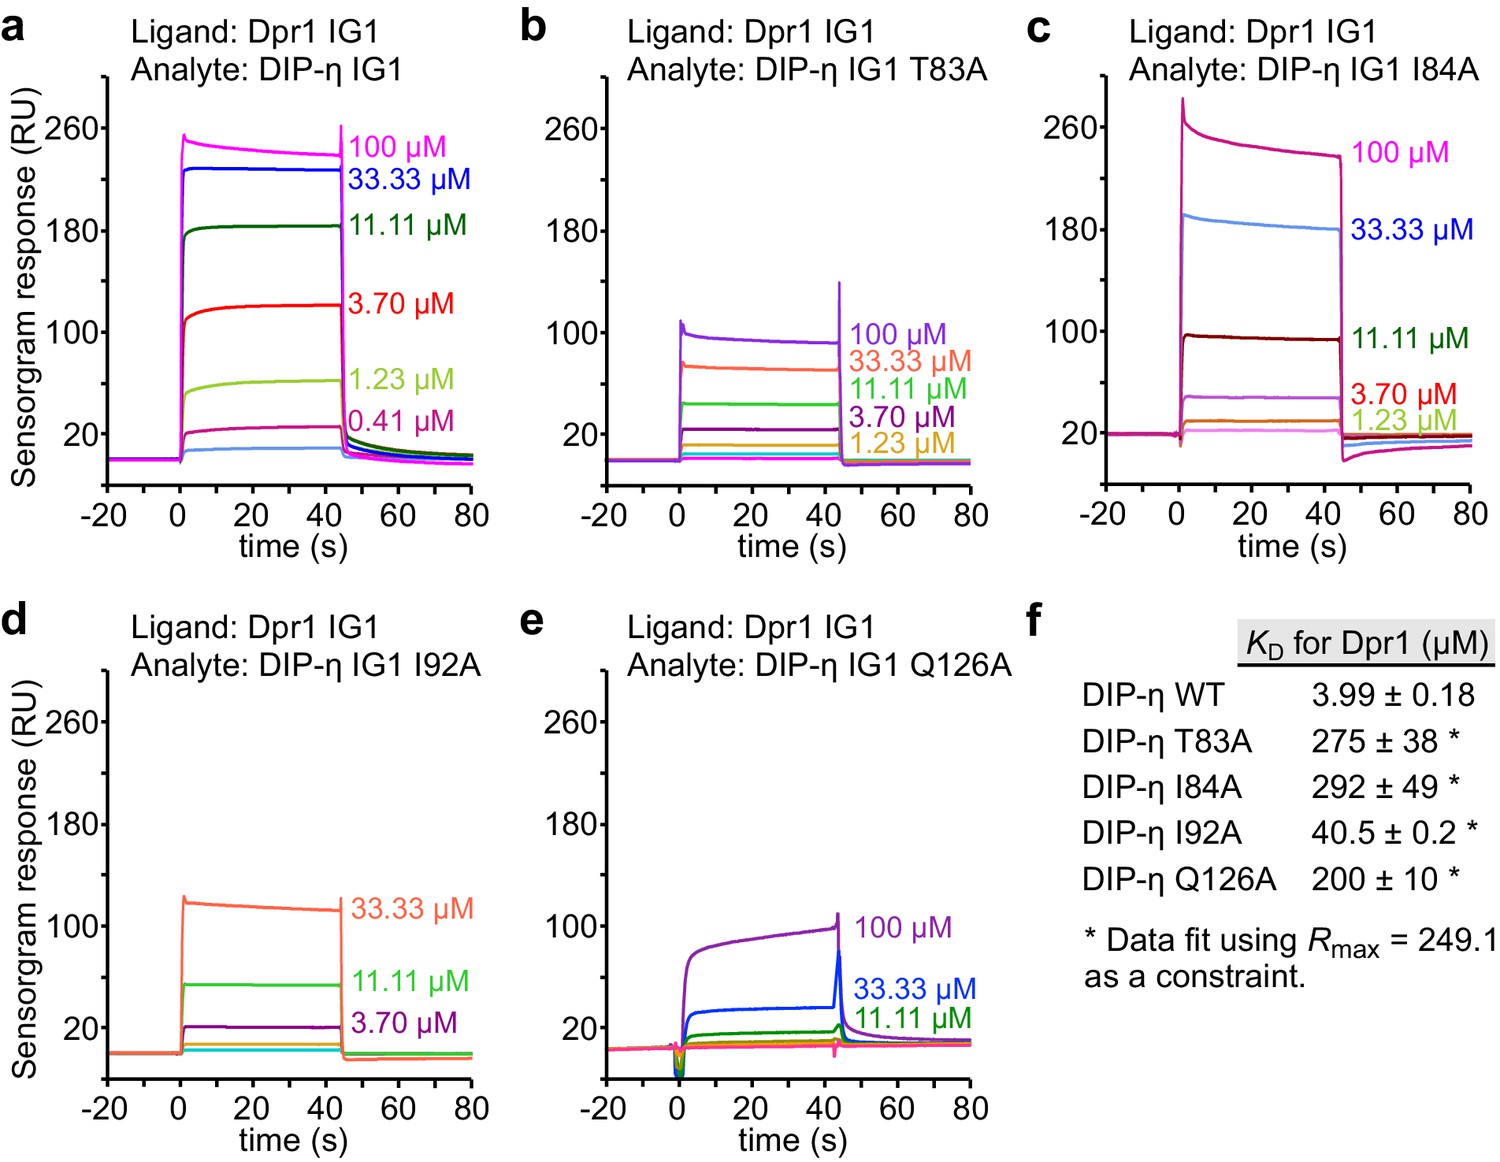
SPR data for DIP-η mutants binding to Dpr1.
(a–e) SPR sensorgrams for immobilized Dpr1 D1 (ligand) against DIP-η WT and mutants (analytes). Binding isotherms are depicted in Figure 4b. (f) Table of dissociation constants for heterophilic IG1-IG1 interactions in this figure supplement.
Figure 4—figure supplement 4
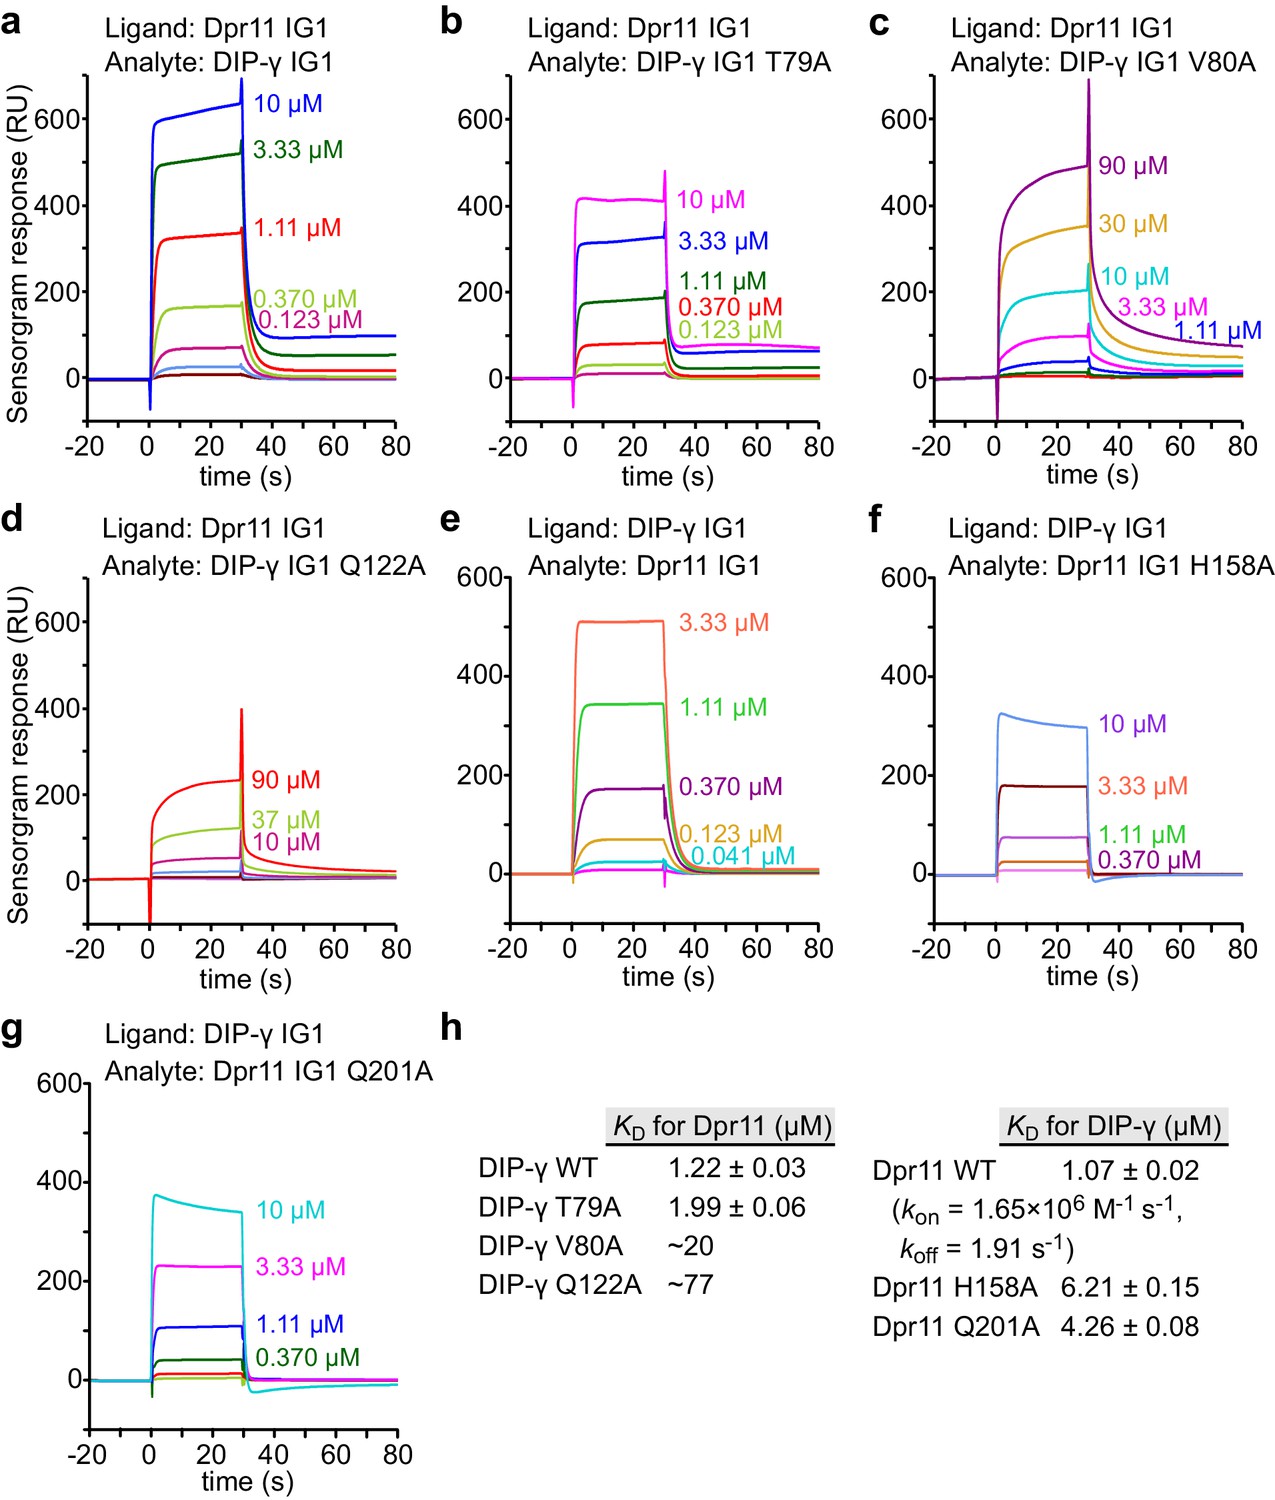
SPR data for Dpr11 and DIP-γ WT and mutants.
(a–g) SPR sensorgrams for Dpr11 and DIP-γ WT and mutants not previously measured. Binding isotherms are depicted in Figure 4c–d. (h) Table of dissociation constants for heterophilic IG1-IG1 interactions in this figure supplement.
Figure 5 with 1 supplement
Structural comparison of DIP-η homodimer complex with the Dpr1–DIP-η heterocomplex.
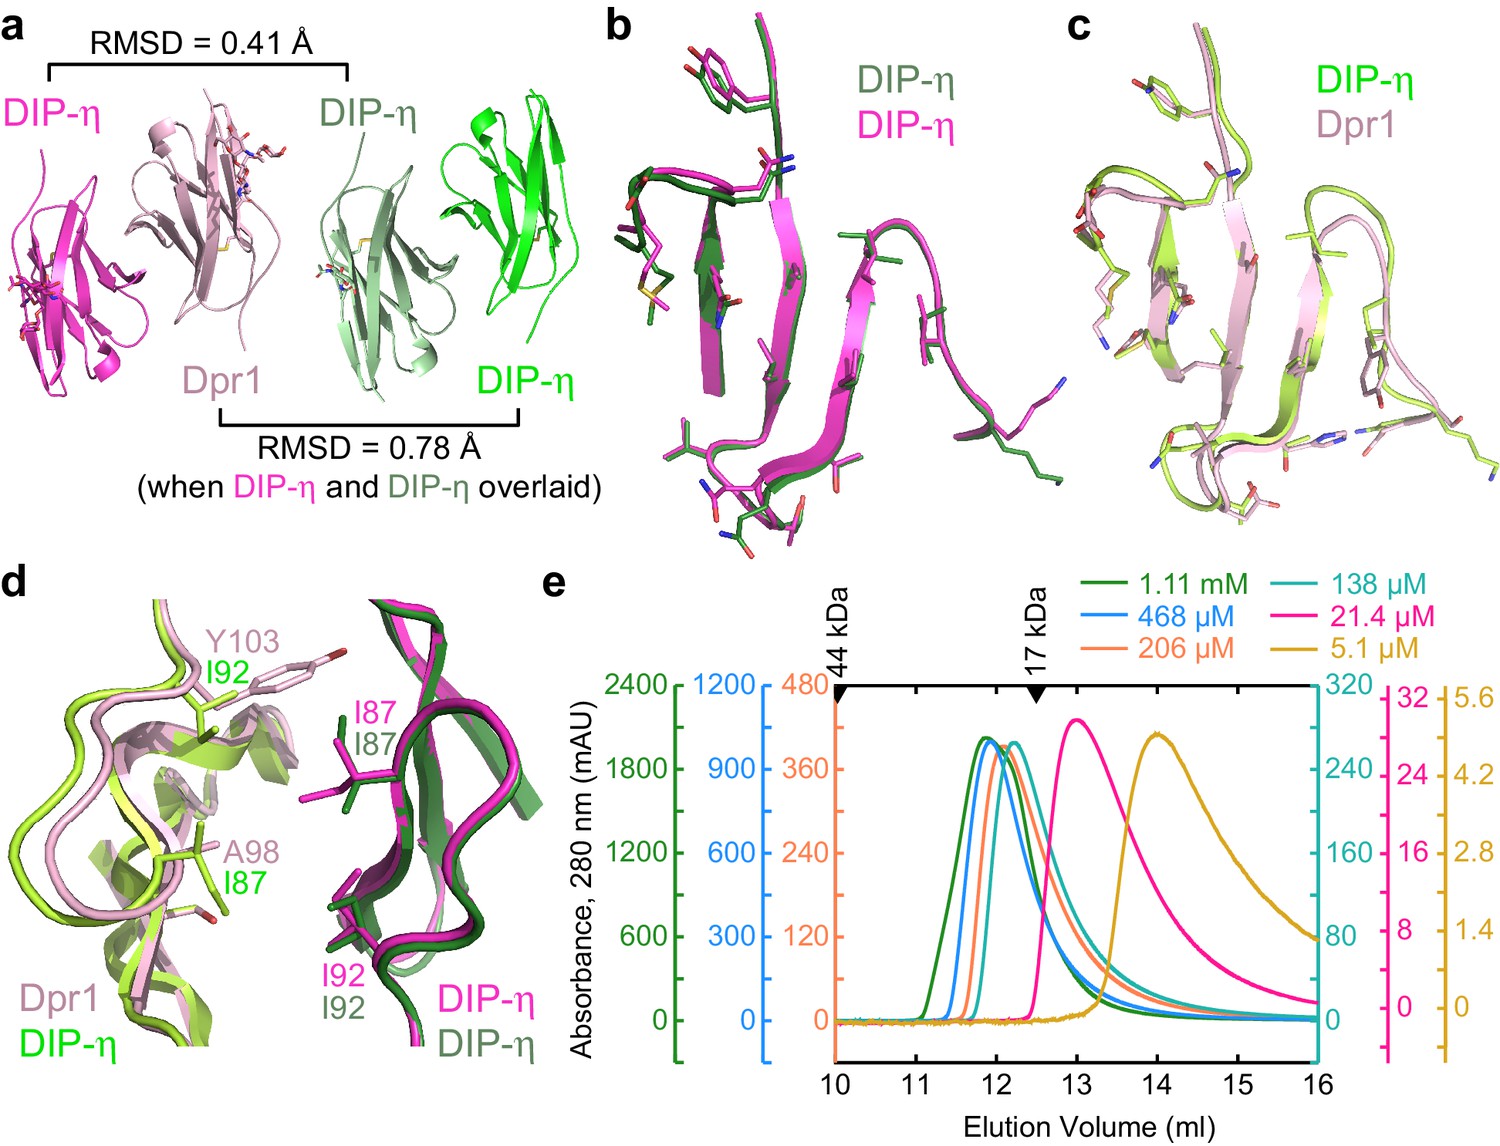
(a) Side-by-side aligned views of the hetero- and homophilic complexes of DIP-η. (b–c) The GFCC’C’ faces involved in the heterophilic (magenta and pink) and homophilic (dark green and green) complexes. (d) DIP-η can accommodate binding both DIP-η and Dpr1 by rearranging the rotameric states of its interface residues. (e) Gel filtration chromatography of DIP-η IG1 at six concentrations. DIP-η is in a fast-exchange dimer-to-monomer equilibrium in the mid-micromolar range. The chromatograms are drawn at different scales shown at both sides of the plot. Path length of the UV flow cell is 0.2 cm. Elution volumes for gel filtration standards are labeled with filled triangles above the chromatograms. DIP-η peak elution positions are plotted against concentration in Figure 5—figure supplement 1c.
Figure 5—figure supplement 1

Structural comparison of Dpr1–DIP-η and DIP-η–DIP-η complexes.
(a) Non-conservative differences (red sticks) between Dpr1 and DIP-η residues at the interface (red boxes), which share DIP-η as binding partner. (b) Large structural differences exist between the homo- and heterodimeric complexes, even on the common DIP-η subunit (magenta and dark green) of the two complexes. (c) The effects of DIP-η concentration on its oligomeric state plotted, which can be fit to a binding isotherm as an approximation. Concentration of DIP-η was estimated by calculating the loaded protein amount by the area under the peaks in the chromatograms (Figure 5e), divided by the sample loading volume (0.5 ml), and is therefore an overestimate due to dilution effects in gel filtration chromatography. Dimer fraction was calculated by identifying monomeric and dimeric elution velocities, and calculating monomer and dimer fractions for any given peak position. (d) SPR measurement for homodimeric DIP-η D1-D1 binding. Data were fit in MATLAB using equations that account for DIP-η dimerization in the analyte (in solution). To minimize dimerization of ligand (on chip), biotinylated DIP-η was captured at a low density, yielding a 98 R.U. maximal response.
Figure 6 with 2 supplements
Structural description and engineering of the Dpr10–DIP-α complex.
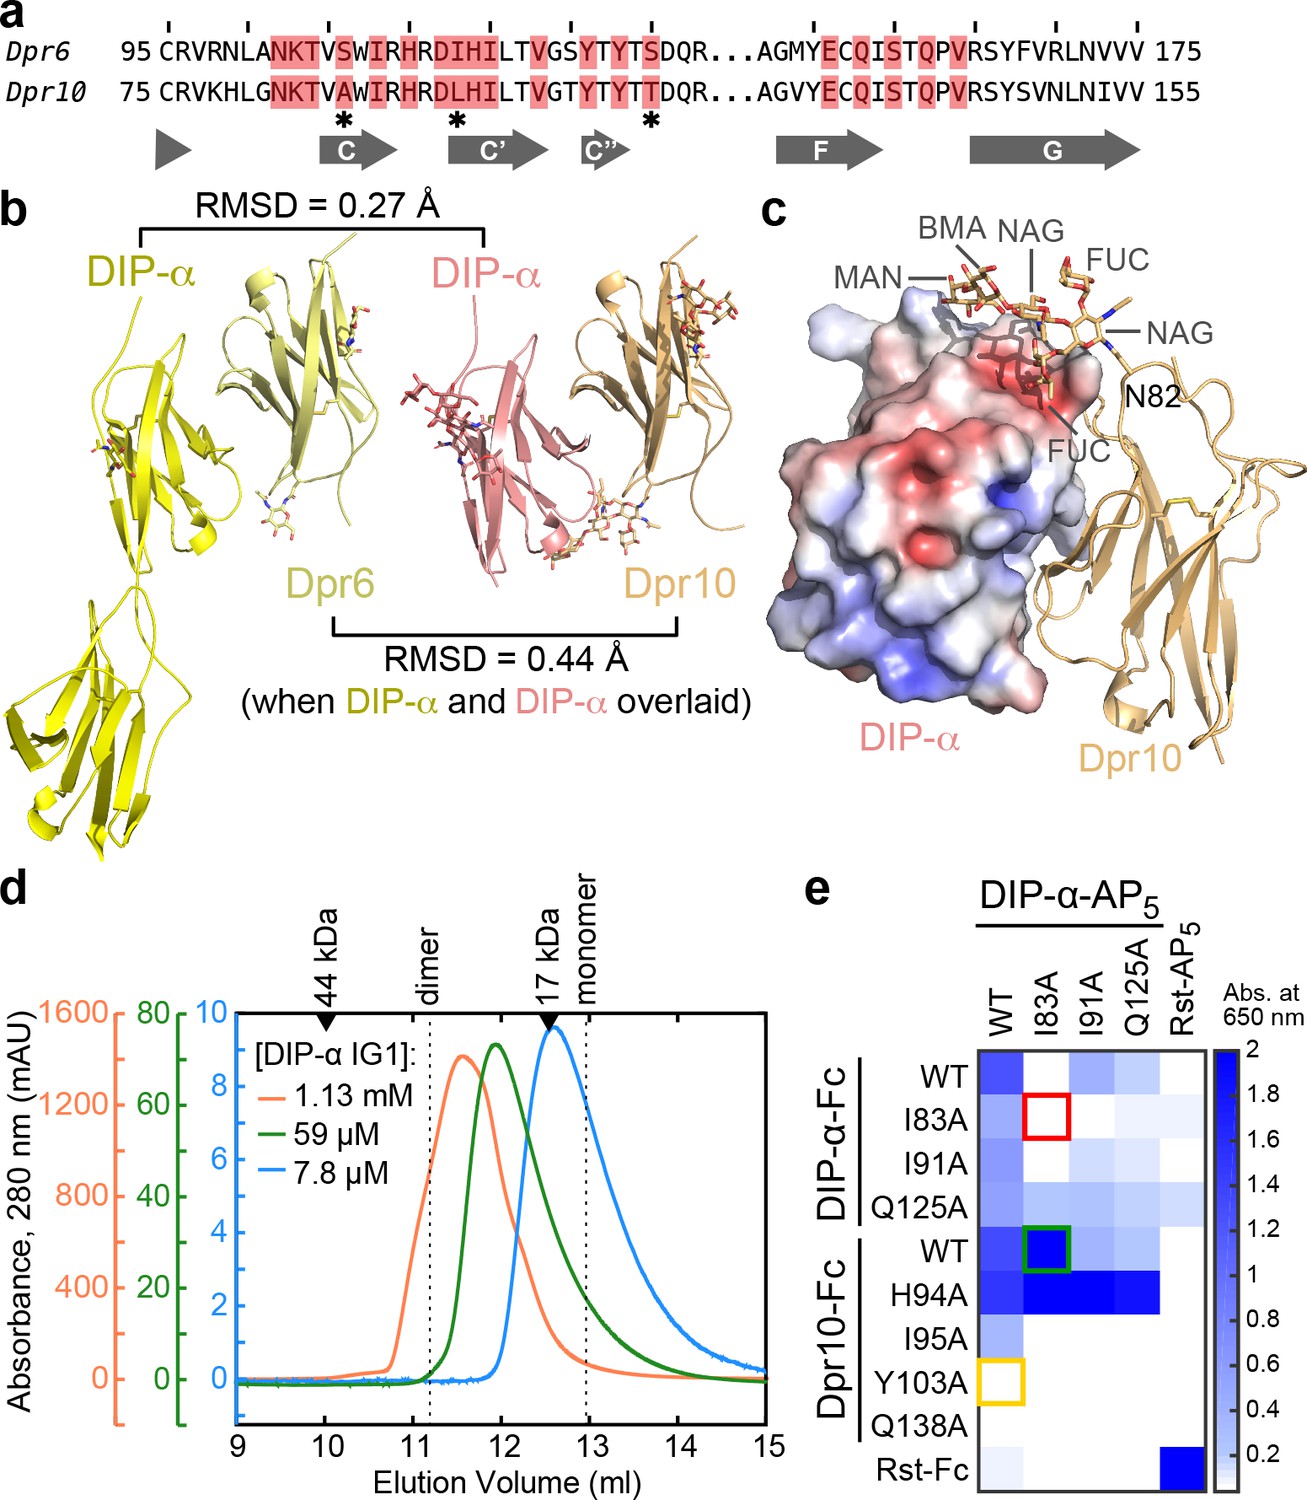
(a) Comparison of Dpr6 and Dpr10 IG1 sequences. Red boxes indicate Dpr residues within 4 Å of DIP-α in the heterocomplexes. * indicates the three variable residues between Dpr6 and Dpr10 at the interface. (b) Side-by-side view of Dpr6–DIP-α and Dpr10–DIP-α complex structures. RMSD values are reported for Cα atoms only. (c) N-linked glycan involvement at the Dpr10–DIP-α interface. DIP-α is depicted as a surface colored by electrostatic potential, and Dpr10 is in cartoon representation with the Asn82-linked glycan drawn as sticks. (d) Gel filtration chromatography of DIP-α IG1 at three DIP-α concentrations. DIP-α is in a fast-exchange dimer-to-monomer equilibrium in the mid-micromolar range. The chromatograms are drawn at different scales shown to the left of the plot. Path length of the UV flow cell is 0.2 cm. (e) ECIA screening of single-site mutants of DIP-α and Dpr10 with modified homophilic and heterophilic affinities. See main text for descriptions of the red, green and orange boxes.
Figure 6—figure supplement 1
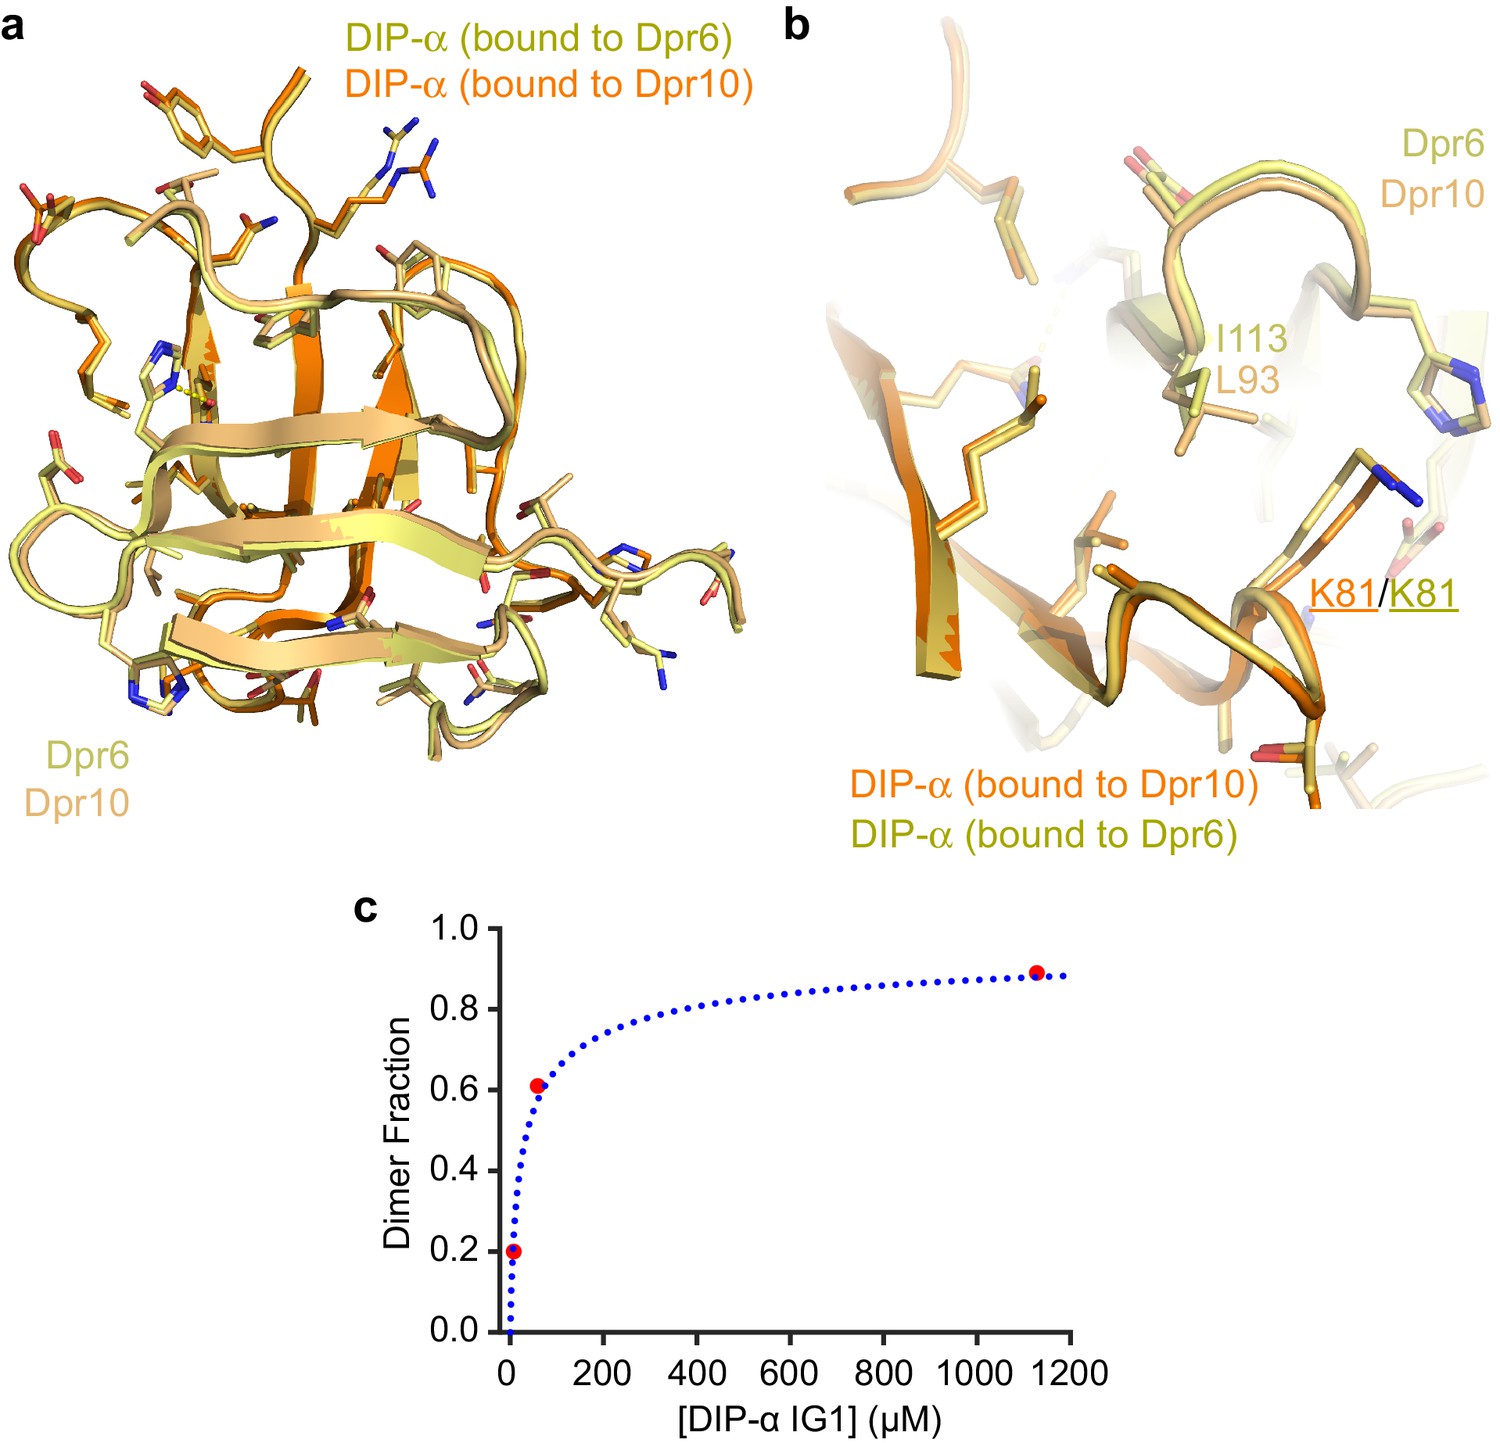
Structural comparison of Dpr6–DIP-α and Dpr10–DIP-α heterodimeric complexes.
(a) The structures of the GFCC’C’ sheets of the two heterodimers show highly similar main and side chain conformations. (b) Dpr6 to Dpr10 sequence differences have minor effects at the interface. I113 (Dpr6) vs L93 (Dpr10) causes small movements in DIP-α, mostly in side chain conformations, such as that of K81. (c) The effects of DIP-α concentration on its oligomeric state plotted, which can be fit to a binding isotherm accounting for homodimerization. KD is 37 µM. See Figure 5—figure supplement 1 for details on how the dimer fraction and protein concentrations were plotted.
Figure 6—figure supplement 2
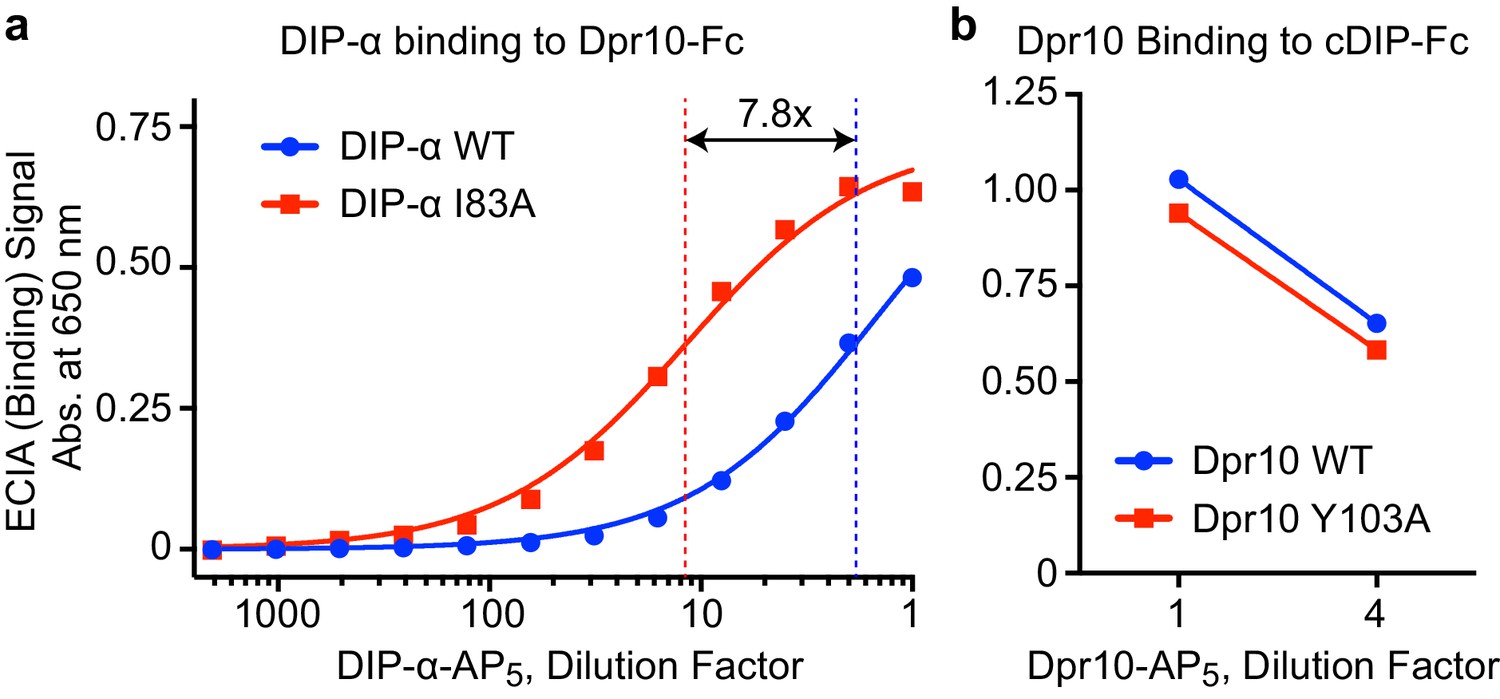
Interactions of DIP-αI83A and Dpr10Y103A.
(a) ECIA dilution series of wild-type (WT) DIP-α ectodomain and the DIP-αI83A mutant show stronger Dpr10 binding for the I83A mutant compared to WT, likely as a result of the abolition of the competing DIP-α homodimerization in the mutant. The blue and red fits are for 1:1 Langmuir binding models. The KD for the mutant I83A (red) is 7.8 times lower. The concentrations of WT and mutant DIP-α were normalized before the assay by western blotting for a C-terminal hexahistidine tag. (b) Dpr10 WT and the Y103A mutant bind cDIP with similar efficiency, as assessed by ECIA. The concentrations of WT and mutant Dpr10 were normalized.
Figure 7 with 1 supplement

DIP-α–DIP-α interactions are required for proper MNISN-1s innervation of m4.
(a) DIP-α is expressed in MNISN-1s (green) neurons. The DIP-α-GAL4 allows for utilization of the UAS/GAL4 system and this gene trap is also a null allele (Ashley et al., 2019). In DIP-α-GAL4 heterozygous (het) larvae, both 1b (arrowhead) and 1 s (arrow) terminals are present on m4. (b) Removal of DIP-α results in loss of MNISN-1s innervation of m4. The MNISN-1s axon is still visible (green) and continues to innervate other dorsal muscles. These hemizygous male larvae retain GAL4 expression under the control of the endogenous DIP-α promoter. (c) Overexpression of UAS-DIP-α-Myc (shortened to UAS-DIP-α) does not affect innervation of m4 in a heterozygous DIP-α-GAL4 background. DIP-α localizes to the 1 s terminals (green in inset; Ashley et al., 2019). Note that DIP-α protein is labeled with anti-Myc. Green signal on muscles represents non-specific labeling of anti-Myc (see Figure 7—figure supplement 1e). (d) The DIP-α loss-of-function phenotype is rescued by reintroducing a UAS-DIP-α transgene in cells that normally express DIP-α. (e) UAS-DIP-αI83A expression does not alter innervation of m4 and DIP-αI83A localizes normally within the 1 s terminals (inset). (f) Expression of UAS-DIP-αI83A fails to rescue the DIP-α loss-of-function phenotype (no 1 s innervation of m4). (g) Quantification of 1 s innervation of m4. Heterozygous background contains a single wild-type copy of DIP-α, while the hemizygous background only contains the loss-of-function allele. Expression of UAS-DIP-α completely rescues the loss-of-function phenotype, while expression of the UAS-DIP-αI83A does not. Control UAS transgene background (no GAL4) does not affect m4 innervation. n: See Figure 7—source data 1. ***p<0.0001. Calibration bar, 10 μm.
-
Figure 7—source data 1
Source data for Figure 7—figure supplement 1a, b and f.
- https://doi.org/10.7554/eLife.41028.021
-
Figure 7—source data 2
Source data for Figure 7g.
- https://doi.org/10.7554/eLife.41028.022
Figure 7—figure supplement 1
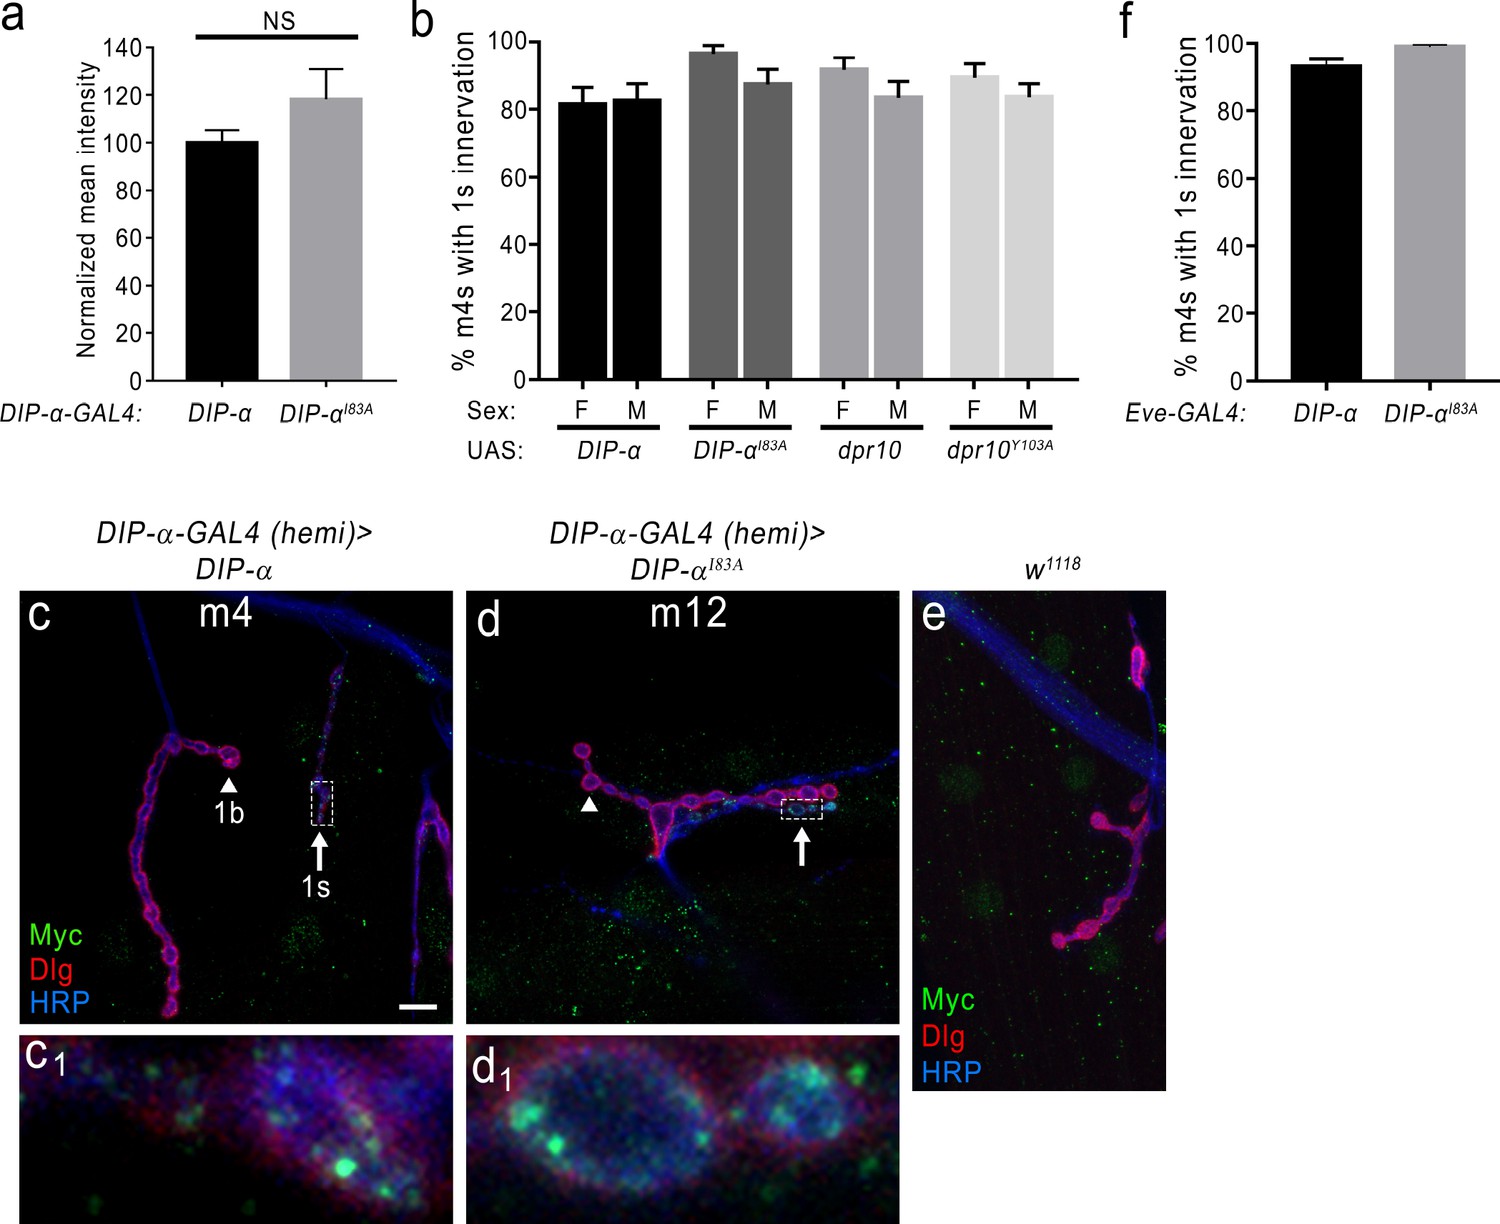
Loss of DIP-α homophilic interactions does not affect expression or localization of DIP-αI83A and innervation of m4 is not a sex-dependent variable.
(a) Normalized mean intensity of overexpressed UAS-DIP-α and UAS-DIP-αI83A in motor neuron terminals that normally express DIP-α (see Materials and methods). (b) Quantification of 1 s innervation of m4 in male vs female larvae in each of the control transgene genotypes (UAS line crossed to a w1118). Note that there is no statistical difference between males and females. (c) Rescue of the DIP-α loss-of-function phenotype by introducing a UAS-DIP-α (fused to Myc) in cells that normally express DIP-α. In c1), DIP-α (green) properly localizes to the 1 s NMJ at m4. (d) Expression of UAS-DIP-αI83A fails to rescue the DIP-α loss-of-function phenotype at m4 but DIP-αI83A localizes normally at other 1 s synapses such as those on m12 (d1). (e) Labeling with anti-Myc antibody in a control w1118 preparation reveals background cross-reactivity of this antibody. (f) Quantification of 1 s innervation of m4 in flies either expressing UAS-DIP-α or UAS-DIP-αI83A under the control of EveRN2-GAL4 (a GAL4 driver that expresses in the MNISN-1s neurons). Error bars represent S.E.M. n: See Figure 7—source data 1. Also see Figure 7.
Figure 8 with 1 supplement

DIP-α is required for the loss of MNISN-1s innervation of m4 when overexpressing Dpr10 postsynaptically.
(a) Loss of MNISN-1s innervation of m4 due to overexpression of UAS-dpr10-V5 (referred to in the figure as UAS-dpr10) in muscles with the Mef2-GAL4 driver. Dpr10 is localized specifically to the postsynaptic membrane (green) and co-localizes with Dlg, a postsynaptic membrane marker (red). Anti-HRP (blue) labels all neuronal membrane. (a1) and (a2) show the individual Dpr10 and Dlg channels, respectively. Note that only 1b terminals are present. Also, the Dpr10 protein is labeled with anti-V5. (b) Muscle overexpression of a Dpr10 variant (UAS-dpr10Y103A) that is incapable of binding DIP-α does not affect m4 innervation. Both 1b and 1 s (arrow) terminals are present on m4. The 1b and 1 s terminals are easily distinguished by size and staining intensity of Dlg (b2) (see Materials and methods). (c) Quantification of 1 s innervation of m4. Overexpression of wild type UAS-dpr10 transgene results in 25% of m4s innervated by MNISN-1s compared to 89% innervation when overexpressing UAS-dpr10Y103A which is unable to bind DIP-α. n: See Figure 8—source data 1. ***p<0.0001. Calibration bar, 10 μm.
-
Figure 8—source data 1
Source data for Figure 8c.
- https://doi.org/10.7554/eLife.41028.025
-
Figure 8—source data 2
Source data for Figure 8—figure supplement 1.
- https://doi.org/10.7554/eLife.41028.026
Figure 8—figure supplement 1
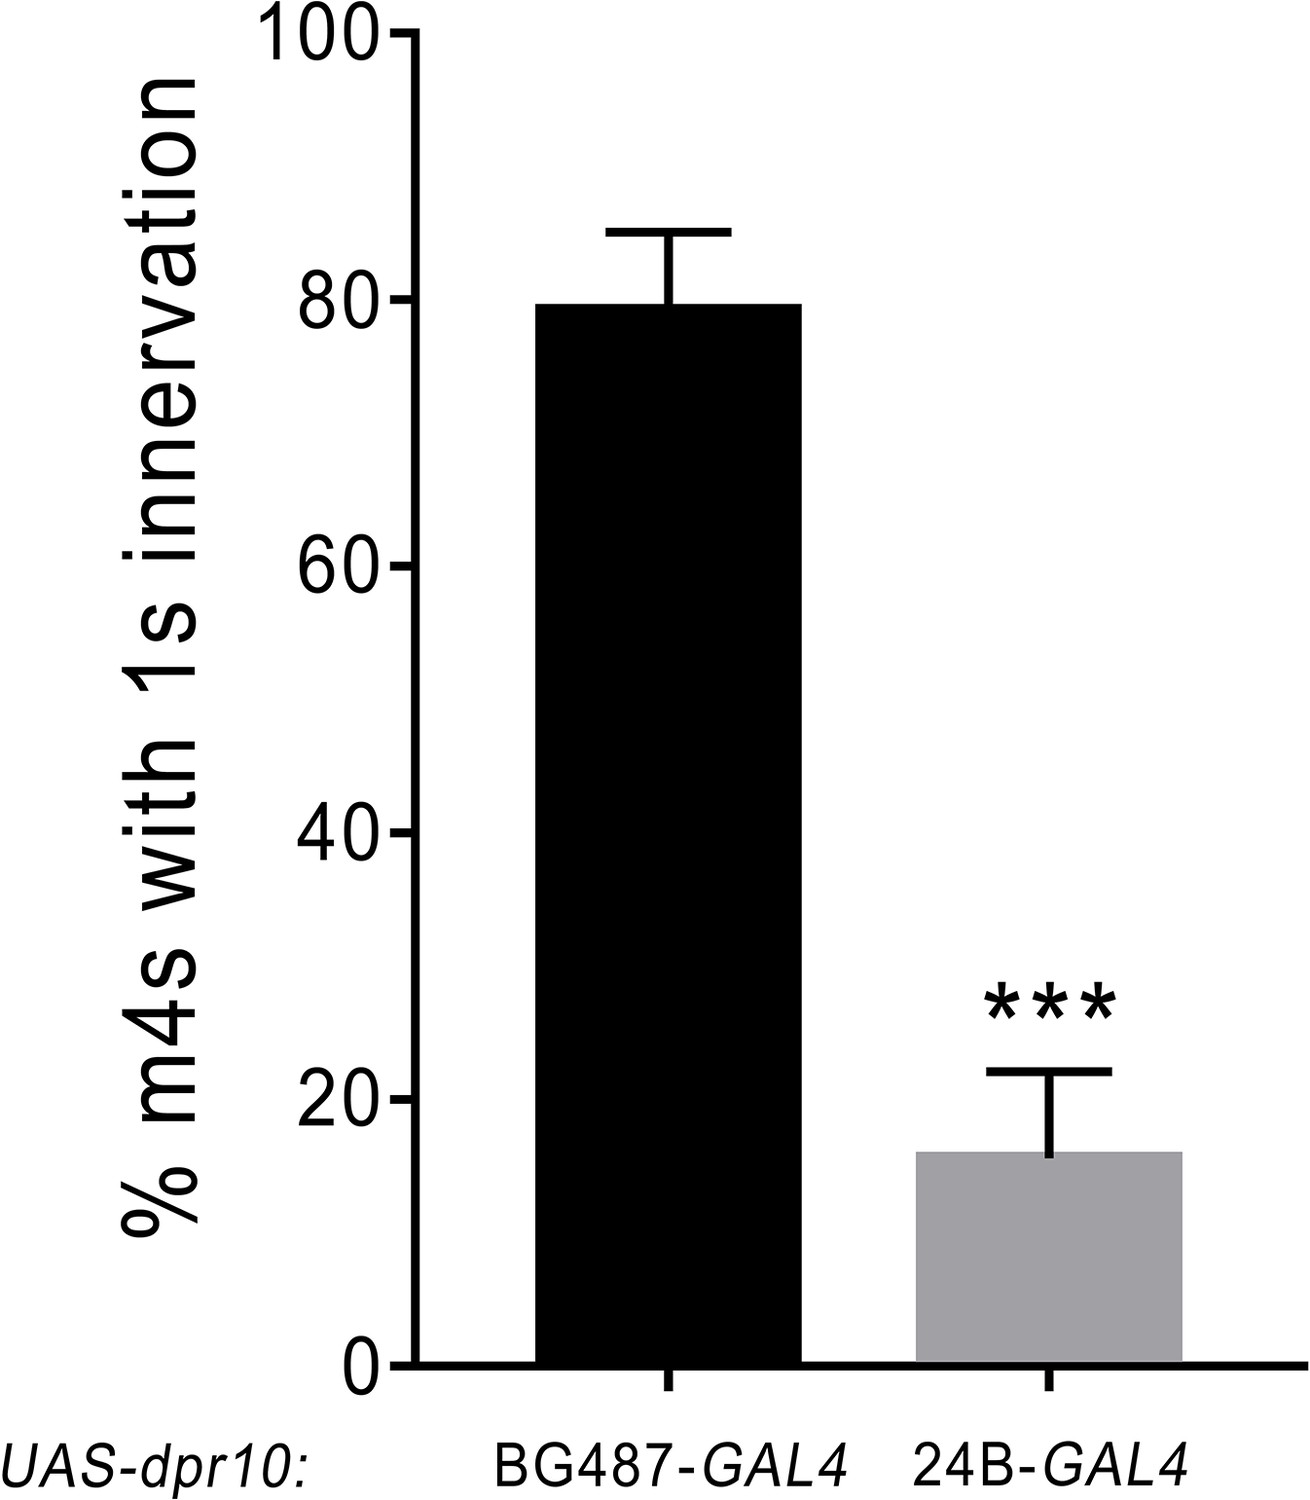
Weak and strong GAL4 expression of the UAS-dpr10 transgene.
Low level expression of UAS-dpr10 with BG487-GAL4 shows approximately wildtype levels of m4 innervation; however high level expression of UAS-dpr10 with 24B-GAL4 shows a similar phenotype to another strong muscle driver, Mef2-GAL4. See also Figure 8. n: See Figure 8—source data 2.
Author response image 1

Tables
Table 1
Data and refinement statistics for x-ray crystallography of Dpr–DIP-η and Dpr11–DIP-γ complexes, and DIP-γ alone.
https://doi.org/10.7554/eLife.41028.007| Dpr1 IG1 + DIP-η IG1 | Dpr11 IG1 + DIP-γ IG1-IG2 | DIP-γ IG1-IG2 | ||||
|---|---|---|---|---|---|---|
| Data collection | ||||||
| Space Group | P43212 | P43212 | P21 | |||
| Cell Dimensions | ||||||
| a, b, c (Å) | 74.08, 74.08, 235.45 | 85.36, 85.36, 103.58 | 29.33, 43.44, 86.14 | |||
| α, β, γ (°) | 90, 90, 90 | 90, 90, 90 | 90, 90.46, 90 | |||
| Resolution (Å) | 50–2.40 (2.44–2.40)* | 50–2.50 (2.65–2.50) | 50–1.85 (1.90–1.85) | |||
| Rsym (%) | 14.0 (66.4) | 16.1 (181.8) | 14.6 (71.6) | |||
| <I > /<σ(I)> | 22 (1.8) | 16.5 (1.2) | 8.8 (1.6) | |||
| CC1/2 | (77.0)† | 99.8 (57.7) | 99.6 (82.8) | |||
| Completeness (%) | 93.4 (55.7) | 99.7 (98.1) | 99.9 (99.8) | |||
| Redundancy | 13.6 (4.7) | 13.3 (8.6) | 6.4 (3.8) | |||
| Refinement | ||||||
| Resolution (Å) | 50–2.40 (2.49–2.40)* | 50–2.50 (2.69–2.50) | 50–1.85 (1.95–1.85) | |||
| Reflections | 25,031 | 13,767 | 18,695 | |||
| Rcryst (%) | 21.22 (31.41) | 20.88 (29.94) | 20.45 (25.71) | |||
| Rfree (%)‡ | 24.44 (34.15) | 26.29 (35.07) | 23.46 (30.55) | |||
| Number of atoms | ||||||
| Protein | 3403 | 2312 | 1622 | |||
| Ligand/Glycans | 192 | 81 | 38 | |||
| Water | 84 | 69 | 179 | |||
| Average B-factors (Å2) | ||||||
| All | 55.1 | 56.4 | 32.8 | |||
| Protein | 53.7 | 55.7 | 31.5 | |||
| Ligand/Glycans | 84.3 | 83.4 | 60.0 | |||
| Solvent | 46.3 | 47.3 | 38.6 | |||
| R.m.s. deviations from ideality | ||||||
| Bond Lengths (Å) | 0.004 | 0.005 | 0.008 | |||
| Bond Angles (°) | 0.995 | 0.741 | 0.956 | |||
| Ramachandran statistics | ||||||
| Favored (%) | 95.91 | 96.88 | 98.53 | |||
| Outliers (%) | 0.0 | 0.0 | 0.0 | |||
| Rotamer Outliers (%) | 0.0 | 0.0 | 0.0 | |||
| All-atom Clashscore § | 5.48 | 5.64 | 6.60 | |||
| Coordinate Error ¶ (Å) | 0.30 | 0.41 | 0.21 | |||
-
*The values in parentheses are for reflections in the highest resolution bin.
†Data processed by HKL2000, which does not report CC1/2 for the entire resolution range of the data.
-
‡5% of reflections was not used during refinement for cross-validation: 1247, 707 and 933 reflections for the Dpr1–DIP-η, Dpr11–DIP-γ, and DIP-γ-only structures, respectively.
§As reported by Molprobity.
-
¶ Maximum-likelihood estimate for coordinate error, reported by phenix.refine.
Table 2
Data and refinement statistics for x-ray crystallography of DIP-η–DIP-η and Dpr10–DIP-α complexes.
https://doi.org/10.7554/eLife.41028.015| DIP-η IG1 + DIP-η IG1 | Dpr10 IG1 + DIP-α IG1 | |
|---|---|---|
| Data collection | ||
| Space Group | C2 | P1 |
| Cell Dimensions | ||
| a, b, c (Å) | 88.43, 67.13, 61.01 | 51.01, 53.55, 56.69 |
| α, β, γ (°) | 90, 128.82, 90 | 119.68, 103.77, 92.88 |
| Resolution (Å) | 50–1.90 (1.94–1.90)* | 50–1.80 (1.91–1.80) |
| Rsym (%) | 4.1 (55.9) | 3.3 (51.5) |
| <I > /<σ(I)> | 12.3 (2.0) | 11.8 (1.3) |
| CC1/2 | 99.8 (90.1) | 99.9 (67.0) |
| Completeness (%) | 98.3 (93.3) | 86.8 (53.8) |
| Redundancy | 3.4 (3.3) | 1.8 (1.7) |
| Refinement | ||
| Resolution (Å) | 50–1.90 (1.98–1.90)* | 50–1.80 (1.84–1.80) |
| Reflections | 21,783 | 40,105 |
| Rcryst (%) | 23.21 (37.57) | 17.43 (39.51) |
| Rfree (%)† | 26.93 (45.88) | 20.54 (53.17) |
| Number of atoms | ||
| Protein | 1690 | 3421 |
| Ligand/Glycans | 40 | 282 |
| Water | 21 | 296 |
| Average B-factors (Å2) | ||
| All | 68.2 | 42.8 |
| Protein | 67.9 | 41.2 |
| Ligand/Glycans | 86.4 | 58.5 |
| Solvent | 55.2 | 46.1 |
| R.m.s. deviations from ideality | ||
| Bond Lengths (Å) | 0.003 | 0.008 |
| Bond Angles (°) | 0.636 | 0.938 |
| Ramachandran statistics | ||
| Favored (%) | 97.60 | 97.85 |
| Outliers (%) | 0.0 | 0.0 |
| Rotamer Outliers (%) | 1.04 | 0.53 |
| All-atom Clashscore ‡ | 1.44 | 3.59 |
| Coordinate Error § (Å) | 0.16 | 0.23 |
-
*The values in parentheses are for reflections in the highest resolution bin.
†5% of reflections was not used during refinement for cross validation: 1247 and 2002 reflections for the DIP-η–DIP-η and Dpr10–DIP-α structures, respectively.
-
‡As reported by Molprobity.
§Maximum-likelihood estimate for coordinate error, reported by phenix.refine.
Additional files
-
Transparent reporting form
- https://doi.org/10.7554/eLife.41028.029
Download links
A two-part list of links to download the article, or parts of the article, in various formats.
Downloads (link to download the article as PDF)
Open citations (links to open the citations from this article in various online reference manager services)
Cite this article (links to download the citations from this article in formats compatible with various reference manager tools)
Molecular basis of synaptic specificity by immunoglobulin superfamily receptors in Drosophila
eLife 8:e41028.
https://doi.org/10.7554/eLife.41028


