Drought adaptation in Arabidopsis thaliana by extensive genetic loss-of-function
- Colorado State University, United States
- HudsonAlpha Institute for Biotechnology, United States
Figures
Figure 1 with 1 supplement
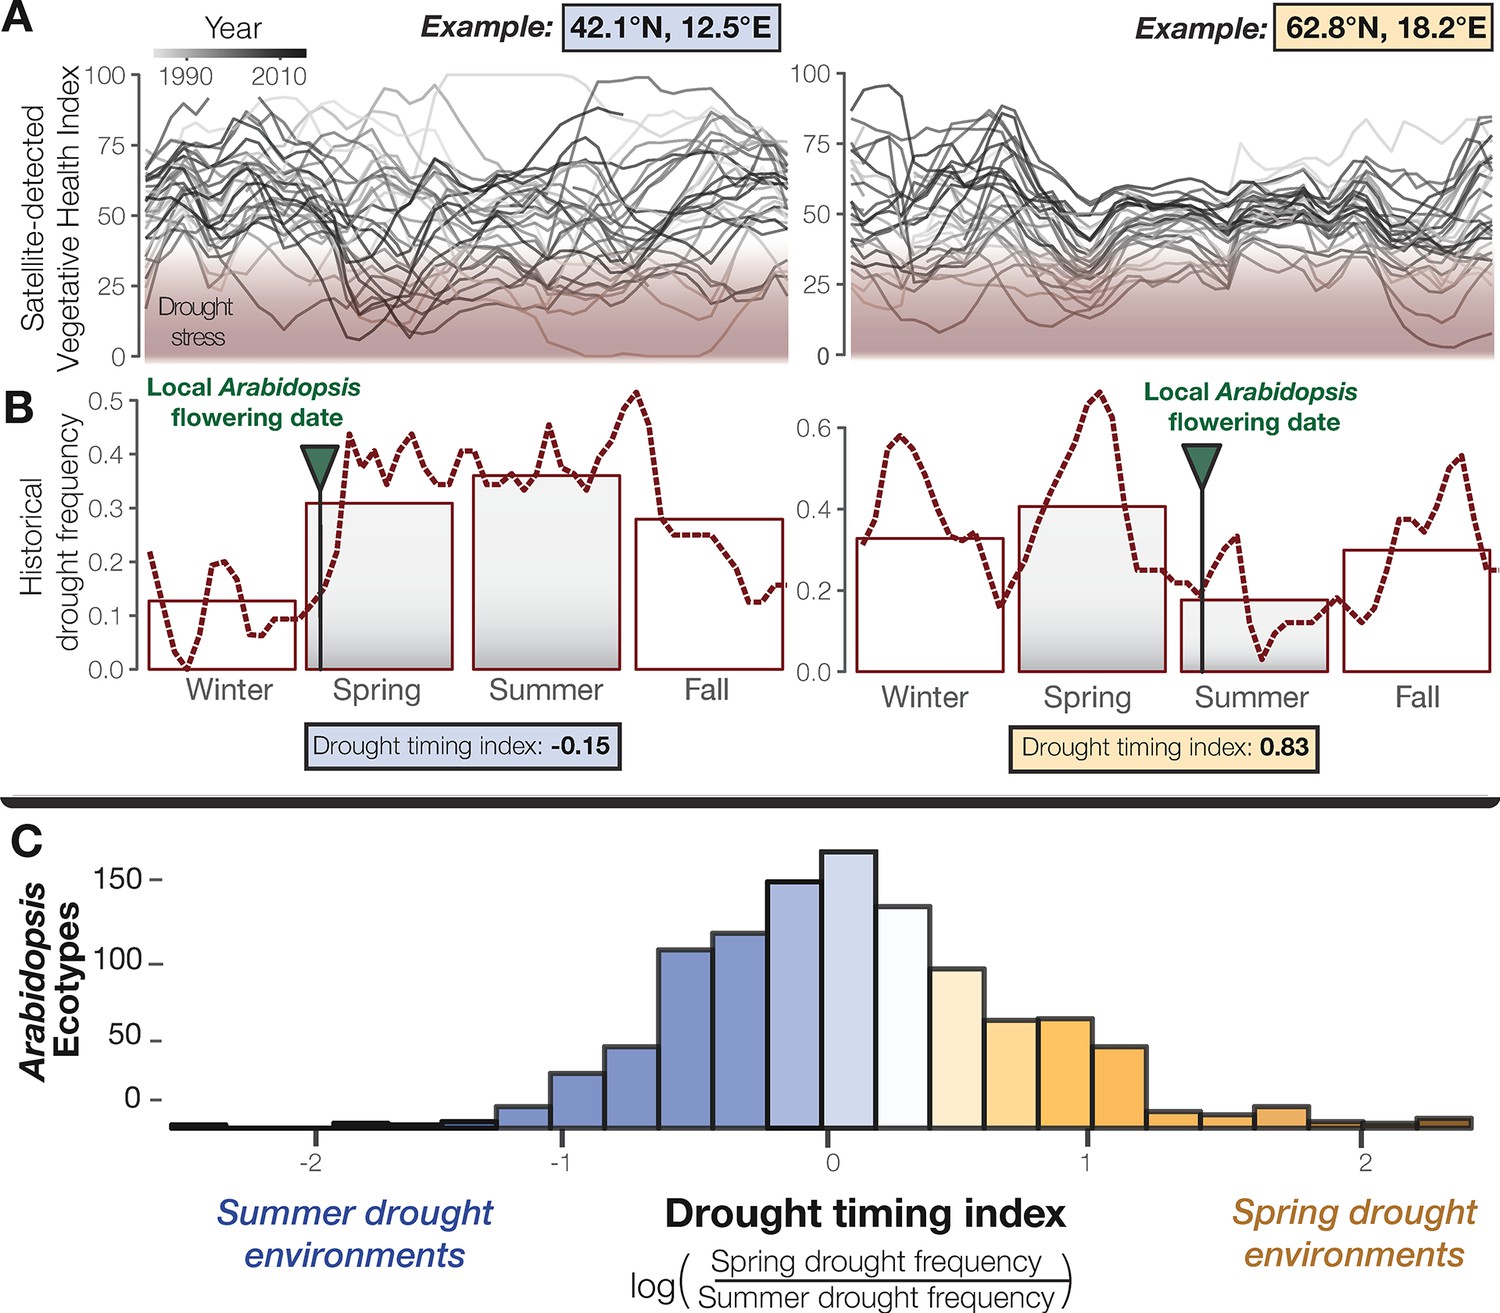
Seasonal drought timing varies across the Arabidopsis species range.
(A) Examples of home environments for two well-studied Arabidopsis ecotypes (Mojica et al., 2016) from Italy and Sweden, left and right plots respectively, showing historical drought conditions detected using the VHI and (B) drought frequency (VHI <40, NOAA drought classification) by week (line) and season (bars). Arrows mark locally observed flowering dates (Mojica et al., 2016) and gray bars highlight the typical reproductive growing season used to quantify a drought-timing index. (C) Variation in historical drought timing experienced at the home environments of Arabidopsis ecotypes across the species range (figure supplement). Large values indicate environments where spring droughts occur more frequently than summer drought (i.e. where the frequency of drought decreases over the course of the typical reproductive growing season) and vice versa.
Figure 1—figure supplement 1
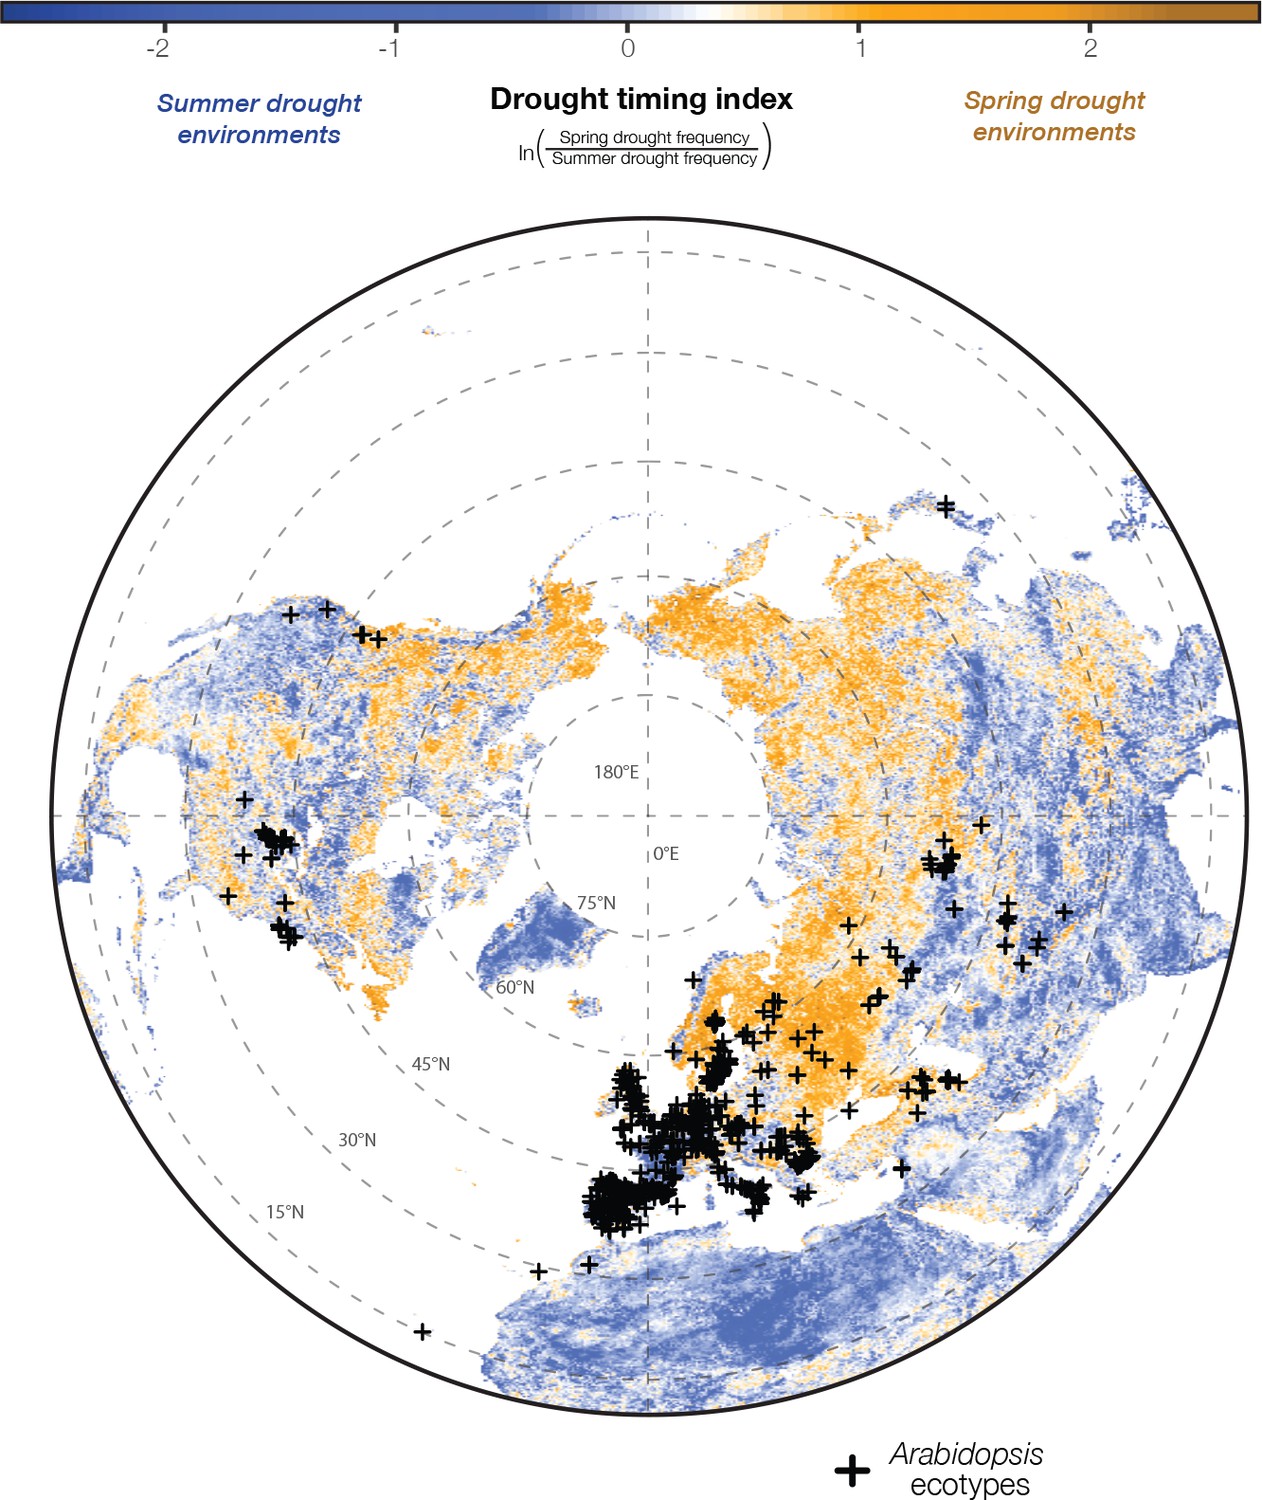
Arabidopsis ecotypes are distributed across satellite-detected drought timing gradients.
Historical patterns in drought conditions were calculated from the Vegetative Health Index (VHI, Figure 1A) and converted into a drought-timing index (Figure 1B and C). Large values of this index indicate environments where spring droughts occur more frequently than summer drought (i.e. where the frequency of drought decreases over the course of the reproductive growing season) and vice versa (seasonal drought frequency map data available at greymonroe.github.io/data).
Figure 2 with 3 supplements
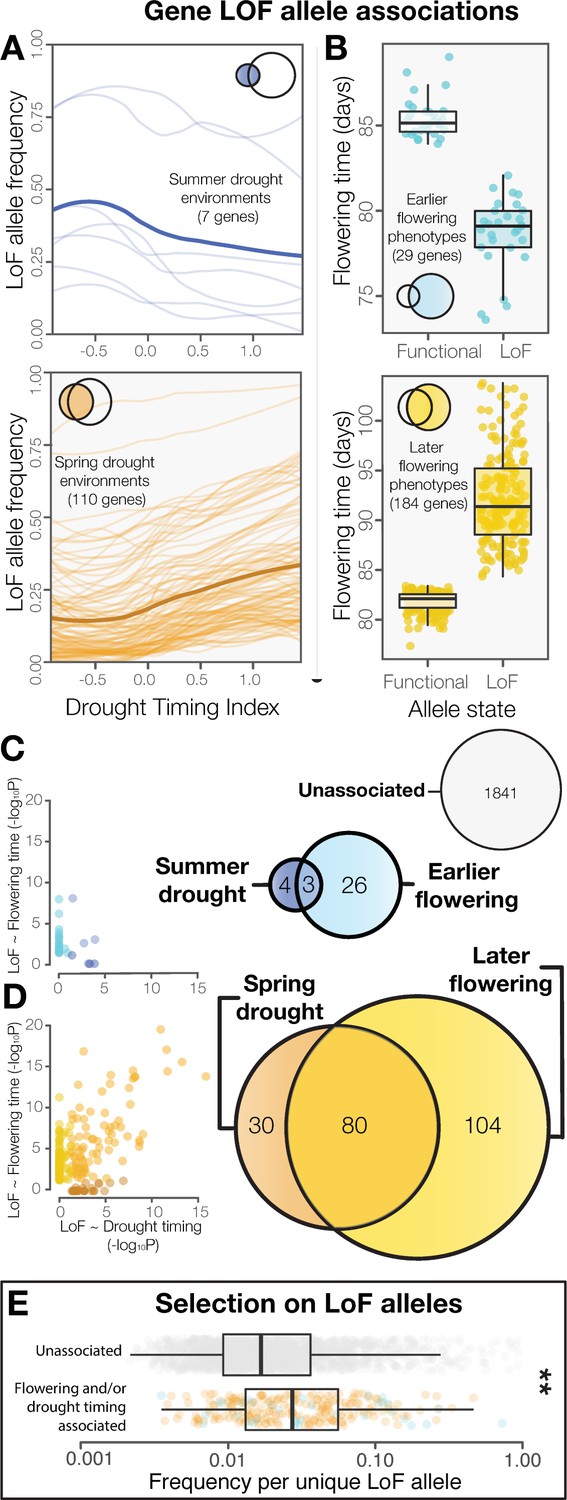
LoF alleles share associations between drought timing and flowering time, exhibit evidence of positive selection.
(A) Visualization of the frequency of LoF alleles across environments in genes associated to summer (upper) or spring drought environments (lower). Darker lines indicate the mean across genes. (B) Contrasting flowering times between ecotypes with functional versus LoF alleles in genes associated with earlier (upper) or later (lower) flowering time phenotypes. (C) Overlap and relationships between the strength of LoF allele associations in genes associated with summer drought and earlier flowering, and (D) spring drought and later flowering. (E) Increased frequencies of independent LoF alleles in genes associated with drought timing and/or flowering time compared to genes without detected associations (t-test, p = 3.4 × 10⁻⁷), a signature of recurrent mutation accompanied by positive selection (Pennings and Hermisson, 2006).
Figure 2—figure supplement 1
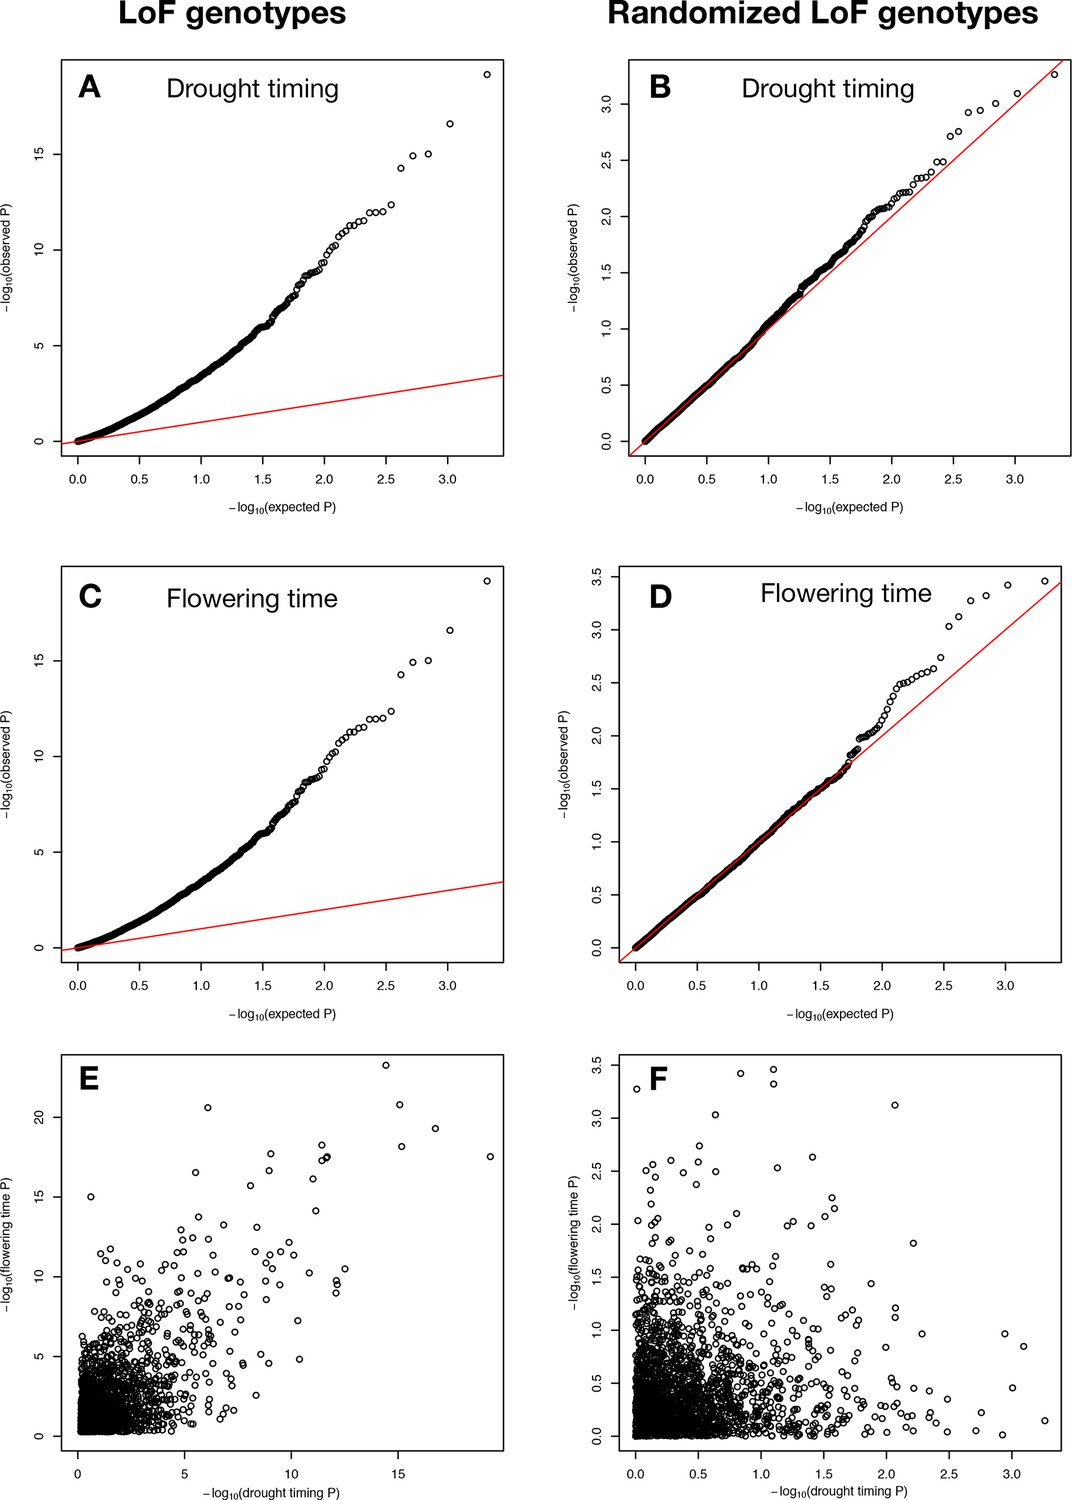
P values of LoF allele associations.
Observed vs. expected P values, created using GWASTools in R (Gogarten et al., 2012), for associations between drought timing and (A) LoF alleles observed in Arabidopsis ecotypes and (B) randomized LoF genotypes with the same allele frequencies. Observed vs. expected p values for associations between flowering time and (C) LoF alleles observed in Arabidopsis ecotypes and (D) randomized LoF genotypes with the same allele frequencies. Relationship between LoF allele associations with drought timing and flowering time for (E) actual (C ~ A, r2 = 0.48) and (F) randomized genes (D ~ B, r2 = 0.01). The P values shown have not yet been corrected for multiple testing and are log10 transformed. Red lines in A-D represent y = x line.
Figure 2—figure supplement 2
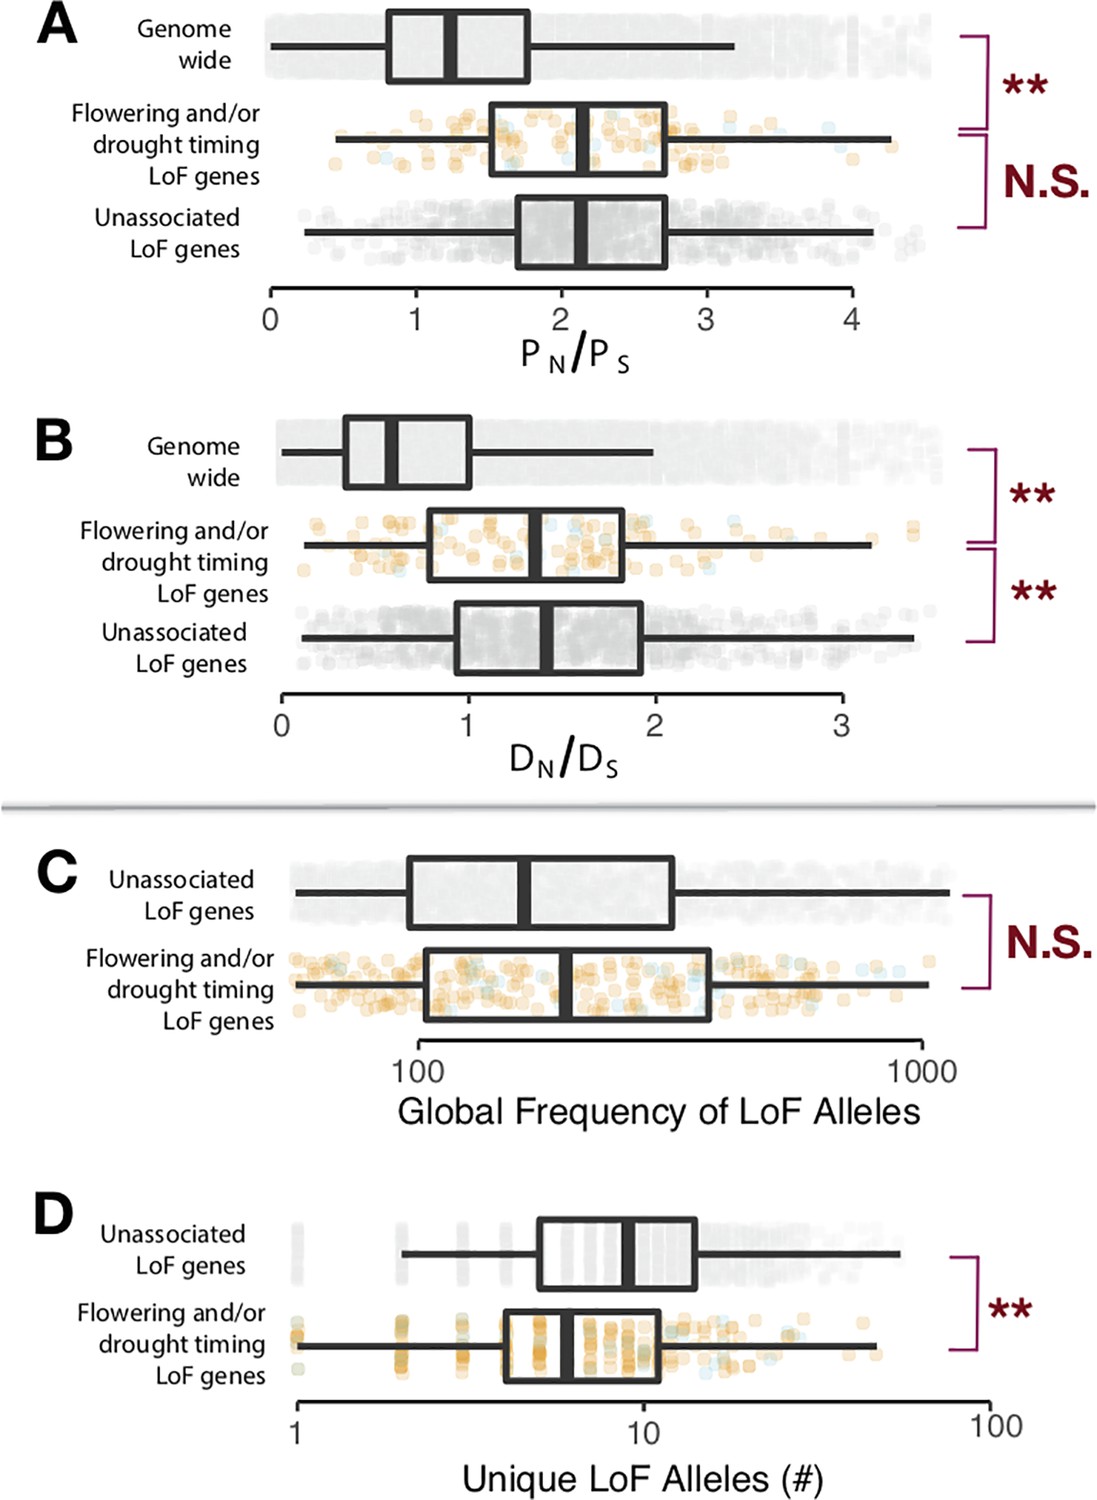
Signatures of selection on LoF genes identified differ from null expectations.
(A) Contrasts (t-test, α = 0.05) between genes identified with LoF alleles associated to drought timing and/or flowering time (colors correspond to Figure 2C and D, boxplots visualized at ±1.5 times the data interquartile range) and the genomic background (light gray), as well as genes having LoF alleles but without observed associations (dark gray) for the ratio of non-synonymous (PN) and synonymous polymorphisms (PS) among A. thaliana ecotypes and (B) the ratio of non-synonymous (DN) and synonymous divergence (DS) from A. lyrata. (C) Contrasts (t-test, α = 0.05) between (log10) global frequency of LoF alleles in genes identified with LoF alleles associated to drought timing and/or flowering time and genes with LoF alleles but without observed associations for the global frequency of LoF alleles and (D) the number of (log10) unique LoF alleles. The corresponding average frequencies of unique LoF alleles for genes are shown in Figure 2E.
Figure 2—figure supplement 3
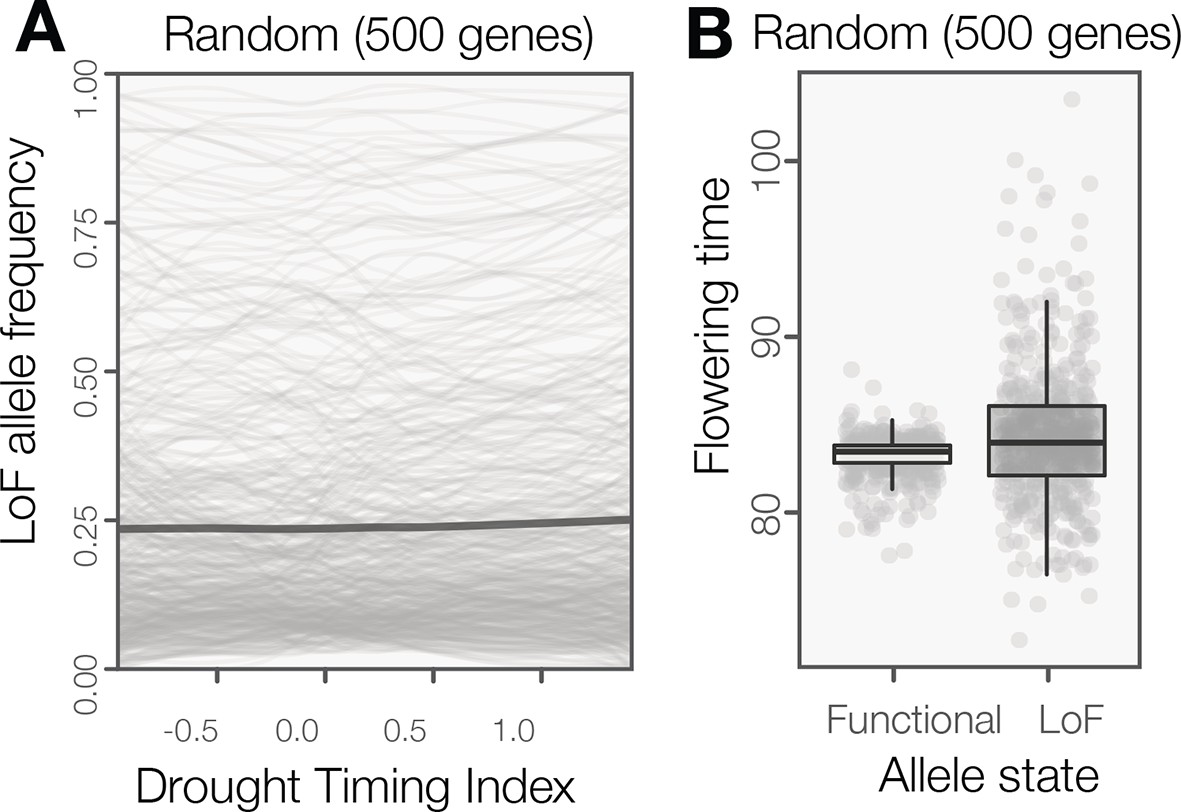
LoF alleles are not broadly overabundant in Arabidopsis ecotypes originating from spring drought environments or flowering later.
(A) The frequency of LoF alleles across environments (sliding window plot) in random genes. The darker line indicates the mean across genes. The distribution of LoF alleles in these random genes contrasts with LoF alleles in genes associated to drought timing, which are overwhelming associated to spring drought environments (Figure 2A) (B) Flowering times compared between ecotypes with functional versus LoF alleles in random genes. The phenotypic differences predicted by these random genes contrasts with LoF alleles in those associated to flowering time, which are overwhelming associated to later flowering time (Figure 2B).
Figure 3
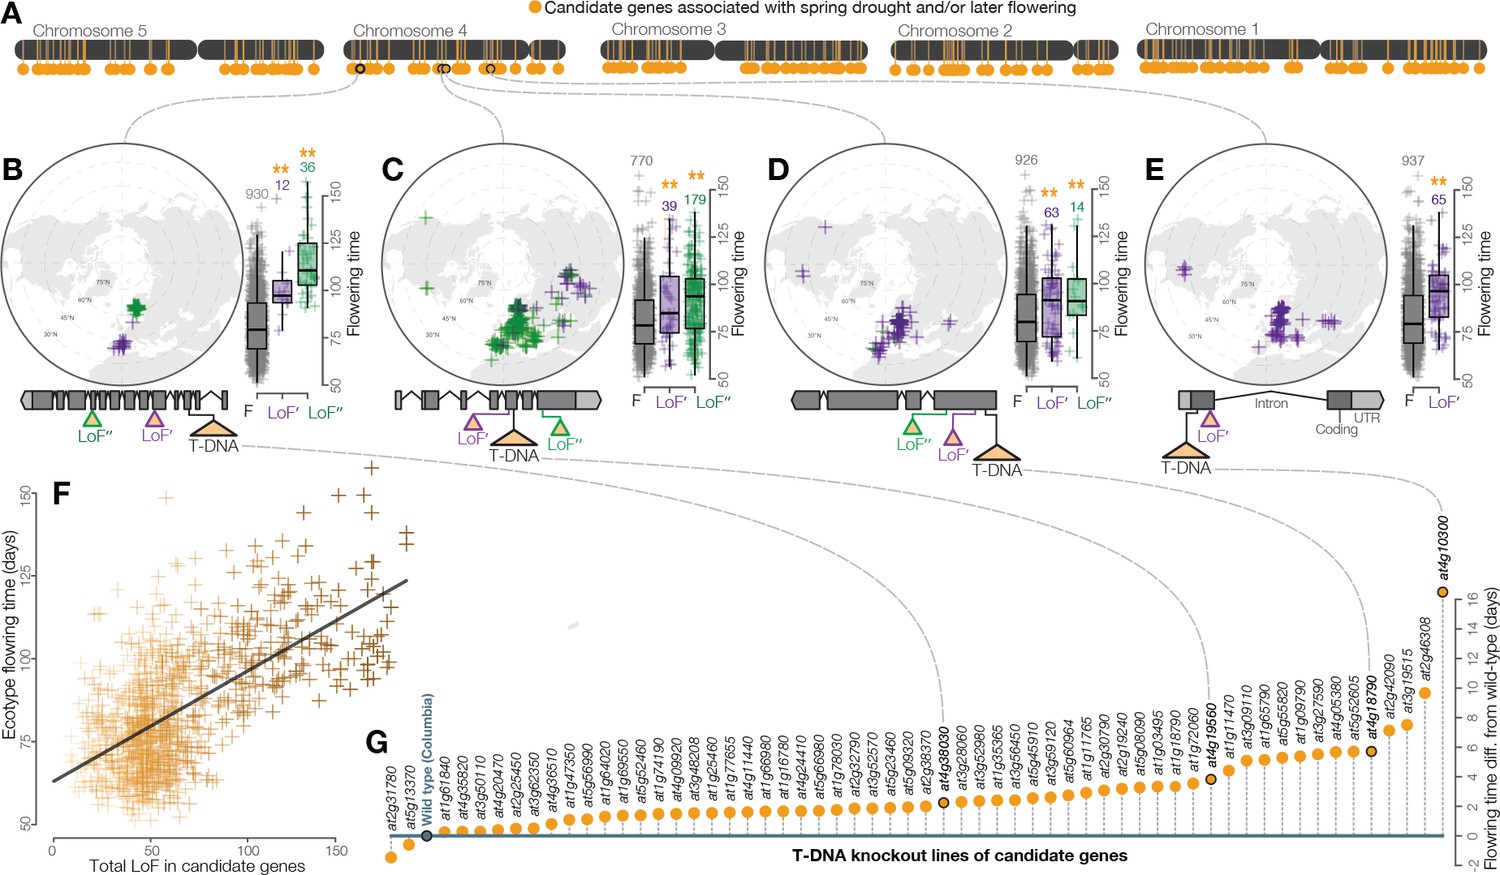
Widespread LoF contributing to later flowering time evolution.
(A) Genomic map of 214 candidate genes with associations between LoF alleles and spring drought environments and/or later flowering time phenotypes. (B–E) Examples of the geography and flowering times among Arabidopsis ecotypes of LoF alleles in candidate genes including; (B) a previously unstudied rhamnogalacturonate lyase, (C) a cyclin linked to later flowering in prior knockout experiments (Cui et al., 2007), (D) members of the drought-responsive Nramp2 (Qin et al., 2017) (E) and RmlC-like cupin (Aghdasi et al., 2012) protein families. (F) Later flowering time in ecotypes predicted by the accumulation of LoF alleles across all candidate genes. The line shows the best fitting model. Color scale of points reflects proportion of total LoF in ecotypes that are candidate genes (darker points = greater proportion) (G) Experimental validation of hypothesized later flowering time in T-DNA knockout lines of candidate genes compared to the wild type genotype.
Additional files
-
Source data 1
Raw flowering time measurements for of wild-type genomic background and T-DNA knockout lines.
- https://doi.org/10.7554/eLife.41038.010
-
Supplementary file 1
Arabidopsis ecotypes examined.
Includes ecotype identifiers as well as latitude and longitude of origin, seasonal drought frequencies (winter, spring, summer, fall), drought timing index (drought_timing), flowering time (FT10), and minimum temperature (BIO6).
- https://doi.org/10.7554/eLife.41038.011
-
Supplementary file 2
Multiple linear regression model summaries.
(A) Flowering time predicted by seasonal drought frequencies. Arabidopsis common garden flowering times were predicted by historic drought frequencies (DF) during different seasons at ecotypes’ location of origin using multiple linear regression. (B) The strength of association between LoF alleles and flowering time (-log10 transformed P values) predicted by the strength of LoF alleles with drought timing, latitude, and minimum temperature.
- https://doi.org/10.7554/eLife.41038.012
-
Supplementary file 3
Genes.
(A) Matrix of functional allele calls for 2088 genes among 1135 Arabidopsis ecotypes. LoF alleles are those with less than 90% predicted protein product and are classified with a ‘1’. Function alleles are classified with a ‘0’. (B) Associations between functional allele state and drought timing and flowering time for 2088 genes. Includes gene, estimate for logistic regression model testing the association between functional allele state and drought timing (Drought_timing_B) and flowering time (flw_10_B) after accounting for population structure, and the P-value of these estimates before Bonferroni correction for multiple testing (Drought_timing_p and flw_10_p). These values are also reported for LoF associations with latitude (lat_B, lat_p) and minimum temperature (temp_B, temp_p). (C) Selection statistics for 2088 genes. Includes PN/PS (pnps), DN/DS (dnds), frequency, number of LoF alleles, and average frequency per LoF allele. (D). Survey of sample genes with previously identified LoF alleles. (E) LoF alleles identified in previously studied genes (those surveyed in Table D). (F) Flowering time in T-DNA knockout lines. Flowering time (lsmean and standard error) of wild-type genomic background and T-DNA knockout lines of a sample of candidate genes in which LoF alleles are associated with spring drought environments or later flowering time phenotypes in Arabidopsis ecotypes.
- https://doi.org/10.7554/eLife.41038.013
-
Transparent reporting form
- https://doi.org/10.7554/eLife.41038.014
Download links
A two-part list of links to download the article, or parts of the article, in various formats.
Downloads (link to download the article as PDF)
Open citations (links to open the citations from this article in various online reference manager services)
Cite this article (links to download the citations from this article in formats compatible with various reference manager tools)
Drought adaptation in Arabidopsis thaliana by extensive genetic loss-of-function
eLife 7:e41038.
https://doi.org/10.7554/eLife.41038


