Saccharomyces cerevisiae goes through distinct metabolic phases during its replicative lifespan
- University of Groningen, Netherlands
- University of Groningen, University Medical Centre Groningen, Netherlands
Figures
Figure 1
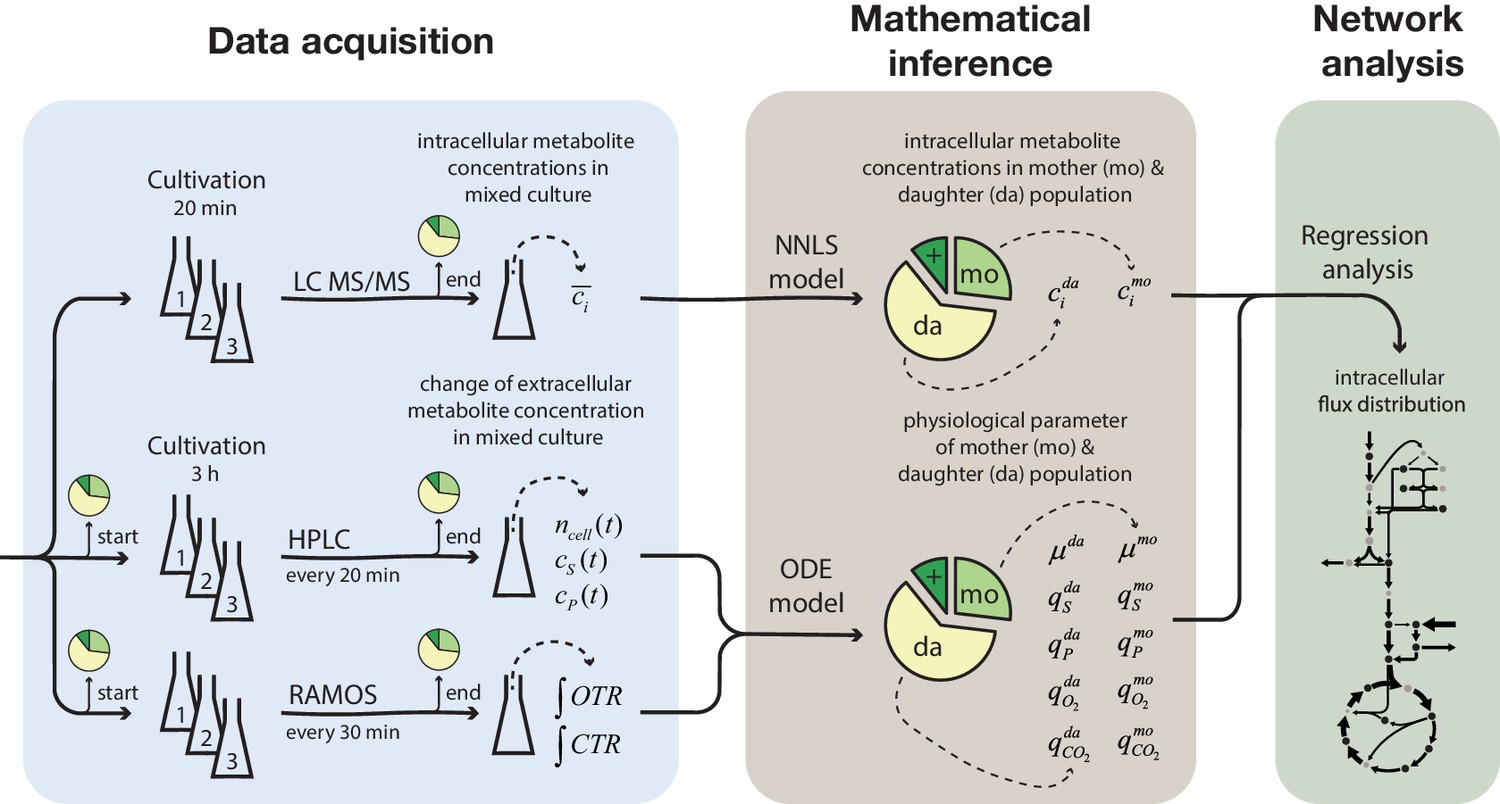
Overview of the experimental and model-based analyses to determine the metabolite levels, physiological parameters and intracellular metabolic fluxes of replicatively aging budding yeast.
Samples were harvested at various time points (corresponding to different cell ages) from a column-based cultivation system (Janssens et al., 2015), designed to enrich aged mother cells. The fractional abundance of mother, daughter and dead cells in each sample was determined by flow cytometry and a combined dye-staining with propidium iodide and avidin–FITC. Aliquots were used to determine the intracellular metabolite concentrations, c̄i, by LC-MS/MS and the cell count, ncell(t), by flow cytometry, extracellular metabolites (i.e. substrates and products), cS(t) and cP(t), by HPLC and the integral of oxygen and carbon transfer rates, OTR and CTR (i.e. total consumed oxygen and produced carbon dioxide) by a Respiration Activity Monitoring System (RAMOS), in the mixed population samples. Next, the age-dependent intracellular metabolite concentrations (ci) were inferred from the acquired population-average data using non-negative least square regression (NNLS) and the physiological parameters (growth (µ) and metabolite exchange rates (q)) of mother (mo) and daughter (da) cells) from an ordinary differential equation (ODE) model. The inferred physiological parameters and intracellular metabolite levels of aged mother cells were then analyzed using a combined stoichiometric-thermodynamic metabolic model and regression analysis to obtain the intracellular metabolic flux distribution.
Figure 2 with 12 supplements
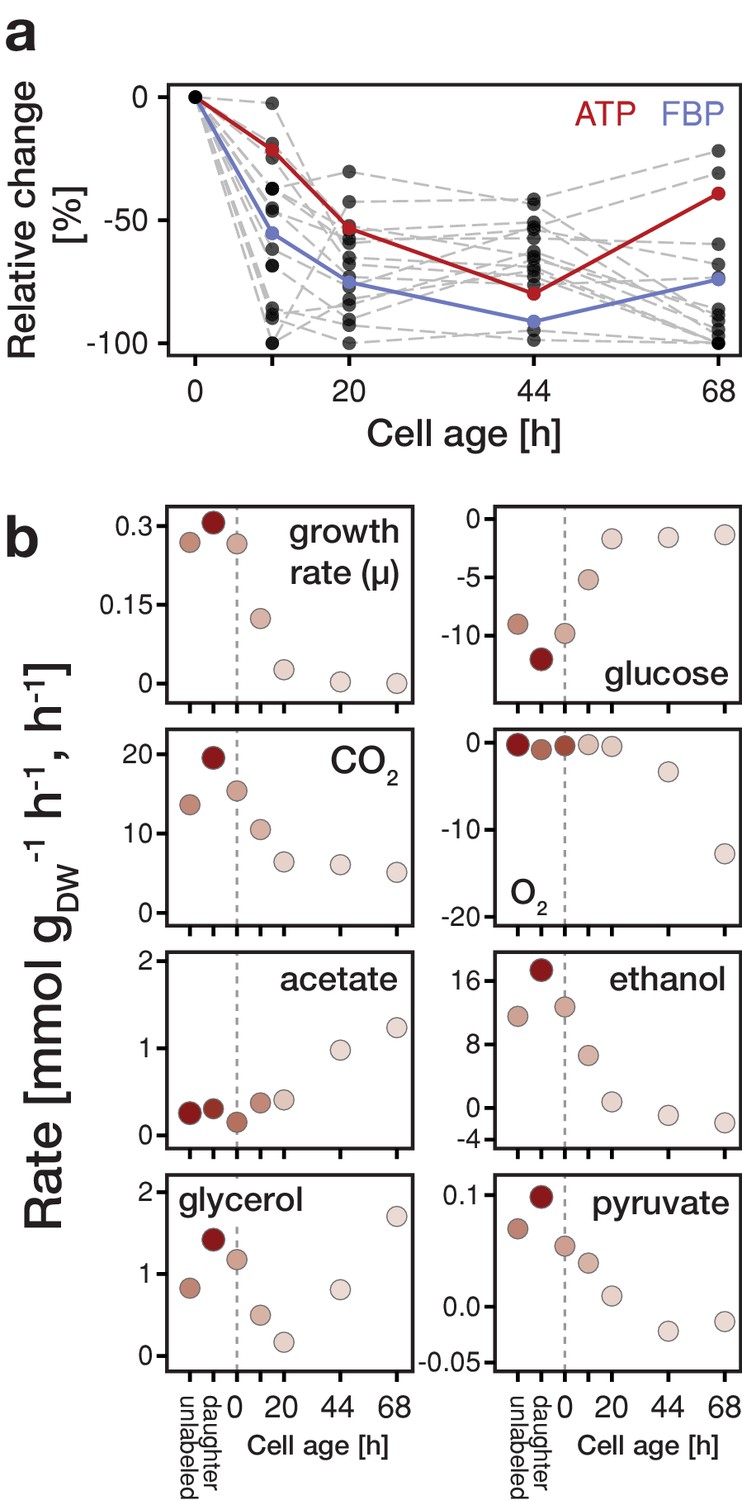
Changes in metabolite concentrations and physiological parameters during cellular aging.
(a) The intracellular metabolite concentrations of 18 metabolites at various cell ages were inferred from LC-MS/MS measurements, cell volume measurements and the fractional abundances of each cell population using non-linear least square regression. Grey dashed lines depict the change of intracellular metabolite concentrations relative to concentrations determined from streptavidin-labeled cells (i.e. young cells at an age of 0 hr). The change in ATP concentration is highlighted in red, and FBP (fructose-1,6-bisphosphate) in blue. Figure 2—figure supplement 4 shows the data for each metabolite in absolute units. Figure 2—source data 1 contains the data. (b) The growth (µ), metabolite uptake and production rates at various cell ages were obtained by measuring the evolution of cell count and extracellular metabolites (including produced carbon dioxide and consumed oxygen) and fitting the acquired data to an ordinary differential equation model. A positive value indicates metabolite production and a negative uptake. To assess the validity of the inference approach physiological rates were independently determined from unlabeled and streptavidin-labeled cell cultures (time point 0 hr), consisting of predominantly young cells. The shading reflects the inverse of the relative uncertainty of the estimation (i.e. values which are depicted with a higher transparency are more uncertain). Figure 2—source data 2 contains the data.
-
Figure 2—source data 1
Intracellular metabolite concentrations inferred for daughter and aging mother cells.
- https://doi.org/10.7554/eLife.41046.016
-
Figure 2—source data 2
Growth rates and yields inferred for daughter and aging mother cells.
- https://doi.org/10.7554/eLife.41046.017
Figure 2—figure supplement 1
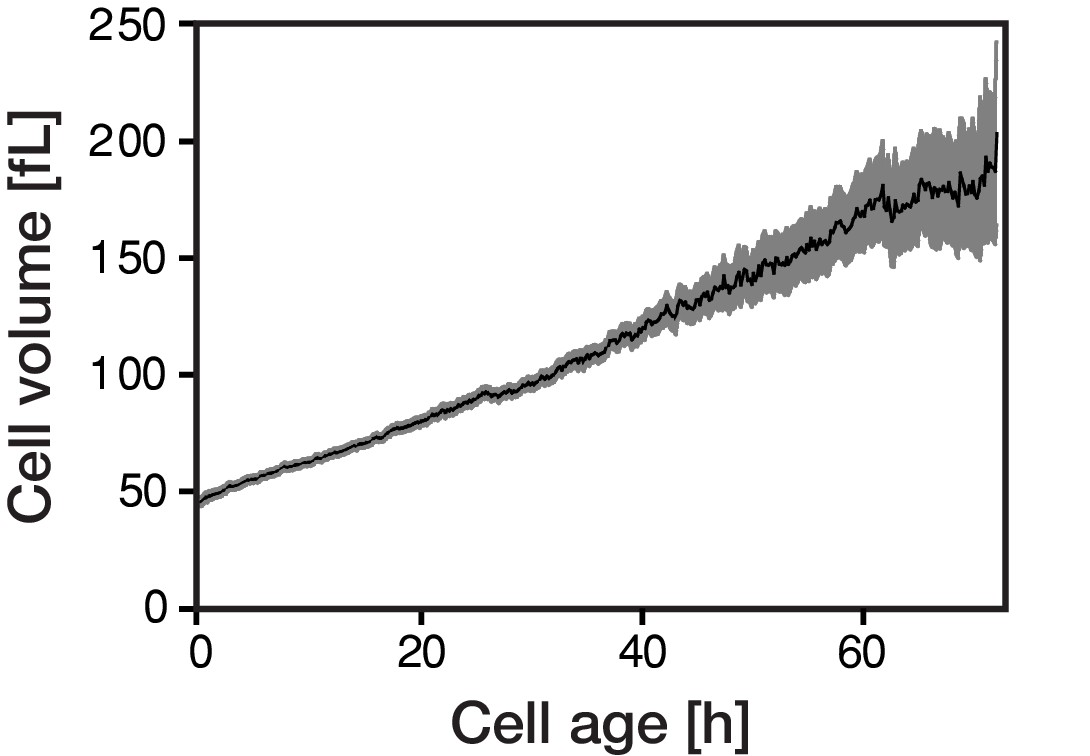
The cellular volume gradually increases with cellular age.
Individual cells of Saccharomyces cerevisiae were tracked in a microfluidics device (Huberts et al., 2013; Lee et al., 2012) and bright field images were recorded throughout their whole lifespan. The cellular volume was subsequently determined from the acquired microscopic data using the ImageJ plugin BudJ.
Figure 2—figure supplement 2
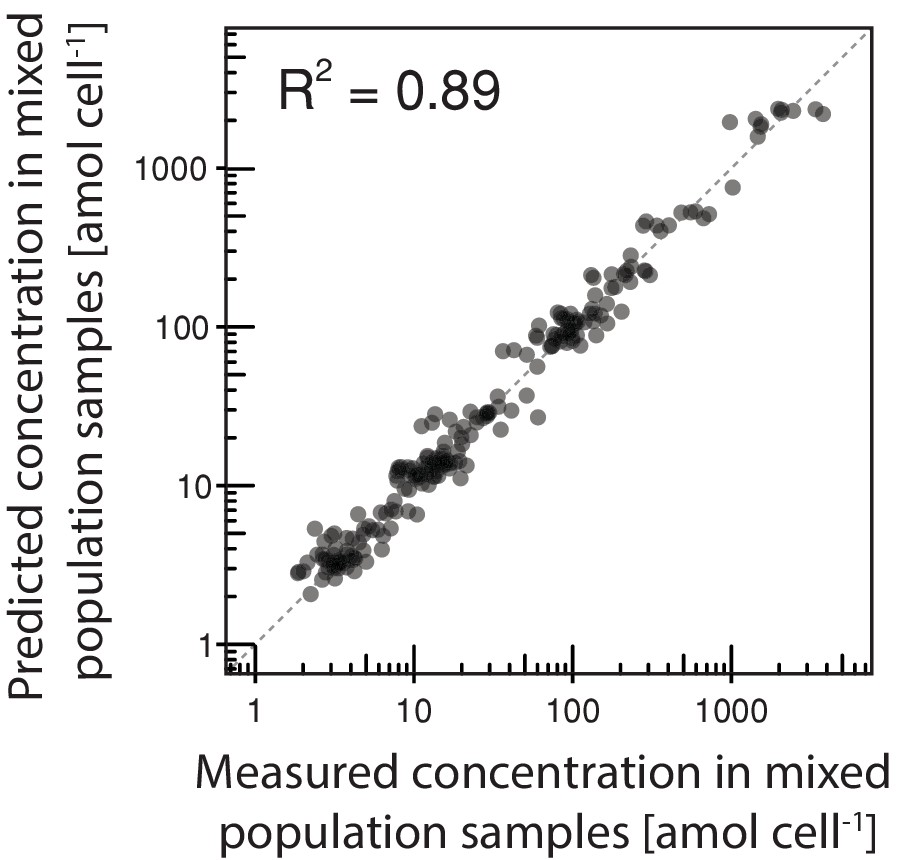
Inference of intracellular metabolite concentrations.
The intracellular concentration of 18 metabolites in daughter and aging mother cells was inferred from data obtained in various mixed population samples using non-negative least square regression where we obtained an excellent fit.
Figure 2—figure supplement 3

Comparison of inferred intracellular metabolite concentrations with independently determined concentrations of young cells.
To confirm the validity of inference method for intracellular metabolite concentrations, we determined the metabolite concentration of young streptavidin-labeled cells and compared them to the inferred metabolite concentrations of daughter cells, which, by definition, should have the same phenotype. Here, we found a good consensus, confirming our approach.
Figure 2—figure supplement 4
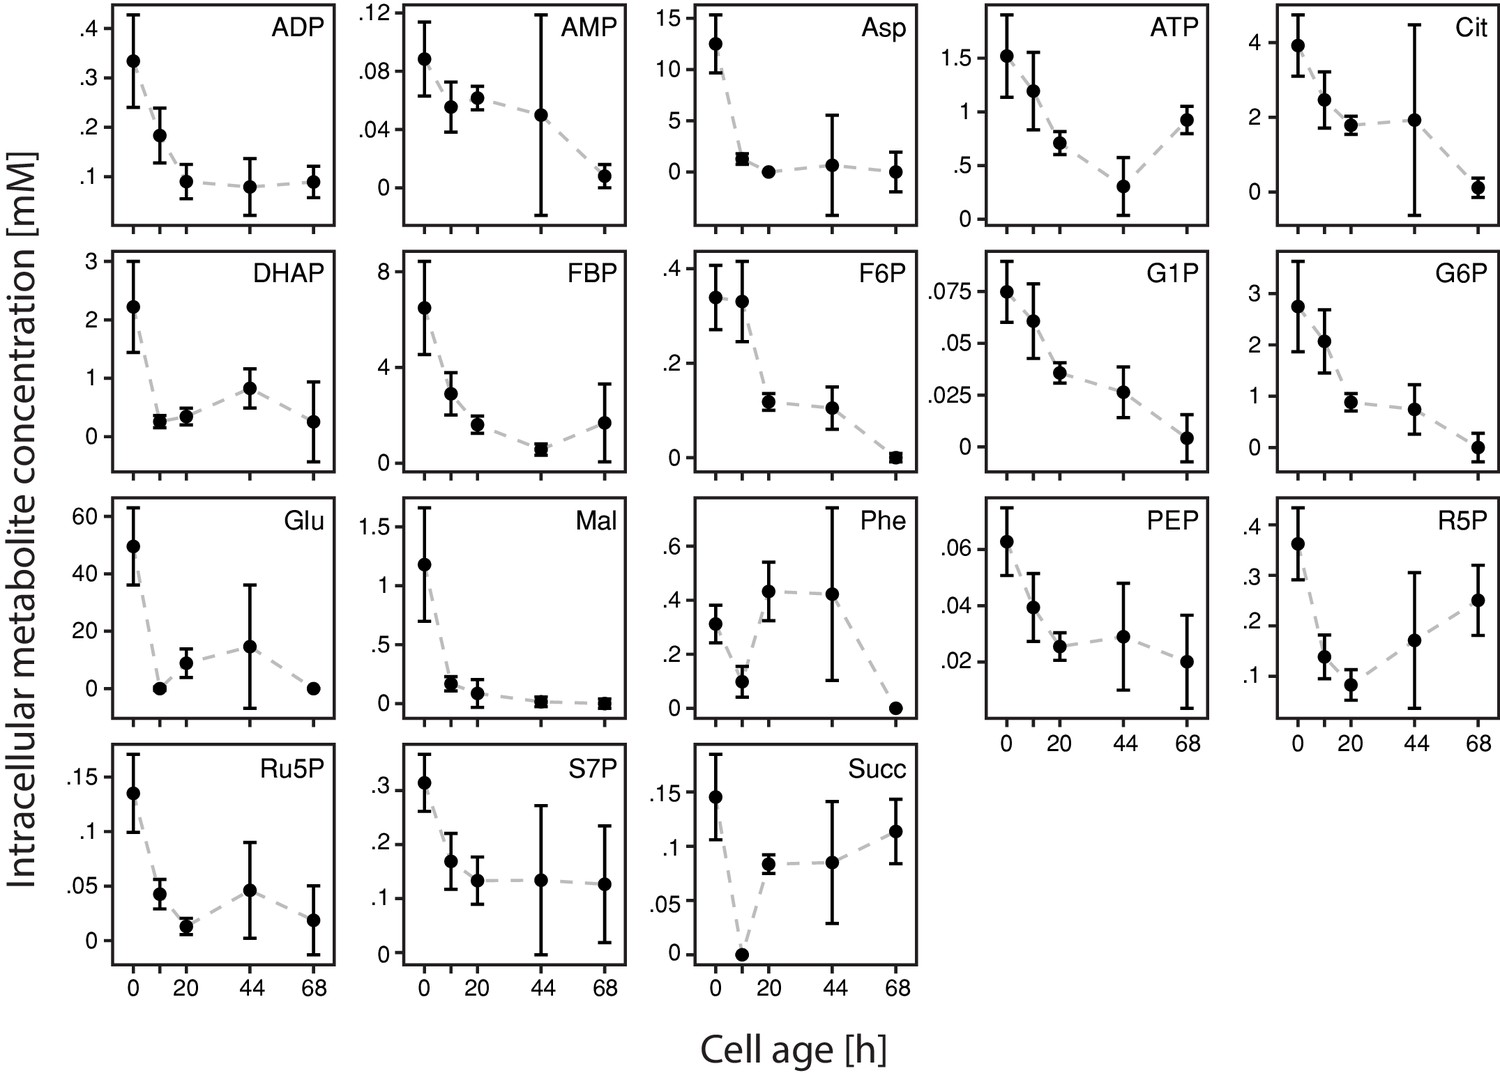
Inference of intracellular concentrations of 18 metabolites with cell age.
We found a drastic decrease of metabolite concentrations with cell age (starting from young daughter cells (da)) of all 18 metabolites: adenosindiphosphat (ADP), adenosinmonophosphat (AMP), aspartic acid (Asp), adenosintriphosphat (ATP), citric acid (Cit), dihyroxy acetone phosphate (DHAP), fructose 1,6-bisphosphate (FBP), fructose-6-phosphate (F6P), glucose-1-phosphate (G1P), glucose-6-phosphate (G6P), glutamic acid (Glu), malic acid (Mal), phenylalanine (Phe), phosphoenolpyruvic acid (PEP), ribose-5-phosphate (R5P), ribulose-5-phosphate (Ru5P), sedoheptulose-7-phosphate (S7P) and succinic acid (Succ). The standard errors were determined by leave-one-out cross-validation, where we one-by-one removed data points from the set and repeated the estimation procedure.
Figure 2—figure supplement 5

The energy charge remains constant with cell age.
Despite the vast decrease of the inferred concentrations of all three adenosin nucleotides with cell age, the energy charge was maintained between 0.8 and 0.95, which corresponds to values of exponentially growing cultures (Ditzelmüller et al., 1983).
Figure 2—figure supplement 6

Inference of physiological parameters from dynamic changes in extracellular metabolites.
At each time point (after 10, 20, 44 and 68 hr), we measured the evolution of cell count (which was converted to dry weight (i.e. biomass)) and extracellular concentrations of acetate, ethanol, glycerol, pyruvate and glucose over a period of three hours in the harvested sample mix 1. The dry mass specific fractional abundance of each cell population was determined before and after that period. We used a second set of aliquots to measure the evolution of produced carbon dioxide and consumed oxygen using a Respiration Activity Monitoring System (RAMOS) (Hansen et al., 2012). To infer the population-specific physiological rates from the mixed-population samples, we fitted the acquired dynamic data to an ordinary differential equation model, describing the changes of the biomass and extracellular metabolite concentrations in the samples, due to mother and daughter cell growth and their respective metabolism.
Figure 2—figure supplement 7
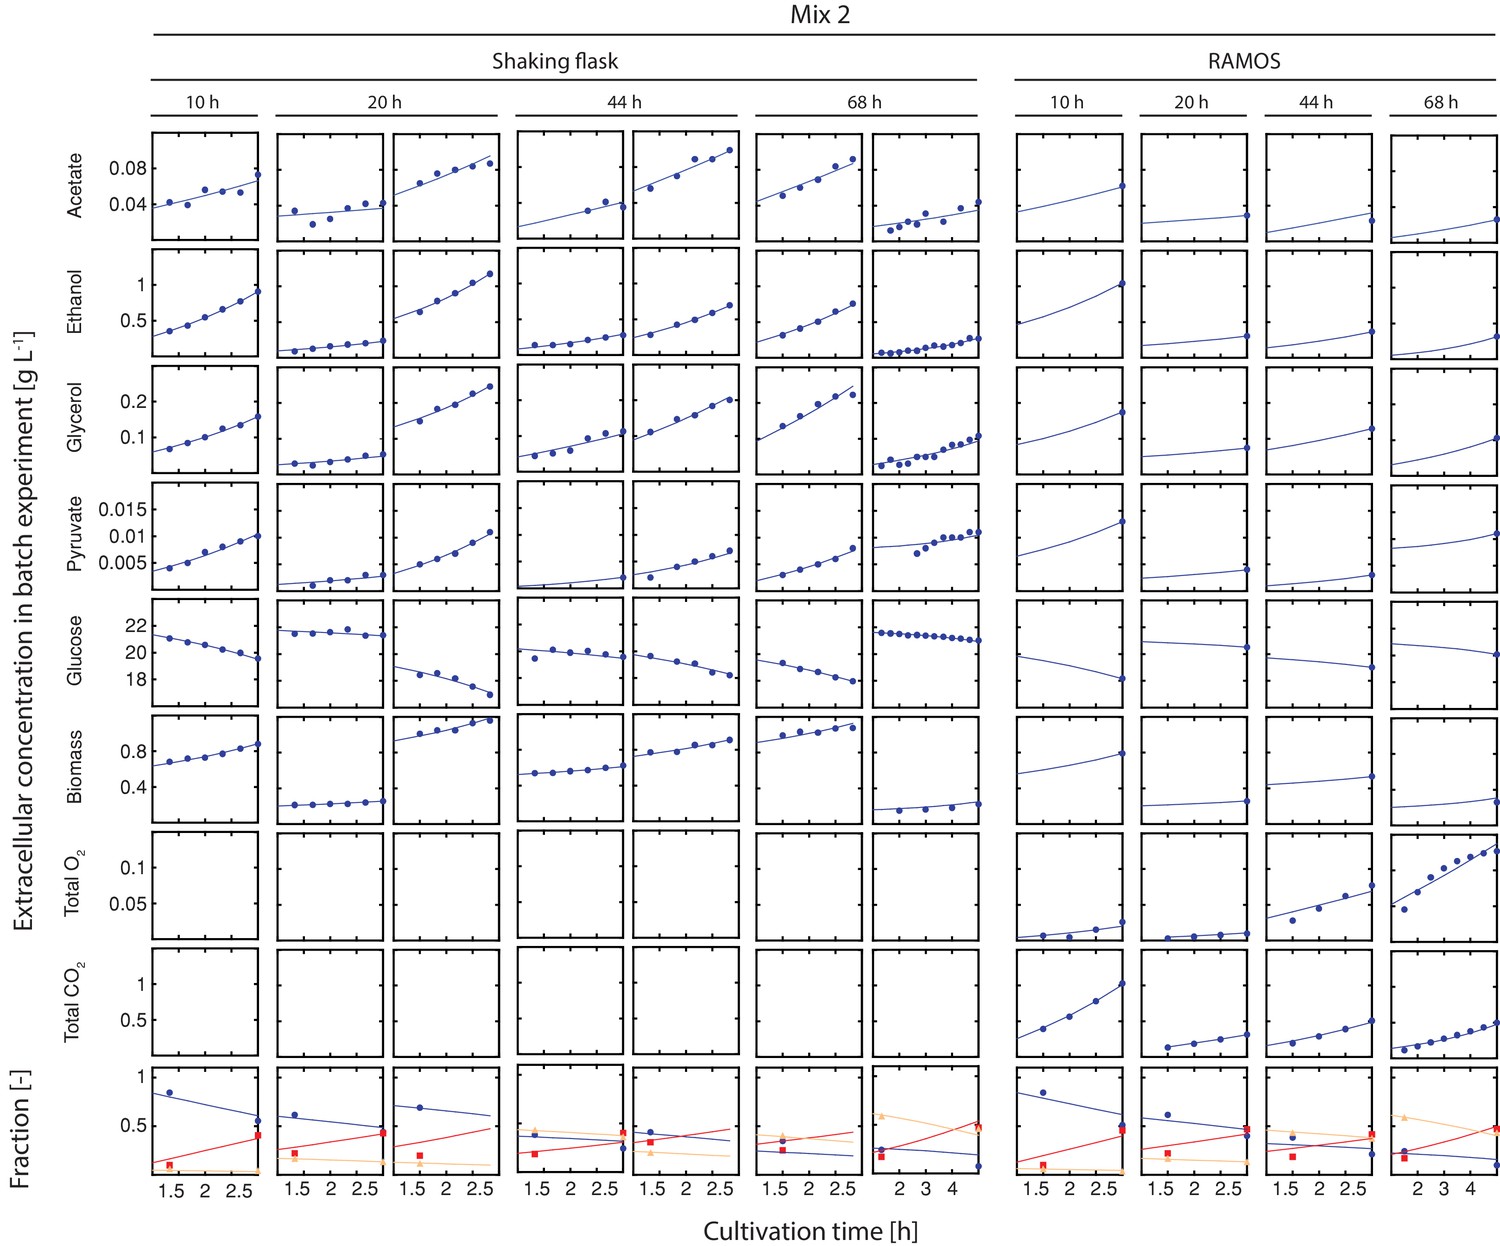
Inference of physiological parameters from dynamic changes in extracellular metabolites.
At each time point (after 10, 20, 44 and 68 hr), we measured the evolution of cell count (which was converted to dry weight (i.e. biomass)) and extracellular concentrations of acetate, ethanol, glycerol, pyruvate and glucose over a period of three hours in the harvested sample mix 2. The dry mass specific fractional abundance of each cell population was determined before and after that period. We used a second set of aliquots to measure the evolution of produced carbon dioxide and consumed oxygen using a Respiration Activity Monitoring System (RAMOS) (Hansen et al., 2012). To infer the population-specific physiological rates from the mixed-population samples, we fitted the acquired dynamic data to an ordinary differential equation model, describing the changes of the biomass and extracellular metabolite concentrations in the samples, due to mother and daughter cell growth and their respective metabolism.
Figure 2—figure supplement 8
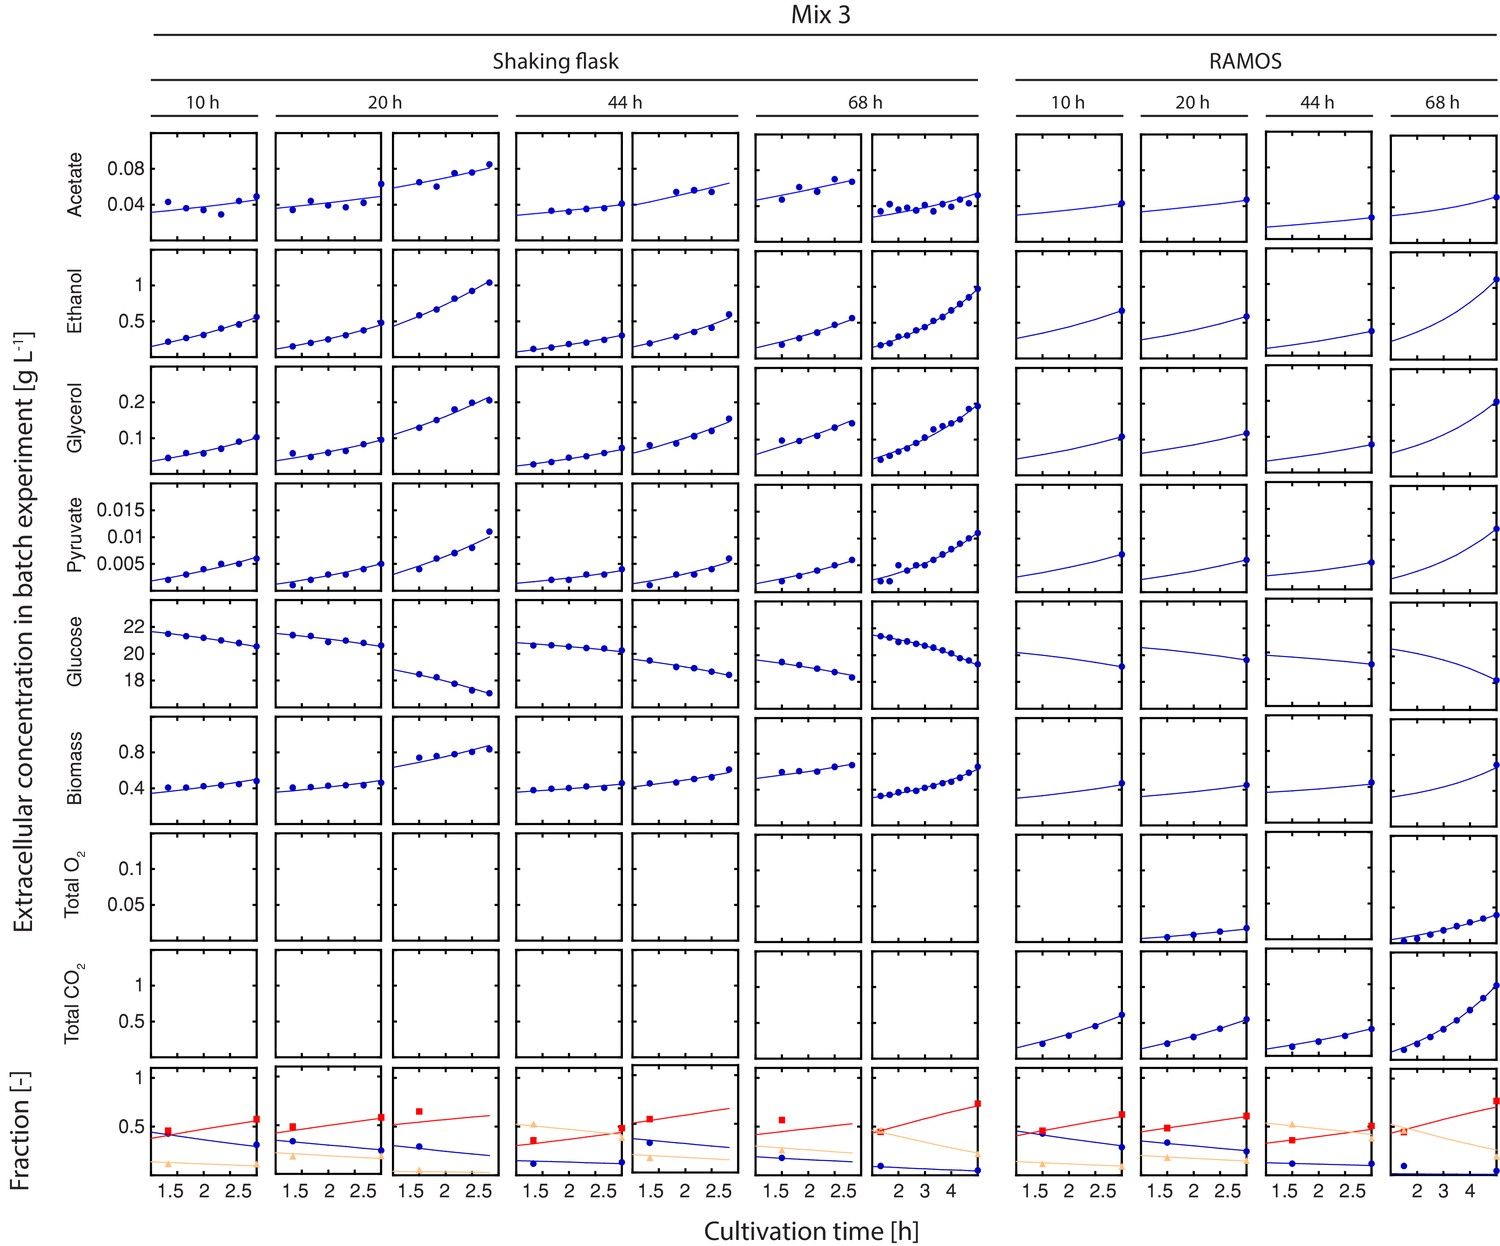
Inference of physiological parameters from dynamic changes in extracellular metabolites.
At each time point (after 10, 20, 44 and 68 hr), we measured the evolution of cell count (which was converted to dry weight (i.e. biomass)) and extracellular concentrations of acetate, ethanol, glycerol, pyruvate and glucose over a period of three hours in the harvested sample mix 3. The dry mass specific fractional abundance of each cell population was determined before and after that period. We used a second set of aliquots to measure the evolution of produced carbon dioxide and consumed oxygen using a Respiration Activity Monitoring System (RAMOS) (Hansen et al., 2012). To infer the population-specific physiological rates from the mixed-population samples, we fitted the acquired dynamic data to an ordinary differential equation model, describing the changes of the biomass and extracellular metabolite concentrations in the samples, due to mother and daughter cell growth and their respective metabolism.
Figure 2—figure supplement 9
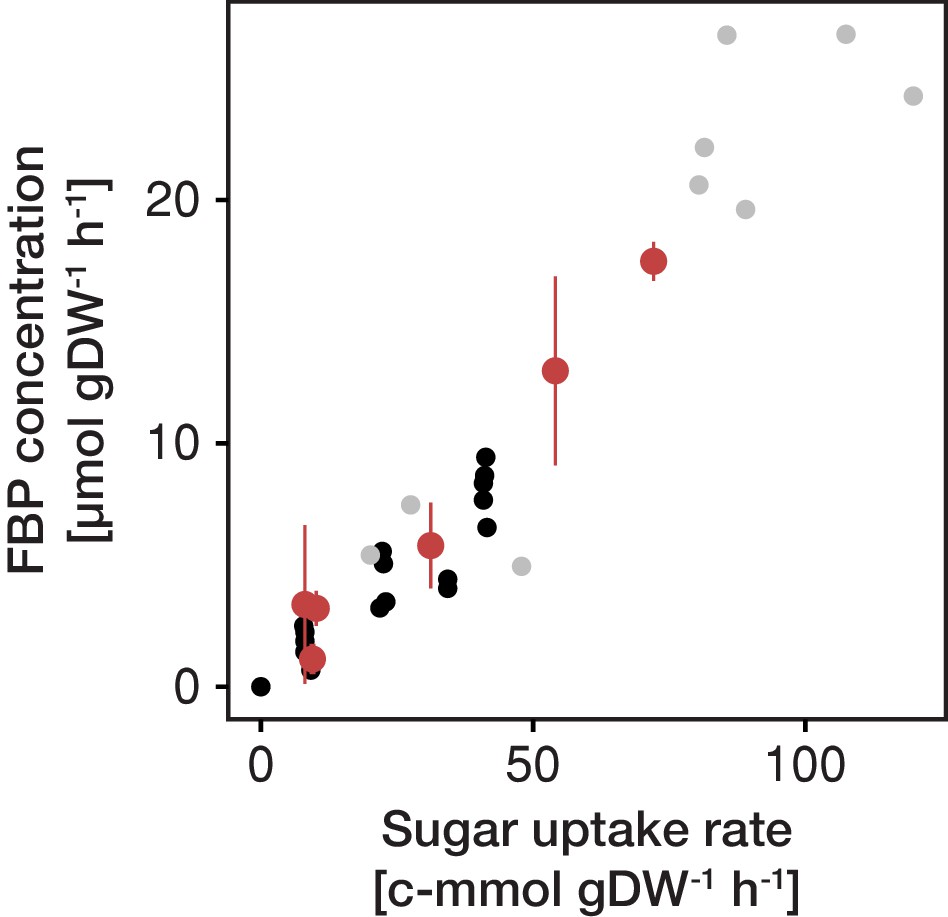
FBP (fructose-1,6-bisphosphate) concentration as function of sugar uptake rate.
Fructose-1,6-bisphosphate is a glycolytic flux-signaling metabolite and its concentration strictly correlates with the carbon flow through the glycolysis or the sugar uptake rate (Huberts et al., 2012). The independently inferred rate of glycolysis and FBP concentration in aging cells follows this correlation, providing evidence for the validity of the two independently generated data sets, that is physiological rates and metabolite levels. Black dots (Christen and Sauer, 2011), grey dots (de Assis Souza, 2016) and red dots inferred for aging cells.
Figure 2—figure supplement 10
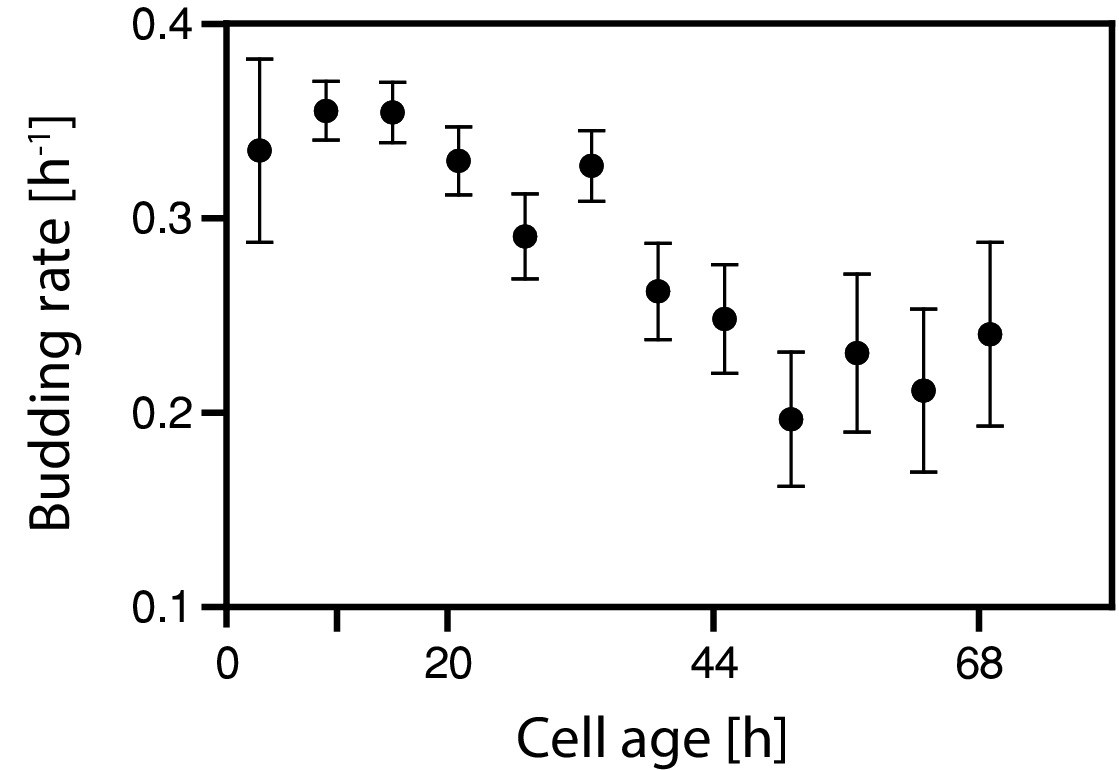
The decreasing growth rate was confirmed using single cell analysis.
The decreasing growth rate inferred with cell age was confirmed using microfluidics and microscopy. Cells from an exponentially growing batch culture were loaded onto a microfluidics device and monitored for >70 hr. The doubling time (time from bud emergence to next bud emergence) was measured for each cell in bright-field images, and the budding rate for each doubling event (ln(2) td−1) was calculated. Budding rates within 6 hr windows were averaged. Note, that the growth rate in Figure 2b was inferred from the increase of biomass in the culture while here the growth rate is determined from the budding rate of individual cells. Because of the prolonged G1 phase of newborn cells and the asymmetric division, both values are not identical, however, show both a decreasing trend.
Figure 2—figure supplement 11
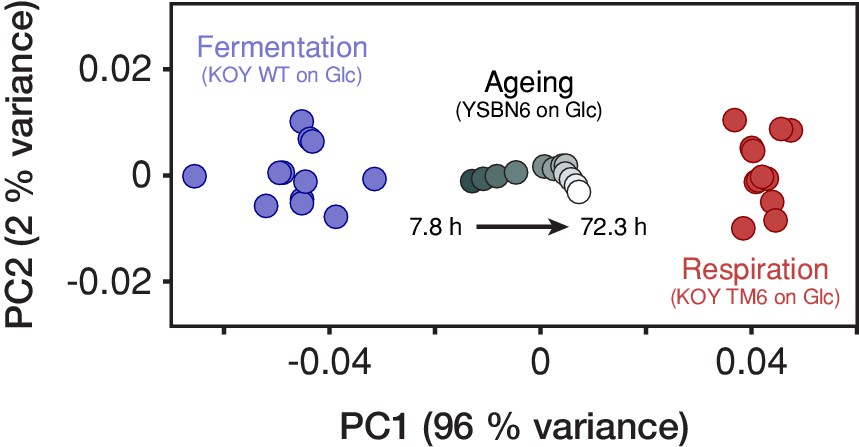
The yeast proteome progressively transforms form a fermentation- to a respiration-associated state during aging.
Proteomes of yeast (YSBN6 strain on 2% glucose) obtained at 12 consecutive replicative ages (gradient gray circles) were compared to proteomes of fermenting (KOY WT on 1% glucose) and respiring (KOY TM6 on 1% glucose; Elbing et al., 2004) cells derived from 12 and 13 replicate batch cultures, respectively (blue and red circles). We focused on 396 metabolic proteins present in all proteome data sets and, within each proteome, normalized their abundances by the total one. Next, we centered the 25 proteomes of fermenting and respiring cells together on the origin and performed a principal component analysis (PCA) using the module Sklearn (v0.19.1) in Python (v3.4.3). Next, we centered the proteomes of ageing cells and projected them on two principal components PC1 and PC2 that explain most of the variance among the proteomes of fermenting and respiring cells. PC1 can be interpreted as the fermentation-respiration dimension, that is, the dimension summarizing almost all the differences between the fermentation- and respiration-associated states of the yeast metabolic proteome. Here, we found that the yeast proteome during aging progressively transforms form a fermentation- to a respiration-associated state, similarly as inferred from our physiological analysis (Figures 2b and 3).
Figure 2—figure supplement 12
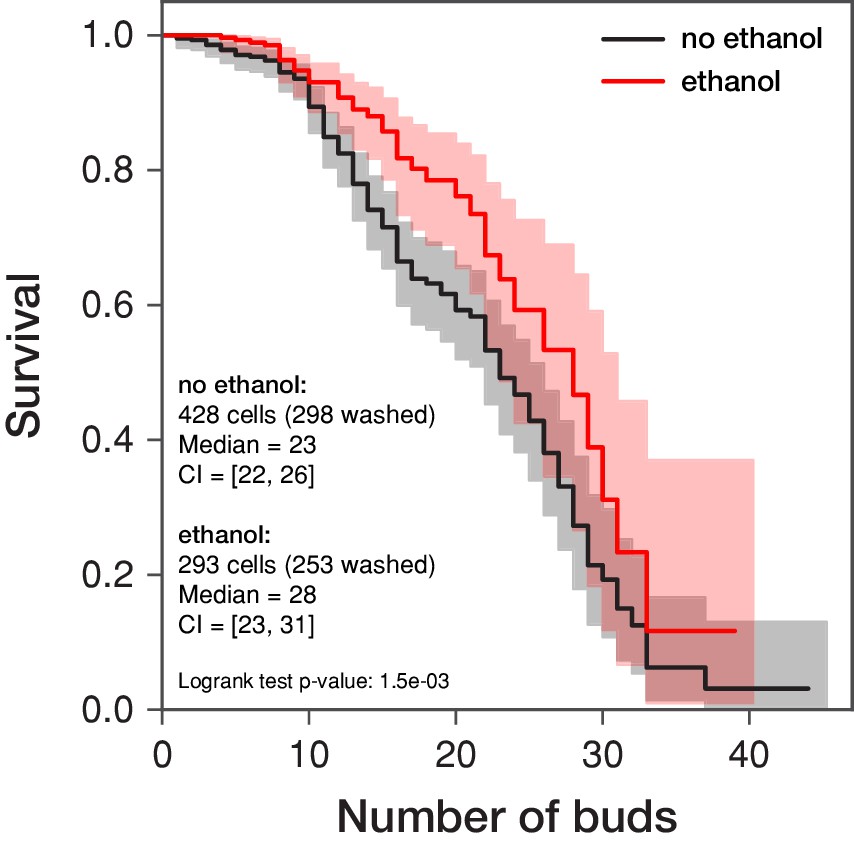
Replicative lifespan is increased in the presence of ethanol.
The replicative lifespan of S. cerevisiae is assessed in a microfluidic dissection platform in 0.5% glucose with and without 0.1% ethanol. The curves represent the survival estimates obtained by the Kaplan-Meier procedure considering the numbers of buds produced by the indicated amount of cells (including the cells that were washed out by the medium flow prior death, that is right censoring of the data; these cells are denoted as “washed”). The shaded area demarks the 95 % confidence intervals. The survival estimates were summarized using the median values and their 95 % confidence intervals (CI). Note that the mean survival with its standard error are 22.32 ± 0.76 in the absence of ethanol and 26.44 ± 1.67 in the presence of ethanol. However, as the right censoring of the data biases the calculation of the mean survival, the median is more robust. The survival curves are compared in the log-rank test whose p-value is given.
Figure 3 with 1 supplement
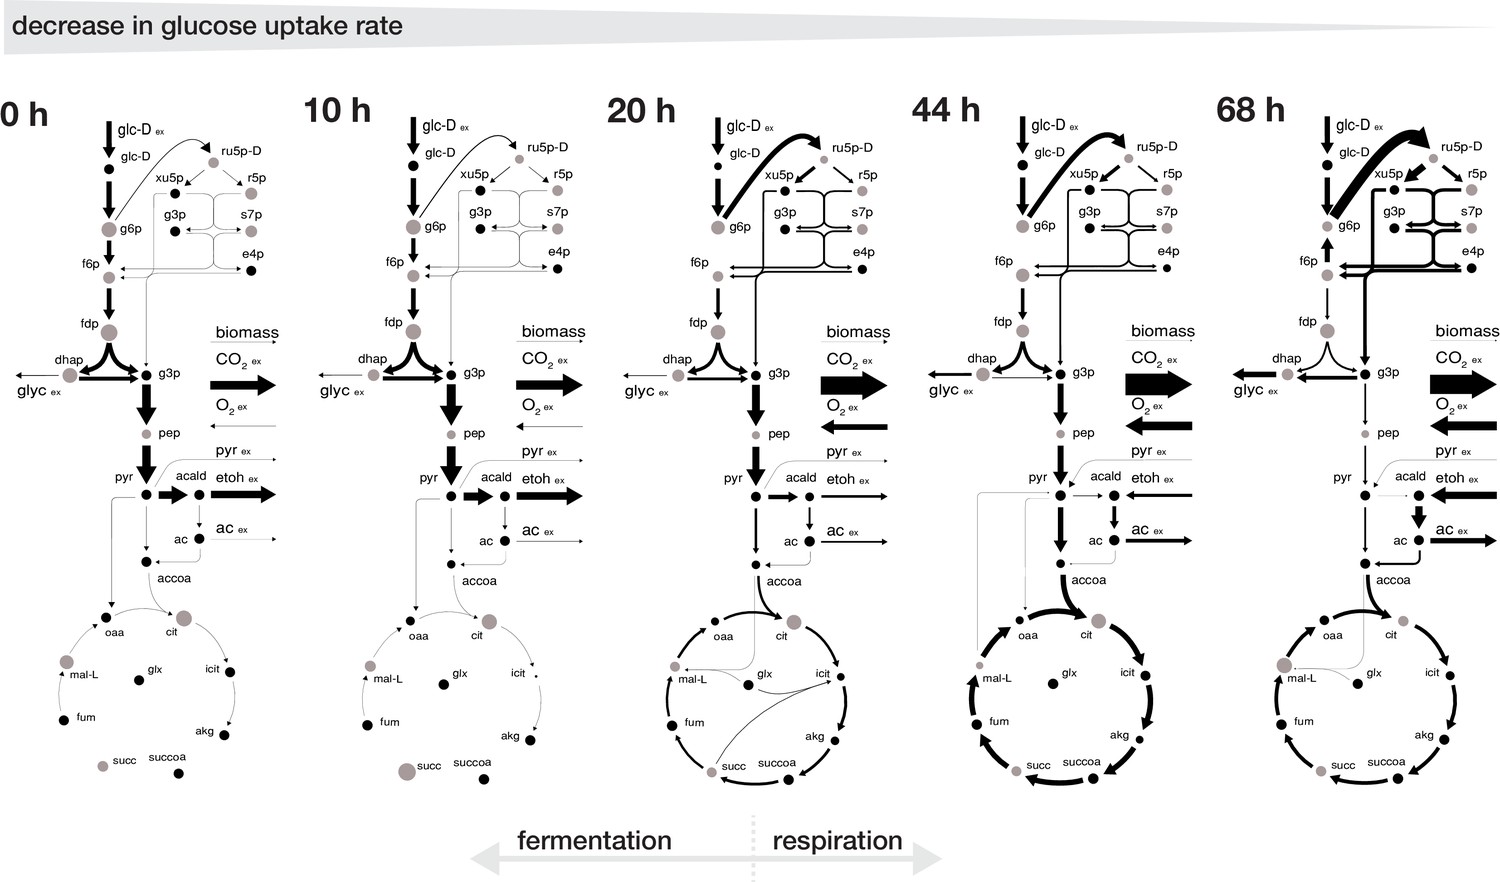
Rearrangement of normalized fluxes during replicative aging.
The normalized flux distributions (i.e. metabolic rates normalized by GUR) were obtained by minimizing the ‘absolute sum of fluxes’ within the solution space of the regression analysis of the inferred intracellular metabolite concentrations and physiological rates. The thickness of the arrows corresponds to the absolute value of the fluxes, normalized to the glucose uptake rate. The grey dots show the intracellular metabolite concentrations inferred for cells of the respective age where the diameter corresponds to the natural logarithm of the respective concentration. Note, that this figure does not show the complete model stoichiometry of the metabolic network. The numeric values of the respective normalized fluxes can be found in Figure 3—source data 1.
-
Figure 3—source data 1
Reaction stoichiometry of employed metabolic network model, metabolite annotation and inferred predicted intracellular metabolic fluxes normalized to the glucose uptake rates, for aging mother cells.
- https://doi.org/10.7554/eLife.41046.020
Figure 3—figure supplement 1
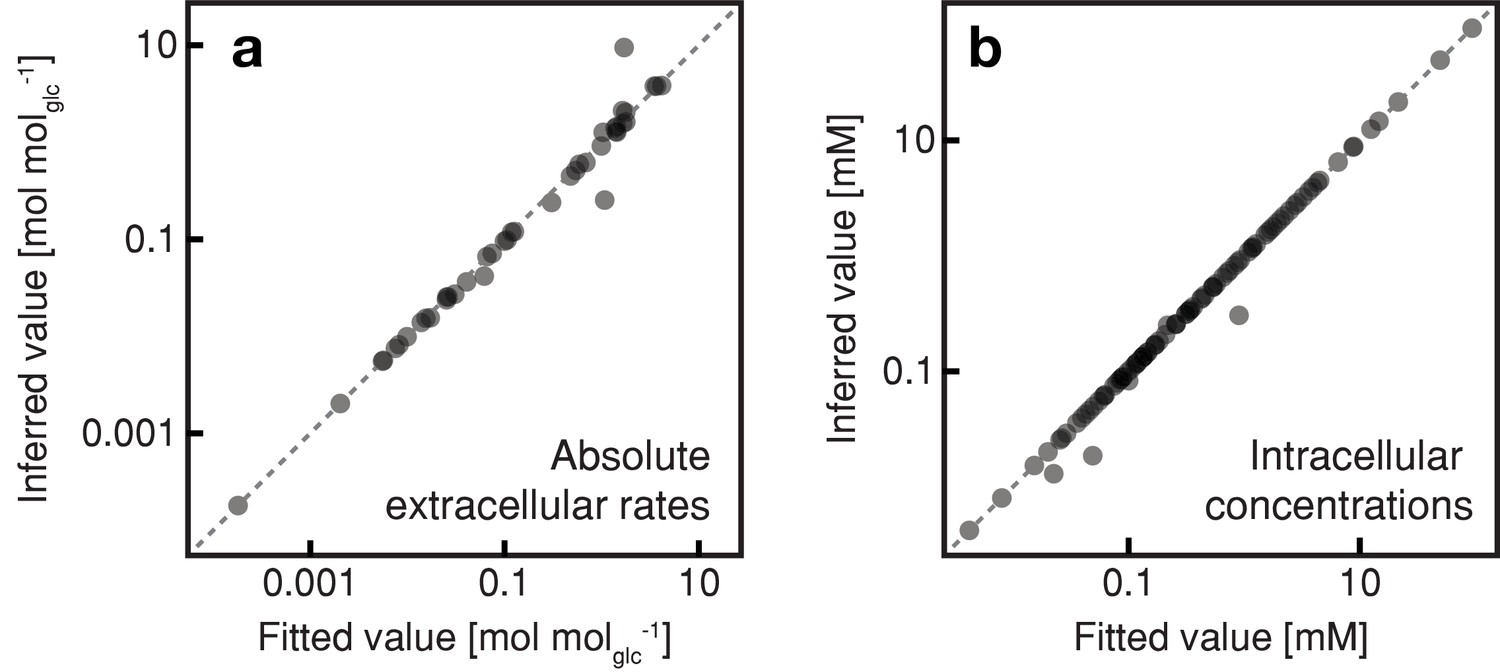
Results of the regression analysis using the combined thermodynamic and stoichiometric metabolic model.
The inferred extracellular metabolic rates (normalized by the respective glucose uptake rate) and intracellular metabolite concentrations of mother cell at an age of 0, 10, 20, 44 and 68 hr were analyzed using regression analysis and a combined thermodynamic and stoichiometric metabolic network model. Fitted values from this regression analysis versus inferred values; (a) extracellular rates and (b) intracellular metabolite concentrations.
Figure 4 with 1 supplement
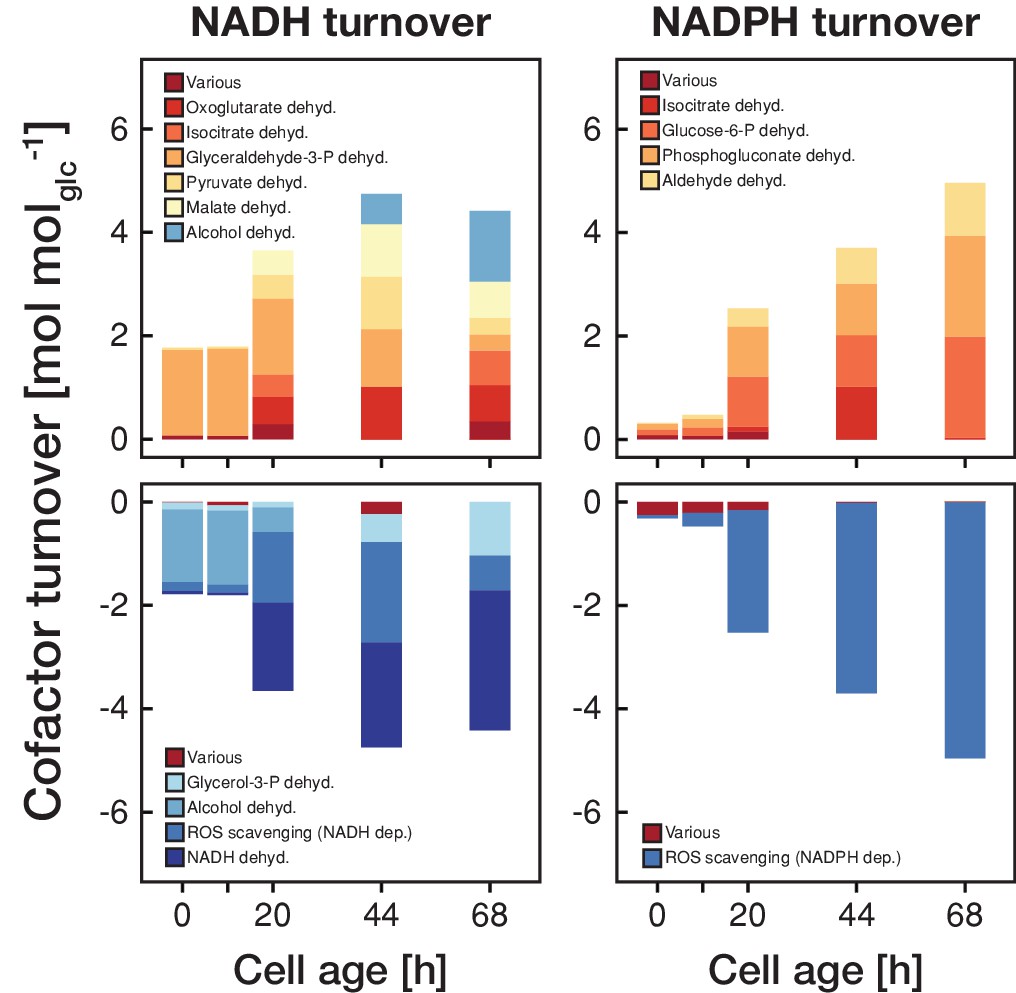
The metabolic rearrangements with age are accompanied by shifts in redox cofactor turnover.
The redox cofactor production and consumption rates (normalized by the respective glucose uptake rate) were obtained by minimizing the absolute sum of fluxes within the solution space of the regression analysis of the inferred intracellular metabolite concentrations and physiological rates. Reactions with a maximal turnover of <0.5 mol molglc−1 were combined and depicted as various. A positive turnover means that the cofactor is produced and a negative turnover that the cofactor is consumed. Note, that we did not enforce the emergence of ROS, however, the model could fit the experimental data the best by using cofactors for ROS scavenging.
Figure 4—figure supplement 1

The intracellular NAD(P)H concentration remains constant with cell age.
Individual cells of Saccharomyces cerevisiae were tracked in a microfluidics device and fluorescence images were recorded throughout their whole lifespan. The NAD(P)H concentration was inferred from the acquired autofluorescence (Papagiannakis et al., 2017). Assuming that this measurement mostly reflects the NADH concentration, and assuming that there is a Sirtuin inhibiting effect of NADH, then this effect would be constant through age.
Additional files
-
Transparent reporting form
- https://doi.org/10.7554/eLife.41046.023
Download links
A two-part list of links to download the article, or parts of the article, in various formats.
Downloads (link to download the article as PDF)
Open citations (links to open the citations from this article in various online reference manager services)
Cite this article (links to download the citations from this article in formats compatible with various reference manager tools)
Saccharomyces cerevisiae goes through distinct metabolic phases during its replicative lifespan
eLife 8:e41046.
https://doi.org/10.7554/eLife.41046


