Optogenetics enables real-time spatiotemporal control over spiral wave dynamics in an excitable cardiac system
- Leiden University Medical Center, The Netherlands
- Gent University, Belgium
- Ural Federal University, Russia
Figures
Figure 1
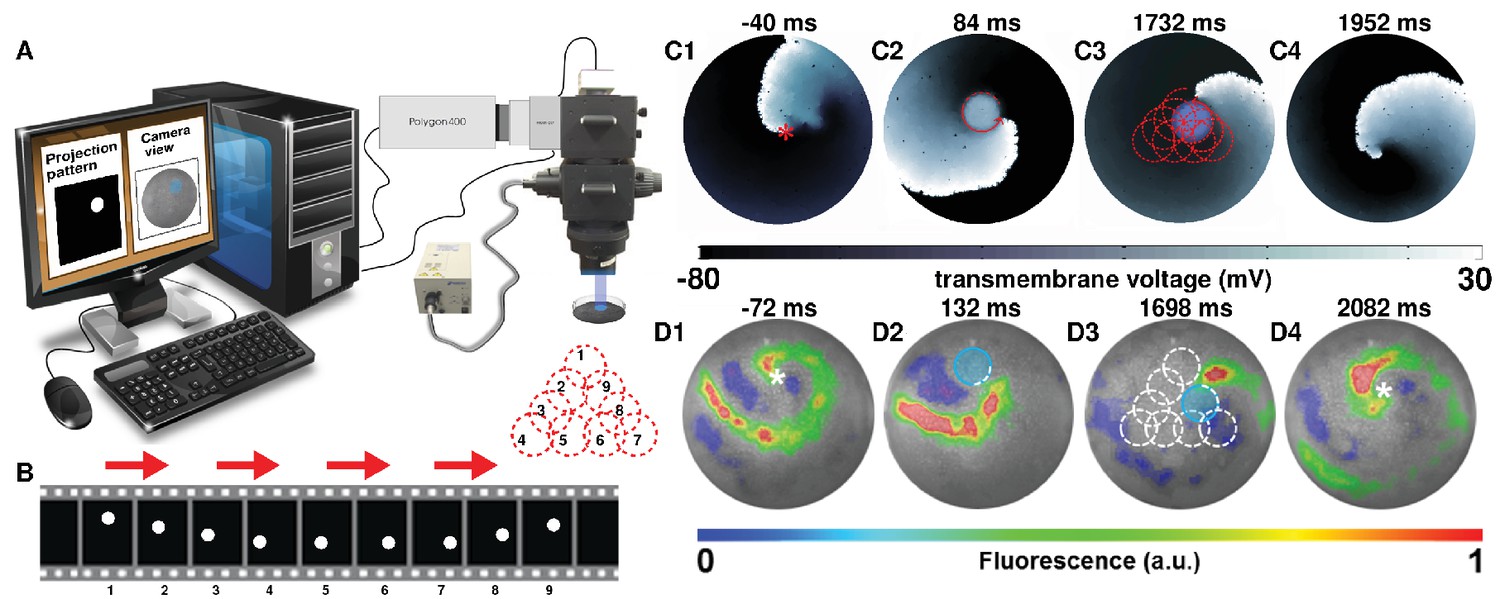
Attract-Anchor-Drag (AAD) control of a spiral wave core along a triangular trajectory.
(A) Schematic diagram of our in vitro setup, showing how we project light patterns on an optogenetically modified monolayer. (B) The sequence of light spots that constitute the desired triangular trajectory of the spiral core. (C1–C4) In silico AAD control data recorded at subsequent times; (D1–D4) In vitro corroboration of our in silico findings (n = 9). In panels (C) and (D), the current location of the applied light spot is indicated with a filled blue circle, whereas, the schematic movement of the tip of the spiral wave, as it is anchored to the location of the light spot at previous time points, is indicated in each frame by means of dashed red (in silico) and white (in vitro) lines. The location of the phase singularity of the spiral wave is marked in the first and last frame of panels (C) and (D) with a red (in silico) or white (in vitro) asterisk. a.u., arbitrary units. A video demonstrating the process of dragging a spiral wave core along a triangular trajectory is presented in Video 1.
Figure 2
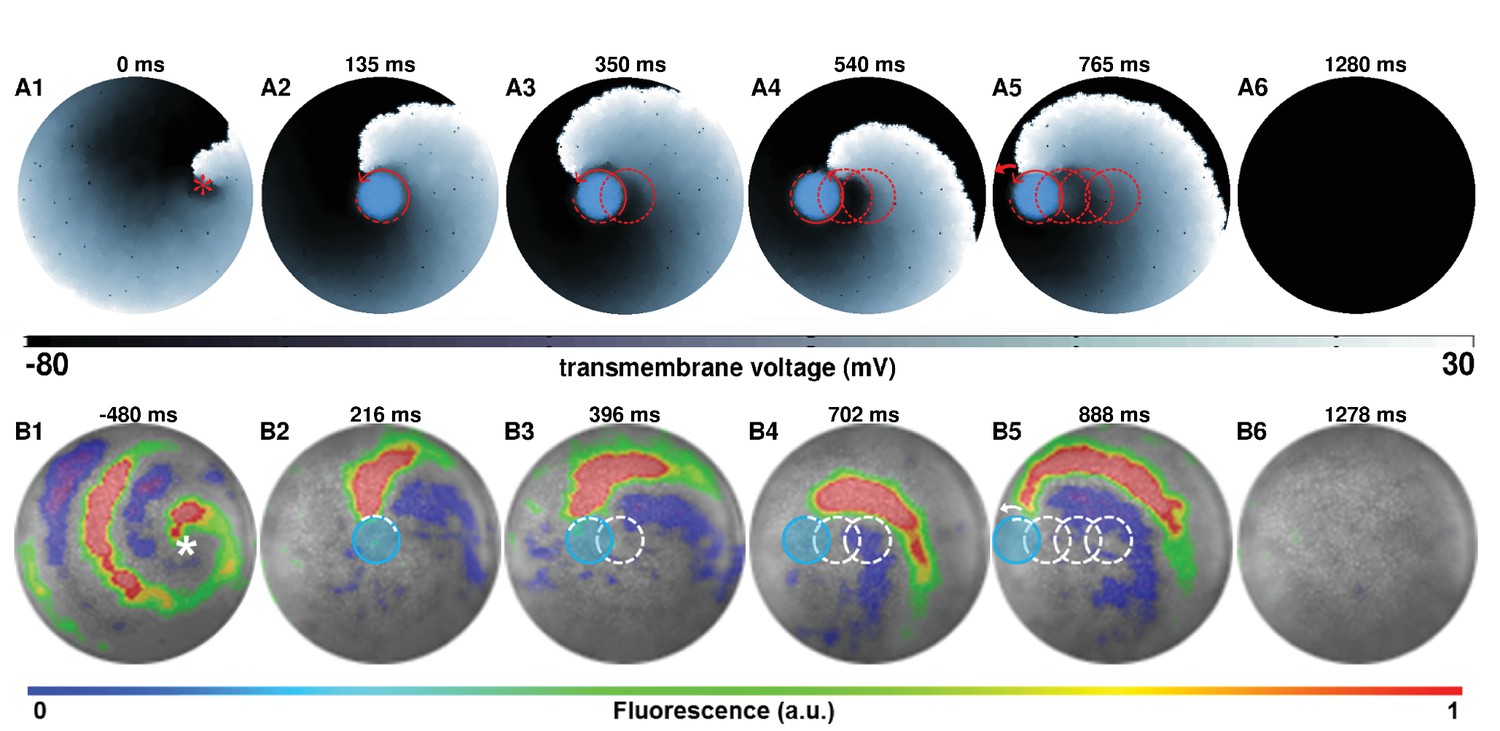
AAD control of a spiral wave core in favor of termination.
The upper panel (A1–A6) shows successful removal of a spiral wave in silico, by capturing its core from the center of the simulation domain, and dragging it to the left boundary in a stepwise fashion ( and per spot, period of the reentry around the spot is ). The lower panel (B1–B6) shows in vitro proof of the results presented in panel (A) (n = 9). For each light spot, the current location of the applied light spot is indicated with a filled blue circle ( and , period of the reentry around the spot is ). The schematic movement of the tip of the spiral wave, as it is anchored to the location of the light spot at previous time points, is indicated in each frame by means of dashed red (in silico) and white (in vitro) lines. The location of the phase singularity of the spiral wave is marked in the first frame of each panel with a red (in silico) or white (in vitro) asterisk. a.u., arbitrary units. A video demonstrating the complete process of dragging a spiral wave core from the center of the monolayer to the left border, causing its termination, is presented in Video 2. (Time t = 0 ms denotes the moment when the light is applied).
Figure 3
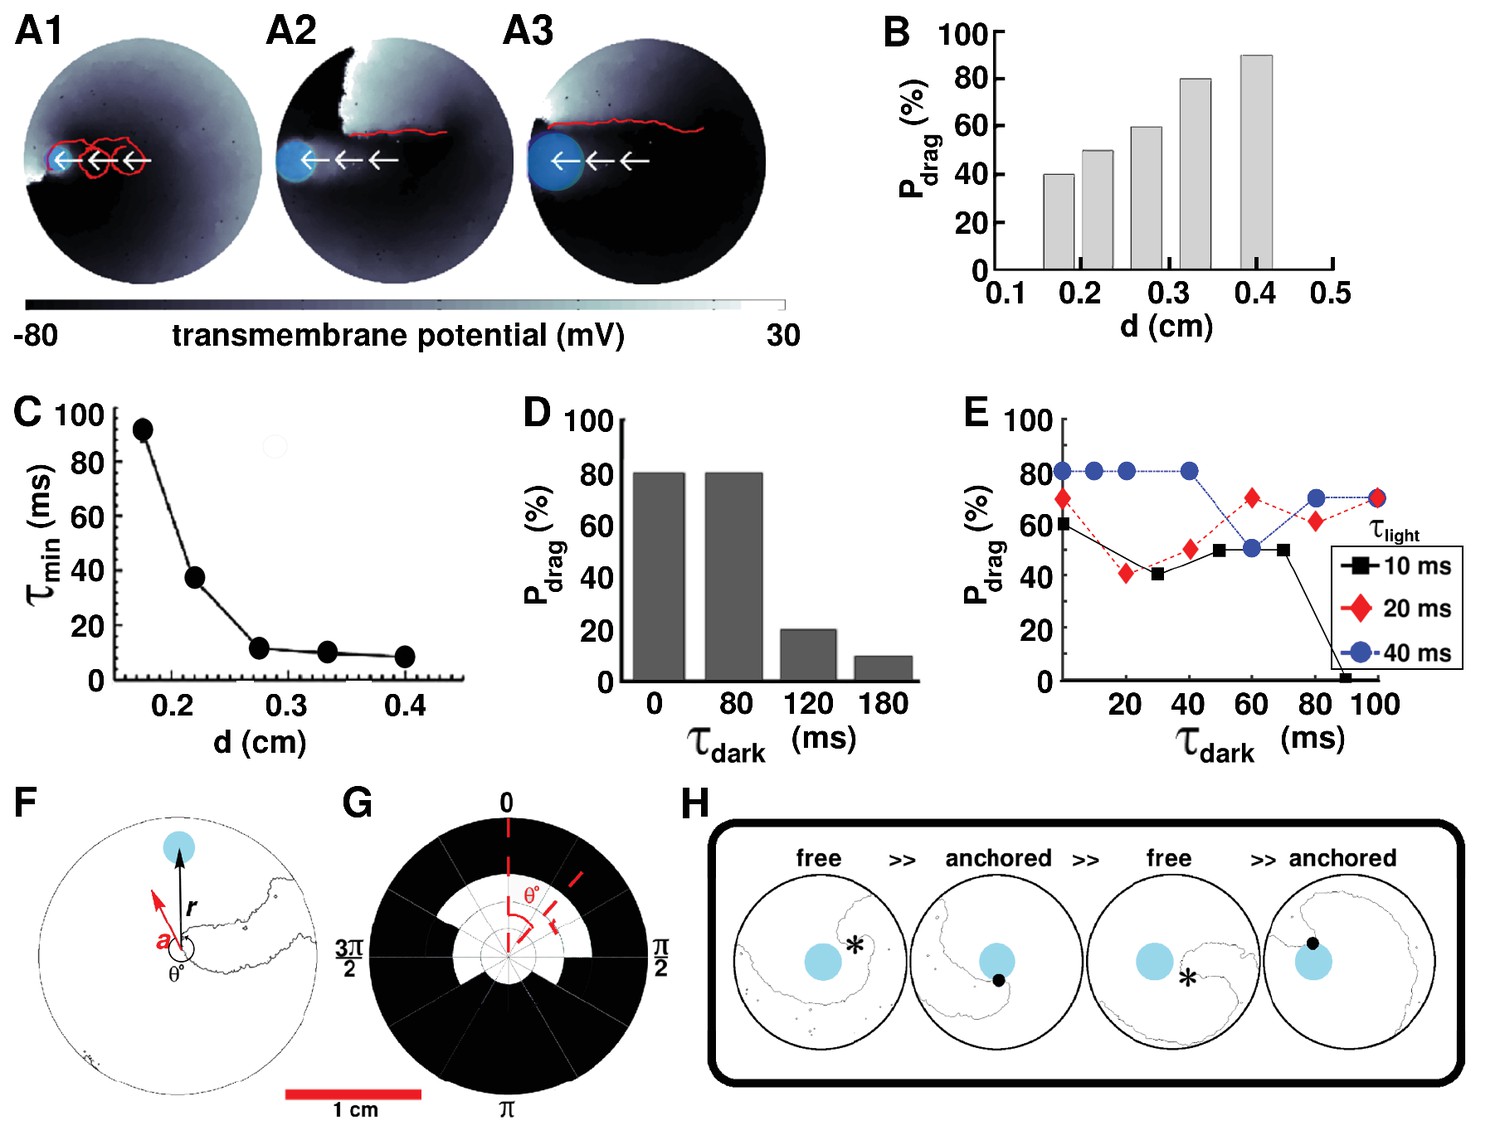
AAD control by continuous illumination of circular light spots of different sizes and durations.
Panel A shows representative dragging events as a spiral wave core is relocated from the center of the simulation domain to the periphery, with light spots of diameter =, and cm, respectively. In each case, the real trajectories of the spiral tip is marked with solid red lines on top of the voltage map. When is large, the spiral tip exhibits a tendency to move along a linear path, as opposed to the cycloidal trajectory at small . With , (B) probability of successful dragging () increases, and (C) spiral core relocation time () decreases, with increasing . In each of the afore-mentioned cases, the dragging process is illustrated with zero dark interval () and minimal light interval (). (D) With finite non-zero , increases with shortening of , for light stimulation of afixed cycle length ( ms). (E) Dependence of on , for three different light intervals (). (F) Schematic representation of the drag angle and the distance () between the starting location of the spiral tip and the location of the applied light spot. (G) Distribution of at different and , thresholded at 50%. (H) AAD control is effectuated by alternate transitions between functional (free wave) and anatomical (anchored wave) reentry. The phase singularity of the free spiral is marked with a black asterisk, whereas, the point of attachment of the anchored wave to the heterogeneity is marked with a black dot.
Figure 4 with 1 supplement
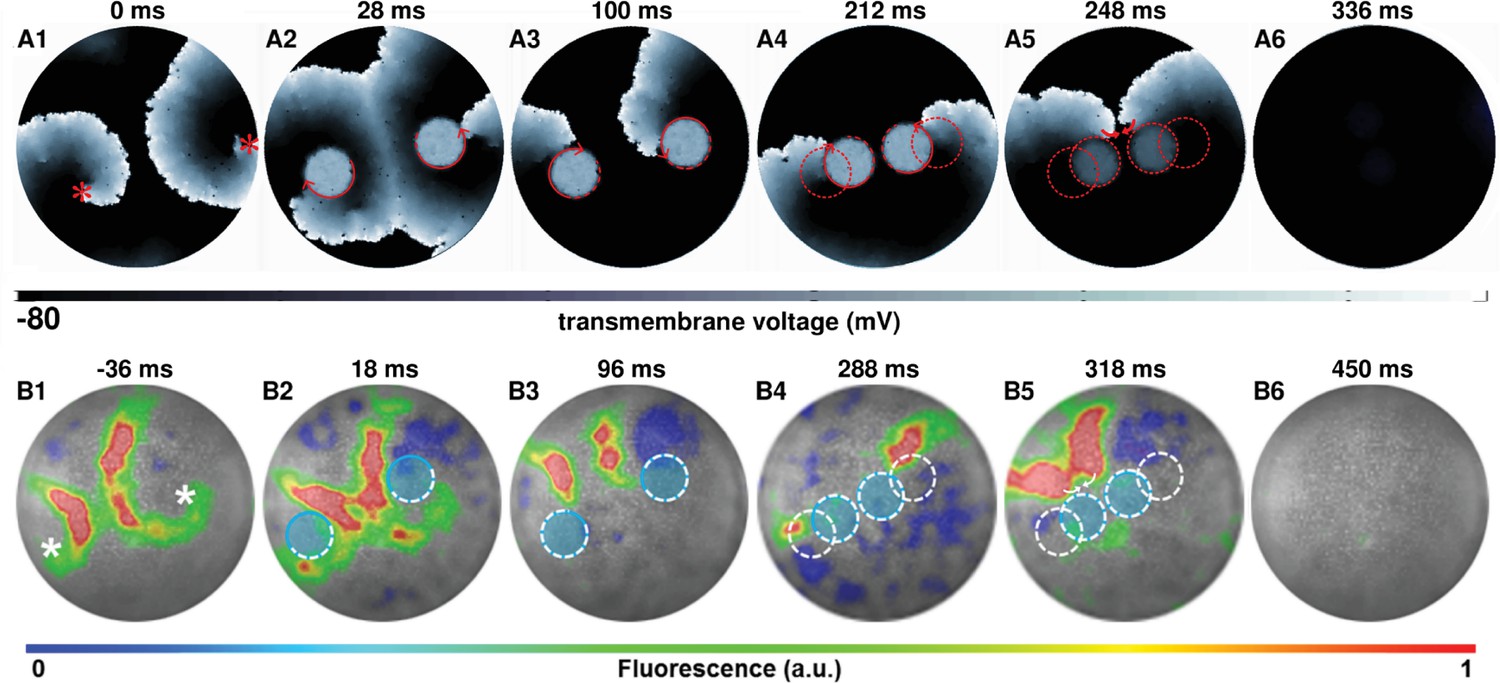
AAD control of a pair of spiral wave cores in favor of termination of figure-of-eight type reentry.
The upper panel (A1–A6) shows representative in silico voltage maps of the drag-to-termination process, at subsequent times. The lower panel (B1-B6) provides experimental (in vitro) validation of the findings presented in panel (A) (n = 6). In each case, the locations of the phase singularities are marked on the first frame of each panel with a red (in silico) or a white (in vitro) asterisk. The current location of the applied spot of light is indicated with a filled blue circle. The schematic movement of the tip of the spiral wave, as it is anchored to the location of the light spot at previous time points, is indicated in each frame by means of dashed red (in silico) and white (in vitro) lines. The direction of dragging is indicated in panel (A) with red arrows. In our studies, we terminated figure-of-eight type reentry by dragging spiral cores toward each other to make them collide and annihilate. a.u., arbitrary units. A video demonstrating AAD control (with eventual termination) of a figure-of-eight type reentry is presented in Video 3. (Time t = denotes the moment when the light is applied.).
Figure 4—figure supplement 1
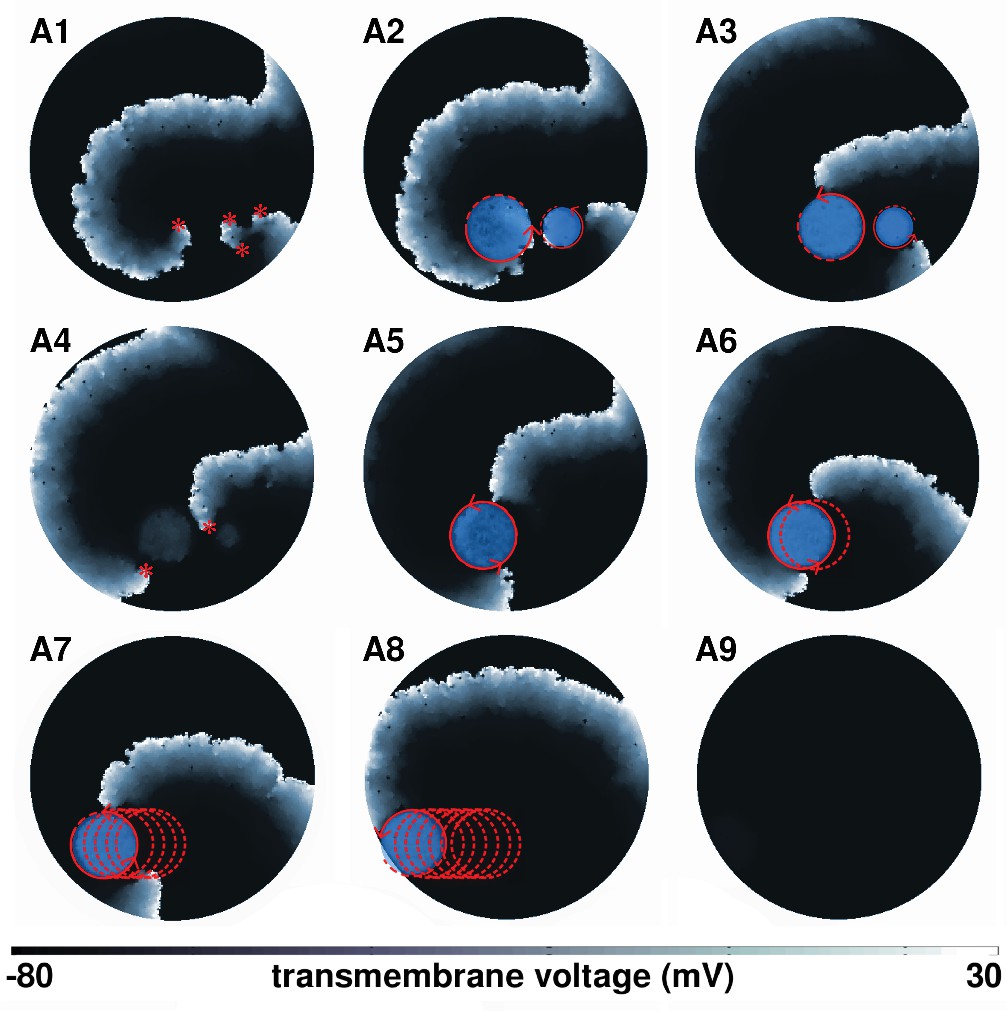
AAD control of spiral wave cores to accomplish termination of a complex figure-of-eight type reentry, where the constituting spirals rotate slightly out of phase with each other.
(A1) Positions of phase singularities of the initial reentrant pattern are marked with red asterisks. (A2) Phase correction of spirals by anchoring to light spots of different sizes. (A3-5) Formation of a single multi-arm spiral. (A6-9) Dragging the multi-arm spiral to termination. In each frame, the current position of the light spot is marked with a filled blue circle. The approximate trajectory of the dragged reentrant pattern is shown with dashed red lines.
Figure 5

AAD control of multiple spiral wave cores in favor of termination of complex reentrant patterns.
Panels (A) and (B) show representative in silico voltage maps of the drag-to-termination process for stable reentrant activity with three and seven phase singularities, respectively. Panel (C) shows representative in vitro voltage maps of the drag-to-termination process for stable reentrant activity with four phase singularities. Number and the position of the light spots, indicated with blue filled circles, are strategically applied to first capture the existing spiral waves, and then drag them to termination, following the same principle as in Figure 2 (A5-6) and (B5-6). In the process, it is possible to reduce the complexity of the reentrant pattern through annihilation of some of the existing phase singularities by new waves emerging from the location of the applied light spot. The schematic movement of the tip of the spiral wave, as it is anchored to the location of the light spot at previous time points, is indicated by means of dashed red (white) lines in silico (in vitro), and the direction of dragging is illustrated with red (white) arrows. Video 4 shows a video of computer simulations demonstrating AAD control of complex reentrant patterns with three and four spiral waves, in favor of their eventual termination. Video 5 shows the same process, in vitro, but for stable reentry with four-phase singularities. (Time t = denotes the moment when the light is applied).
Videos
Video 1
Use of AAD control method to drag a spiral wave core along a triangular trajectory in silico and in vitro.
In vitro A emphasizes the shape of the wave front. In vitro B shows the same data, but processed to show more clearly, what happens during the application of the light spots.
Video 2
Use of AAD control method to drag a spiral wave core to termination in silico and in vitro.
In vitro A emphasizes the shape of the wave front. In vitro B shows the same data, but processed to show more clearly, what happens during the application of the light spots.
Video 3
Use of AAD control method to terminate figure-of-eight type of reentry in silico and in vitro.
In vitro A emphasizes the shape of the wave front. In vitro B shows the same data, but processed to show more clearly, what happens during the application of the light spot.
Video 4
Use of AAD control method to terminate complex reentry in silico, with 3 (left) and 4 (right) spiral waves.
https://doi.org/10.7554/eLife.41076.011
Video 5
Use of AAD control method to terminate complex reentry (four spiral waves) in vitro.
This video was produced in the same manner as described above for In vitro A.
Additional files
-
Source data 1
- https://doi.org/10.7554/eLife.41076.014
-
Transparent reporting form
- https://doi.org/10.7554/eLife.41076.015
Download links
A two-part list of links to download the article, or parts of the article, in various formats.
Downloads (link to download the article as PDF)
Open citations (links to open the citations from this article in various online reference manager services)
Cite this article (links to download the citations from this article in formats compatible with various reference manager tools)
Optogenetics enables real-time spatiotemporal control over spiral wave dynamics in an excitable cardiac system
eLife 7:e41076.
https://doi.org/10.7554/eLife.41076


