Cytoskeletal tension and Bazooka tune interface geometry to ensure fusion fidelity and sheet integrity during dorsal closure
- Tata Institute of Fundamental Research, India
Figures
Figure 1 with 5 supplements
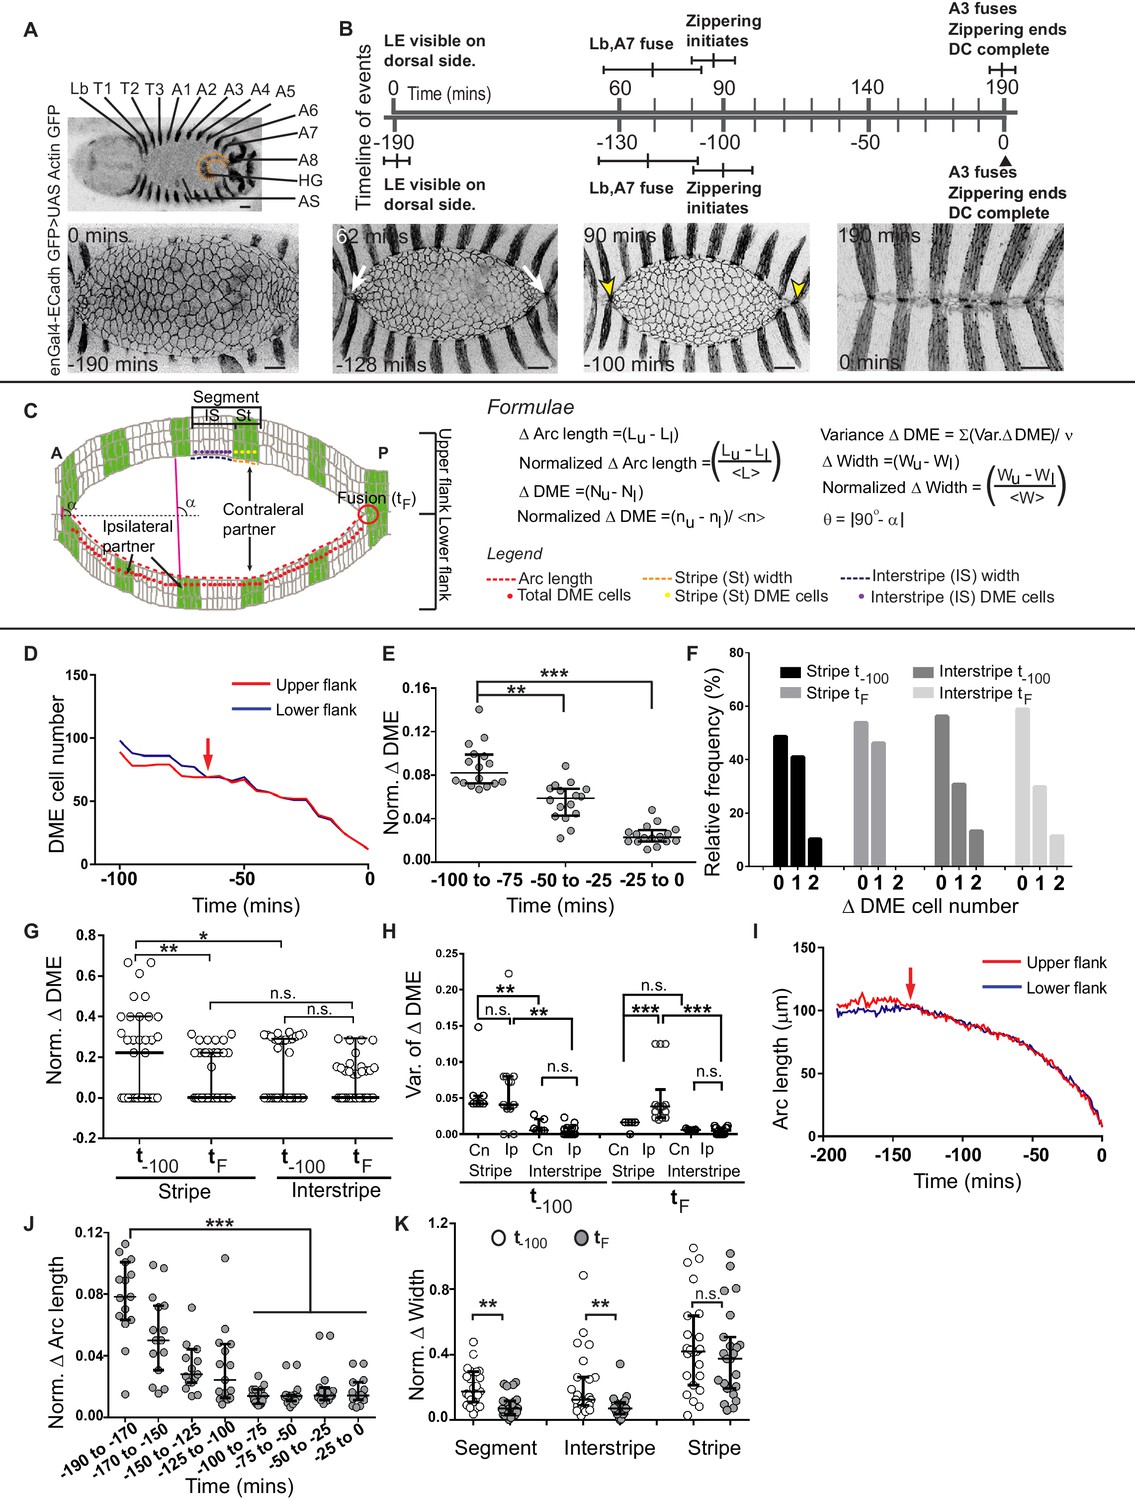
Chronology of segment fusion and pair-wise analysis of fidelity descriptors.
(A) Top: Low magnification image of a Drosophila embryo at the onset of dorsal closure (DC) showing the segments (Lb-A8, posterior compartments/stripes are labelled with GFP) that fuse during dorsal closure (HG- hindgut and AS-amnioserosa). Bottom: Time-lapse images showing the progression of DC in one such embryo (white arrows show the fusion of the Lb and A7 stripes, yellow arrows mark the anterior and posterior canthi). (B) Prospective and retrospective time lines depicting the chronology of fusion during dorsal closure (times are mean ± sd, n = 5 embryos). (C) Epidermal landmarks and the descriptors used to assess fidelity during dorsal closure. DME - Dorsal Most Epidermal cells (also called Leading Edge cells; see Materials and methods). (D) DME cell number dynamics of the upper (red) and lower (blue) arc over the course of dorsal closure in a representative embryo in a retrospective time scale (0-completion of closure, red arrows denote time of equalization between the two arcs). (E) Normalized difference in DME cell number between the fusing arcs over the course of dorsal closure (median ± range, n = 16 embryos). (F) Frequency distribution of DME cell number differences between contralateral stripe and interstripe pairs at t-100 and tF (n = 21 pairs of stripes/interstripes from seven embryos). (G) Normalized DME cell number difference in stripes and interstripes at t-100 and tF (median ± range, n = 21 stripe/interstripe pairs from seven embryos). (H) Variance in DME cell number differences between contralateral and ipsilateral partner stripes and interstripes at t-100 and tF (median ± range, n = 21 pairs of contralateral and 28 pairs of ipsilateral compartments from seven embryos). (I) Length dynamics of the upper (red) and lower (blue) arcs plotted over the course of DC in a representative embryo in a retrospective time scale (0-completion of closure, red arrows denote time of equalization). (J) Normalized difference in arc length between the fusing arcs over the course of dorsal closure (median ± range, n = 16 embryos). (K) Normalized width difference between contralateral partner segments and compartments at t-100 and tF (median ± range, n = 21 pairs from seven embryos). Scale bar- 20 µm. (* - p<0.01, ** - p<0.001, *** - p<0.0001).
Figure 1—figure supplement 1

Segment specific differences in stripe and interstripe DME cell number and width.
(A–B) Segment specific average DME cell number in the stripes (A) and interstripes (B) prior to fusion (tE) and at fusion (tF). Values are mean ± sem (n = 6 embryos). (C–D) Frequency distribution of DME cell number combinations in contralateral stripe (C) and interstripe (D) pairs at 100 mins prior to fusion (t-100) and at fusion (tF); (n = 48 stripes/interstripe pairs from six embryos). (E, F and H, I) Prevalence of DME cell number differences (as indicated in the legend) between contralateral partner stripes (E,F) or interstripes (H,I) in segments Lb-A7 prior to (tE; E, H) and at fusion (tF; F, I) (n = 6 embryos). (G, J) Segment specific prevalence of DME cell number difference outcomes between tE and tF in stripes (G) and interstripes (J) of segments Lb/T1-A7 (n = 6 embryos). (K–L) Segment specific average width (mean ± sem, n = 6 embryos) of stripes (K) and interstripes (L) at tE and at fusion tF. (M) Summary of segment and compartment specific changes in cell number and width between tE and tF (length of arrows indicates the magnitude of difference). (N) Average time interval between the fusion of successive stripes (mean ± sem, n = 6 embryos). (O, P) Representative images of an embryo expressing ECadh GFP and enGal4 driven UAS Actin GFP (stripes), showing details of DME cell outlines before (O) and after (P) increasing contrast and intensity using ImageJ to enable visualization of stripe (O) and interstripe (P) DME cells. (Q) Timeline of local and global changes in fidelity indicators over the course of dorsal closure (yellow arrowhead marks the end of dorsal closure, purple arrowhead marks fusion of a central stripe). Scale bar- 20 µm.
Figure 1—figure supplement 2
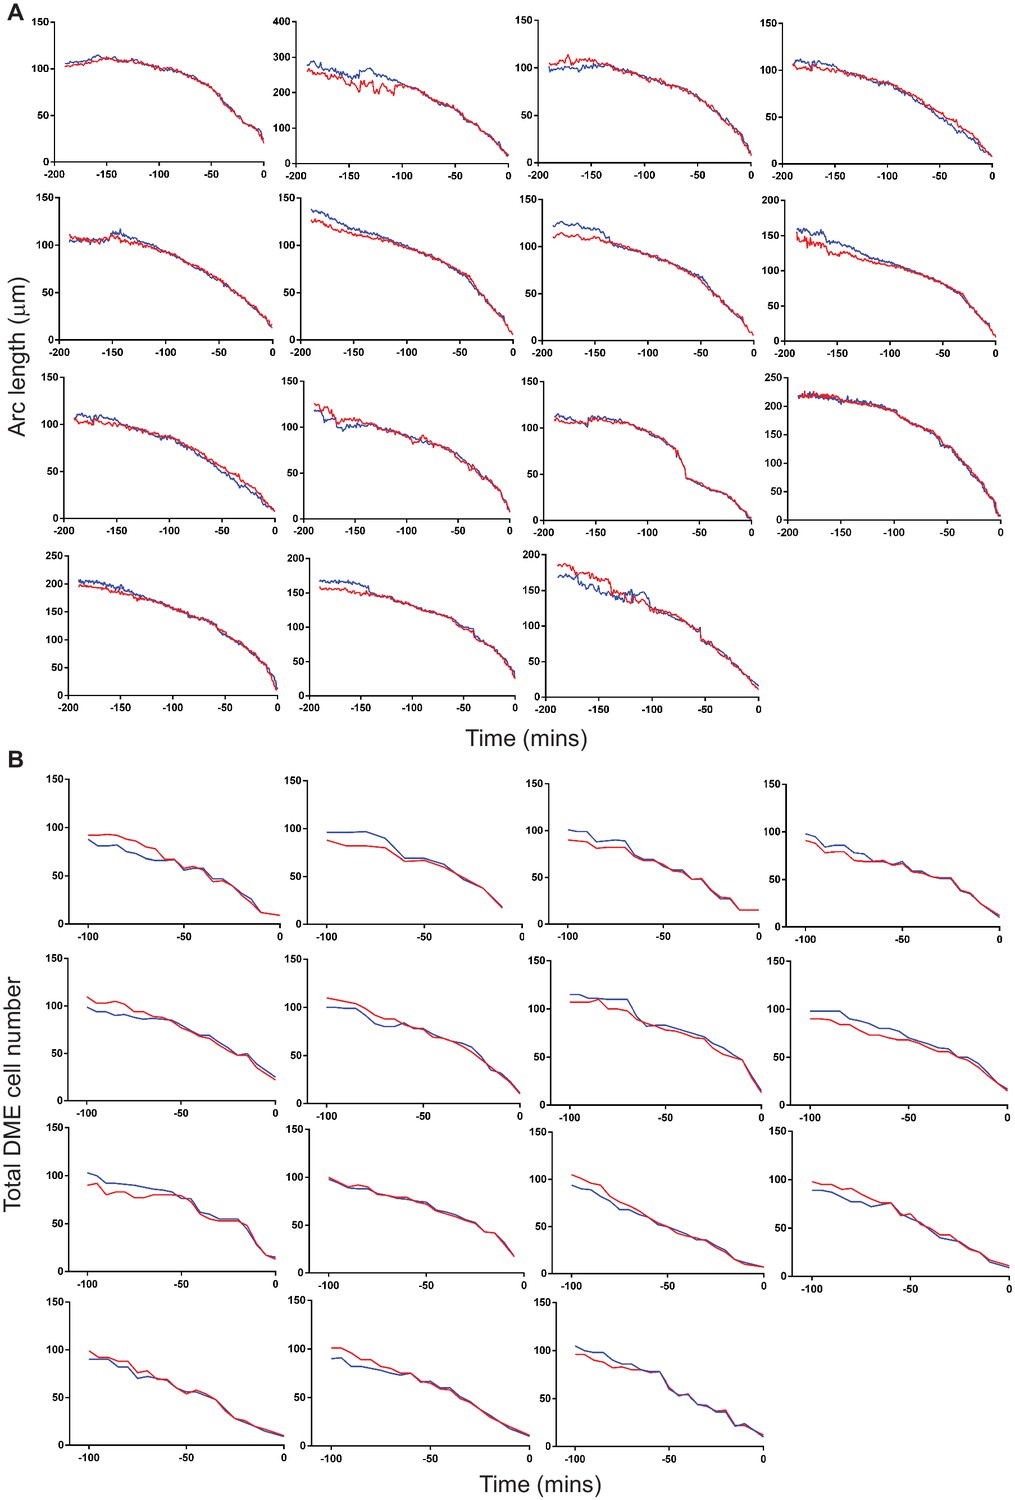
Temporal changes in arc length and total DME cell number.
(A, B) Dynamic changes in total arc length (A) and DME cell number (B) in individual embryos during dorsal closure (t = 0 marks the end of DC; upper arc-red and lower arc-blue).
Figure 1—figure supplement 3
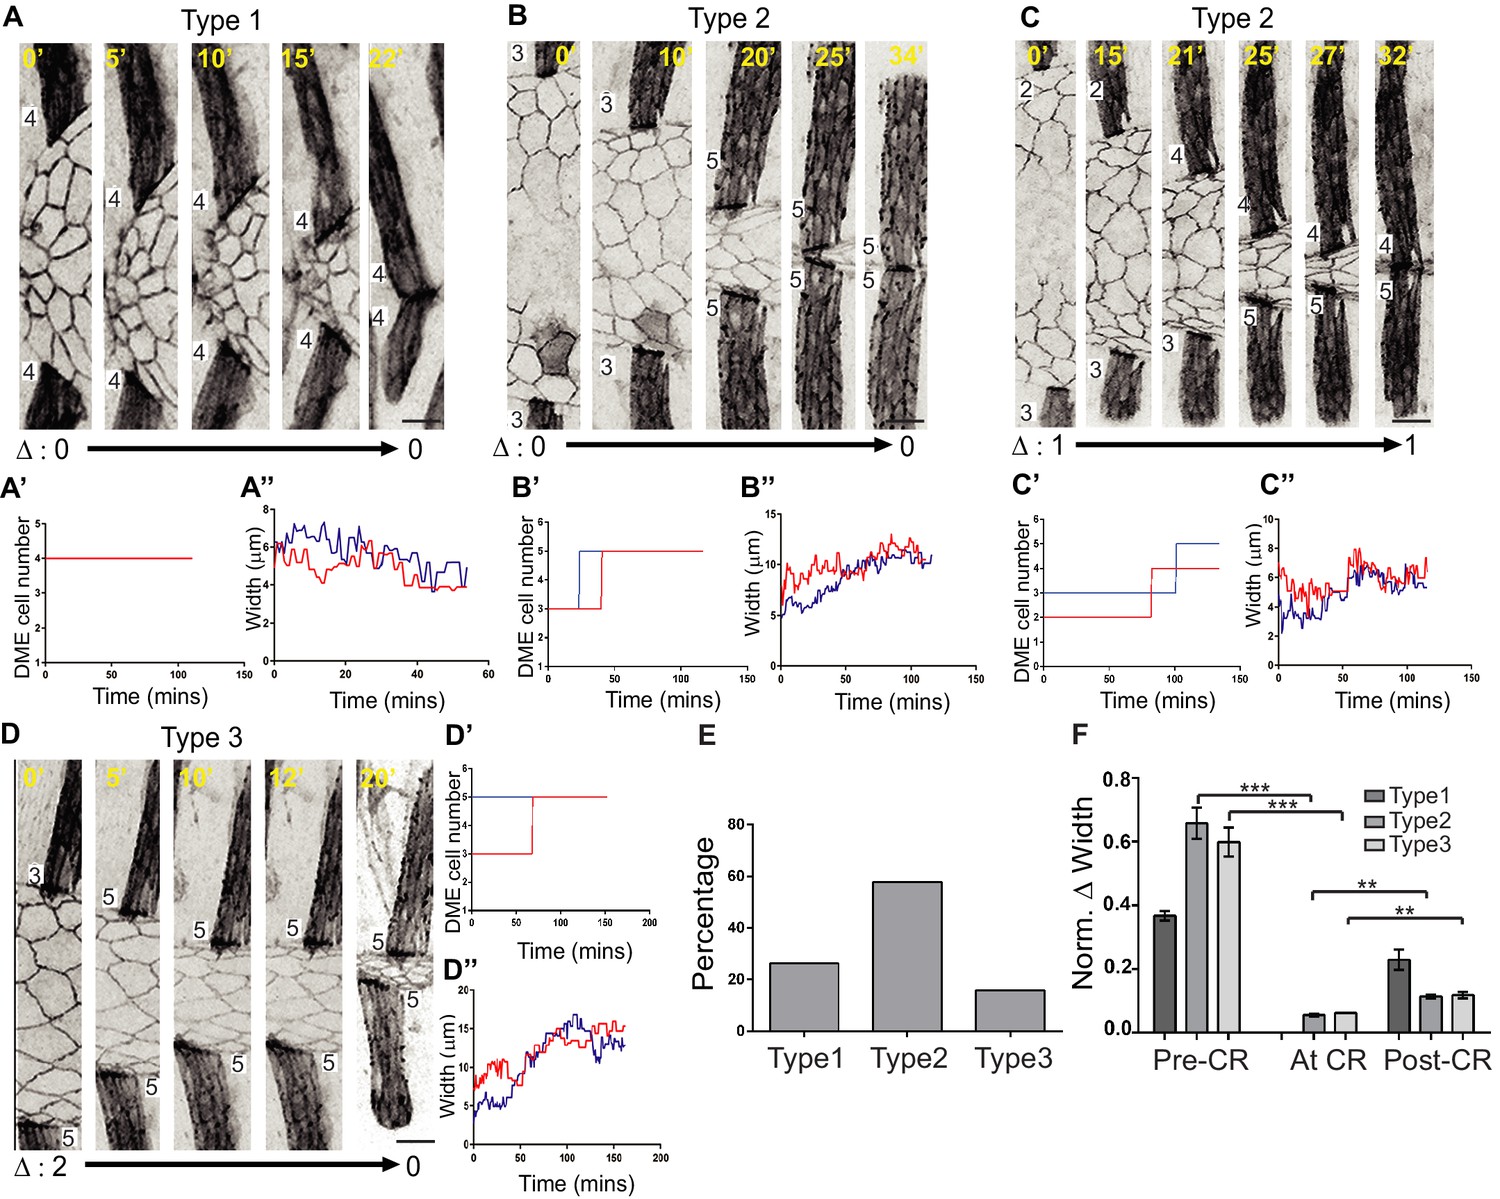
Cell addition to the leading edge coincides with stripe width equalization.
(A–D) Time-lapse images showing the different outcomes of cellular rearrangements in the stripes on DME cell number, and the temporal correlation of these rearrangements (A’–D’) with stripe width equalization (A’’–D’’). Red and blue lines indicate upper and lower arc respectively. (E) Percentage occurrence of the types of cell rearrangements shown in A-C (n = 19 pairs of stripes from six embryos). (F) Contribution of different types of cellular rearrangements (CR) to width parity. Scale bar- 10 µm. (**- p<0.001 and ***- p<0.0001).
Figure 1—video 1
Dynamics of native dorsal closure in embryos expressing UAS Actin GFP in engrailed stripes.
Cell outlines are marked by ECadh GFP. Yellow arrowheads indicate the posterior intercalating cell. Scale bar-20 µm.
Figure 1—video 2
Stripes, marked by UAS Actin GFP, showing different outcomes of cell rearrangement identified at the leading edge (from left to right: Type 1, Type 2, Type two and Type 3).
Yellow arrowheads indicate the posterior intercalating cell. Scale bars-10 µm.
Figure 2 with 5 supplements
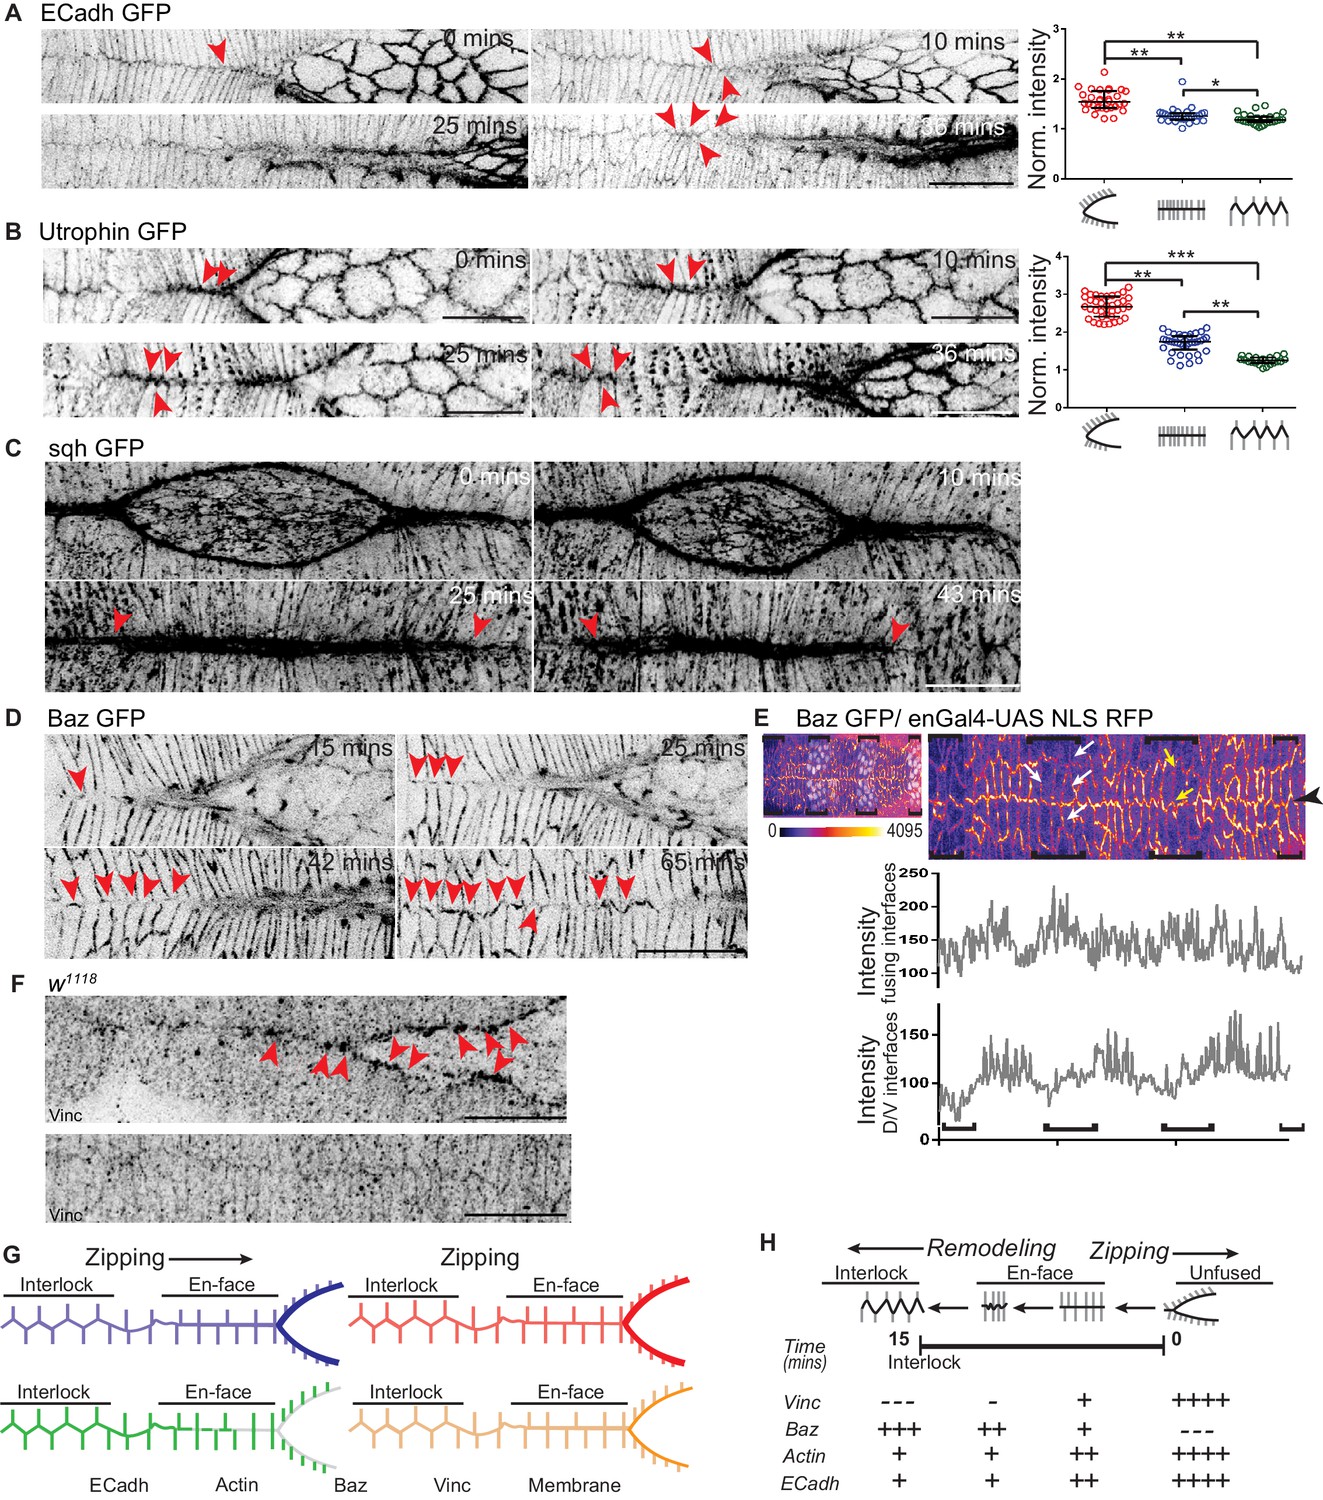
Dynamic changes in the geometry and molecular composition of the fusing interface.
(A, B) High resolution time lapse images of embryos expressing ECadh GFP (A; n = 8 embryos) and Utrophin GFP (B; n = 9 embryos) showing the progressive remodelling of en-face contacts at fusion to an interlocking pattern after fusion at the canthus (red arrowheads). The cluster plots alongside A and B show the normalized intensity of ECadh GFP and Utrophin GFP respectively at the fusing interfaces before, during and after fusion (circles indicate individual data points; black lines indicate median ± range; n = 30 sets of 10 interfaces (from five embryos) for ECadh GFP and 37 sets of 5 interfaces each (from six embryos) for Utrophin GFP; (*- p<0.03, **- p<0.001, ***- p<0.0001)). (C) High resolution time lapse images of embryos expressing sqh GFP (C; n = 3 embryos) showing the intensity receding at the midline some interfaces away from the canthus as the interfaces are interlocked (red arrowheads). (D) High resolution time lapse images of embryos expressing Bazooka GFP (Baz GFP; n = 11 embryos) showing the recruitment of Bazooka upon fusion and its progressive enrichment with interlocking at the fusing front (red arrowheads). (E) Top: Embryo expressing Baz GFP (heat map) and enGal4-UAS NLS RFP (white nuclei) showing differential expression of Bazooka along the D/V interfaces (white arrows) and non-leading edge A/P interfaces (yellow arrows) in stripes (black brackets) compared to interstripes. Bottom: Line intensity profiles of the same image at the fusing interfaces and at the D/V interfaces of DME cells. (F) Fixed preparations showing localization of Vinculin (Vinc) in the DME cells during (top) and after (bottom) fusion in wildtype embryos (n = 8 embryos; red arrowheads show Vinculin enrichment at unfused and en-face contacts). (G) Schematic representation of the dynamic changes in the localization of molecules at the fusing interfaces. (H) Pictorial summary of the dynamics of the molecular composition and its correlation with dynamic modulations of interface geometry. Scale bar- 20 µm.
Figure 2—figure supplement 1

Dynamics of Bazooka and Vinculin localization, interface geometry and actin cytoskeleton organization at the leading edge.
(A) Time lapse images showing Bazooka localization in the DME cells in embryos expressing Baz GFP (n = 11 embryos). (B) Time lapse images of embryos expressing Utrophin GFP and enGal4-UAS NLS RFP (to mark stripes) showing progressive changes in interface geometry (green arrowheads) and Actin dynamics at the leading edge post fusion. (C–D) Live (C) and fixed preparations with orthogonal sections (D) of Vinculin GFP embryos showing Vinculin localization dynamics during fusion. Red arrowheads indicate Vinculin enrichment at the fusing interfaces. Red brackets indicate the midline seam in orthogonal sections. (E,F) Absolute fluorescent intensities of ECadh GFP (E, n = 30 sets of 10 interfaces each from five embryos) and Utrophin GFP (F, n = 37 sets of 5 interfaces from six embryos) at the D/V oriented interfaces before, during and after fusion. (a.u.: arbitrary unit). Scale bar- 20 µm.
Figure 2—video 1
Remodelling of fusing DME interfaces from en-face contacts to an interlocking pattern (yellow arrowheads) visualized in embryos expressing ECadh GFP.
Scale bar-20 µm.
Figure 2—video 2
Actin dynamics during the remodelling of fusing interfaces from en-face contacts to an interlocking pattern (yellow arrowheads) visualized in embryos expressing Utrophin GFP.
Scale bar-20 µm.
Figure 2—video 3
Myosin dynamics during the remodelling of fusing interfaces from en-face contacts to an interlocking pattern (yellow arrowheads) visualized in sqh GFP embryos.
Scale bar-20 µm.
Figure 2—video 4
Dynamic localization of Bazooka at the fusing interfaces during native dorsal closure in embryos expressing genomic Baz GFP.
Yellow arrowheads indicate the appearance of Bazooka at the midline seam. Scale bar 20 µm.
Figure 3 with 2 supplements
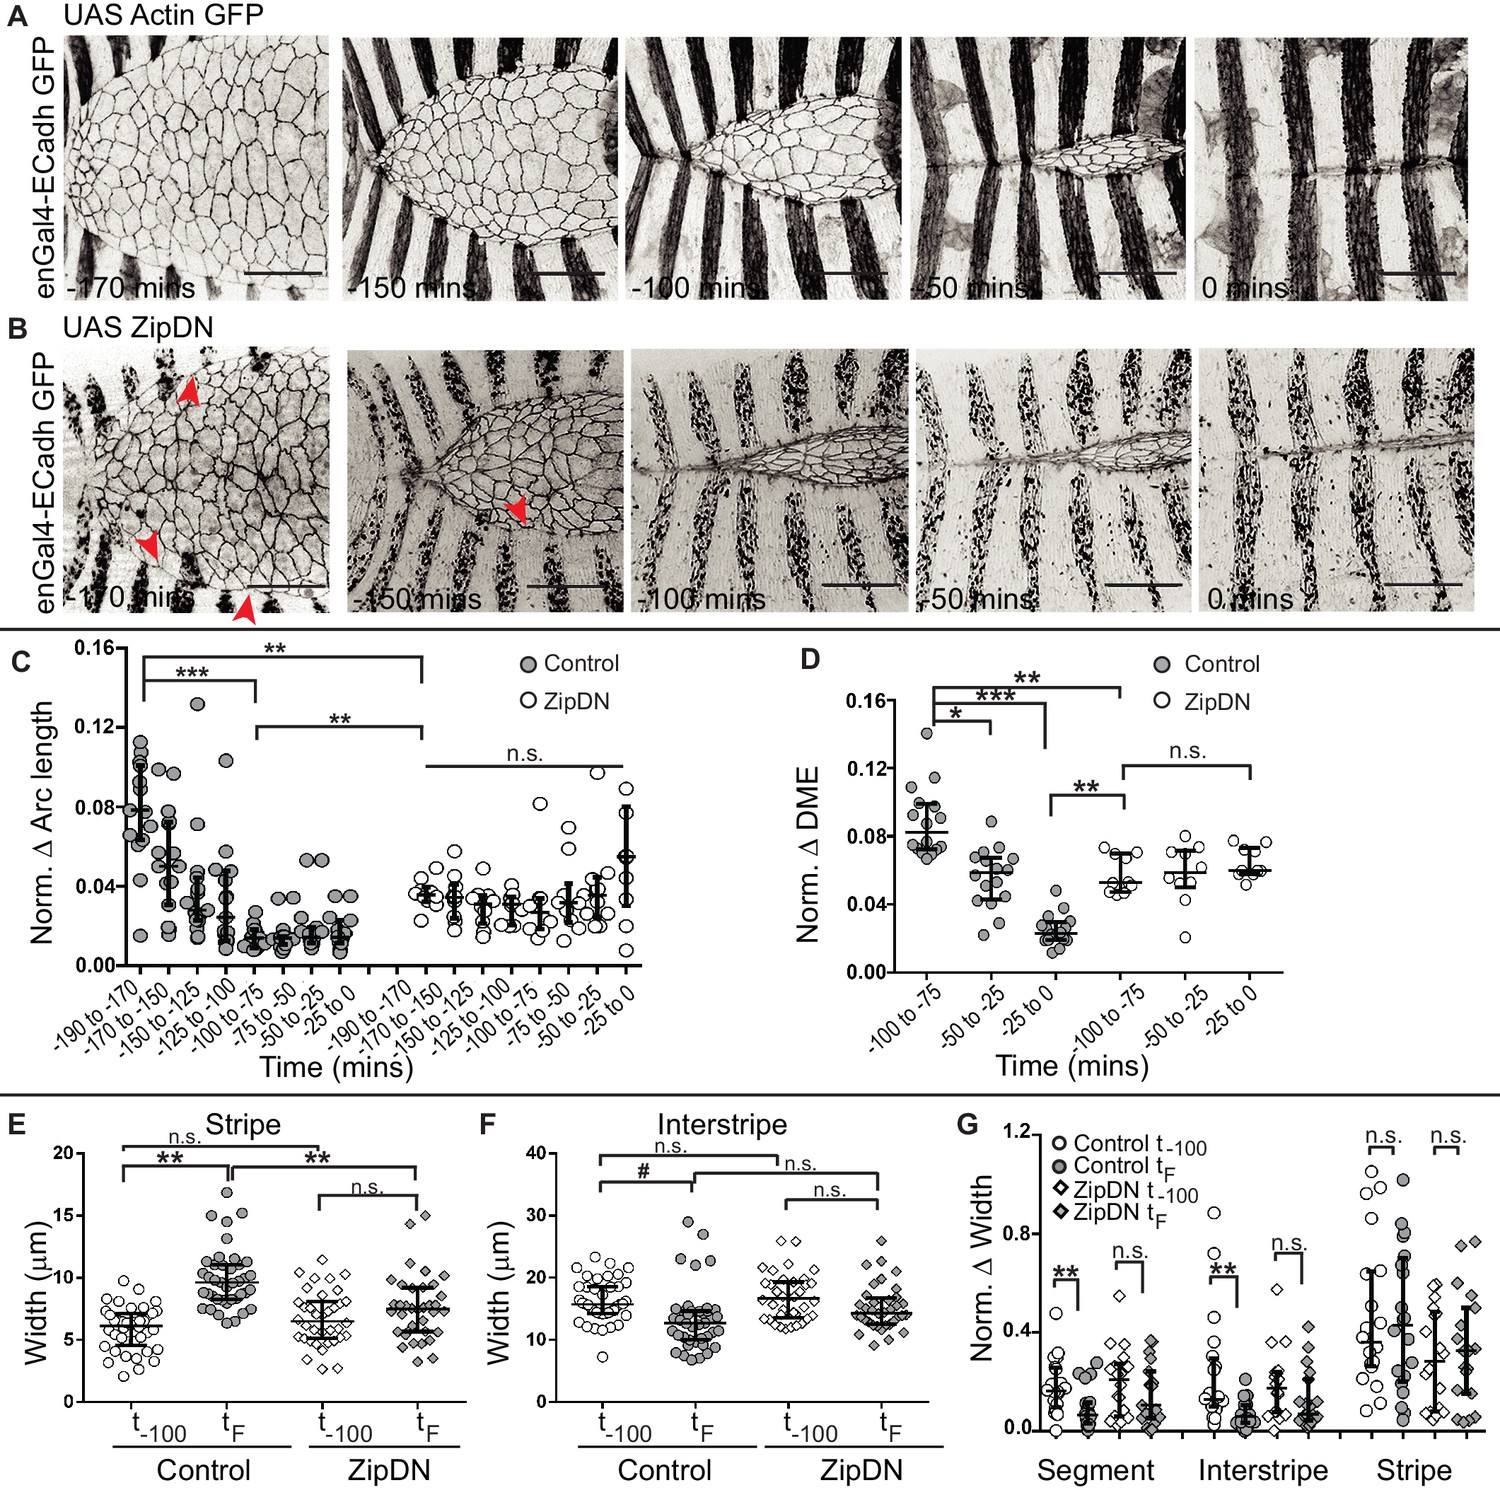
Tissue tension entrains the temporal evolution of fidelity in epithelial fusion.
(A, B) Time-lapse images of dorsal closure in control embryos (A), and in embryos expressing UAS ZipDN driven by enGal4 (B). Red arrowheads denote scalloped leading edge. (C, D) Normalized arc length (C) and DME cell number (D) differences in control and in UAS ZipDN embryos (median ± range, n = 16 for control, n = 10 for UAS ZipDN). (E–F) Absolute widths of central stripes (E) and interstripes (F) of control and UAS ZipDN embryos at t-100 mins and at tF (median ± range, n = 40 stripes/interstripes from 10 embryos). (G) Normalized difference in width of contralateral partners at t-100 and tF (median ± range, n = 20 pairs from segments A2-A3 from 10 embryos). (# - p<0.05, *- p<0.01, **- p<0.001, ***p<0.0001). Scale bar- 40 µm.
Figure 3—figure supplement 1
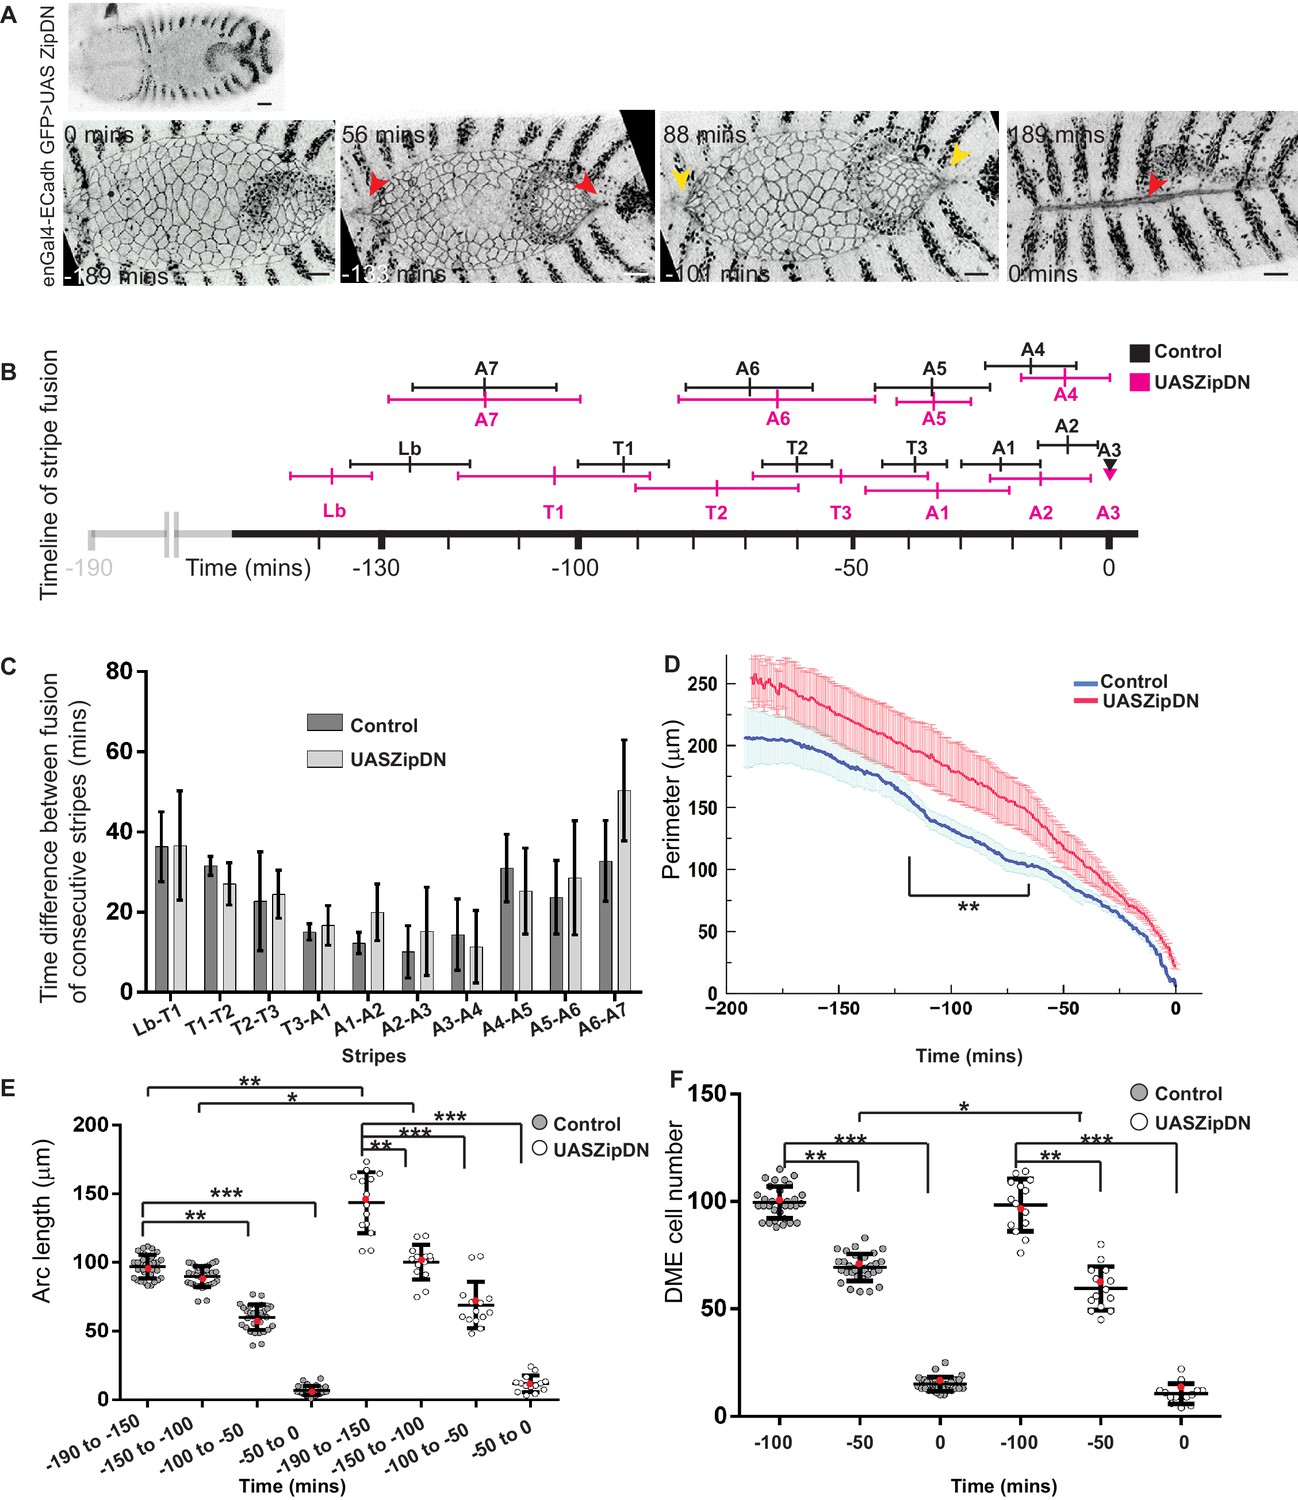
The influence of tension in the epidermis on the dynamics and fidelity of fusion during dorsal closure.
(A) Low (top) and high (bottom) magnification time lapse images of an embryo expressing UAS ZipDN in the engrailed compartment (red arrowheads show the fusion of the Lb, A7 and A3 stripes, yellow arrowheads mark the anterior and posterior canthi). (B) Retrospective timelines depicting the onset and duration of fusion events during dorsal closure in UAS ZipDN and control embryos (mean ± sd, n = 5 embryos). (C) Average time between the fusion of consecutive stripes in control and UAS ZipDN embryos (mean ± sd, n = 5 embryos). (D) Dynamics of the ellipse perimeter (length of upper and lower arcs) in control (blue) and UAS ZipDN (red) embryos over the course of DC (mean ± sem, n = 10 embryos). (E, F) Dynamics of arc length (E) and DME cell number (F) in control and UAS ZipDN embryos during dorsal closure. (Black line shows median ± range, red dot represents mean, n = 16 for control, n = 10 for UAS ZipDN). Scale bar- 20 µm.
Figure 3—video 1
Dynamics of dorsal closure in an embryo expressing ZipDN in stripes.
Cell outlines are marked by ECadh GFP. Scale bar-40 µm.
Figure 4
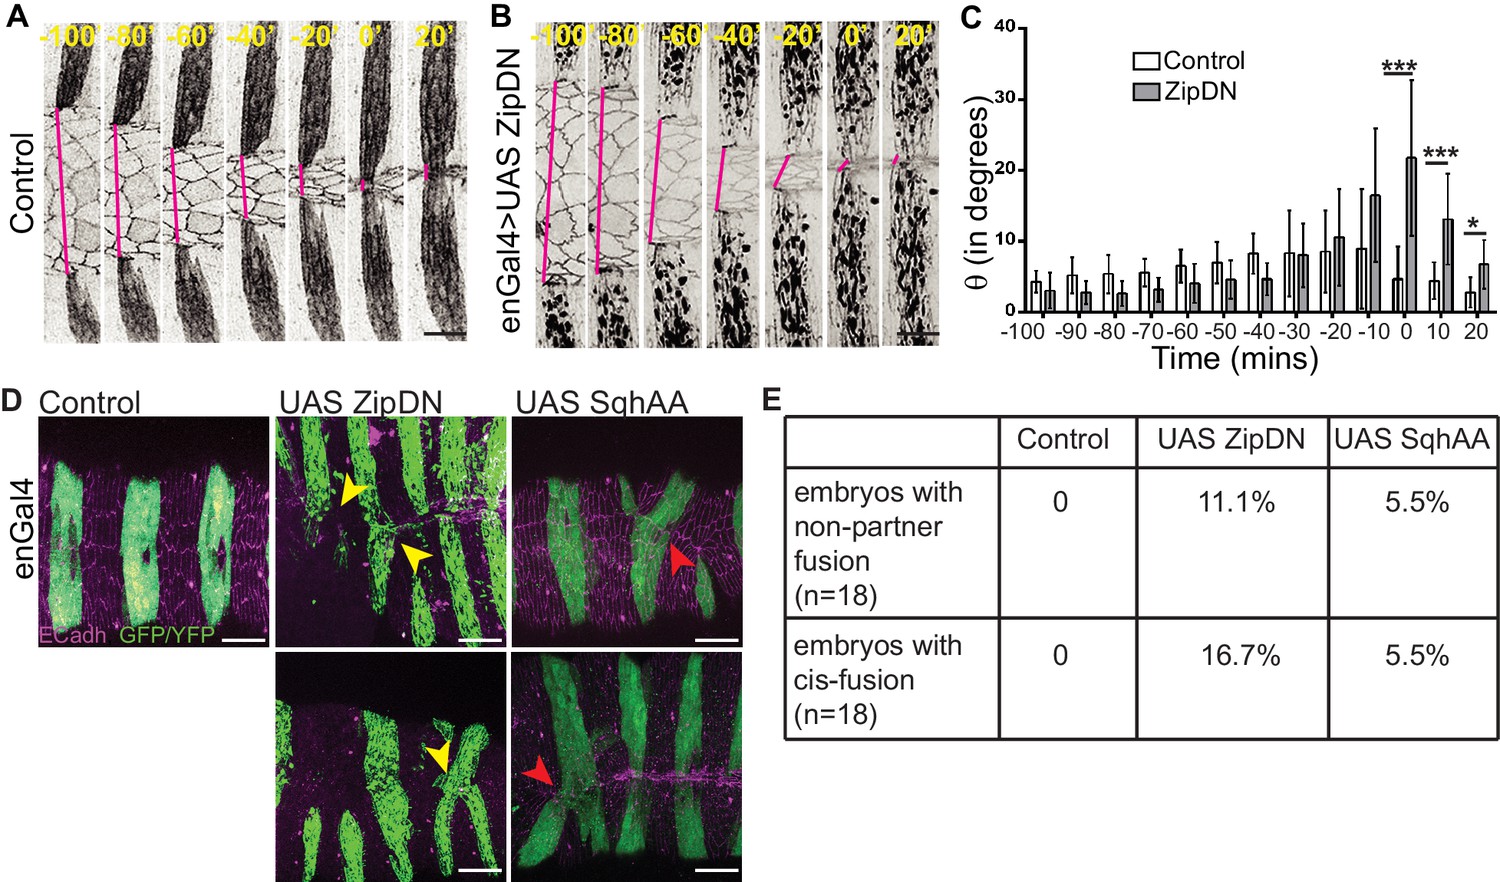
Tissue tension modulates the alignment and matching of contralateral partner stripes at the midline.
(A, B) Time series images showing the positions of the anterior boundaries (red lines) of a pair of contralateral partner stripes from segment A3 in control embryos (A) and in embryos expressing UAS ZipDN (B). Scale bar-10 µm. (C) Temporal evolution of alignment of contralateral partner stripes in control and UAS ZipDN (mean ± sd, n = 10 pairs from 10 embryos, *- p<0.01, ** -p < 0.001, *** -p < 0.0001). (D) UAS ZipDN and UAS SqhAA expressing embryos showing non-partner fusion (yellow arrowheads) and cis-fusion (red arrowheads). Scale bar- 20 µm. (E) Frequency distribution of fusion defects in control embryos, and in embryos overexpressing UAS ZipDN or UAS SqhAA.
Figure 5 with 1 supplement
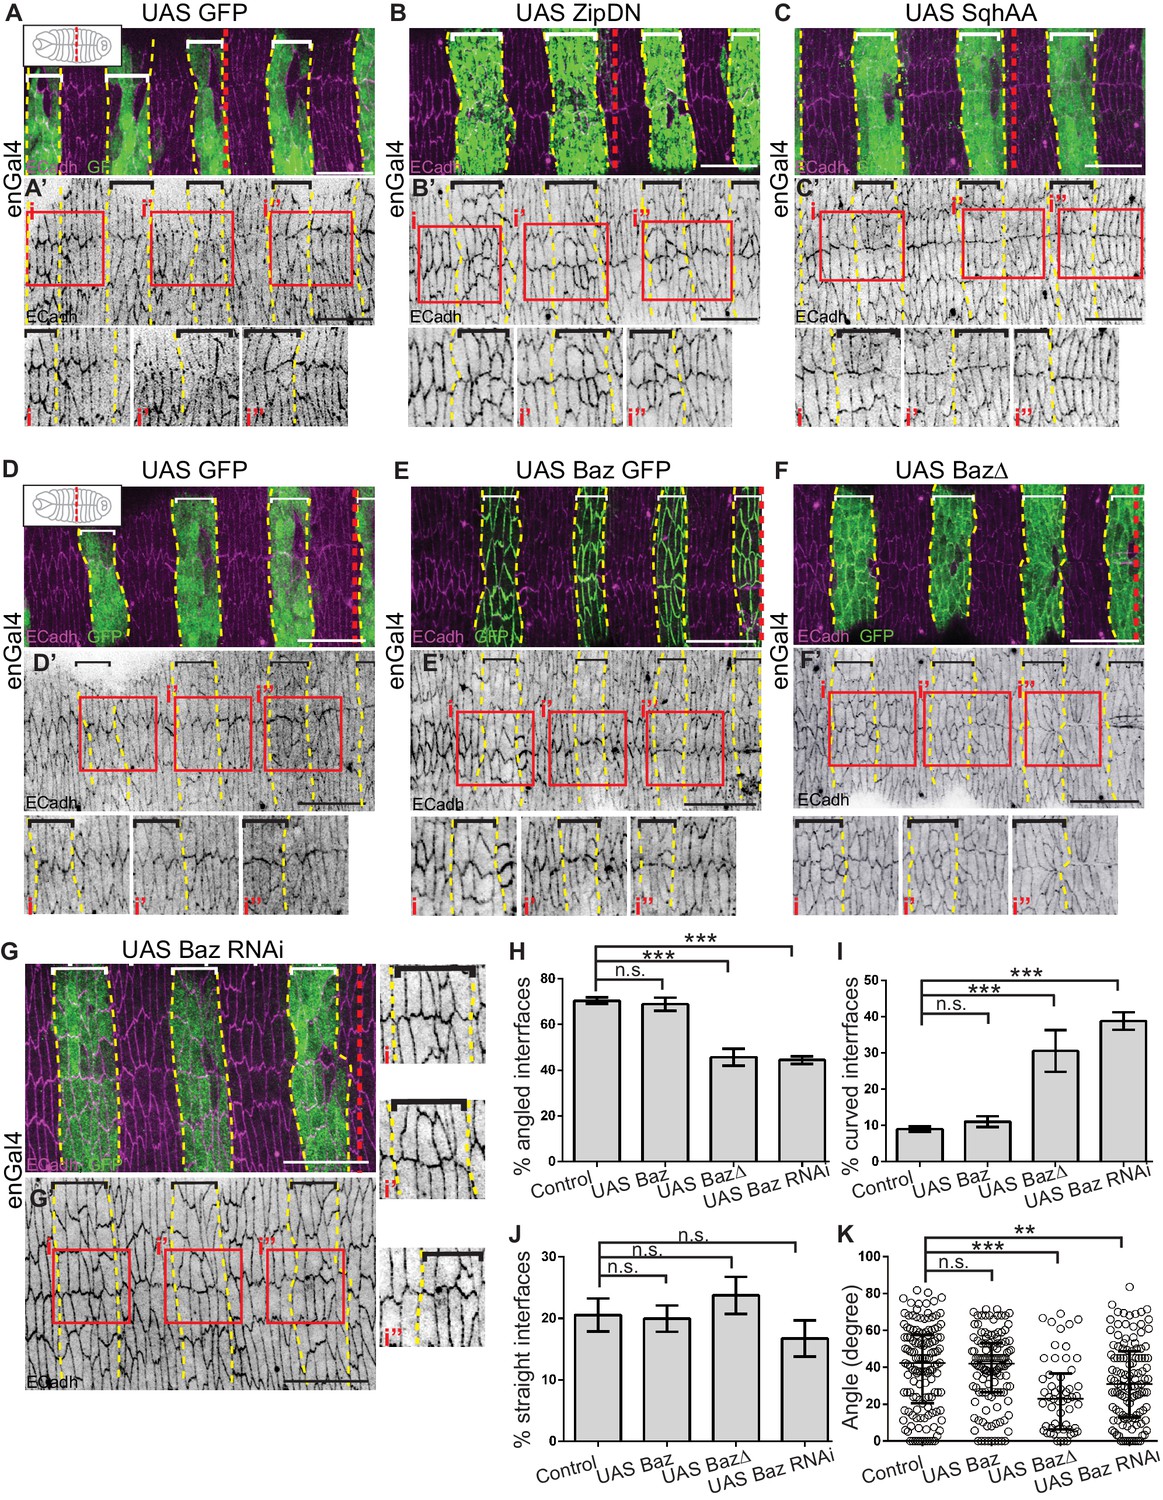
Cytoskeletal tension and Bazooka influence interface remodelling, cell shape and epithelial organisation during fusion.
(A–G) Interface geometries of fusing DME cells and epithelial organisation in embryos expressing UAS GFP (control; A, D n = 8, 14 embryos), UAS ZipDN (B, n = 14 embryos), UAS SqhAA (C, n = 15 embryos), UAS Baz GFP (E, n = 9 embryos), UAS Baz∆ (F, n = 10 embryos) and UAS Baz RNAi (G, n = 14 embryos) after fusion stained for ECadh (magenta) and GFP (marking the engrailed compartment, green). A’- G’ are single channel images showing ECadh localization. Dashed yellow lines mark the boundaries of expressing stripes (bracketed). The dashed red lines in A-G mark the midpoint along the A/P axis (as shown in cartoons inset in A, D). The red boxes in A’-G’ are magnified in i, i’ and i’’. Scale bar- 20 µm. (H–K) Frequency distribution of interface geometries (H–J) and distribution of interface angles (K) of stripe DME cells at the leading edge in embryos expressing UAS GFP (control, n = 135 interfaces, 11 embryos), UAS Baz GFP (n = 123 interfaces, nine embryos), UAS Baz∆ (n = 54 interfaces, seven embryos) and UAS Baz RNAi (n = 126 interfaces, 11 embryos) driven by enGal4. (** -p < 0.01, ***-p < 0.0002).
Figure 5—figure supplement 1
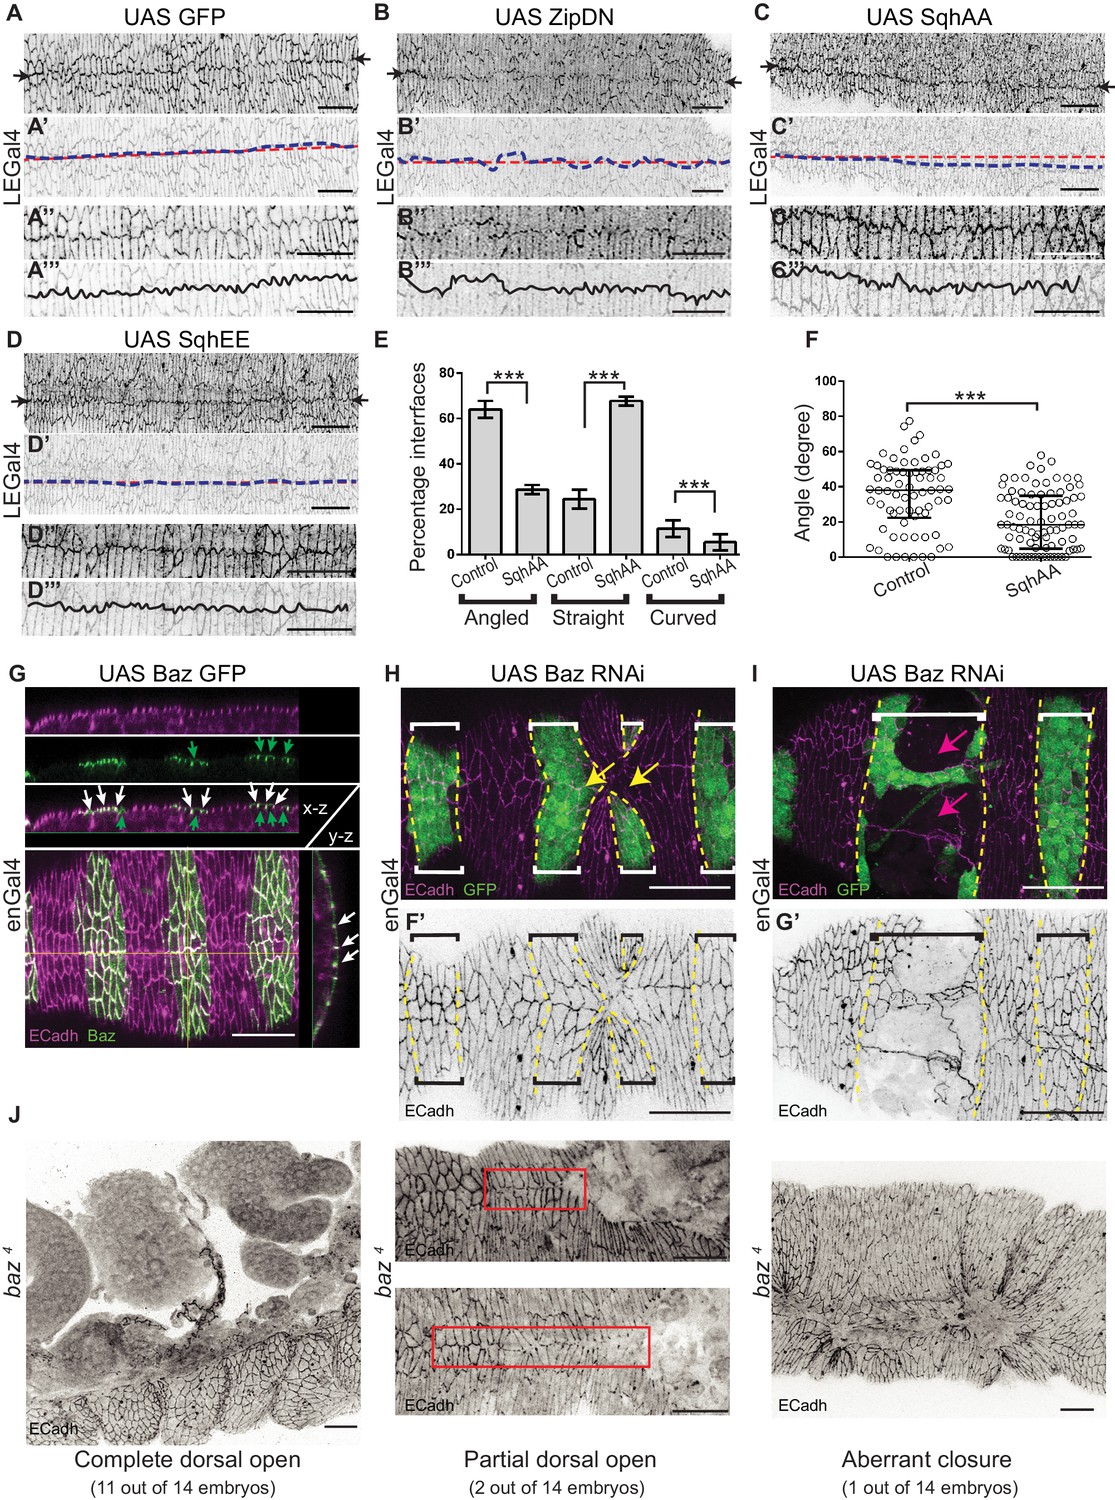
The influence of cytoskeletal tension and Bazooka on interface geometry, epithelial organization and epithelial integrity.
(A–D) Morphology of the midline seam after fusion in control embryos (A, n = 6) and in embryos overexpressing UAS ZipDN (B, n = 12), UAS SqhAA (C, n = 9) and UAS SqhEE (D, n = 6) only in the DME cells using LEGal4, stained for ECadh. (A’–D’) The morphology of the midline seam (blue line) and the A/P axis (red line) drawn on the images in A-D but of reduced opacity. (A’’– D’’) Magnified images of the central regions in A-D showing details of interface morphologies at the seam. (A’’’–D’’’) Line drawings of interface morphologies at the seam (black line) superimposed on the images in A’- D’ but of reduced opacity. (E, F) Frequency distribution of interface geometries (E) and interface angles (F) of stripe DME cells at the leading edge in embryos expressing enGal4 >UAS GFP (control, n = 77 interfaces, seven embryos) and enGal4 >UAS SqhAA (n = 85 interfaces, eight embryos) (*** -p < 0.0001). (G) Orthogonal sections (made along the yellow lines) of an embryo expressing Baz GFP in the stripe showing colocalization (white in image, white arrows) of Bazooka (Baz, green) and ECadh (magenta). Some apical Baz (green) is also observed. (H–I) Embryos expressing UAS Baz RNAi showing aberrant stripe fusion (H, yellow arrow) and epithelial tears (I, magenta arrow). F’-G’ are single channel ECadh images of F-G. Dashed yellow lines mark the boundaries of expressing stripes (bracketed). (J) Different types of dorsal closure defects and interface morphologies (red boxes) observed in baz4 mutant homozygous embryos. Scale bar- 20 µm.
Figure 6 with 6 supplements
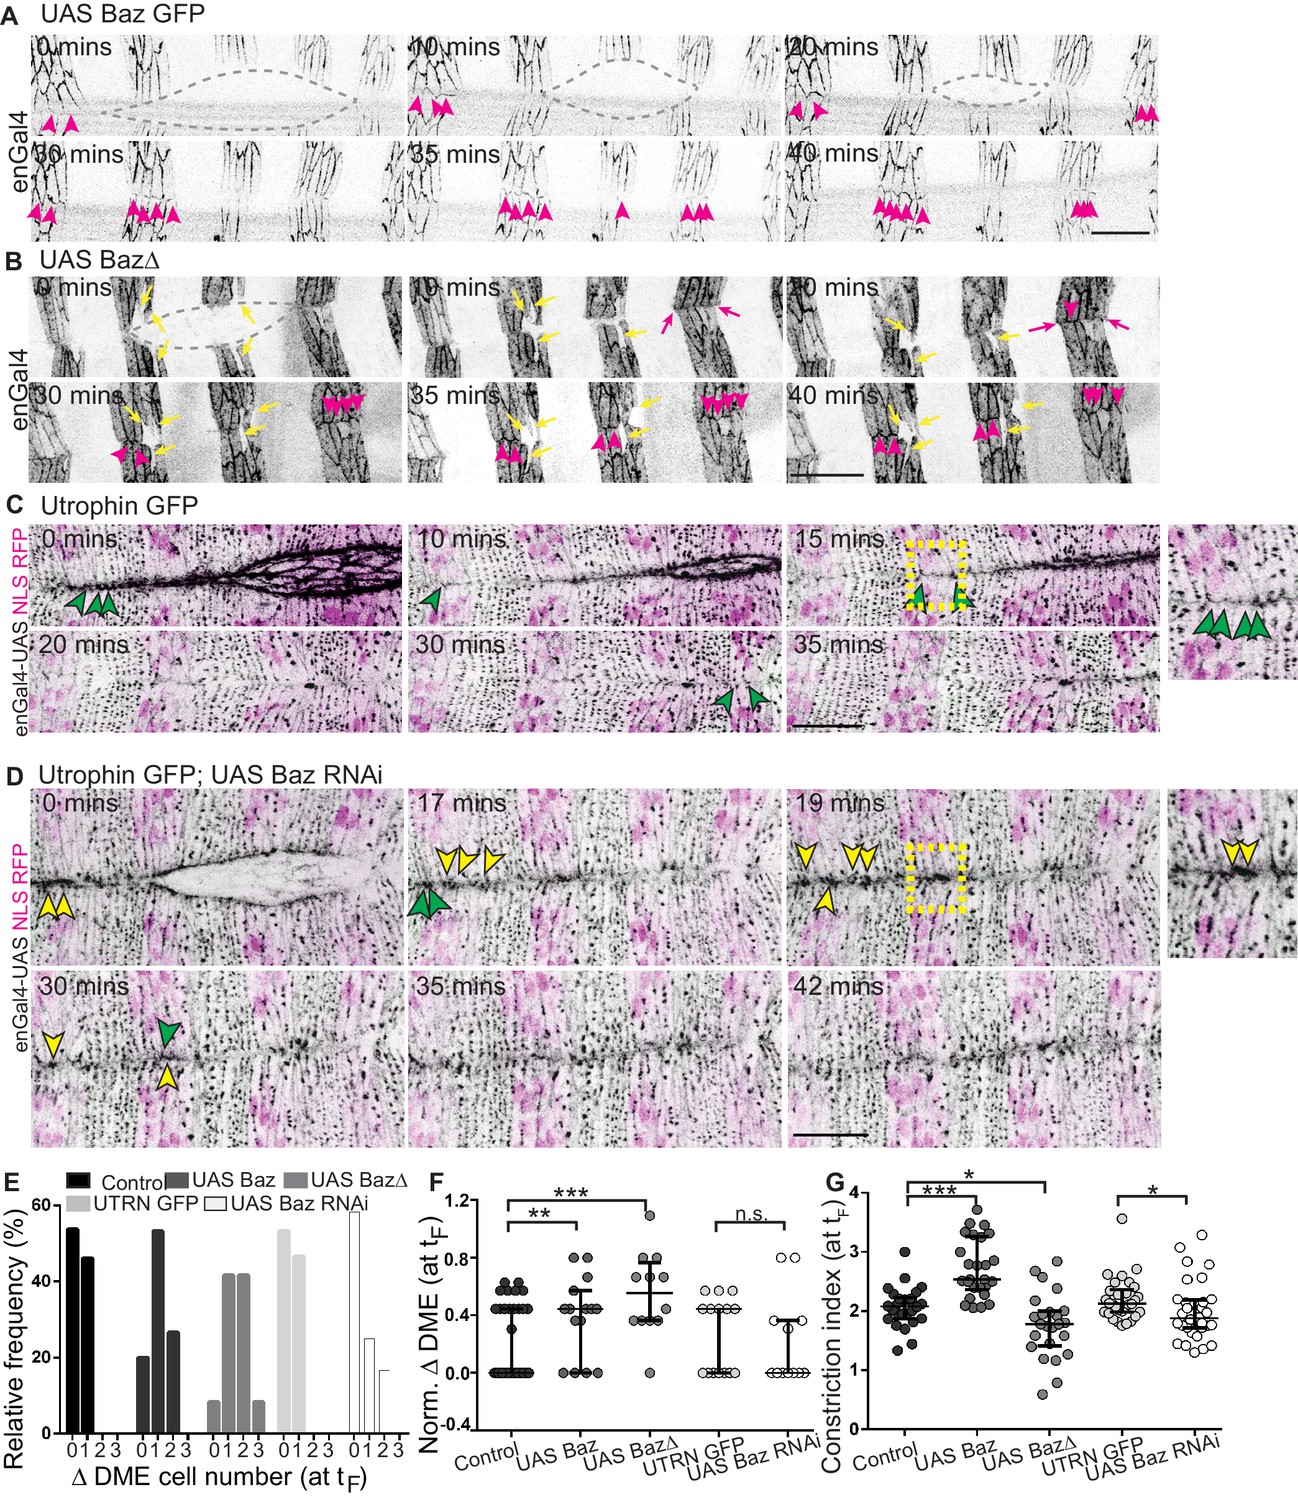
Bazooka localizes at newly formed junctions and influences interface remodelling and fusion fidelity.
(A–D) Time-lapse images of embryos expressing UAS Baz GFP (A, n = 6 embryos), UAS Baz∆ (B, n = 6 embryos), UAS NLS RFP alone (C, n = 6 embryos) or UAS Baz RNAi and UAS NLS RFP (D, n = 7 embryos) in the stripes. Embryos in C, D also express Utrophin GFP. Grey broken lines in A, B mark the dorsal opening. Magenta arrowheads in A, B show Bazooka localization at the newly formed contacts between epithelial cells from the opposing flanks; magenta arrows (in B) indicate stripe overhangs after fusion and yellow arrows (in B) indicate improperly positioned mixer cells along the A/P axis. Green and yellow arrowheads in C, D indicate respectively, the dynamics of interface remodelling and of Utrophin GFP, magnified in the insets provided alongside (region magnified is marked by the dashed yellow squares). (E, F) Absolute (E) and normalized differences (F) in DME cell number between contralateral partner stripes at fusion (tF) of UAS Actin GFP (control), UAS Baz GFP, UAS Baz∆, Utrophin GFP/enGal4-UAS NLS RFP (UTRN GFP, control) and of UAS Baz RNAi (with Utrophin GFP/enGal4-UAS NLS RFP) expressing embryos (n = 30 pairs of stripes from 10 embryos for control, 15 pairs of stripes from five embryos for UAS Baz GFP, 12 pairs of stripes from four embryos for UAS Baz∆, 15 pairs of stripes from five embryos for UTRN GFP and 15 pairs of stripes from six embryos for UAS Baz RNAi). (G) Constriction index of stripes at fusion in control (enGal4 >UAS Actin GFP, n = 26 stripes from four embryos), enGal4 >UAS Baz GFP (n = 26 stripes from four embryos), enGal4 >UAS Baz∆ (n = 24 stripes from four embryos), UTRN GFP (n = 30 stripes from five embryos) and enGal4 >UAS Baz RNAi (n = 30 stripes from five embryos). (median ±range; *- p<0.01, **- p<0.001, ***- p<0.0001). Scale bar- 20 µm.
Figure 6—figure supplement 1
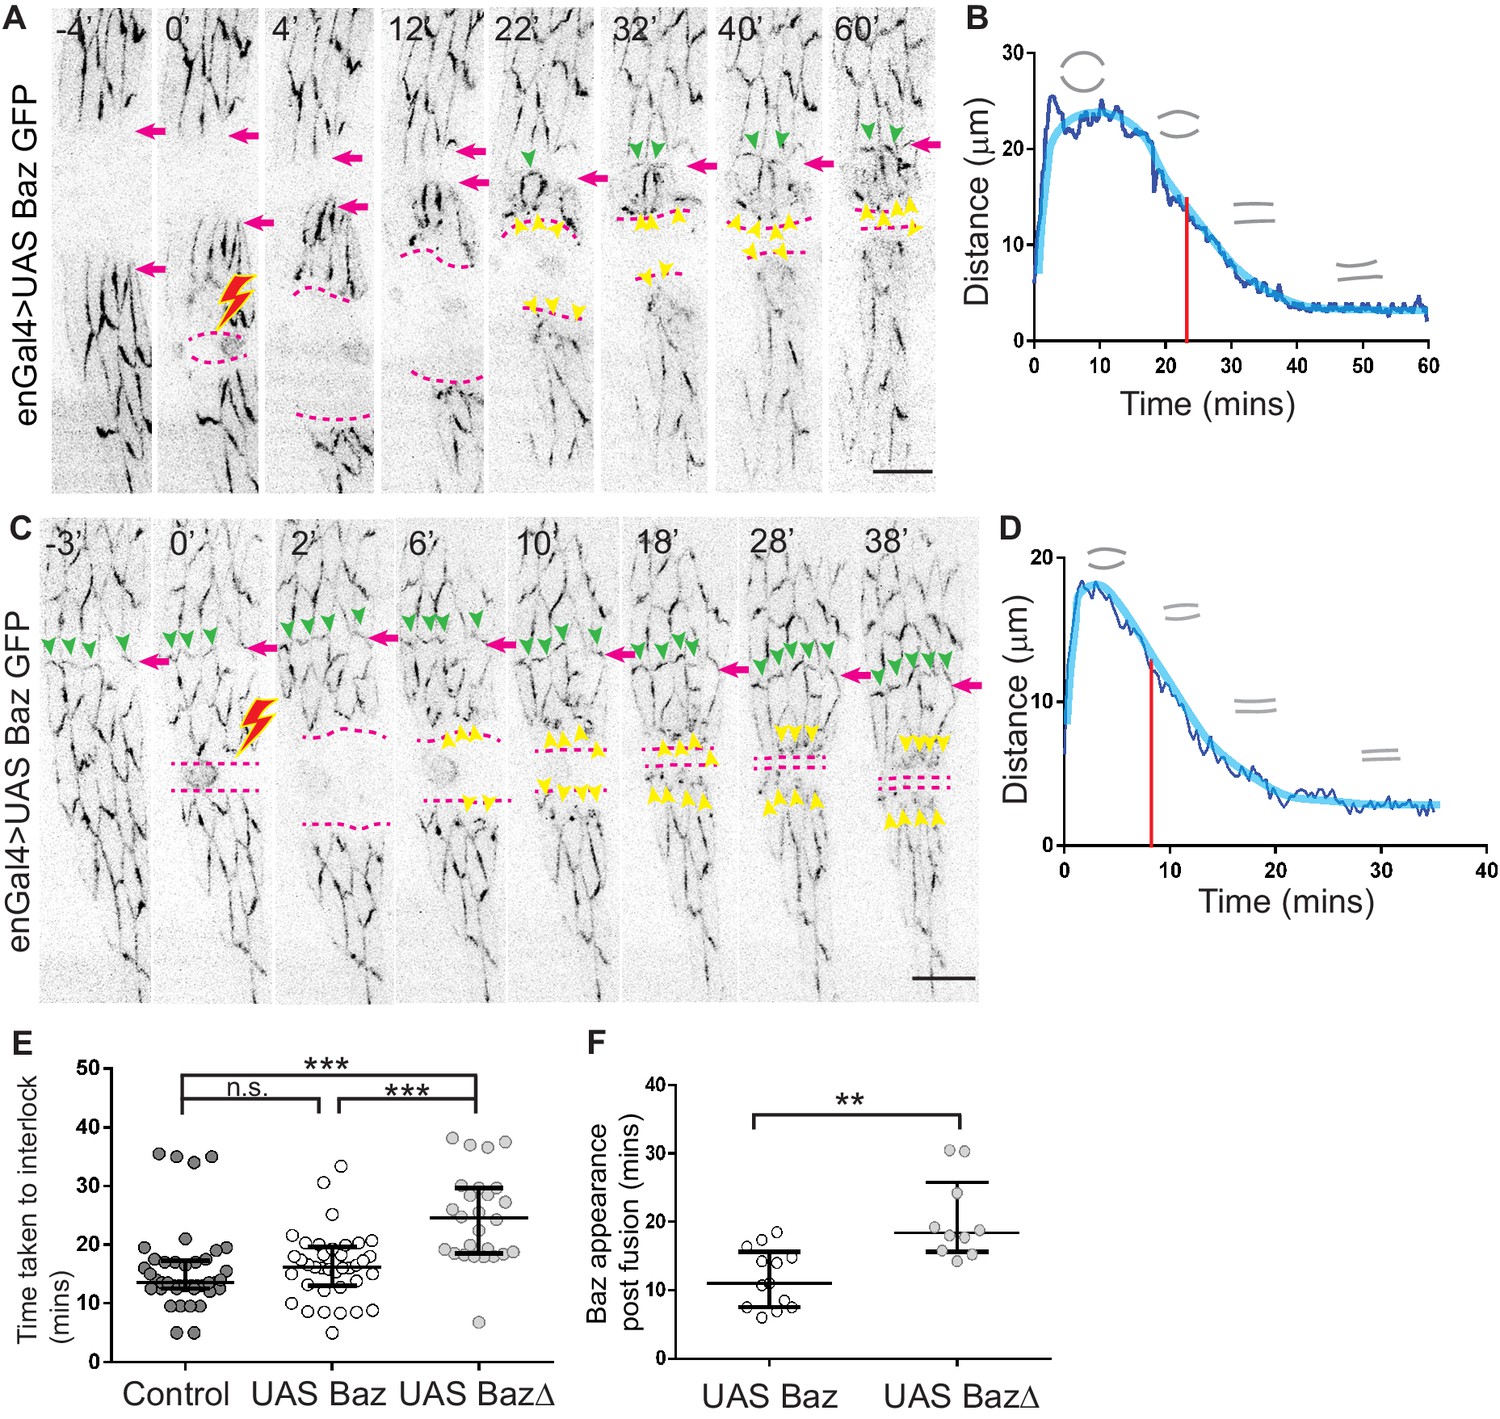
Dynamics of Bazooka recruitment and its influence on interface geometry.
(A, C) Time lapse images of an enGal4 >UAS Baz GFP embryo in which an engrailed stripe has been ablated prior to (A), or after fusion (C). 0’ marks the time of ablation and the lightning symbol marks the position of the cut. The broken magenta lines indicate the boundary of the cut after recoil and magenta arrows indicate the dorsal seam from the fusion of the epidermal flanks during dorsal closure. The green arrowheads indicate Baz appearance at en-face contacts and yellow arrowheads indicate Baz appearance at the wound margin. (B, D) Representative plots showing the tissue recoil upon ablation of stripes (B, pre-fusion and D, post-fusion). The red line indicates the time of appearance of Baz punctae at the wound margins and the grey outlines indicate wound margin geometry. Scale bar- 10 µm. (E) Time taken for interlocking of the newly formed interfaces in Baz GFP (n = 41 interfaces from five embryos), enGal4 >UAS Baz GFP (n = 47 interfaces from four embryos) and enGal4 >UAS Baz∆ (n = 26 interfaces from four embryos) embryos. (F) Time taken for Baz GFP appearance at the newly formed interfaces after fusion in enGal4 >UAS Baz GFP (n = 13 stripe pairs from four embryos) and enGal4 >UAS Baz∆ (n = 10 stripe pairs from four embryos). (median ±range, **- p<0.001, ***- p<0.0001).
Figure 6—video 1
Dynamics of Bazooka localisation, stripe fusion and junction resolution in stripes expressing Baz GFP.
The fusing central stripes are shown in A. A single fusing central stripe pair is shown in B. Yellow arrowheads in A indicate the appearance of Bazooka at the midline seam. White arrows in B mark the anterior and posterior ends of the stripe in each flank. Scale bar-20 µm.
Figure 6—video 2
Dynamics of Bazooka localisation, stripe fusion and junction remodelling in stripes expressing BazΔ.
White arrowheads indicate the appearance of Bazooka at the midline seam. Scale bar-20 µm.
Figure 6—video 3
Dynamics of stripe fusion visualised in embryos expressing Utrophin GFP and enGal4-UAS NLS RFP.
(A) Actin clearance from the fusing interfaces during the transition from en-face contacts to an interlocking pattern (yellow arrowheads) and (B) segment compartment boundary (stripe) alignment (red arrows). Scale bar-20 µm.
Figure 6—video 4
Dynamics of stripe fusion, junction resolution and actin organization at the leading edge in embryos expressing Baz RNAi in stripes and Utrophin GFP.
Yellow arrowheads indicate the sustained high level of Utrophin GFP at the fusing interfaces after fusion. Scale bar 20 µm.
Figure 6—video 5
Laser ablation of a Baz GFP overexpressing stripe prior to (left two panels) and after fusion (right).
Yellow arrowheads indicate Bazooka at the wound margins; white arrows indicate wound healing accompanied by cell interlocking. Scale bar 10 µm.
Figure 7
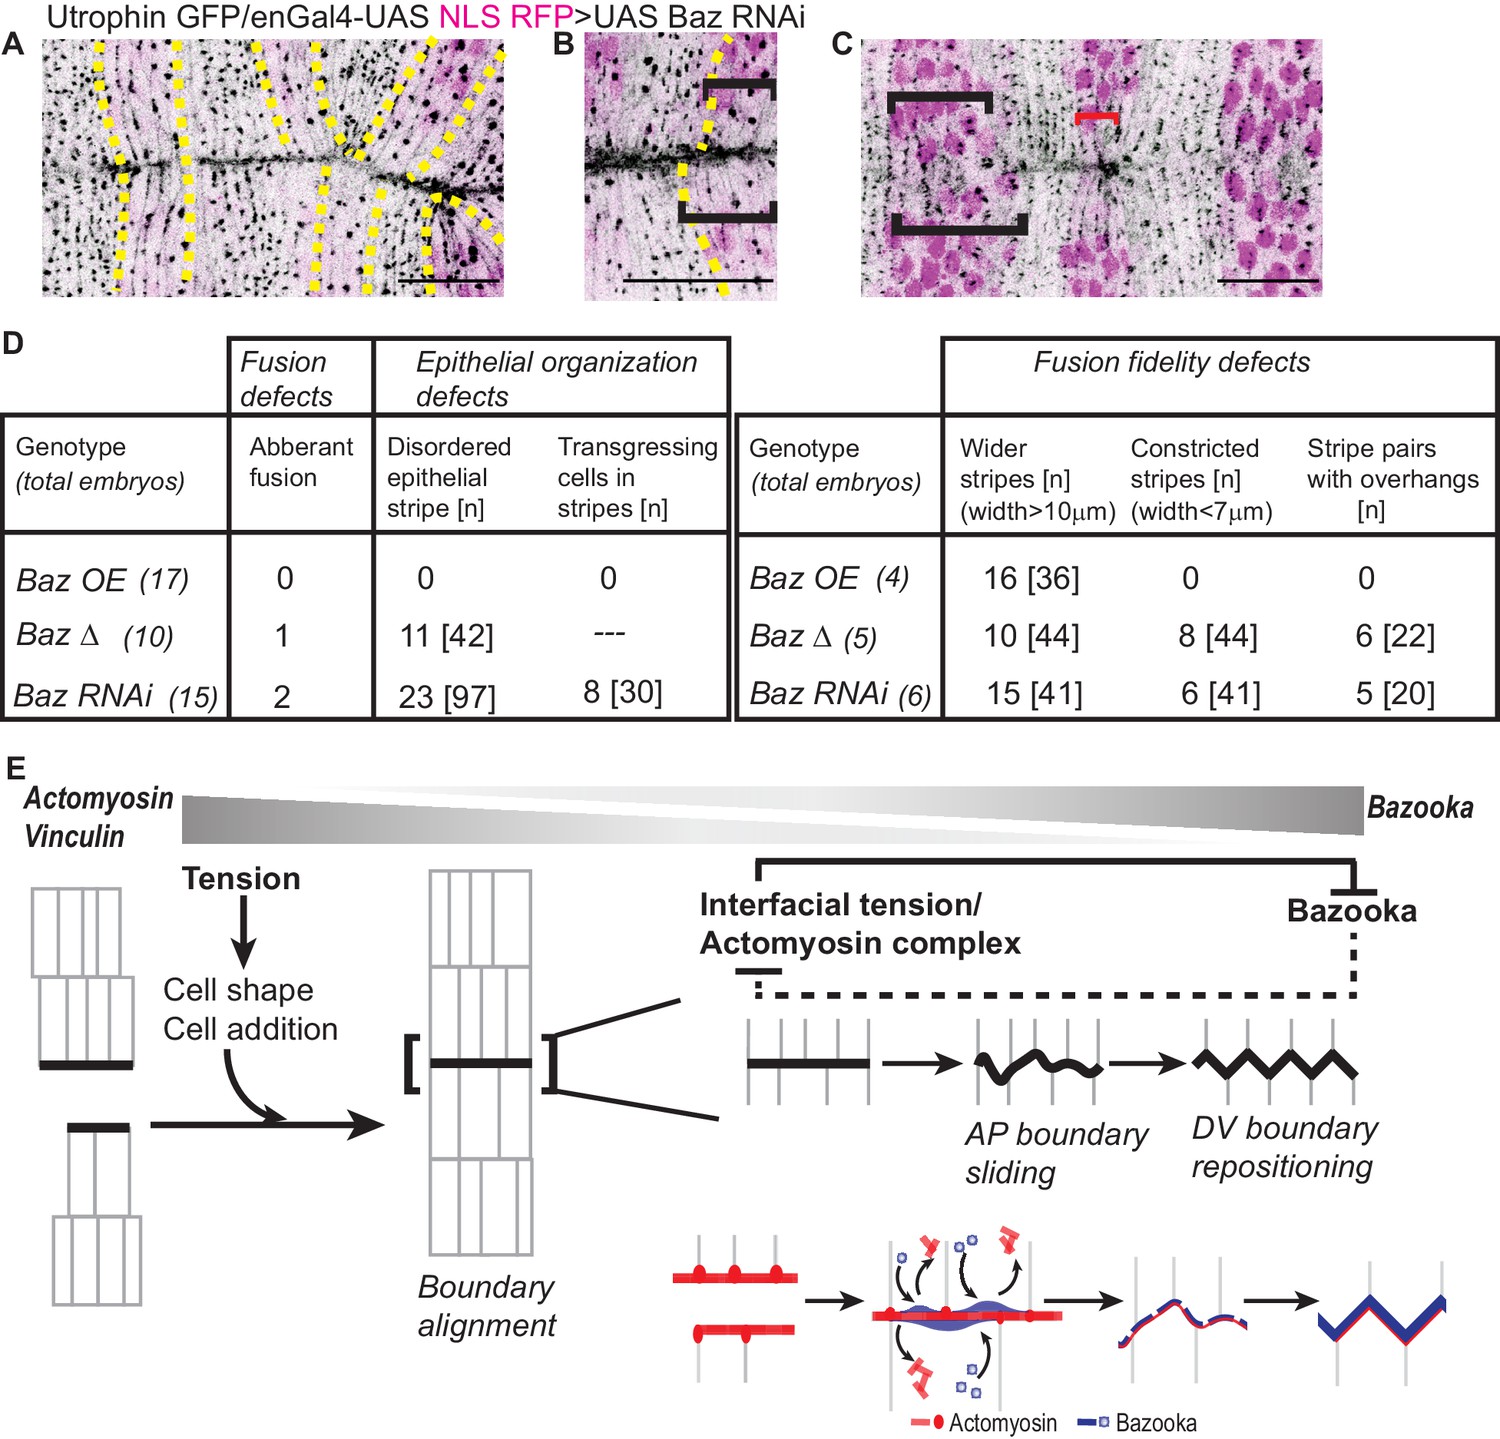
Bazooka downregulation reduces fusion fidelity and epithelial order.
(A–C): Post fusion images of the dorsal midline from movies of embryos expressing UAS Baz RNAi driven by enGal4 (embryos also express Utrophin GFP and UAS NLS RFP) showing abnormalities in fusion fidelity including aberrant fusion (A, yellow dashed lines indicate the stripes), overhangs between contralateral partners at fusion (B, dashed yellow line marks the anterior boundary of the stripe) and stripe width disparities (C, black brackets indicate wider stripes and red bracket indicates constricted stripes). Scale bar- 20 µm. (D) Prevalence of defects in fusion, fusion fidelity and epithelial organization observed in the Bazooka perturbations tested. (E) Graphic summary of the cellular, subcellular, molecular and physical changes that enable interface remodelling and ensure fusion fidelity and epithelial continuity.
Tables
Key resources table
| Reagent type (species) or resource | Designation | Source or reference | Identifiers | Additional information |
|---|---|---|---|---|
| Genetic reagent | ||||
| D. melanogaster: ubi::ECadherin GFP | Drosophila stock | Oda and Tsukita, 2001. Kind gift of Tadashi Uemura, KyotoUniversity, Japan | Flybase_FBtp0014096 | |
| D. melanogaster: Bazooka GFP | Drosophila stock | Buszczak et al., 2007 Bloomington DrosophilaStock Centre (BDSC) | BDSC_51572 FlybaseFBst0051572 | |
| D. melanogaster: y w sqhAX3; sqh GFP | Drosophila stock | Bloomington Drosophila Stock Centre (BDSC) | BDSC_57144 Flybase_FBst0057144 | |
| D. melanogaster: sqh::Utrophin GFP | Drosophila stock | Rauzi et al., 2010.Made by Thomas Lecuit,IBDM, Marseille, France, obtained from Richa Rikhy,IISER Pune, India | Flybase_FBal0270167 | |
| D. melanogaster: UAS ZipperDN YFP | Drosophila stock | Dawes-Hoang et al., 2005.Kind gift of Andrea Brand, University of Cambridge, UK | Flybase_FBtp0021364 | |
| D. melanogaster: UAS SqhAA | Drosophila stock | Jordan and Karess, 1997. Bloomington Drosophila Stock Centre (BDSC) | BDSC_64114 Flybase_FBst0064114 | |
| D. melanogaster: UAS Bazooka GFP | Drosophila stock | Benton and St Johnston, 2003.Kind gift of Daniel StJohnston, University of Cambridge University, UK | Flybase_FBtp0017662 | |
| D. melanogaster: UAS Bazooka GFPΔ969–1464 | Drosophila stock | Krahn et al., 2010. Kind gift of Richa Rikhy,IISER Pune, India | Flybase_FBtp005 850 | |
| D. melanogaster: UAS Actin5C GFP | Drosophila stock | Bloomington Drosophila Stock Centre (BDSC) | BDSC_9257 Flybase_FBst0009257 | |
| D. melanogaster: UAS Bazooka RNAi | Drosophila stock | Weng and Wieschaus, 2017.Bloomington Drosophila Stock Centre (BDSC) | BDSC_35002 Flybase_FBst0035002 | |
| D. melanogaster: engrailedGal4 | Drosophila stock | Bloomington Drosophila Stock Centre (BDSC) | BDSC_30564 Flybase_FBst0030564 | |
| D. melanogaster: w1118 | Drosophila stock | Bloomington DrosophilaStock Centre (BDSC) | BDSC_5905 Flybase_FBst0005905 | |
| D. melanogaster: enGal4-ubi::ECadherin GFP | Drosophila stock | Recombinant, this study | N/A | |
| D. melanogaster: enGal4-UAS GFP | Drosophila stock | Recombinant, this study | N/A | |
| D. melanogaster: enGal4-UAS NLS RFP | Drosophila stock | Bloomington DrosophilaStock Centre (BDSC) | BDSC_30557 Flybase_FBst0030557 | |
| D. melanogaster: Vinculin GFP | Drosophila stock | Vienna Drosophila Resource Centre (VDRC) | v318227 Flybase_FBst0491774 | |
| D. melanogaster: sqh::Utrophin GFP; UAS Baz RNAi | Drosophila stock | This study | ||
| D. melanogaster: baz4 | Drosophila stock | Bloomington Drosophila Stock Centre (BDSC) | BDSC_23229 Flybase_FBst0023229 | |
| D. melanogaster: UAS SqhEE | Drosophila stock | Bloomington DrosophilaStock Centre (BDSC) | BDSC_64411 Flybase_FBst0064411 | |
| D. melanogaster: LEGal4 | Drosophila stock | Bloomington Drosophila Stock Centre (BDSC) | BDSC_58801 Flybase_FBst0058801 | |
| Antibodies | ||||
| Anti GFP A11122 | Primary | Invitrogen | AB_221569 | |
| DCAD2 (Anti ECadherin) | Primary | DSHB | AB_528120 | |
| Anti Vinculin N19 (SC7649) | Primary | Santa Cruz Biosciences | AB_2288413 |
Additional files
-
Transparent reporting form
- https://doi.org/10.7554/eLife.41091.028
Download links
A two-part list of links to download the article, or parts of the article, in various formats.
Downloads (link to download the article as PDF)
Open citations (links to open the citations from this article in various online reference manager services)
Cite this article (links to download the citations from this article in formats compatible with various reference manager tools)
Cytoskeletal tension and Bazooka tune interface geometry to ensure fusion fidelity and sheet integrity during dorsal closure
eLife 8:e41091.
https://doi.org/10.7554/eLife.41091


