Nephron progenitor commitment is a stochastic process influenced by cell migration
- Murdoch Children's Research Institute, Australia
- University of Melbourne, Australia
- The University of Queensland, Australia
- Cincinnati Children's Hospital Medical Center, University of Cincinnati College of Medicine, United States
- The University of Melbourne, Australia
Figures
Figure 1 with 1 supplement
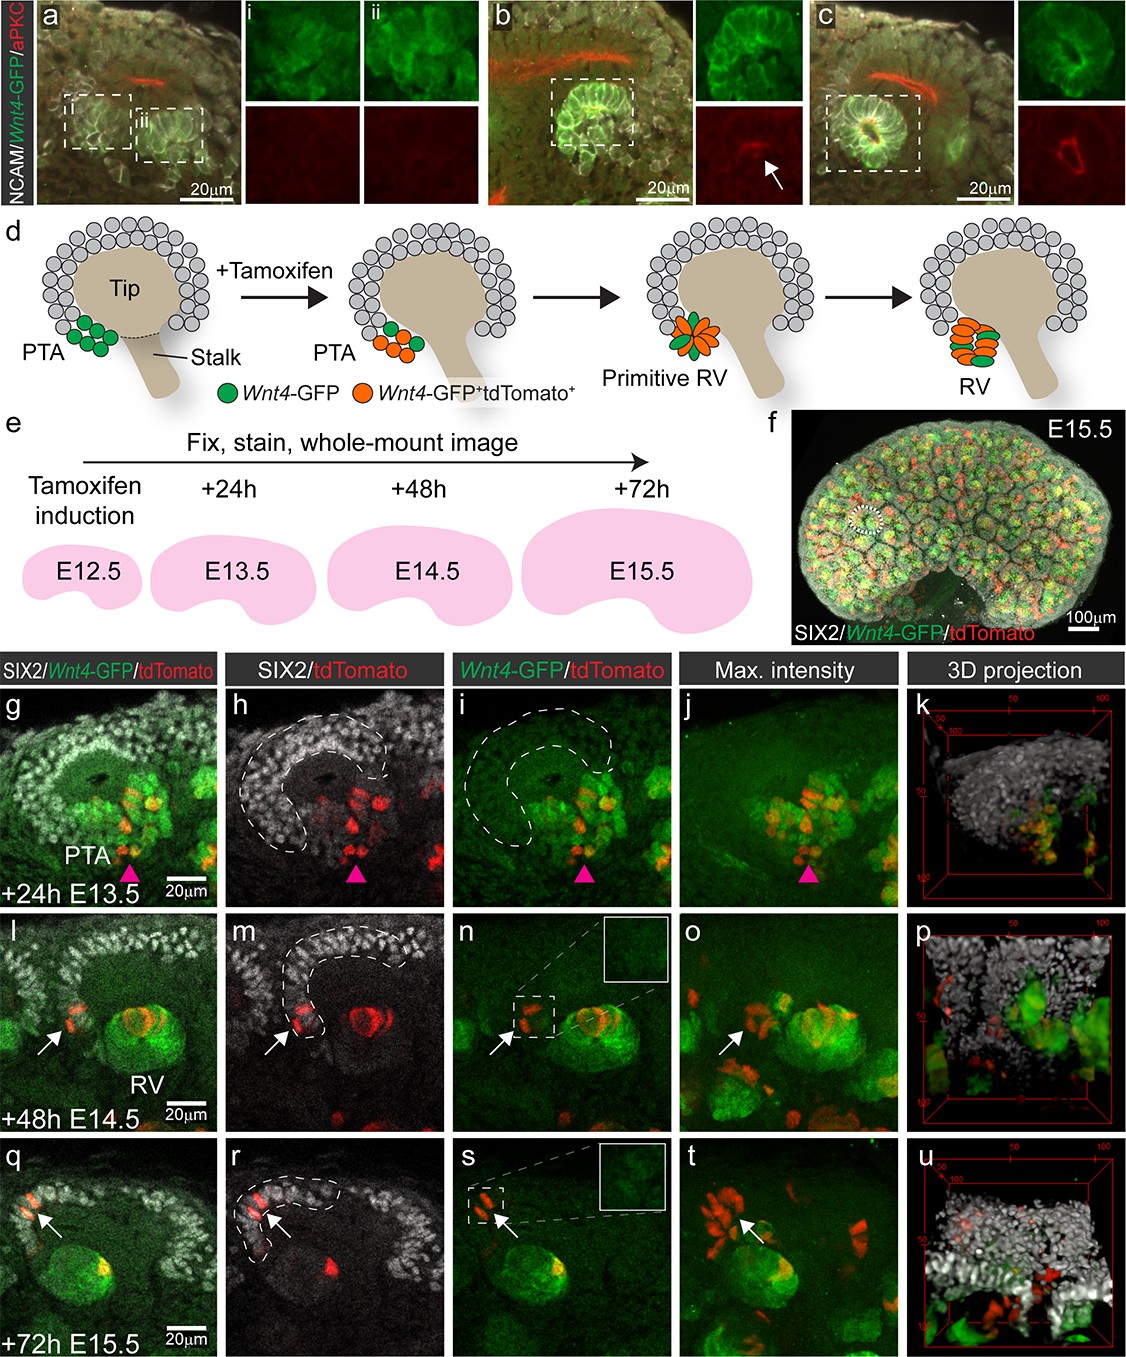
Wnt4-lineage cells re-enter the progenitor niche over time.
(a–c) Correlation of Wnt4-GFP expression to stages of early nephron formation defined by Yang et al (Yang et al., 2013). Staining with NCAM (white, cell membrane), Wnt4-GFP (green), and aPKC (red) shows no polarization in Wnt4-expressing PTA structures in a, one aPKC-enriched foci in the primitive RV shown in b, and a polarised luminal epithelium within a mature RV in c. (d) Schematic of the experimental approach. In Wnt4GCE;Rosa26R-LSL-tdTomato mice, committing cells within the PTA near the tip-stalk junction express GFP and become permanently labelled by tdTomato expression in the presence of tamoxifen. PTA structures mature to primitive RV and RV structures as nephrogenesis proceeds. (e) Cells were labelled with a single dose of tamoxifen at E12.5, then fixed and stained at E13.5, E14.5 or E15.5. Embryonic kidneys were stained for tdTomato protein (red), GFP (green) and nephron progenitor marker SIX2 (white) and whole-mount imaged. (f) Maximum intensity projection of a typical E15.5 dataset is shown, with a single niche marked by a dotted region. This image has been displayed on a black background for presentation purposes. (g–k) At 24 hr after tamoxifen (E13.5) tdTomato-labelled cells are restricted to the PTA (magenta arrowhead), marked by GFP expression and are absent from the cap mesenchyme marked by high SIX2 expression (dashed outline). (l–p) By 48 hr after tamoxifen (E14.5) rare tdTomato-labelled Wnt4 lineage cells (arrows) are found in the SIX2+ cap population (dashed outline). (q-u) At 72 hr after tamoxifen (E15.5) clusters of SIX2+ tdTomato-labelled cells (arrows) are found in some caps (dashed outline). Maximum intensity projections and 3D projections of confocal volumes show a cluster of cells present in a cap at E14.5 and E15.5 (arrows). Scale for all panels as in g, l, q, except for 3D projection where scale is indicated in bounding box.
Figure 1—figure supplement 1
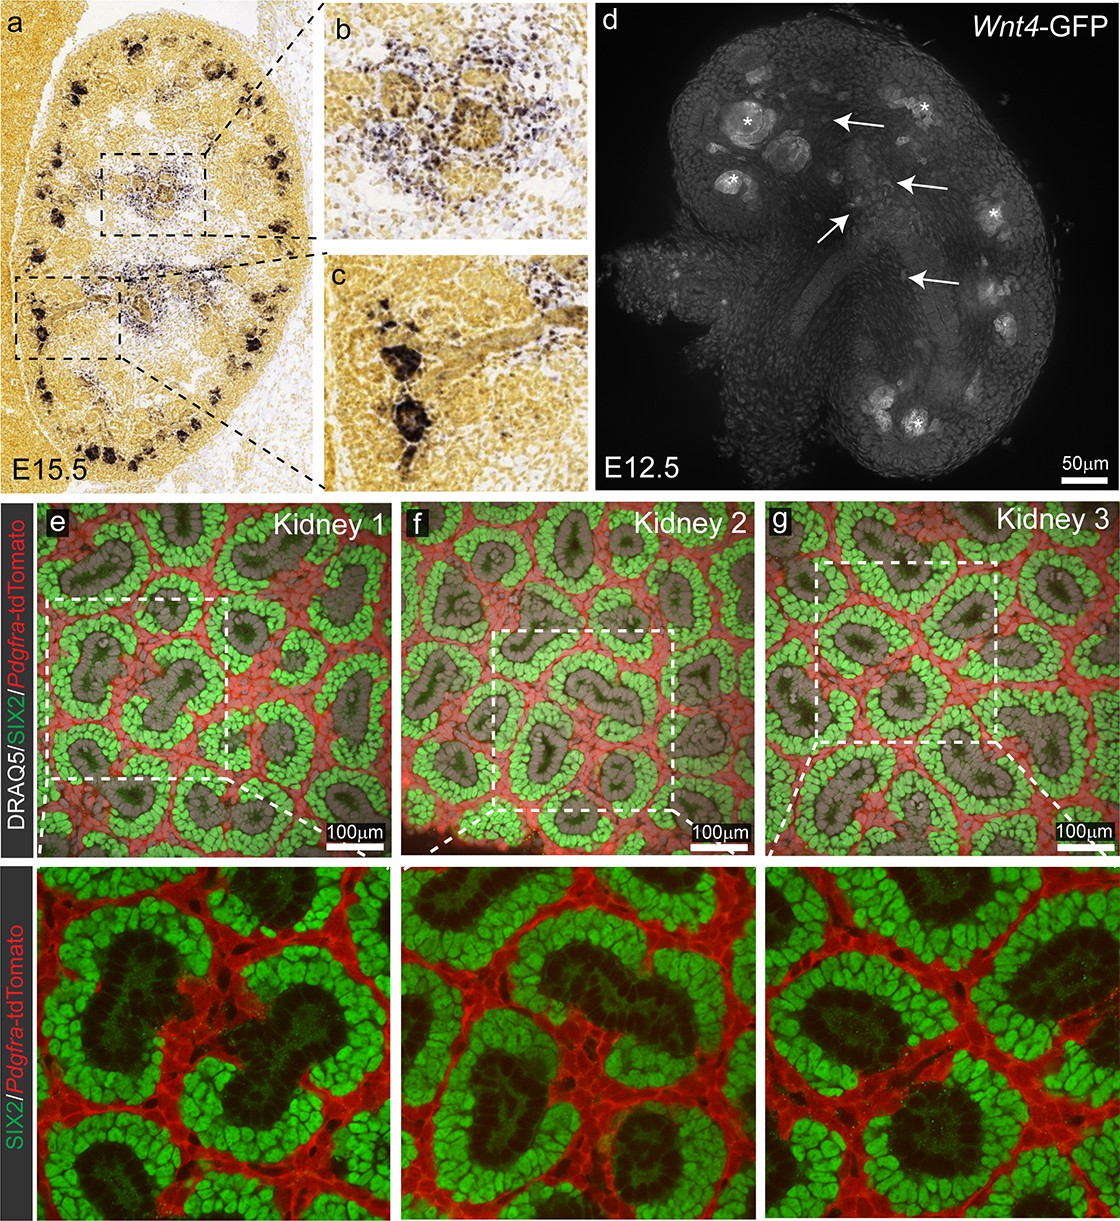
Stromal Wnt4-lineage cells do not contribute to the nephron progenitor population.
(a) Wnt4 expression is detected in the early committing nephron and at lower levels in the medullary stroma by in situ hybridisation. Magnified view of stromal (b) vs early nephron (c) expression. Images in a-c from are from the Allen Developing Mouse Brain Atlas (http://www.brain-map.org). Relevant data can be viewed at http://developingmouse.brain-map.org/gene/show/22174. (d) Overview of Wnt4-GFP expression in an E12.5 kidneys from Wnt4GCE mice. (e–g) Lineage tracing from an inducible Pdgfra Cre results in extensive labelling of the renal stroma but does not result in any labelled cells within the nephron progenitor population. Representative image from three independent kidneys shown. Labelling was induced with 2 mg of tamoxifen at E13.5 and embryonic kidneys collected at E18.5. DRAQ5 (white) was used to stain nuclei, SIX2 (green) to identify nephron progenitors, tdTomato is in red.
Figure 2 with 4 supplements

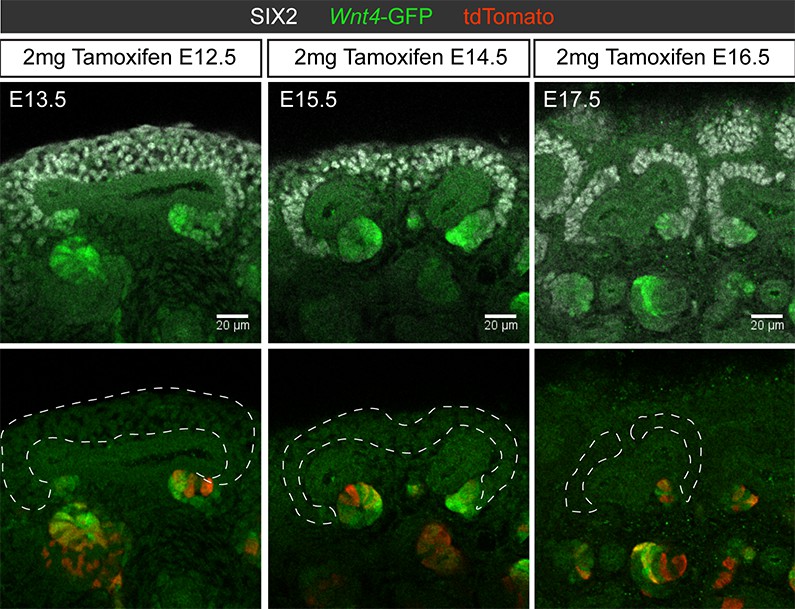
Cap re-entry occurs throughout development.
(a) Wnt4-expressing cells at E12.5 can return to the cap mesenchyme and remain there for up to 7 days. (b) Labelling at E14.5 reveals cap re-entry later in development, with labelled cells absent from the SIX2 positive cap domain at E15.5, but a small number of cells present at E16.5 and E17.5. (c) Plot of SIX2 intensity vs Wnt4-GFP intensity for tdTomato-labelled cells identified by spot detection from wholemount imaging data. All dots represent tdTomato-expressing cells. Red cells are those assigned nephron progenitor (NP) identity, while green cells express Wnt4-GFP. The Wnt4-GFP cells at E13.5 that express high levels of SIX2 are located within PTAs. By E15.5 the tdTomato population includes a population of SIX2+GFP- NP cells. Examples of wholemount data and spot classification are given in Figure 2—figure supplement 2. (d–f) Proportion of labelled SIX2+ NP cells after tamoxifen treatment at E10.5, E12.5 and E14.5, determined by image analysis (see methods). (g) Labelling using a constitutive Wnt4-Cre gives rise to many positive cells in the SIX2+ progenitor population at E18.5. A single confocal slice from a whole mount sample shows SIX2 (red) combined with anti-GFP staining (green) and nuclei (white). The anti-GFP antibody detects both Wnt4 lineage (YFP+) and present expression (Wnt4-GFP-Cre+). Boxes 1-3 highlight less frequent labelling in the ureteric epithelium (1) and stroma (2), and extensive labelling of some caps (3). (h) ~ 20–30% of nephron progenitors are labelled by the constitutive Wnt4-Cre. Plot shows normalised nuclear spot-detection values, classified by either manual annotation (red) or inferred based on signal intensity (grey). Density lines indicate the entire SIX2+ population, grey and red dots are SIX2+ nuclei that are also expressing GFP and/or YFP. Signal thresholds were inferred per sample and used to estimate the proportion of labelled SIX2+ cells.
Figure 2—figure supplement 1
Labelling within the nephron lineage is restricted to sites of nephron commitment throughout development.
24 hr after tamoxifen induction at E13.5, E15.5, and E17.5 tomato-labelled cells were restricted to the sites of nephron formation and not in the nephron progenitor population.
Figure 2—figure supplement 2
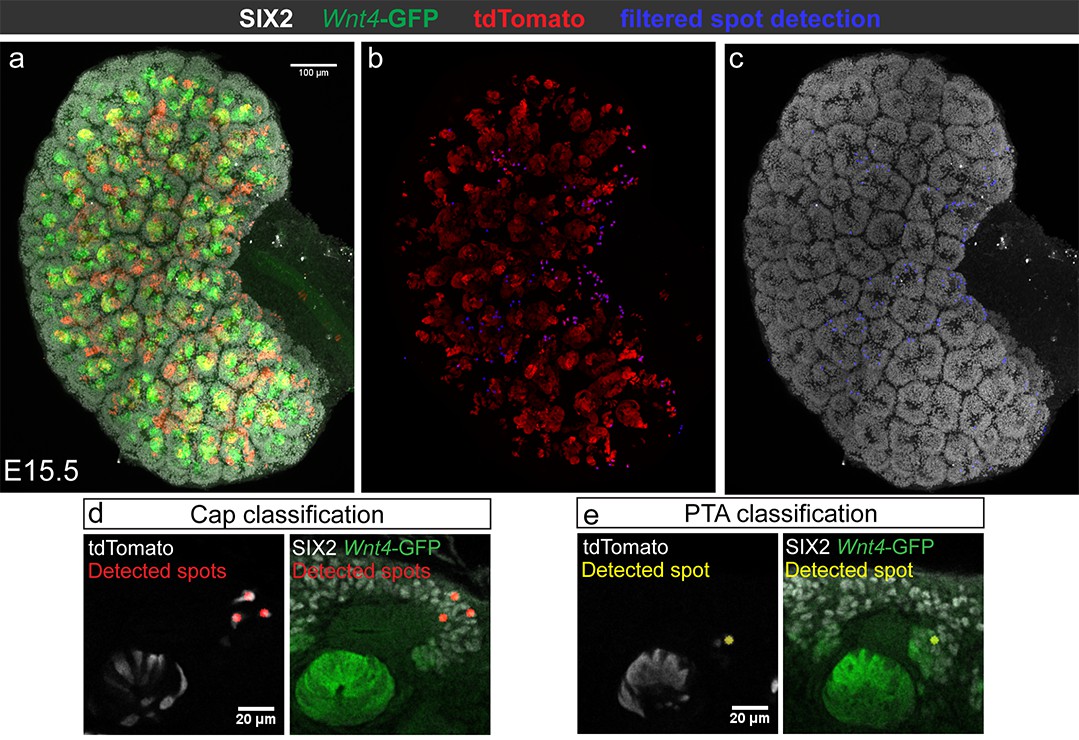
Quantification of Wnt4-lineage cap cells.
Whole or partial-organ confocal volumes were analysed using a spot detection algorithm. (a) Representative maximum intensity projection of an E15.5 kidney stained for SIX2 (grey), tdTomato (red) and GFP. (b) Spot detection was performed on the tdTomato channel to identify SIX2 positive cap cells, defined by locally high SIX2 and low Wnt4-GFP signal (marked by blue dots in b). (c) Cap identity is visually confirmed by overlaying spot positions (blue dots) on a maximum projected image of SIX2 signal. (d,e) Examples of detection and classification of tdTomato-expressing cells as cap (high SIX2 and low Wnt4-GFP signal, (d) or PTA (low SIX2 and high Wnt4-GFP signal, (e).
Figure 2—figure supplement 3
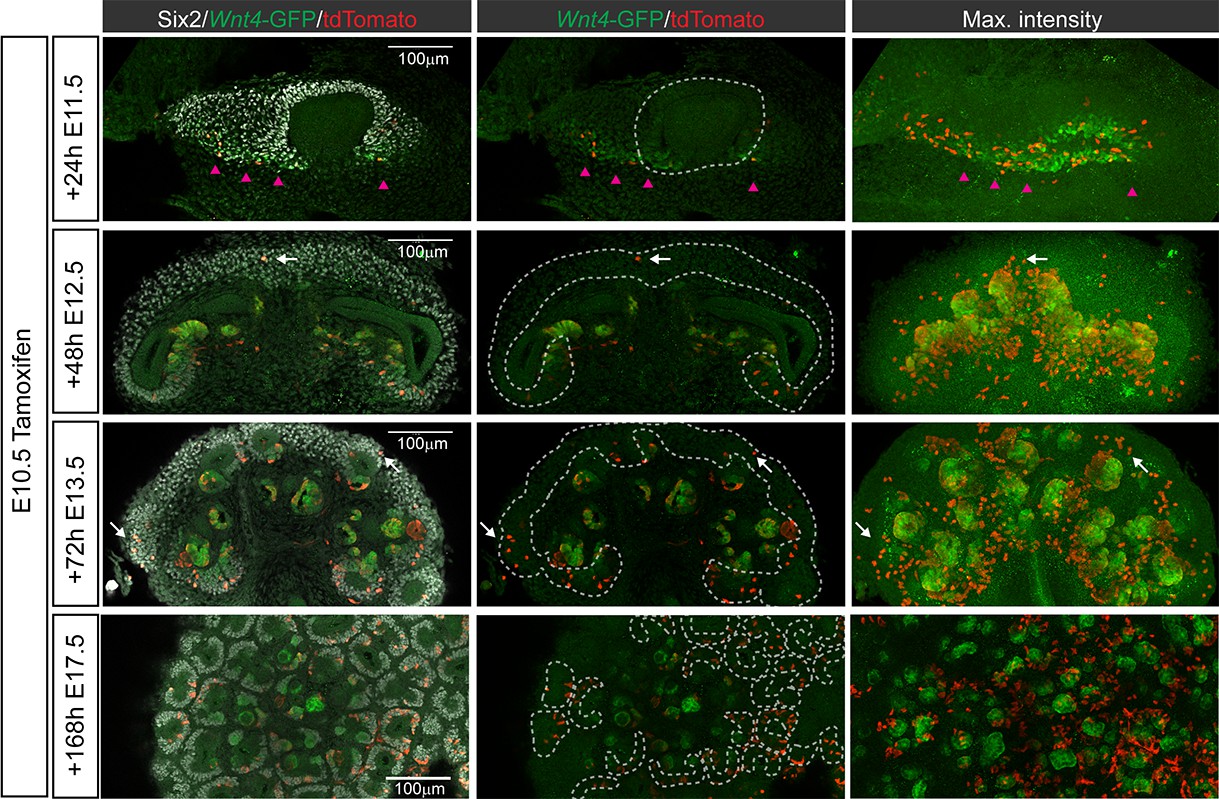
Wnt4-expressing cells contribute to early nephrons and the nephron progenitor population at the onset of kidney development.
Optical slices and maximum intensity projections from whole mount kidneys treated with tamoxifen at E10.5 and stained for tdTomato, GFP and SIX2. At E11.5 labelled cells were found primarily within a ring of SIX2 +Wnt4-GFP + cells (magenta arrowheads) at the base of the ureteric bud. Labelled cells are absent from the region where SIX2 expressing cells condense around the ureteric bud (dotted line). By E12.5 labelled cells contribute to the earliest developing nephrons, marked by GFP expression. A number of labelled cells have moved into the now established cap mesenchyme (white arrows, dotted region). At E13.5 clusters of Wnt4 lineage cells are present in the cap mesenchyme with a bias towards niches near the ureter (white arrows, dotted region). Wnt4-lineage cells labelled at E10.5 persist in the cap until at least E17.5. The number of labelled cells per cap is variable at E17.5.
Figure 2—figure supplement 4
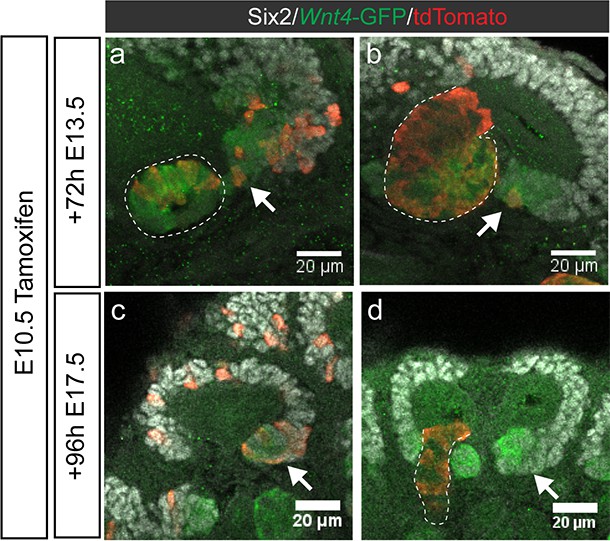
Some induced cells may remain at sites of induction without immediately forming epithelial structures.
(a,b) E10.5 tamoxifen labelling gives rise to labelled Wnt4-GFP + cells that have yet to contribute to an epithelial structure 72 hr later (arrows). Two representative examples are shown. (c) By E17.5, labelled PTA cells are present only in association with labelled cap (arrow), suggesting a more recent induction. (d) labelled cells are restricted to mature nephrons (outline), and not present in early nephrons (arrow) in niches where caps are unlabelled.
Figure 3 with 2 supplements
Some Wnt4 lineage cells migrate from sites of induction back into the cap mesenchyme.
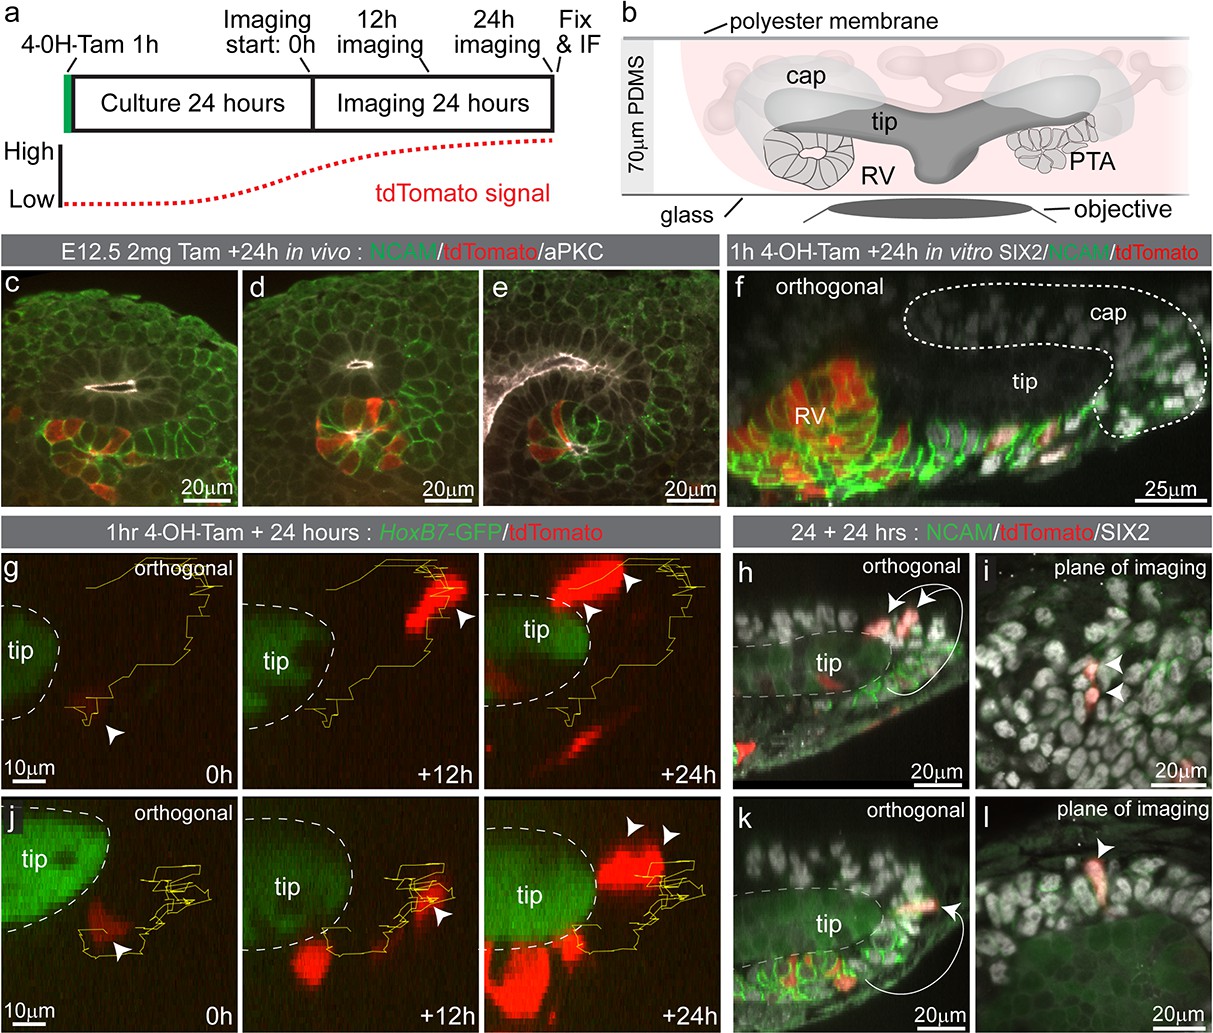
(a) Experimental overview for live imaging Wnt4-lineage cell migration. E12.5 embryonic kidneys were treated ex vivo for 1 hr (h) with 10 µM 4-Hydroxytamoxifen (4-OH-Tam), washed and cultured for 24 hr to allow tdTomato signal to increase to a level that could be detected. Samples were imaged for 24 hr at 15 min intervals, then fixed and immunostained. (b) Explant culture method. E12.5 kidneys were mounted in glass dishes in a chamber made from a 70 μm PDMS ring sealed at the top with a piece of porous polyester membrane. Explant cultures replicated in vivo niche geometry, allowing the entire niche to be captured as a high resolution Z-stack. (c–e) In vivo labelling 24 hr after tamoxifen administration at E12.5 is restricted to cells around the tip-stalk junction in PTAs and RVs where Wnt4 is expressed. (f) 4-OH-Tam induction in explant culture replicates in vivo labelling. Labelling was observed in primitive nephron structures and at sites adjacent to the cap where Wnt4 is expressed. The delay between tamoxifen exposure and the onset of imaging likely allows some movement of labelled cells prior to time point 0. View shows an orthogonal view along the Z axis (side view) of the 3D data. (g–i) and (j–l) show representative examples of cells moving from the base of the ureteric tip back into the cap mesenchyme. (g,j) At the start of imaging cells are observed at sites where PTA formation occurs. Over time cells make movements away from sites of commitment, up into the cap region. Yellow track indicates path over time, arrow heads indicate cell position, dashed outline shows border of tip. In each case cells undergo a division, as indicated by dual arrow heads at the final time point. Orthogonal view along the Z axis (side view) of 3D data is shown. Scales for all panels shown in left image. (h,k) Immunofluorescence of samples fixed immediately after 24 hr of imaging. SIX2 staining confirms nephron progenitor identity in tracked cells. NCAM highlights morphology in primitive nephron structures where the tracked Wnt4-lineage cells originate. Tip border is shown with a dashed line, simplified path of migration shown by white arrows. Second cell in k is in a different plane of imaging. Orthogonal view along the Z axis of the 3D data is shown. (i,l) XY axis views of the SIX2 +Wnt4 lineage cells shown in h and k. Migration events shown are representative of events observed in 7 out of 14 separate 300 × 300 µm imaging fields derived from three independent explant experiments.
Figure 3—figure supplement 1
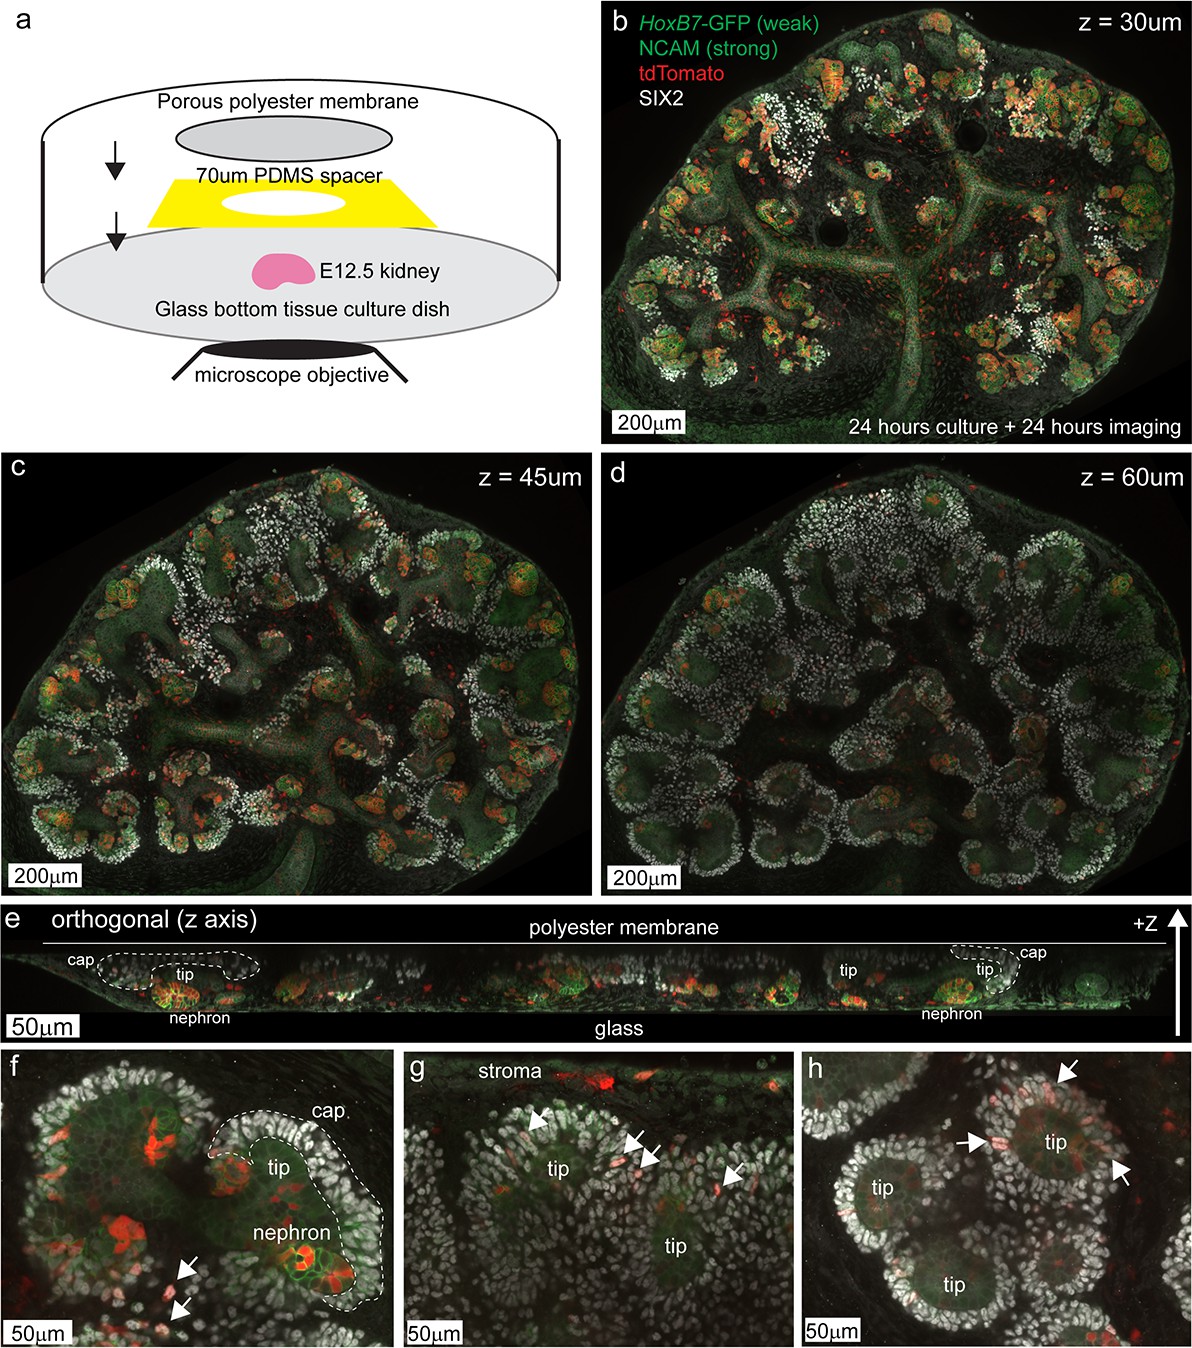
Niche morphology is maintained in live explant cultures allowing the observation of Wnt4 lineage cell migration into the progenitor domain.
(a) Schematic of the method for high resolution explant imaging. E12.5 embryonic kidneys were mounted in a glass bottom tissue culture dish using a 70 µm PDMS spacer and porous polyester transwell membrane (0.4 µm pore size) to hold the sample in place. At the completion of imaging samples were fixed and gently removed for IF. (b - d) A representative sample fixed after 24 hr of imaging showing antibody staining for SIX2 (nephron progenitors) and NCAM (brighter in developing nephron cell junctions), native tdTomato lineage-label and weak native GFP signal from the HoxB7-GFP reporter. Three different Z planes are shown where lower Z is closer to the glass/microscope objective. Niche morphology is maintained with SIX2+ cap cells surrounding the tips of the ureteric epithelium (weak green). Developing nephrons are evident as tdTomato-labelled structures with strong junctional NCAM. A typical field consists of 16–25 tiled high resolution 1024 × 1024 pixel images. Labelling is evident in the stroma (see also panel g) consistent with stromal Wnt4 expression described in Figure 1—figure supplement 1. Some tips and regions of the ureteric epithelium contain labelled cells, consistent with data described in Figure 2g. (e) Orthogonal view of an entire sample along the Z axis shows the maintenance of tip and cap morphology in 3D. Developing nephrons form closer to the glass surface, while SIX2+ cap domains (dotted regions) are found against the polyester membrane. (f–h) Higher magnification regions of interest from the sample in b-d indicate tip and cap morphology (dotted region). tdTomato-labelled SIX2+ cap cells are evident in many caps (arrows). We used tip morphology to identify regions that were live-imaged and confirm the final SIX2+ cap identity of tracked cells.
Figure 3—figure supplement 2
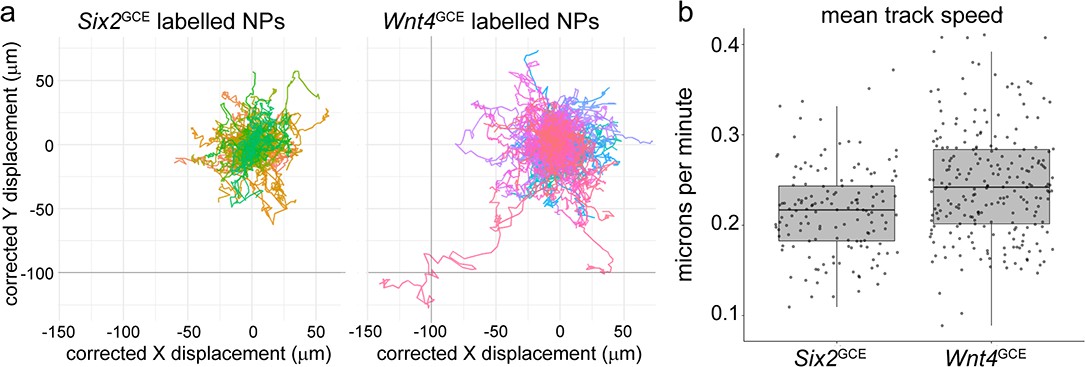
Comparison of cell movement between Six2- and Wnt4-lineage nephron progenitor cells.
Cell tracking of migrating Wnt4GCE and Six2GCE labelled populations reveals a small increase in speed in the Wnt4GCE population. (a) Individual tracks corrected for movement of the nearest HoxB7-GFP tip and a zero start-point. A portion of large movements are evident in the Wnt4 lineage. (b) Mean track speed shows a modest (~10%) but significant increase in the Wnt4-lineage-labelled nephron progenitors compared to those labelled by Six2 (p<0.05, mixed effects model). Tracking data is from 381 tracks total derived from tiled time-lapse datasets of Wnt4GCE(n = 6 datasets) or Six2GCE (n = 4 datasets) labelled explants grown in transwell culture.
Figure 4
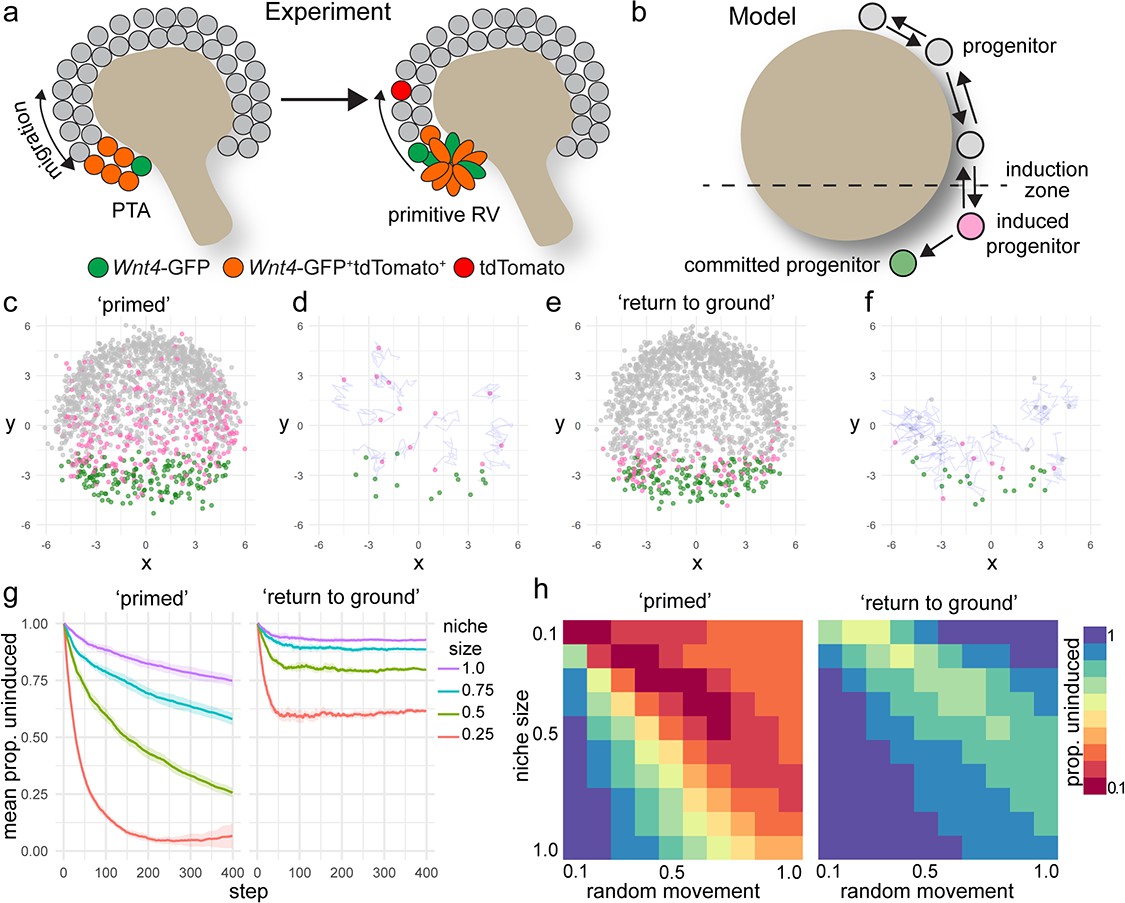
A model of positionally triggered stochastic induction.
(a) Proposed mechanism by which Wnt4 lineage cells re-enter the niche. Migrating cells enter the induction zone where Wnt4-expression/PTA initiation occurs. A portion of cells make sufficient movements to ‘escape’ and re-enter the cap domain, while those remaining form a primitive RV. (b) Diagram of simulation: randomly migrating progenitor cells (grey) become induced (pink) in response to regionalized cues and commit (green) after accumulation of sufficient inductive cues. (c–f) Simulated migrating cells begin in the progenitor state (grey) and give rise to induced (pink) and committed cells (green). (c,d) Simulations at step 200. (d,f) Fate of cells that were undergoing induction at step 100, shown at step 200. Many cells have committed, while a portion re-enter the cap and continue to migrate. Tracks show recent movements. (g) Proportion of uninduced cells over time from ‘primed’ and ‘return to ground’ models. Mean and standard deviation for 10 simulations are shown. (h) Proportion of uninduced cells at simulation step 400 (mean of 10 simulations) for changes in niche size and random migration for each variant of the model.
Figure 5 with 3 supplements
Wnt4 labelled progenitors accumulate in the cap and show a range of transcriptional identities.
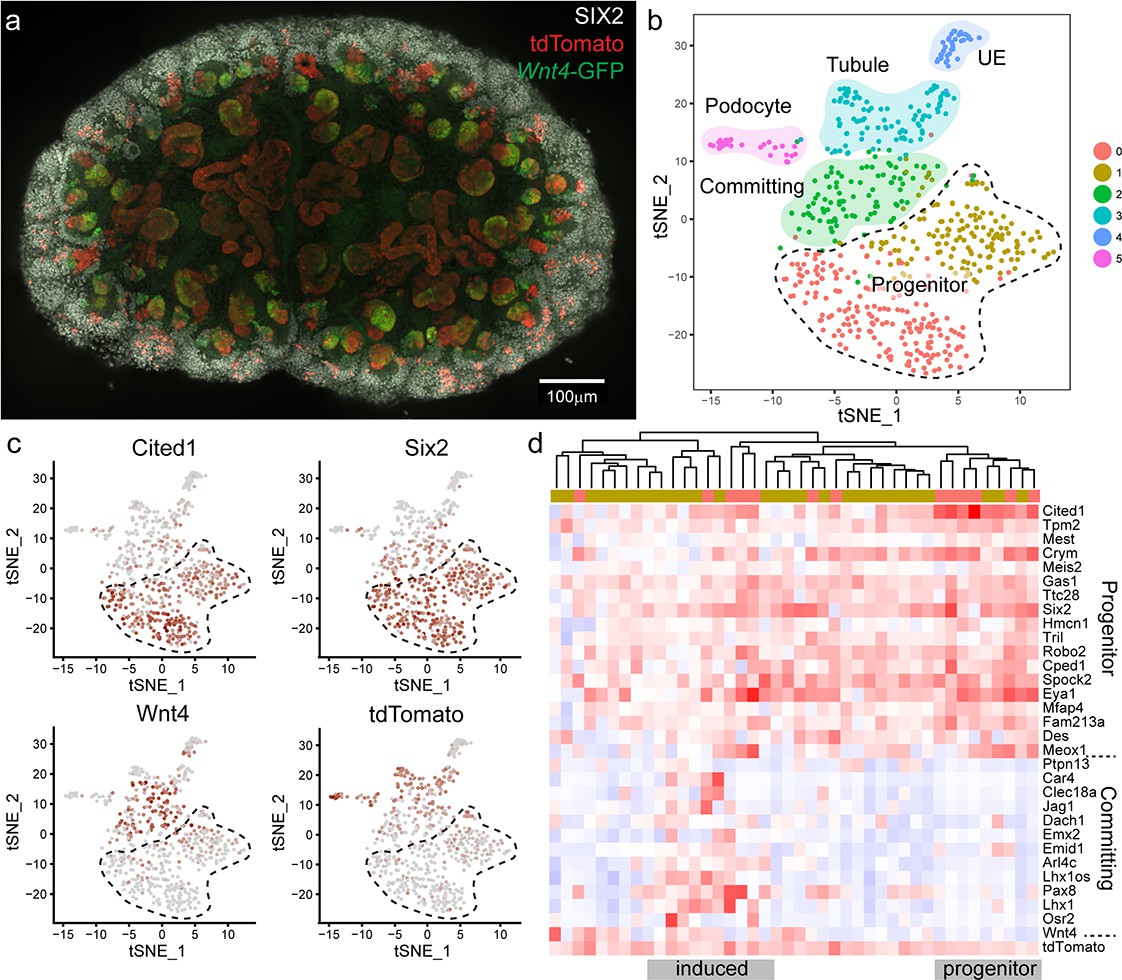
(a) E15.5 kidney after daily tamoxifen injection at E10.5, 11.5, 12.5 and 13.5, showing increased labelling within the cap population (grey, SIX2; red, tdTomato; green, Wnt4-GFP). A maximum projection of a subset of a wholemount confocal stack is shown. (b) tSNE plot representing clustering of single cell transcriptional profiles. Clusters represent nephron progenitors (two clusters), committing cells (PTA and RV), differentiated tubule, podocyte and ureteric epithelium (UE). (c) tSNE plots coloured by scaled gene expression show nephron progenitor (NP) markers Six2 and Cited1, committing cell marker Wnt4 and tdTomato expression. tdTomato-labelled cells are present within both the NP and committing cells. (d) Heatmap showing expression of markers associated with the shift from progenitor to committed state for tdTomato expressing NP cells (cells from nephron progenitor cluster 0 and 1). Dendrogram based on this subset of genes reveals labelled NP cells in both a strong progenitor-like state with high progenitor gene expression and weak committing gene expression (including absence of Wnt4), and a partially induced-progenitor state with co-expression of both marker types. Remaining cells show a progenitor profile with heterogeneous expression of Wnt4, suggesting that they may be transitioning into or out of the induced state. Column colour labels indicate cluster identity, as in (b).
Figure 5—figure supplement 1
Daily tamoxifen injections give strong labelling in the cap.
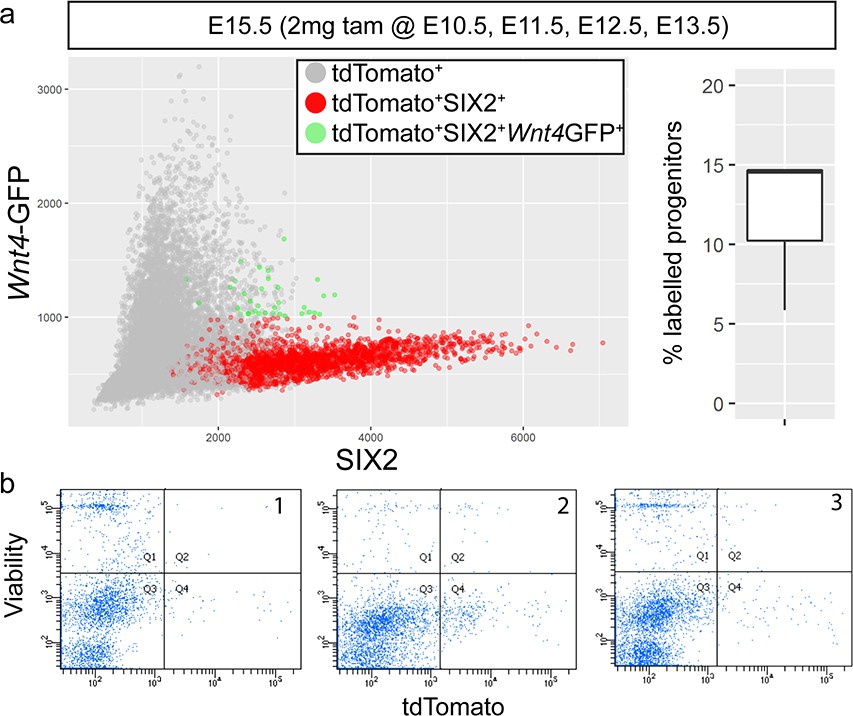
(a) ~ 10–15% of SIX2+ cells are labelled after daily tamoxifen injections from 10.5 to 13.5 in Wnt4GCE mice. Red points are those tdTomato-labelled cells assigned cap identity by image analysis. Green cells represent the labelled population that express both SIX2 and Wnt4-GFP,representing cells that are currently located within the region of Wnt4 expression at the tip stalk junction. (b) Flow cytometry analysis of replicate dissociated E15.5 kidney cell suspensions used for 10x Chromium library prep. Surplus cells were analysed for tdTomato signal (x-axis) vs DAPI uptake (y-axis), indicative of cell death. tdTomato positive live cells (Q4) are observed in each of three replicate samples.
Figure 5—figure supplement 2
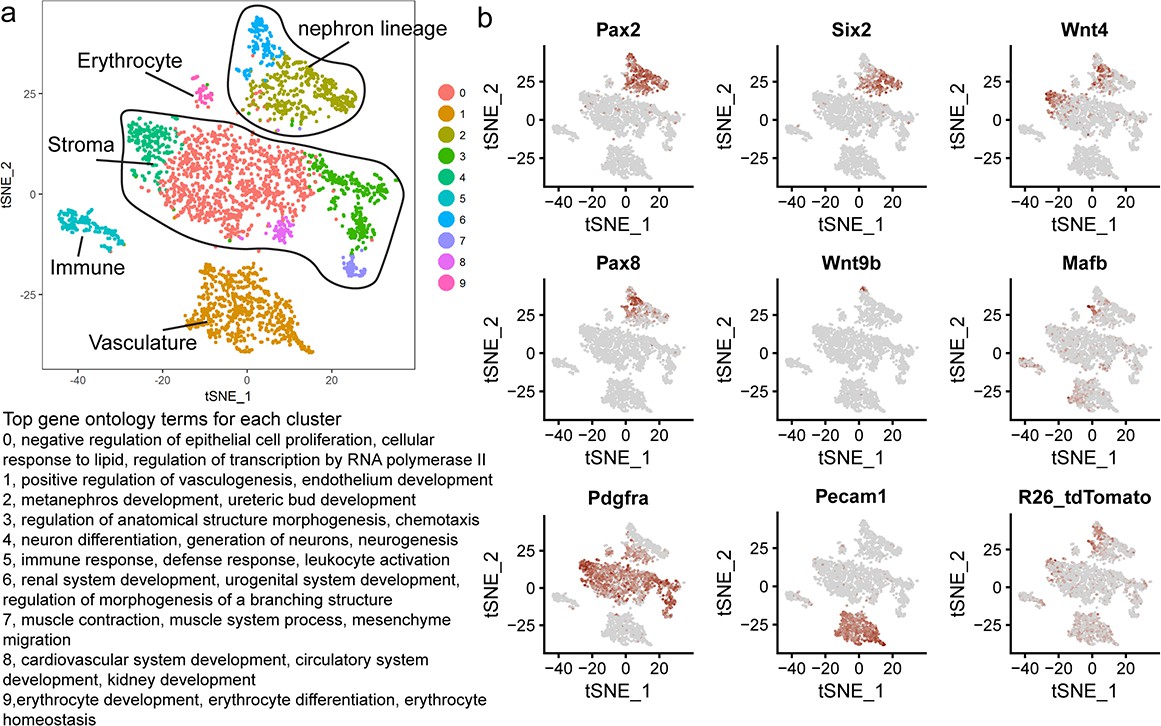
Whole kidney clusters and marker expression.
(a) tSNE plot representing clustering for whole kidney single cell transcriptional data. Relevant top significant GO terms (Biological Process) are indicated for each cluster. (b) Expression of key cell-type markers: Pax2, Six2 (cap mesenchyme), Wnt4 (committing progenitors), Pax8 (committed cells), Wn9b (ureteric epithelium), Mafb (early proximal nephron/podocyte), Pdgfra (stroma), Pecam1 (vasculature), R26_tdTomato (Wnt4GCE mediated tdTomato labelling in this dataset). Note tdTomato is mainly restricted to the nephron lineage and Wnt4 expressing stromal cells.
Figure 5—figure supplement 3
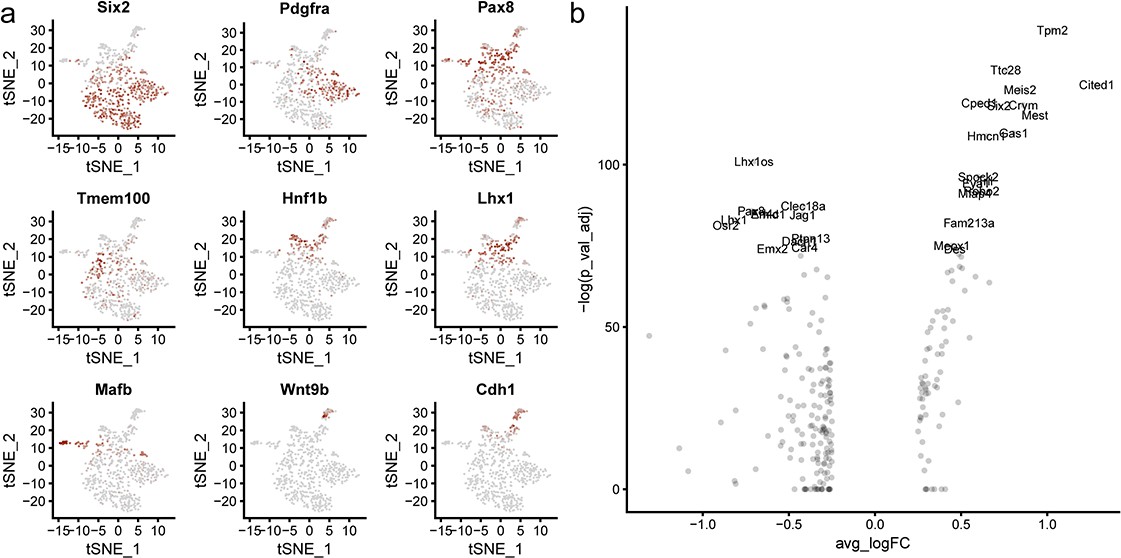
Segment markers and expression changes with commitment.
(a) Segment markers in nephron lineage transcriptional data. Six2 (cap mesenchyme progenitors), Pdgfra (stromal signature progenitors) (Combes et al., 2017), Pax8 (committing cells), Tmem100 (PTA), Hnf1b (early distal tubule), Lhx1 (RV), Mafb (early proximal nephron/podocyte), Wnt9b (Ureteric epithelium), Cdh1 (nephron tubule). (b) Plot showing the 30 most significant differentially expressed genes between progenitor (cluster 0, 1) and committed nephron cells (cluster 2, 3, 5). Plot shows average log fold change (x-axis) vs –log of adjusted p value (y-axis). Genes used to define switch from progenitor to committed states are labelled.
Figure 6
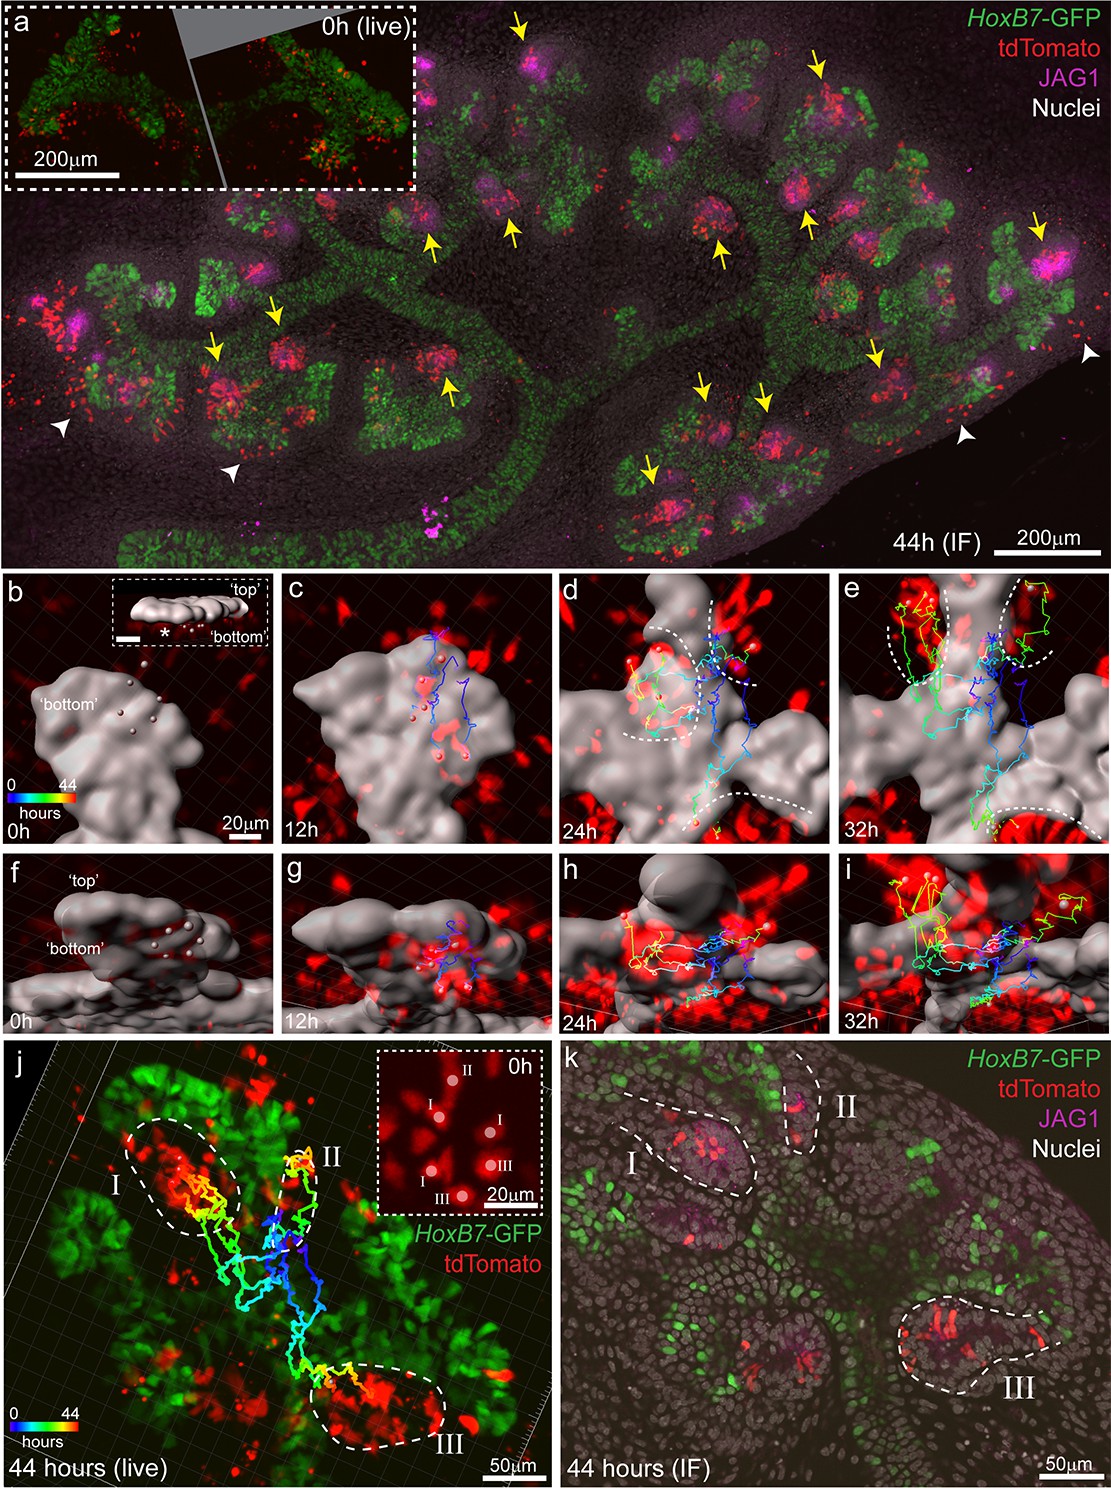
Induced progenitors make a delayed contribution to multiple nephrons at E11.5.
(a) Representative example of cultured explants from Wnt4GCE; Rosa26-LSL-tdTomato; HoxB7-GFP E11.5 embryos. Inset of live imaging at time point 0 hr (h) (~24 hr after 35 min of 4-Hydroxytamoxifen induction) shows groups of Wnt4GCE-labelled cells clustered around sites where early nephrons are being induced to form under the tip. The same explant was fixed and stained for developing nephron marker JAG1 at the completion of 44 hr of live imaging. Labelled cells are present within many nephrons (yellow arrows), inconsistent with a model of a single induction event giving rise to a single nephron. A portion of cells are also present outside of nephrons in the cap mesenchyme region (white arrowheads). (b–i) An example of a group of 6 tdTomato-labelled cells migrating to contribute to three nephrons around adjacent tips. HoxB7-GFP tip signal is rendered as a grey surface. Images in b-e are oriented to show a view of the ‘bottom’ side of the tip where nephrons form. (b) 3D render shows the starting positions of tracked cells restricted to a region below a single tip. Inset in (b) shows a side view indicating the position of cells below the tip, inset scale is 20 μm. Cell centres represented as grey spheres with tracking indicated by lines coloured to indicate time. (c–e) By 24 hr tracked cells are evident in three regions where separate nephrons are forming (dotted lines). (f–i) Rotated view of b-e showing tracks under the tip. (j) 3D render of movie end-point, with tracking indicated. After 44 hr tracked cells are evident in three distinct nephrons (dotted regions I, II, III). Inset shows a maximum projection around the initial group of cells with labels indicating the nephron that each cell eventually contributes to. In this example cells within 1–3 cell widths of each other contribute to distinct nephrons. (k) Immunofluorescence at the completion of imaging confirms that final tracked positions correspond to three distinct nephrons (JAG1 stain, dotted regions) that contain labelled cells. Example shown is representative of events observed in five 614 × 614 µm fields captured from three kidneys explants.
Videos
Video 1
3D render of labelled cap cells in an E15.5 kidney after labelling at E12.5.
A single niche has been manually segmented for display. Colours are SIX2 (grey), Wnt4-GFP (Green) and tdTomato (Red)
Video 2
Some Wnt4 lineage cells migrate from sites of induction back in the cap mesenchyme.
Example one corresponds to panels in Figure 3g–i and Example two to Figure 3j–l.
Video 3
Animation of computational simulation of stochastic commitment.
https://doi.org/10.7554/eLife.41156.015
Video 4
Induced progenitors make a delayed contribution to multiple nephrons at E11.5.
https://doi.org/10.7554/eLife.41156.021Tables
Key resources table
| Reagent type (species) or resource | Designation | Source or reference | Identifiers | Additional information |
|---|---|---|---|---|
| Genetic reagent (Mus musculus) | Wnt4GCE; Wnt4-GFP-CreERT2 | PMID: 18682239 | RRID:IMSR_JAX:032489 | |
| Genetic reagent (Mus musculus) | Rosa26-LSL-tdTomato | PMID: 20023653 | RRID:IMSR_JAX:007909 | |
| Genetic reagent (Mus musculus) | Hoxb7-GFP | PMID: 10322632 | RRID:IMSR_JAX:016251 | |
| Genetic reagent (Mus musculus) | Wnt4-GFP-Cre | PMID: 19591821 | RRID:IMSR_JAX:032490 | |
| Genetic reagent (Mus musculus) | Rosa26-LSL-YFP | PMID: 20023653 | RRID:IMSR_JAX:007903 | |
| Genetic reagent (Mus musculus) | Six2GCE; Six2-GFP-CreERT2 | PMID: 18682239 | RRID:IMSR_JAX:009600 | |
| Genetic reagent (Mus musculus) | PdgfraCreER | PMID: 23335233 | CDB0674K RIKEN Center for Life Science Technologies | More information |
Additional files
-
Source code 1
R code for computer simulation of stochastic commitment model.
- https://doi.org/10.7554/eLife.41156.022
-
Supplementary file 1
Marker gene lists for whole kidney single cell transcriptional data.
- https://doi.org/10.7554/eLife.41156.023
-
Supplementary file 2
Marker gene lists for nephron lineage single cell transcriptional data.
scRNA-seq data is available via GEO accession GSE118486 (token kfwtoegufxejzkz).
- https://doi.org/10.7554/eLife.41156.024
-
Transparent reporting form
- https://doi.org/10.7554/eLife.41156.025
Download links
A two-part list of links to download the article, or parts of the article, in various formats.
Downloads (link to download the article as PDF)
Open citations (links to open the citations from this article in various online reference manager services)
Cite this article (links to download the citations from this article in formats compatible with various reference manager tools)
Nephron progenitor commitment is a stochastic process influenced by cell migration
eLife 8:e41156.
https://doi.org/10.7554/eLife.41156


