Human-specific ARHGAP11B induces hallmarks of neocortical expansion in developing ferret neocortex
- Max Planck Institute of Molecular Cell Biology and Genetics, Germany
Figures
Figure 1 with 2 supplements

ARHGAP11B increases the abundance of BPs in the developing ferret neocortex.
Ferret E33 neocortex was electroporated in utero with a plasmid encoding a fluorescent protein (FP) together with either a plasmid encoding ARHGAP11B or empty vector (Control), followed by analysis at E40/P0. (A) Double immunofluorescence for FP (green) and PCNA (magenta) (for the images of the single channels and DAPI staining, see Figure 1—figure supplement 2A). Images are single optical sections. Scale bars, 100 μm. Boxes (50 × 50 μm) indicate FP+ BPs in the OSVZ (1, top), ISVZ (2, middle) and VZ (3, bottom), shown at higher magnification in (A). (A) Dashed lines indicate a cell body contour. (B) Percentage of FP+ cells in the germinal zones (GZ total) and in the VZ, ISVZ and OSVZ that are PCNA+ upon control (white) and ARHGAP11B (black) electroporations. Data are the mean of 3 experiments. Error bars indicate SD; *, p <0.05; n.s., not statistically significant; Student's t-test. (C) Double immunofluorescence for FP (green) and phospho-vimentin (PhVim, magenta), combined with DAPI staining (white). Images are single optical sections. Scale bars, 50 μm. Vertical arrowheads, apical mitosis; horizontal arrowheads, basal mitosis. (D) Quantification of FP+ mitotic cells, as revealed by PhVim immunofluorescence, in a 200 µm-wide field of the cortical wall, upon control (white) and ARHGAP11B (black) electroporations. Apical, mitoses lining the ventricular surface; basal, mitoses away from the ventricle (Abv.VZ, abventricular VZ; ISVZ; OSVZ). Data are the mean of 4 experiments. Error bars indicate SD; **, p <0.01; *, p <0.05; n.s., not statistically significant; Student's t-test. (E) Mitotic bRG (single optical sections). Double immunofluorescence for FP (green) and phospho-vimentin (PhVim, magenta), combined with DAPI staining (white), upon electroporation of the plasmid encoding FP together with the plasmid encoding ARHGAP11B. Arrowheads, PhVim+ basal process of the mitotic bRG. Images are oriented with the apical side facing down and are 25 μm wide. (F) Quantification of mitotic bRG (FP+ PhVim+ cell bodies in the SVZ that contain a PhVim+ process), in a 200 µm-wide field of total SVZ (left), ISVZ (middle) and OSVZ (right), upon control (white) and ARHGAP11B (black) electroporations. Data are the mean of 4 experiments. Error bars indicate SD; **, p <0.01; *, p <0.05; Student's t-test.
Figure 1—figure supplement 1

Forced expression of ARHGAP11B in the developing ferret neocortex.
(A) Scheme of ferret neocortex development and experimental approach. ARHGAP11B was expressed in developing ferret neocortex by in utero electroporation at E33, when the OSVZ begins to form. Analyses were performed at E37, E40/P0, P10 and P16. Analysis of cortical progenitors was performed at E40/P0, analysis of post-mitotic cells at E40/P0, P10 and P16, and analysis of brain size and neocortex morphology at P16. (B–D) mRNA expression analysis by RT-qPCR at E37, P0, P10 and P16. RNA was isolated from cryosections of paraformaldehyde-fixed brain tissue following ferret in utero electroporation at E33. Expression of the housekeeping gene Hprt1 (B, note the lack of signal in the absence of reverse transcriptase (–RT)) was used for normalization of ARHGAP11B expression detected with two different primer pairs (C, ARHGAP11B_1; D, ARHGAP11B_2). Two control (Con_1, Con_2; white) and two ARHGAP11B-electroporated (11B_1, 11B_2; black) embryos were analyzed at each stage, except for P0 when one control and one ARHGAP11B-electroporated embryo were analyzed. Error bars represent SD of three PCR amplifications. (E, F) ARHGAP11B protein expression analysis by immunofluorescence. Ferret E33 neocortex was electroporated in utero with a plasmid encoding FP together with either a plasmid encoding ARHGAP11B or empty vector (Control), followed by analysis at E37. (E) Triple immunofluorescence for FP (green), ARHGAB11B (11B, magenta) and Arhgap11a (11a, yellow), combined with DAPI staining (white). Arrows, an ARHGAP11B+ FP+ cell that is Arhgap11a–; arrowheads, an Arhgap11a+ cell that is FP– ARHGAP11B–. Note that the exposure of images of ARHGAP11B staining in the control neocortex was longer than in the ARHGAP11B-electroporated neocortex, in order to show the lack of a specific signal in the control, where only unspecific signal at blood vessels was detected (asterisks). Images are single optical sections. Scale bars, 50 μm. (F) Triple immunofluorescence for FP (green), ARHGAB11B (11B, magenta) and Ki67 (yellow), combined with DAPI staining (white), upon electroporation of a plasmid encoding FP and a plasmid encoding ARHGAP11B. Images are single optical sections. Scale bar, 20 μm. Boxes (25 μm wide), indicating an ARHGAP11B-expressing BP (upper box) and an ARHGAP11B-expressing AP (lower box), are shown at higher magnification on the right. Dashed lines, cell bodies.
Figure 1—figure supplement 2
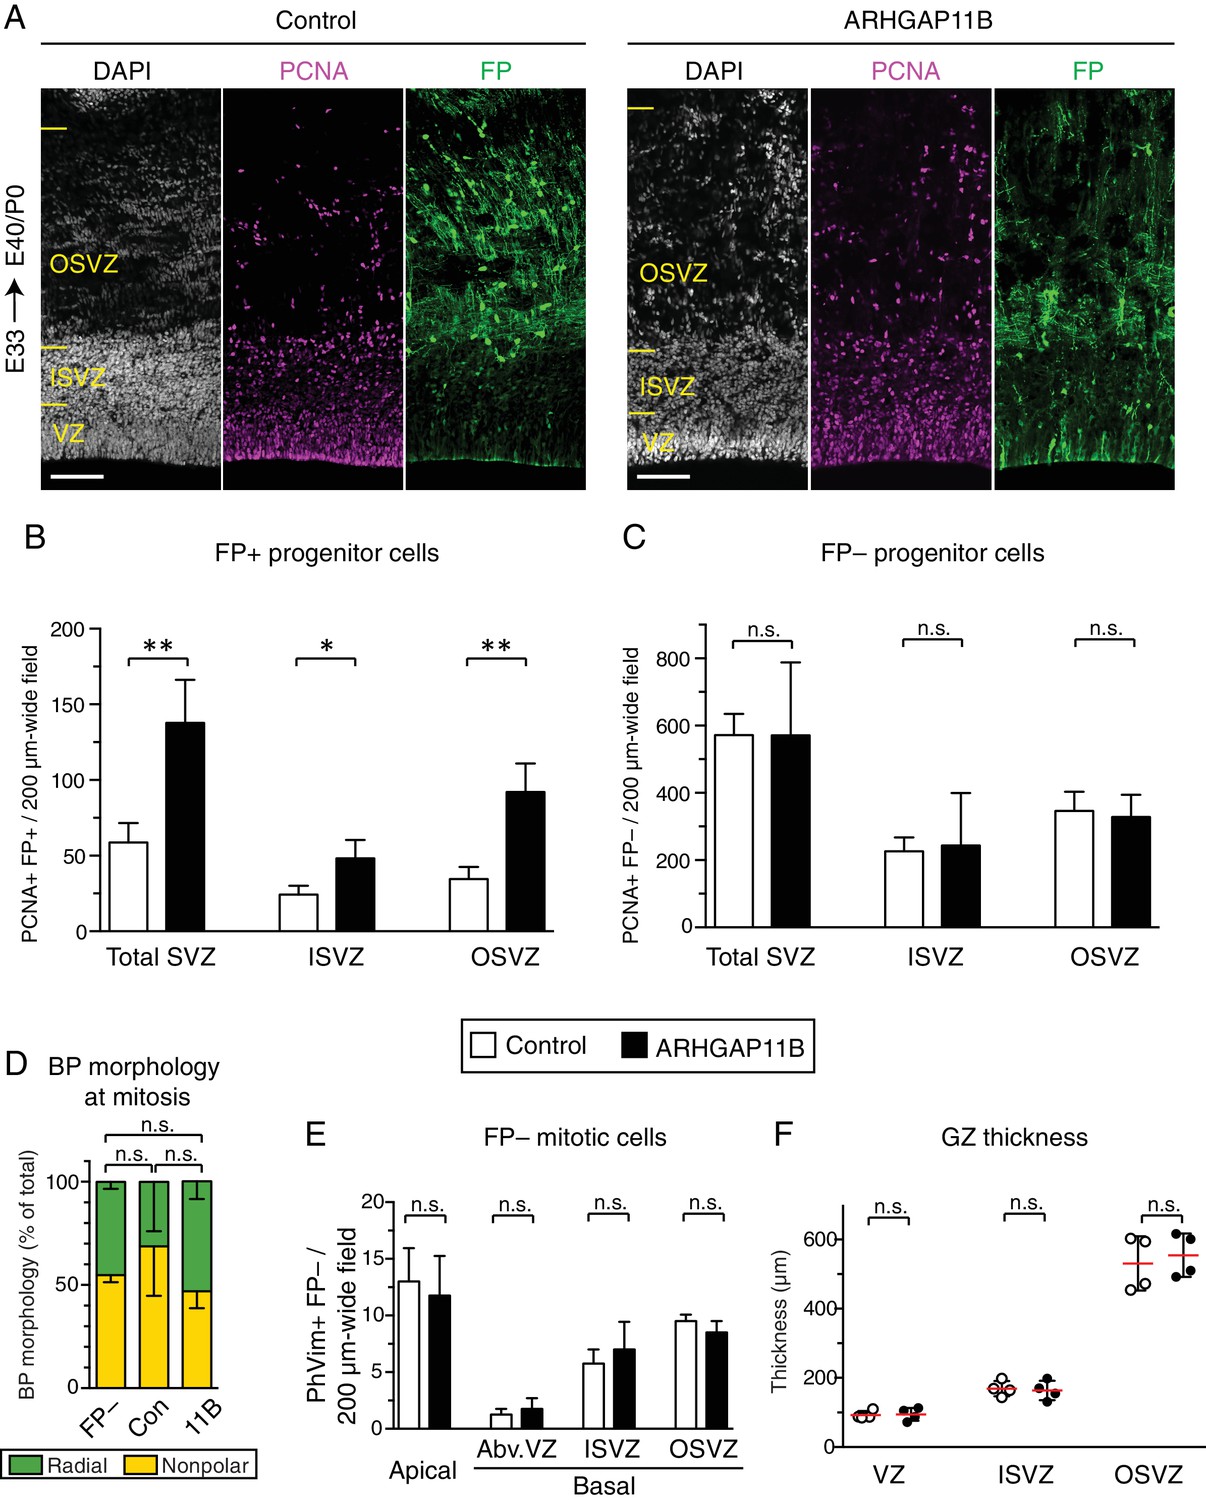
ARHGAP11B increases the abundance of BPs in the developing ferret neocortex.
Ferret E33 neocortex was electroporated in utero with a plasmid encoding a fluorescent protein (FP) together with either a plasmid encoding ARHGAP11B or empty vector (Control), followed by analysis at E40/P0. (A) Double immunofluorescence for FP (green) and PCNA (magenta), combined with DAPI staining (white). Images are single optical sections. Scale bars, 100 μm. See also Figure 1A. (B) Quantification of FP+ neural progenitors, as revealed by PCNA immunofluorescence, in a 200 µm-wide field in the total SVZ (left), ISVZ (middle) and OSVZ (right), upon control (white) and ARHGAP11B (black) electroporations. Data are the mean of 4 experiments. Error bars indicate SD; **, p <0.01; *, p <0.05; Student's t-test. (C) Quantification of FP– neural progenitors, as revealed by PCNA+ immunofluorescence, in a 200 µm-wide field in the total SVZ (left), ISVZ (middle) and OSVZ (right), of embryos subjected to control (white) and ARHGAP11B (black) electroporations. Data are the mean of 4 experiments. Error bars indicate SD; n.s., not statistically significant; Student's t-test. (D) Quantitative analysis of BP morphology at mitosis (PhVim+ cells in the SVZ), as determined by the presence (radial, green) or absence (nonpolar, yellow) of PhVim+ radial processes, in non-electroporated (FP–), control-electroporated (Con) and ARHGAP11B-electroporated (11B) embryos. Data are the mean of 4 experiments. Error bars indicate SD; n.s., not statistically significant; two-way ANOVA with Bonferroni post-hoc tests (Radial; Con vs. 11B, p = 0.14; FP– vs. 11B, p >0.99; Con vs. FP–, p =0.059). (E) Quantification of FP– mitotic cells, as revealed by PhVim immunofluorescence, in a 200 µm-wide field of the cortical wall of embryos subjected to control (white) and ARHGAP11B (black) electroporations. Apical, mitoses lining the ventricular surface; basal, mitoses away from the ventricle (Abv.VZ, abventricular VZ; ISVZ; OSVZ). Data are the mean of 4 experiments. Error bars indicate SD; n.s., not statistically significant; Student's t-test. (F) Quantification of the thickness of VZ (left), ISVZ (middle) and OSVZ (right), upon control (white circles) and ARHGAP11B (black circles) electroporations. Data are the mean of 4 experiments. Error bars indicate SD; n.s., not statistically significant; Student's t-test.
Figure 2 with 1 supplement
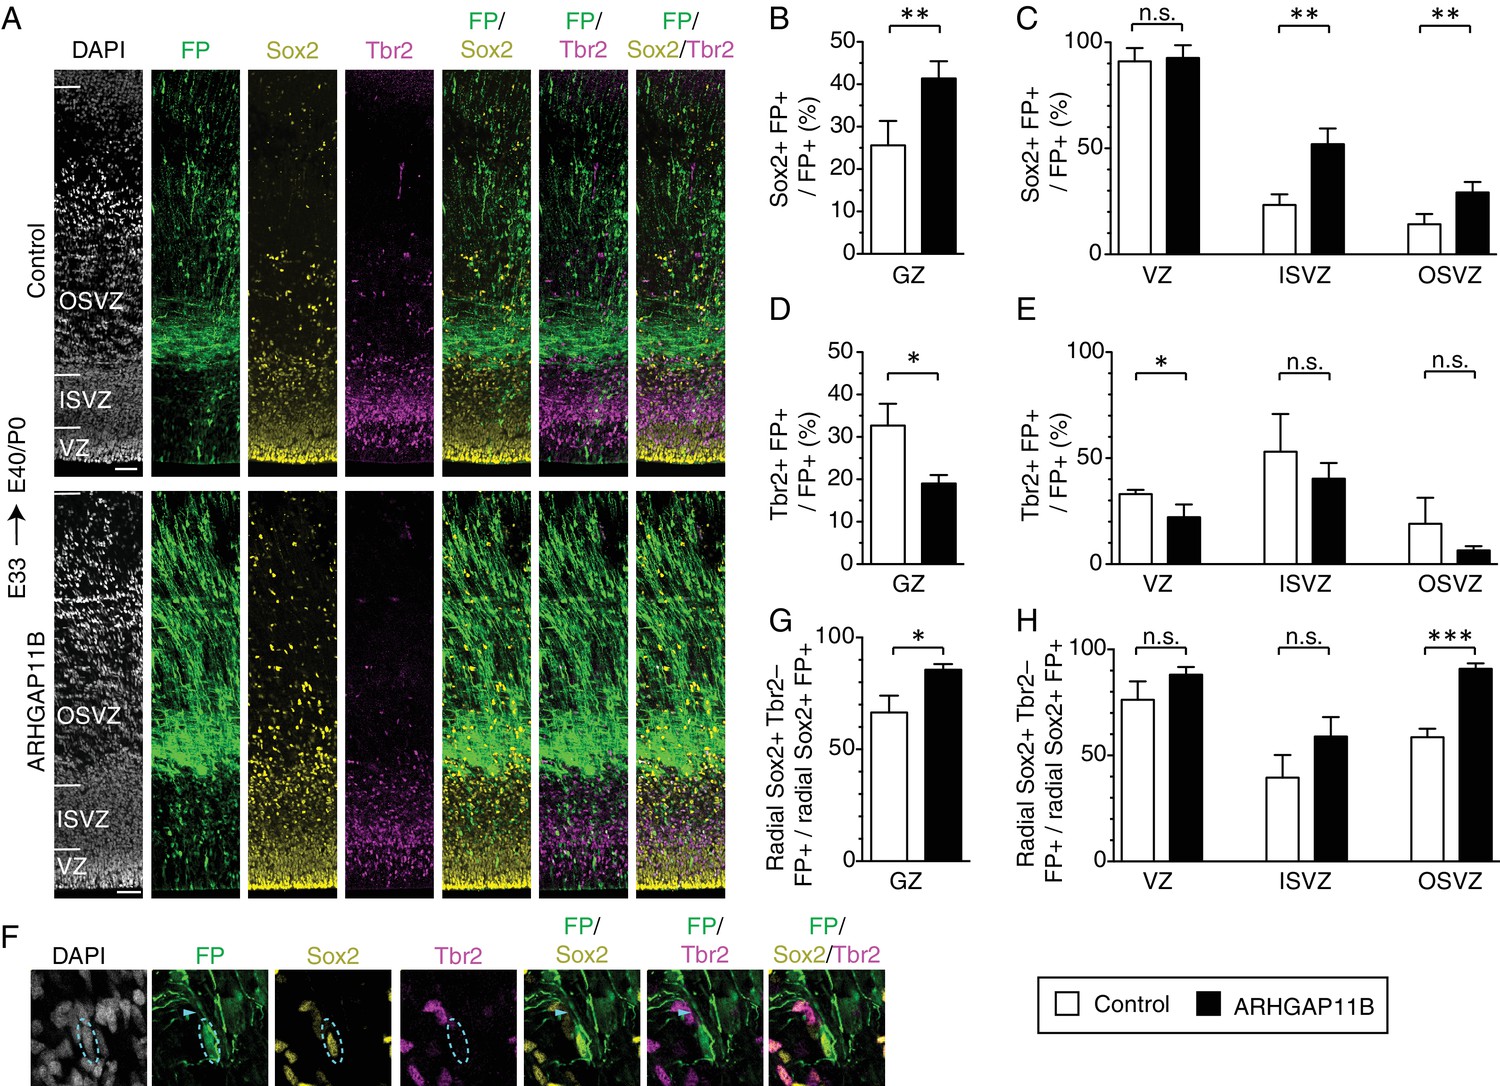
ARHGAP11B increases the proportion of Sox2-positive bRG that are Tbr2-negative.
Ferret E33 neocortex was electroporated in utero with a plasmid encoding FP together with either a plasmid encoding ARHGAP11B or empty vector (Control), followed by triple immunofluorescence for FP (green), Sox2 (yellow) and Tbr2 (magenta), combined with DAPI staining (white), at E40/P0. (A) Overview of the electroporated areas (single optical sections). Scale bars, 50 μm. (B, C) Percentage of FP+ cells in the germinal zones (B, GZ) and in the VZ (C, left), ISVZ (C, center) and OSVZ (C, right) that are Sox2+ upon control (white) and ARHGAP11B (black) electroporations. (D, E) Percentage of FP+ cells in the germinal zones (D, GZ) and in the VZ (E, left), ISVZ (E, center) and OSVZ (E, right) that are Tbr2+ upon control (white) and ARHGAP11B (black) electroporations. (F) Proliferative bRG (Sox2+ Tbr2– cell in the SVZ exhibiting radial morphology, single optical sections). Triple immunofluorescence for FP (green), Sox2 (yellow) and Tbr2 (magenta), combined with DAPI staining (white), upon electroporation of the plasmid encoding FP together with the plasmid encoding ARHGAP11B. Dashed lines, cell body; arrowheads, radial process. Images are oriented with the apical side facing down and are 25 μm wide. (G, H) Percentage of Sox2+ FP+ cells exhibiting radial morphology in the germinal zones (G, GZ) and in the VZ (H, left), ISVZ (H, center) and OSVZ (H, right) that are Tbr2– upon control (white) and ARHGAP11B (black) electroporations. (B–E, G, H) Data are the mean of 4 experiments. Error bars indicate SD; ***, p <0.001; **, p <0.01; *, p <0.05; n.s., not statistically significant; Student's t-test.
Figure 2—figure supplement 1

ARHGAP11B expression does not affect the proportion of Sox2+ Tbr2+ vs. Sox2+ Tbr2– cells in the ISVZ.
Ferret E33 neocortex was electroporated in utero with a plasmid encoding FP together with either a plasmid encoding ARHGAP11B or empty vector (Control), followed by analysis at E40/P0. Percentage of Sox2+ FP+ progenitors in the ISVZ that are Tbr2+ (green) and Tbr2– (yellow) upon control (Con) and ARHGAP11B (11B) electroporations. Data are the mean of 4 experiments. Error bars indicate SD; n.s., not statistically significant; two-way ANOVA with Bonferroni post-hoc tests (Tbr2+; Con vs. 11B, p =0.59).
Figure 3 with 2 supplements
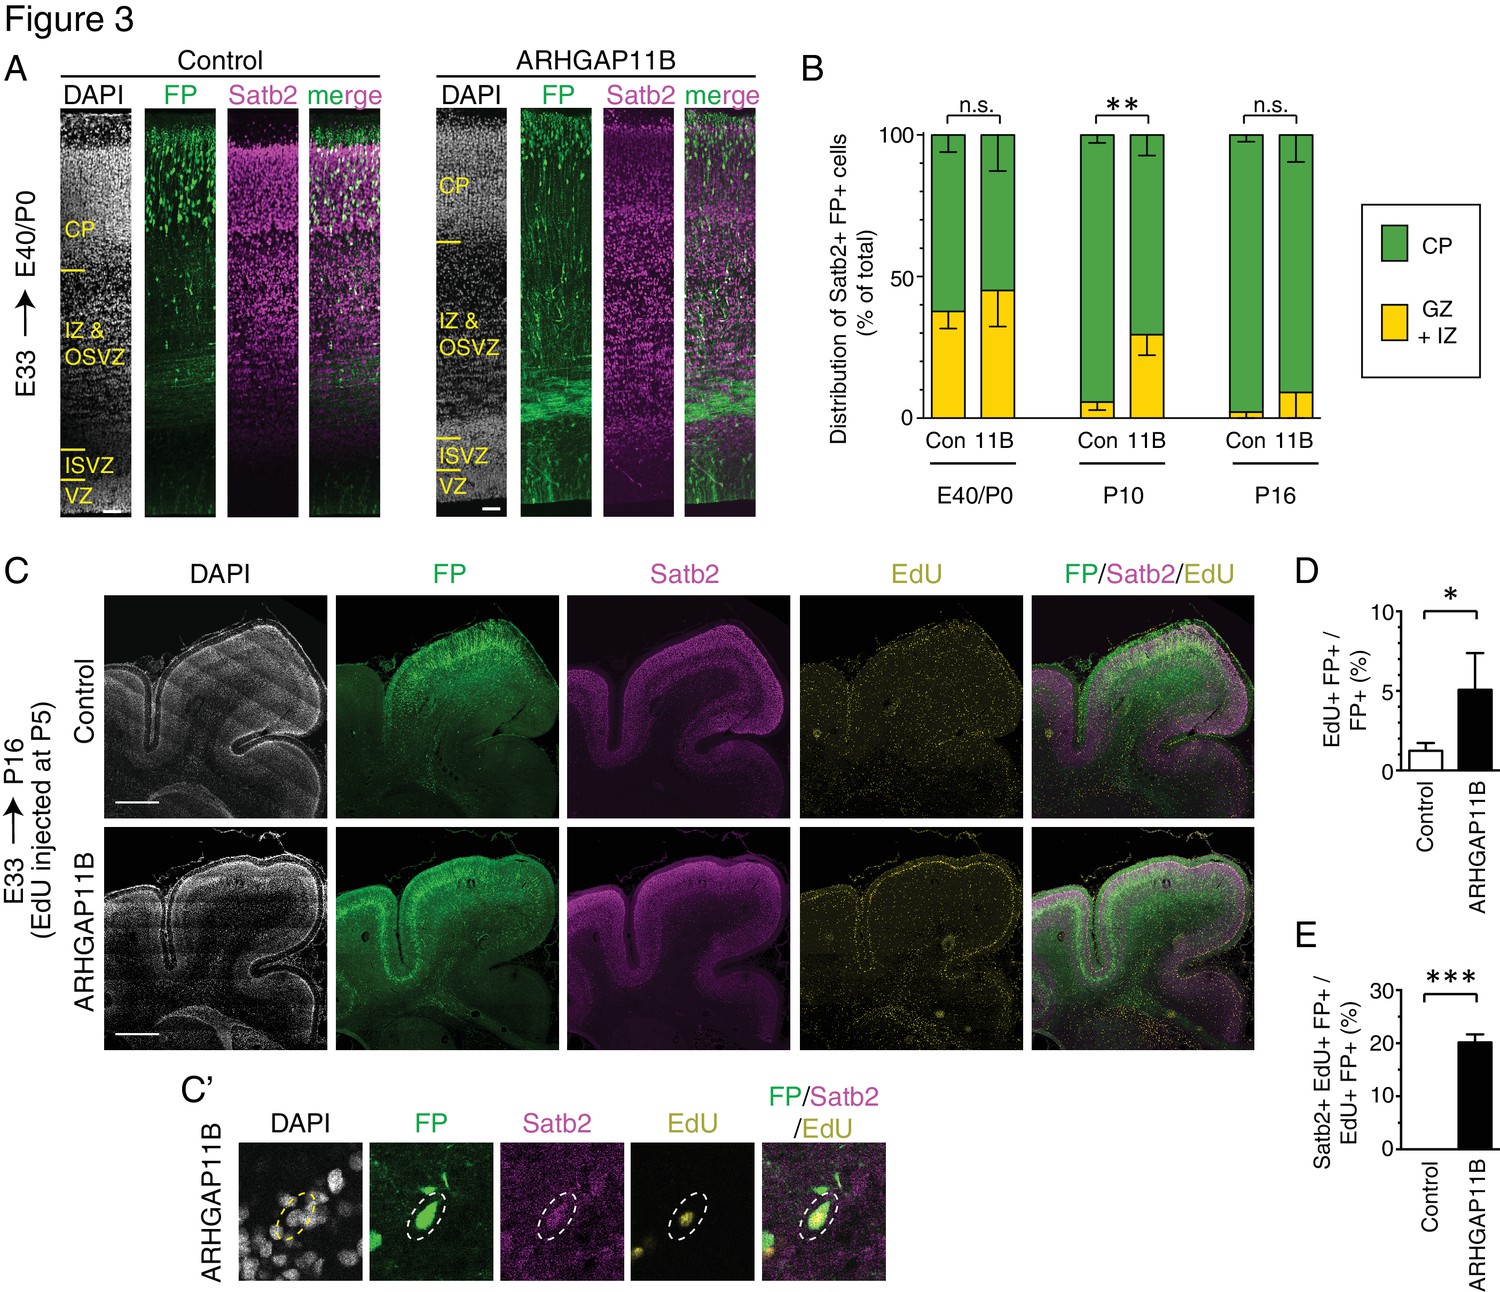
ARHGAP11B expression in developing ferret neocortex results in an extended neurogenic period.
Ferret E33 neocortex was electroporated in utero with a plasmid encoding FP, together with either a plasmid encoding ARHGAP11B or empty vector (Control), followed by analysis at E40/P0 (A, B left), P10 (B center) and P16 (B right, (C–E). (A) Double immunofluorescence for FP (green) and Satb2 (magenta), combined with DAPI staining (white), of the E40/P0 ferret neocortex. The immunofluorescence of the same cryosection for Tbr1 is shown in Figure 3—figure supplement 1A. Images are single optical sections. Scale bars, 50 μm. (B) Distribution of Satb2+ FP+ neurons at E40/P0 (left), P10 (center) and P16 (right), between the cortical plate (CP, green) and germinal zones plus intermediate zone (GZ + IZ, yellow), upon control (Con, left) and ARHGAP11B (11B, right) electroporations. Data are the mean of 3 (P0 and P10) or 4 (P16) experiments. Error bars indicate SD; **, p <0.01; n.s., not statistically significant; two-way ANOVA with Bonferroni post-hoc tests (P10, Control CP vs. ARHGAP11B CP, p =0.0015). (C) Triple (immuno)fluorescence for FP (green), Satb2 (magenta) and EdU (yellow), combined with DAPI staining (white), of the P16 ferret neocortex, upon EdU injection at P5. Images are single optical sections. Scale bars, 1 mm. (C') Higher magnification of a FP+ Satb2+ EdU+ neuron upon electroporation of the plasmid encoding FP together with the plasmid encoding ARHGAP11B. Dashed lines, cell body. Images (single optical sections) are oriented with the apical side facing down and are 50 μm wide. (D) Percentage of FP+ cells that are EdU+ upon control (white) and ARHGAP11B (black) electroporations. (E) Percentage of EdU+ FP+ cells that are Satb2+ upon control (white) and ARHGAP11B (black) electroporations. (D, E) Data are the mean of 3 experiments. Error bars indicate SD; ***, p <0.001; *, p <0.05; Student's t-test.
Figure 3—figure supplement 1

Almost all neurons generated from ARHGAP11B-expressing progenitors are Satb2+.
Ferret E33 neocortex was electroporated in utero with a plasmid encoding FP together with either a plasmid encoding ARHGAP11B or empty vector (Control), followed by triple immunofluorescence for FP, Tbr1 and Satb2, combined with DAPI staining, at E40/P0. (A) Overview of the electroporated areas showing the immunofluorescence for Tbr1 (yellow) and FP (green) and the DAPI staining (white) (single optical sections). Note that the DAPI staining and FP immunofluorescence images are the same as in Figure 3A; for Satb2 staining, see Figure 3A. Scale bars, 50 μm. (B) Percentages of FP+ cells that are Satb2+ Tbr1– (blue), Satb2+ Tbr1+ (purple) and Satb2– Tbr1+ (yellow), upon control (left) and ARHGAP11B (right) electroporations. Data are the mean of 3 experiments. Error bars indicate SD.
Figure 3—figure supplement 2
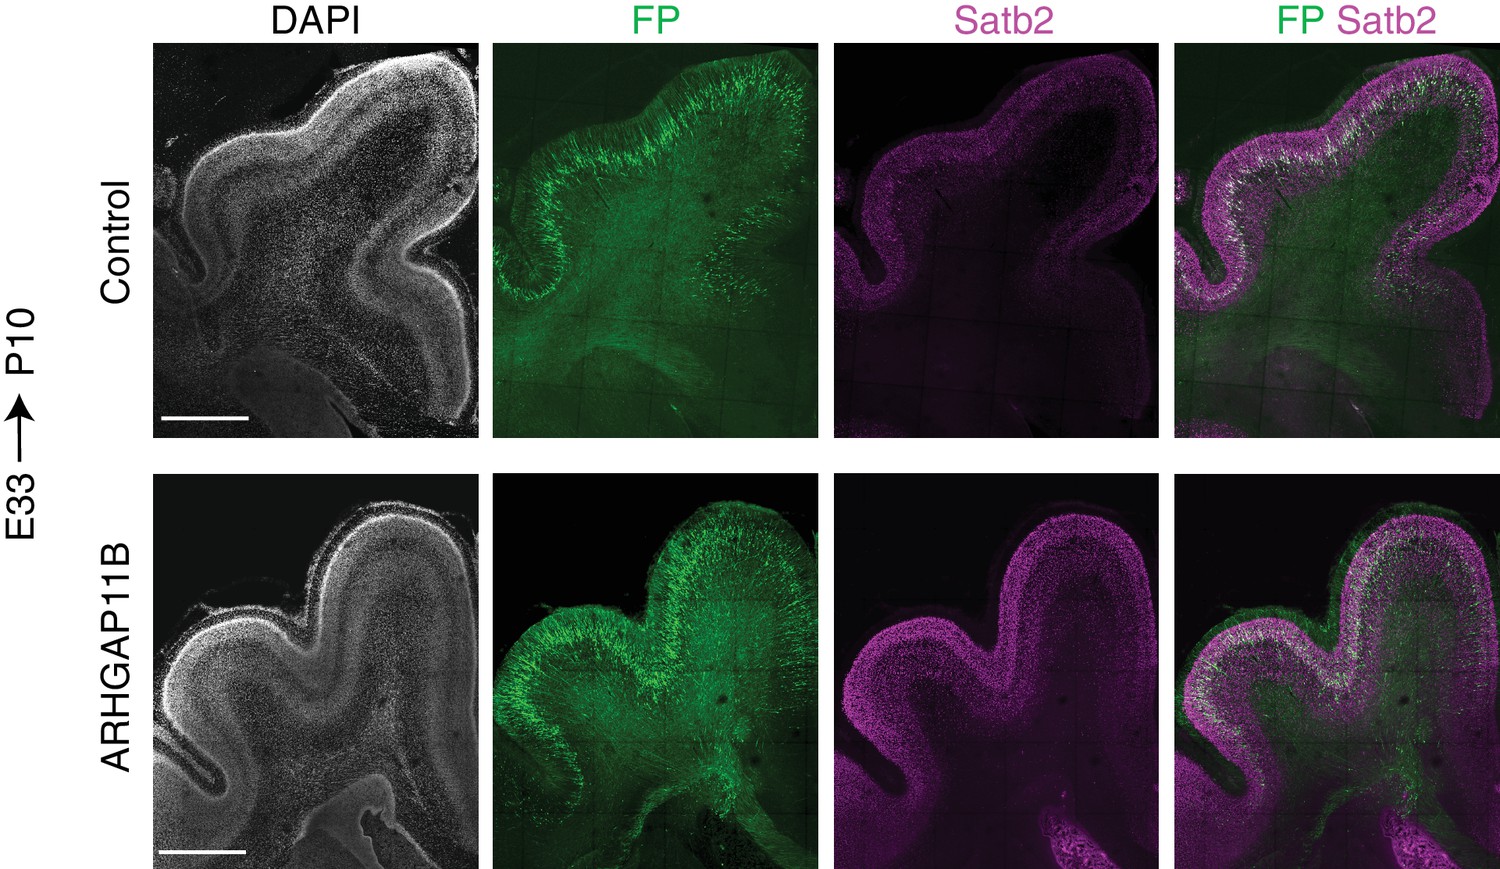
FP and Satb2 immunostaining patterns of control and ARHGAP11B-expressing developing ferret neocortex at P10.
Ferret E33 neocortex was electroporated in utero with a plasmid encoding FP together with either a plasmid encoding ARHGAP11B or empty vector (Control), followed by double immunofluorescence for FP (green) and Satb2 (magenta), combined with DAPI staining (white), at P10. Images are maximum intensity projections of 5 optical sections. Scale bars, 1 mm.
Figure 4 with 6 supplements
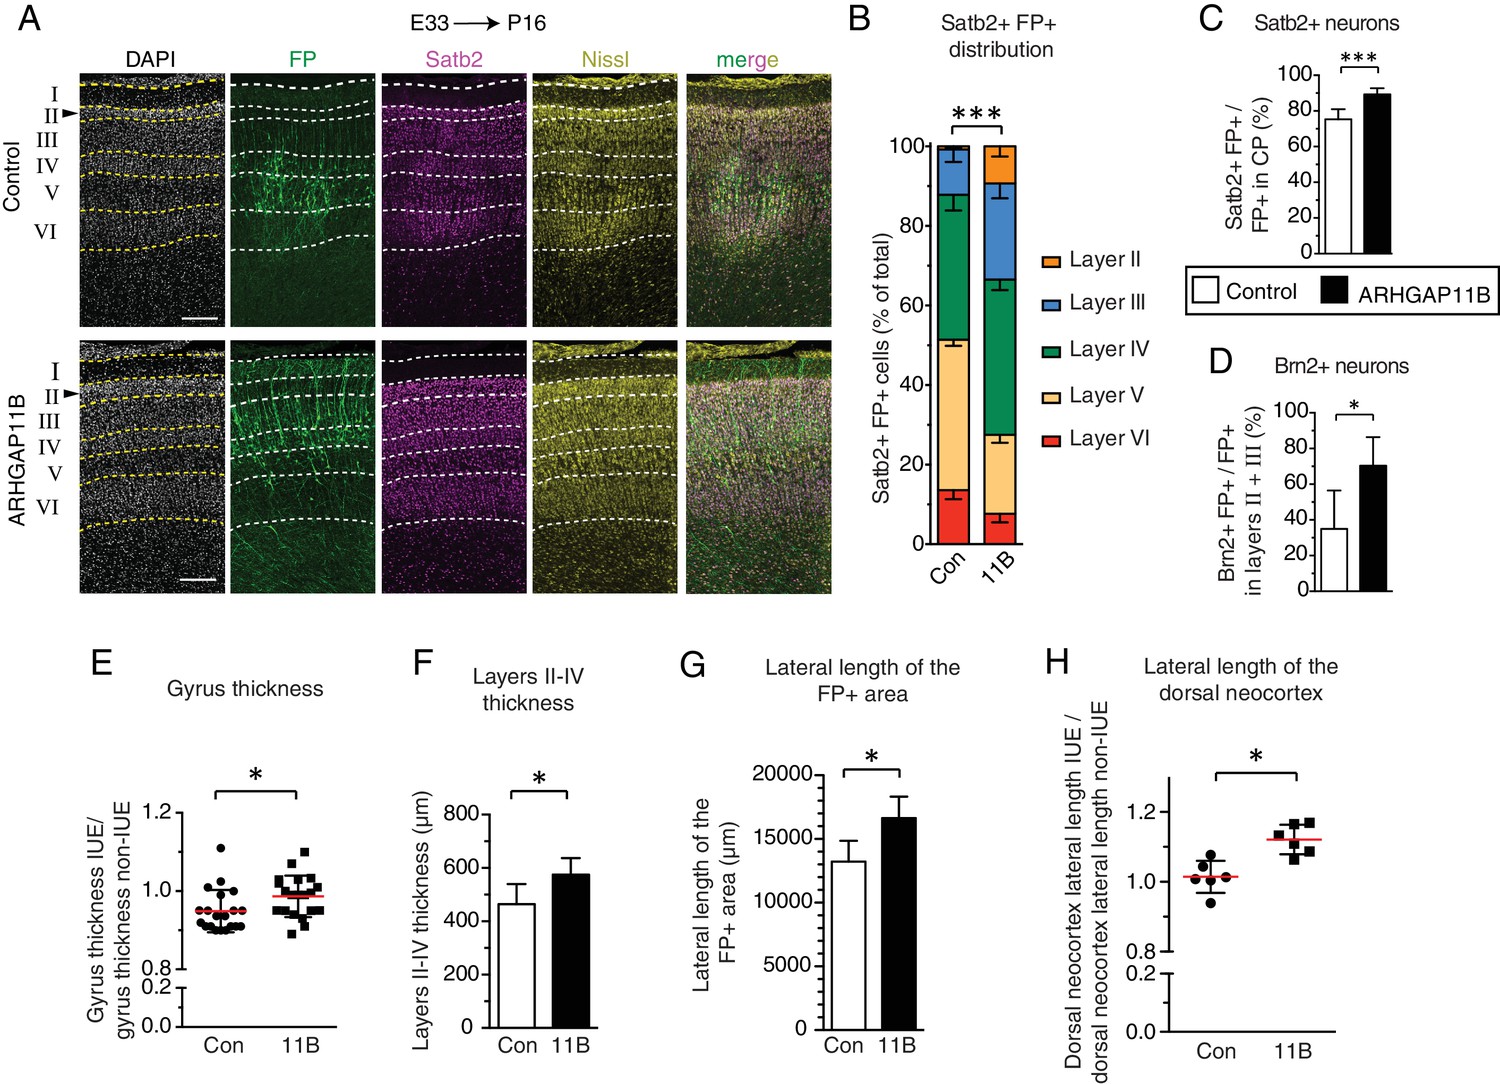
ARHGAP11B expression results in a greater abundance of upper-layer neurons and expansion of the developing ferret neocortex.
Ferret E33 neocortex was electroporated in utero with a plasmid encoding FP, together with either a plasmid encoding ARHGAP11B or empty vector (Control), followed by analysis at P16. (A) Double immunofluorescence for FP (green) and Satb2 (magenta), combined with DAPI (white) and Nissl (yellow) staining, of the CP (single optical sections). Neuronal layers are marked on the left. Arrowheads, increased thickness of layer II upon ARHGAP11B expression. Scale bars, 200 μm. (B) Distribution of Satb2+ FP+ neurons between the neuronal layers upon control (Con, left) and ARHGAP11B (11B, right) electroporations. Data are the mean of 6 experiments. Error bars indicate SD; ***, p <0.001; two-way ANOVA with Bonferroni post-hoc tests (Layer V, Control vs. ARHGAP11B, p <0.0001; Layer III, Control vs. ARHGAP11B, p =0.0073) (C) Percentage of FP+ cells in the CP that are Satb2+, upon control (white) and ARHGAP11B (black) electroporations. Data are the mean of 6 experiments. Error bars indicate SD; ***, p <0.001; Student's t-test. (D) Percentage of FP+ cells in layers II + III that are Brn2+, upon control (white) and ARHGAP11B (black) electroporations. Data are the mean of 5 experiments. Error bars indicate SD; *, p <0.05; Student's t-test. (E) Quantification of the gyrus thickness of control (Con) and ARHGAP11B-expressing (11B) ferret neocortex. Measurements were performed as described in Figure 4—figure supplement 3. All data are expressed as ratio between electroporated hemisphere (IUE) and non-electroporated contralateral hemisphere (non-IUE). Data are the mean (red lines) of 20 gyri per condition from six neocortices per condition. Error bars indicate SD; *, p <0.05; Student's t-test. (F) Quantification of layers II-IV thickness, upon control (Con, white) and ARHGAP11B (11B, black) electroporations. Data are the mean of 6 experiments. Error bars indicate SD; *, p <0.05; Student's t-test. (G) Quantification of the lateral length of the entire areas harbouring FP+ cells, measured as depicted in Figure 4—figure supplement 5A top, upon control (Con, white) and ARHGAP11B (11B, black) electroporations. Data are the mean of 6 experiments. Error bars indicate SD; **, p <0.01; Student's t-test. (H) Quantification of the lateral length of the dorsal neocortex, measured as depicted in Figure 4—figure supplement 5A bottom, upon control (Con) and ARHGAP11B (11B) electroporations. All data are expressed as ratio between electroporated hemisphere (IUE) and non-electroporated contralateral hemisphere (non-IUE). Data are the mean of 6 experiments. Error bars indicate SD; *, p <0.05; Student's t-test.
Figure 4—figure supplement 1
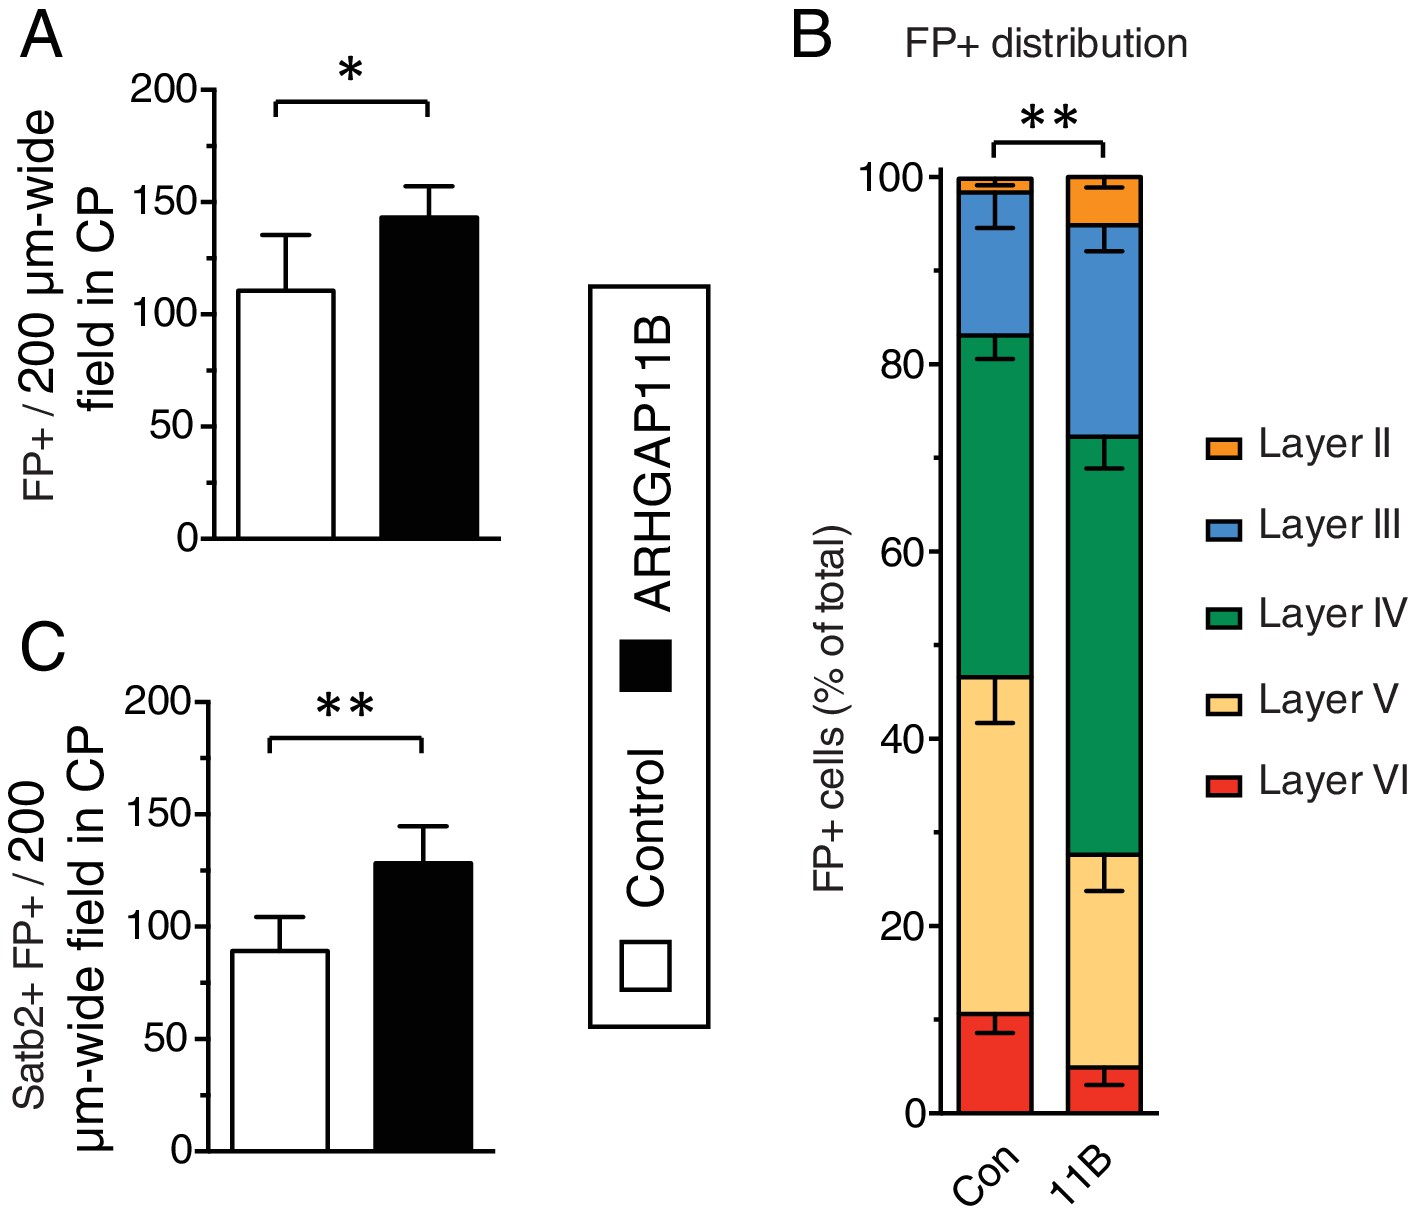
ARHGAP11B expression results in a greater abundance of FP+ cells and FP+ Satb2+ neurons in the CP.
Ferret E33 neocortex was electroporated in utero with a plasmid encoding FP together with either a plasmid encoding ARHGAP11B or empty vector (Control), followed by analysis at P16. (A, C) Quantification of FP+ cells (A) and Satb2+ FP+ cells (C) in a 200 µm-wide field in the CP, upon control (white) and ARHGAP11B (black) electroporations. Data are the mean of 6 experiments. Error bars indicate SD; **, p <0.01; *, p <0.05; Student's t-test. (B) Distribution of FP+ cells between the neuronal layers upon control (Con, left) and ARHGAP11B (11B, right) electroporations. Data are the mean of 6 experiments. Error bars indicate SD; **, p <0.01; two-way ANOVA with Bonferroni post-hoc tests (Layer V, Control vs. ARHGAP11B, p =0.014).
Figure 4—figure supplement 2
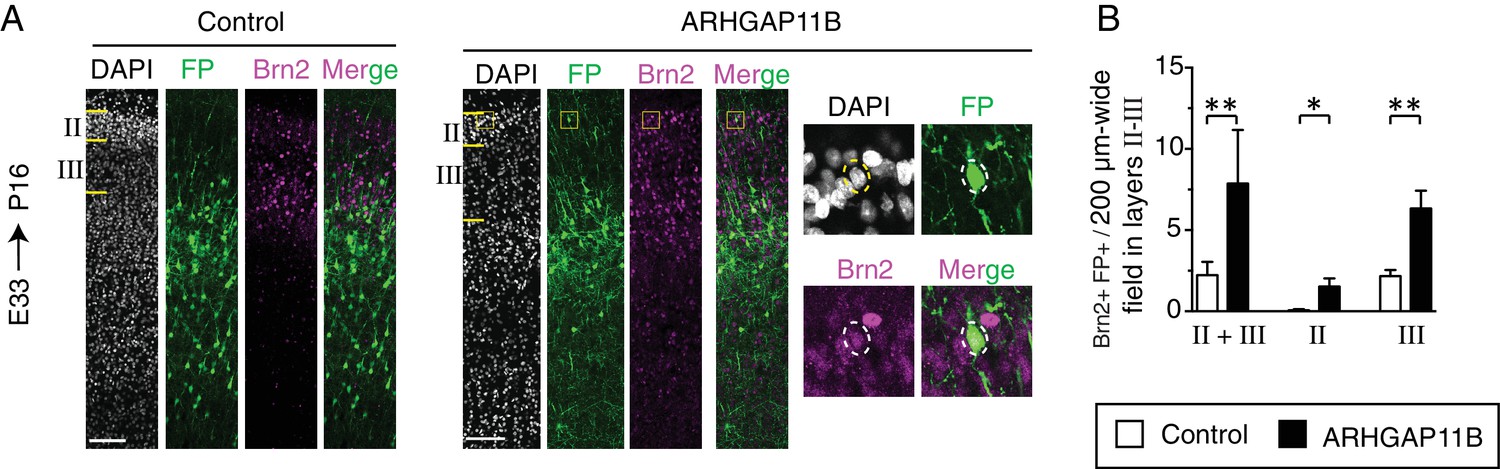
ARHGAP11B expression results in a greater abundance of FP+ Brn2+ neurons in cortical layers II and III.
Ferret E33 neocortex was electroporated in utero with a plasmid encoding FP together with either a plasmid encoding ARHGAP11B or empty vector (Control), followed by double immunofluorescence for FP and Brn2, combined with DAPI staining, at P16. (A) Overview of the CP of the electroporated area showing the immunofluorescence for FP (green) and Brn2 (magenta) and the DAPI staining (white) (single optical sections). Layers II and III are indicated on the left. Scale bars, 100 μm. Boxes (50 × 50 μm) indicate a Brn2+ FP+ neuron in layer II, shown at higher magnification on the right. Dashed lines, cell body. (B) Quantification of Brn2+ FP+ cells in a 200 µm-wide field in layers II + III (left), in layer II only (center) and in layer III only (right), upon control (white) and ARHGAP11B (black) electroporations. Data are the mean of 5 experiments. Error bars indicate SD; **, p <0.01; *, p <0.05; Student's t-test.
Figure 4—figure supplement 3

ARHGAP11B expression in developing ferret neocortex does not increase neocortical folding.
Ferret E33 neocortex was electroporated in utero with a plasmid encoding FP together with either a plasmid encoding ARHGAP11B or empty vector (Control), followed by analysis at P16. (A) Image of an electroporated brain, with the electroporated area in orange. R, rostral; C, caudal. (B) Schematic representation of the P16 ferret brain (dorsal view). Lines 1 and 2 indicate the positions at which all the morphological measurements were performed. Position one is exemplified in (C) and position two in (D). Gyri and sulci used for the morphological measurements are indicated in green and blue, respectively. For morphological parameters of gyri, the posterior sigmoid gyrus (psg, position 1), lateral gyrus (lg, position 2) and the coronal gyrus (cg, positions 1 and 2) were analyzed; for morphological parameters of sulci, the cruciate sulcus (cs, position 1), lateral sulcus (ls, position 2) and the suprasylvian sulcus (ss, positions 1 and 2) were analyzed. Please refer to Sawada and Watanabe (2012) for the ferret gyri and sulci nomenclature. (C) Immunofluorescence for FP (green), combined with DAPI staining (white), of electroporated brains at position 1 (see B). Images are single optical sections. Scale bar, 1 mm. Two gyri and two sulci used for the morphological measurements at position one are indicated in green and blue, respectively (see (B) for abbreviations). (D) Graphical definition of the measured morphological parameters. Double immunofluorescence for FP (green) and GFAP (magenta), combined with DAPI staining (white), of electroporated brain at position 2 (see B). Image (shown twice) is a single optical section. Yellow lines indicate measured morphological parameters. Two gyri and two sulci used for the morphological measurements at position two are indicated in green and blue, respectively, in the left image (see (B) for abbreviations). See also Materials and methods section for details of morphological measurements. (E) Quantification of the weight of the control (Con) and ARHGAP11B-expressing (11B) ferret brains. Data are the mean (red lines) of 7 (control) or 9 (ARHGAP11B) brains. (F–I) Quantification of the indicated morphological parameters (see (D)), that is the gyrification index of the electroporated area (referred to as local GI) (F), gyrus size (G), sulcus depth (H) and sulcus thickness (I), of control (Con) and ARHGAP11B-expressing (11B) ferret neocortex. Measurements were performed at positions 1 and 2 using the gyri and sulci indicated in (B–D), yielding up to four data points for gyrus morphology and four data points for sulcus morphology per single brain. All data are expressed as ratio between electroporated hemisphere (IUE) and non-electroporated contra-lateral hemisphere (non-IUE). (F–H) Data are the mean (red lines) of 6 neocortices per condition. (I) Data are the mean (red lines) of 18 (control) and 19 (ARHGAP11B) sulci from six neocortices per condition. (E–I) Error bars indicate SD; n.s., not statistically significant; Student's t-test.
Figure 4—figure supplement 4
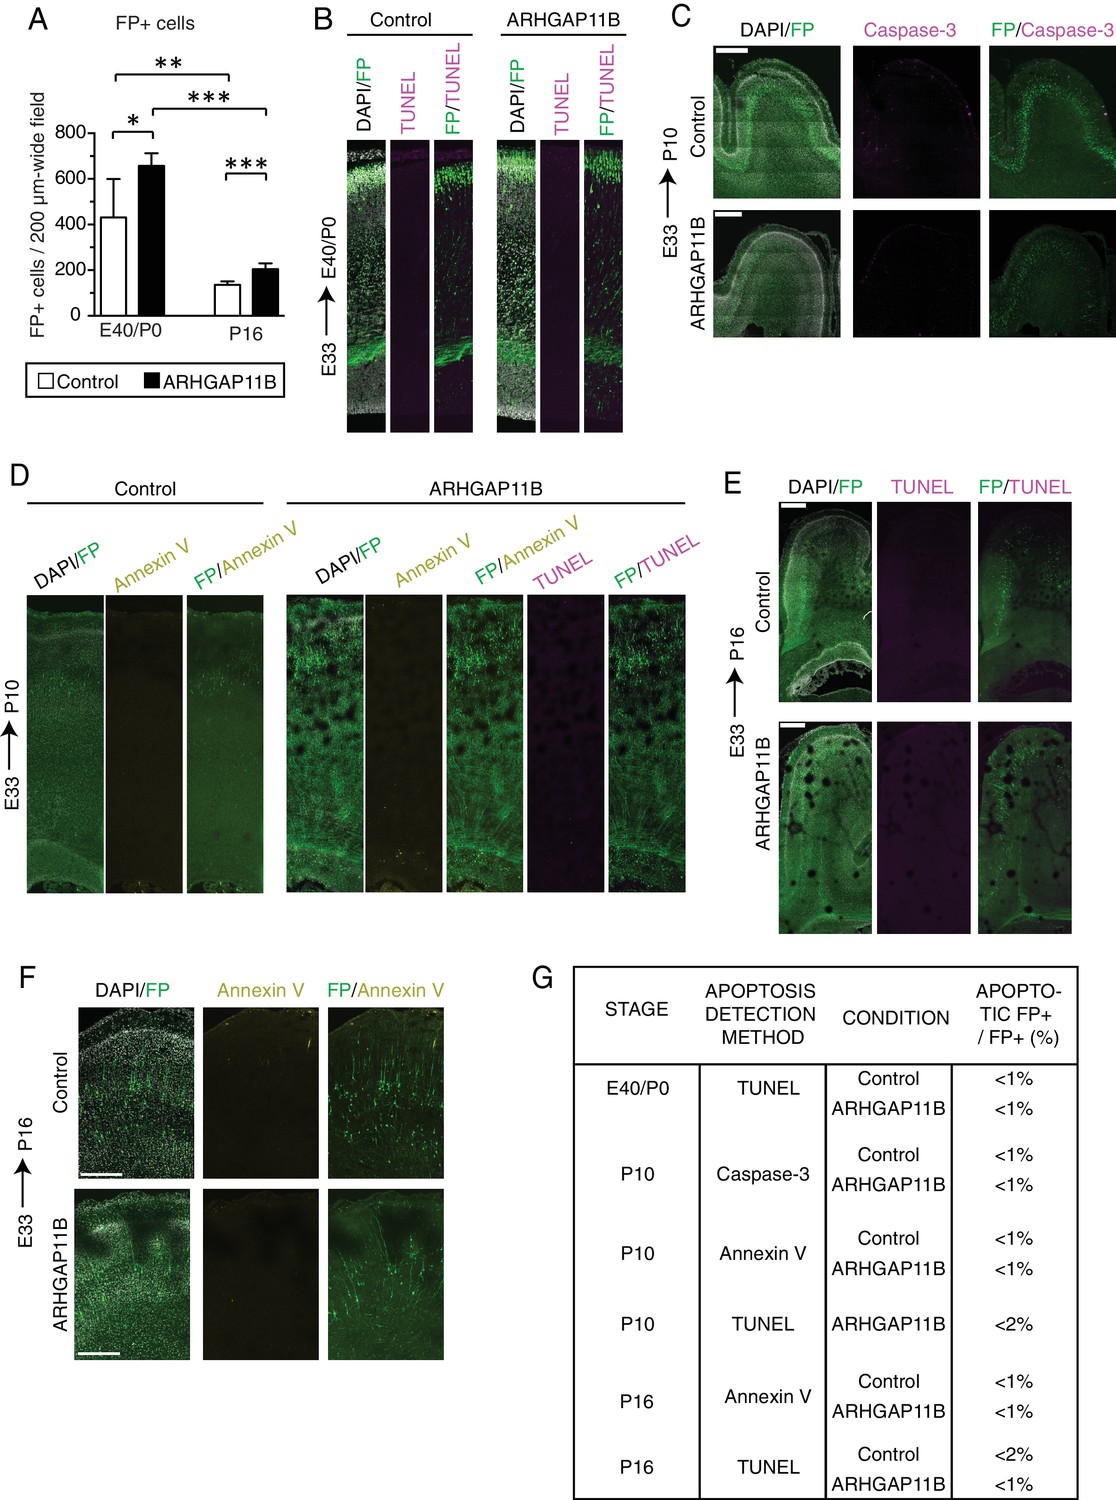
ARHGAP11B expression in developing ferret neocortex does not lead to increased cell death.
Ferret E33 neocortex was electroporated in utero with a plasmid encoding FP together with either a plasmid encoding ARHGAP11B or empty vector (Control), followed by analysis at E40/P0 (A, B, G), P10 (C, D, G) and P16 (A, E–G). (A) Quantification of the number of FP+ cells in a 200 µm-wide field of cortical wall at E40/P0 (left) and P16 (right), upon control (white) and ARHGAP11B (black) electroporations. Data are the mean of 6 experiments. Error bars indicate SD; ***, p <0.001; **, p <0.01; *, p <0.05; Student's t-test. (B) Immunofluorescence for FP (green), combined with DAPI staining (white) and TUNEL (terminal deoxynucleotidyl transferase dUTP nick end labeling) staining (magenta), of the E40/P0 ferret neocortex. Image width, 200 μm. (C) Double immunofluorescence for FP (green) and Caspase-3 (magenta), combined with DAPI staining (white), of the P10 ferret neocortex. Scale bar, 500 μm. (D) Immunofluorescence for FP (green), combined with staining using fluorescently labeled annexin V (yellow) and DAPI staining (white), of the P10 ferret neocortex. TUNEL staining (magenta) is shown for the ARHGAP11B-expressing neocortex. Image width, 200 μm. (E) Immunofluorescence for FP (green), combined with DAPI staining (white) and TUNEL staining (magenta), of the P16 ferret neocortex. Scale bar, 500 μm. (F) Immunofluorescence for FP (green), combined with staining using fluorescently labeled annexin V (yellow) and DAPI staining (white), of the cortical plate of the P16 ferret neocortex. Scale bar, 300 μm. (B–F) All images are single optical sections. (G) Percentage of FP+ cells that are apoptotic. Note that at all stages analyzed and by all detection methods, ARHGAP11B-expressing neocortex does not show an increase in apoptosis. Data are the mean of at least two neocortices per condition.
Figure 4—figure supplement 5
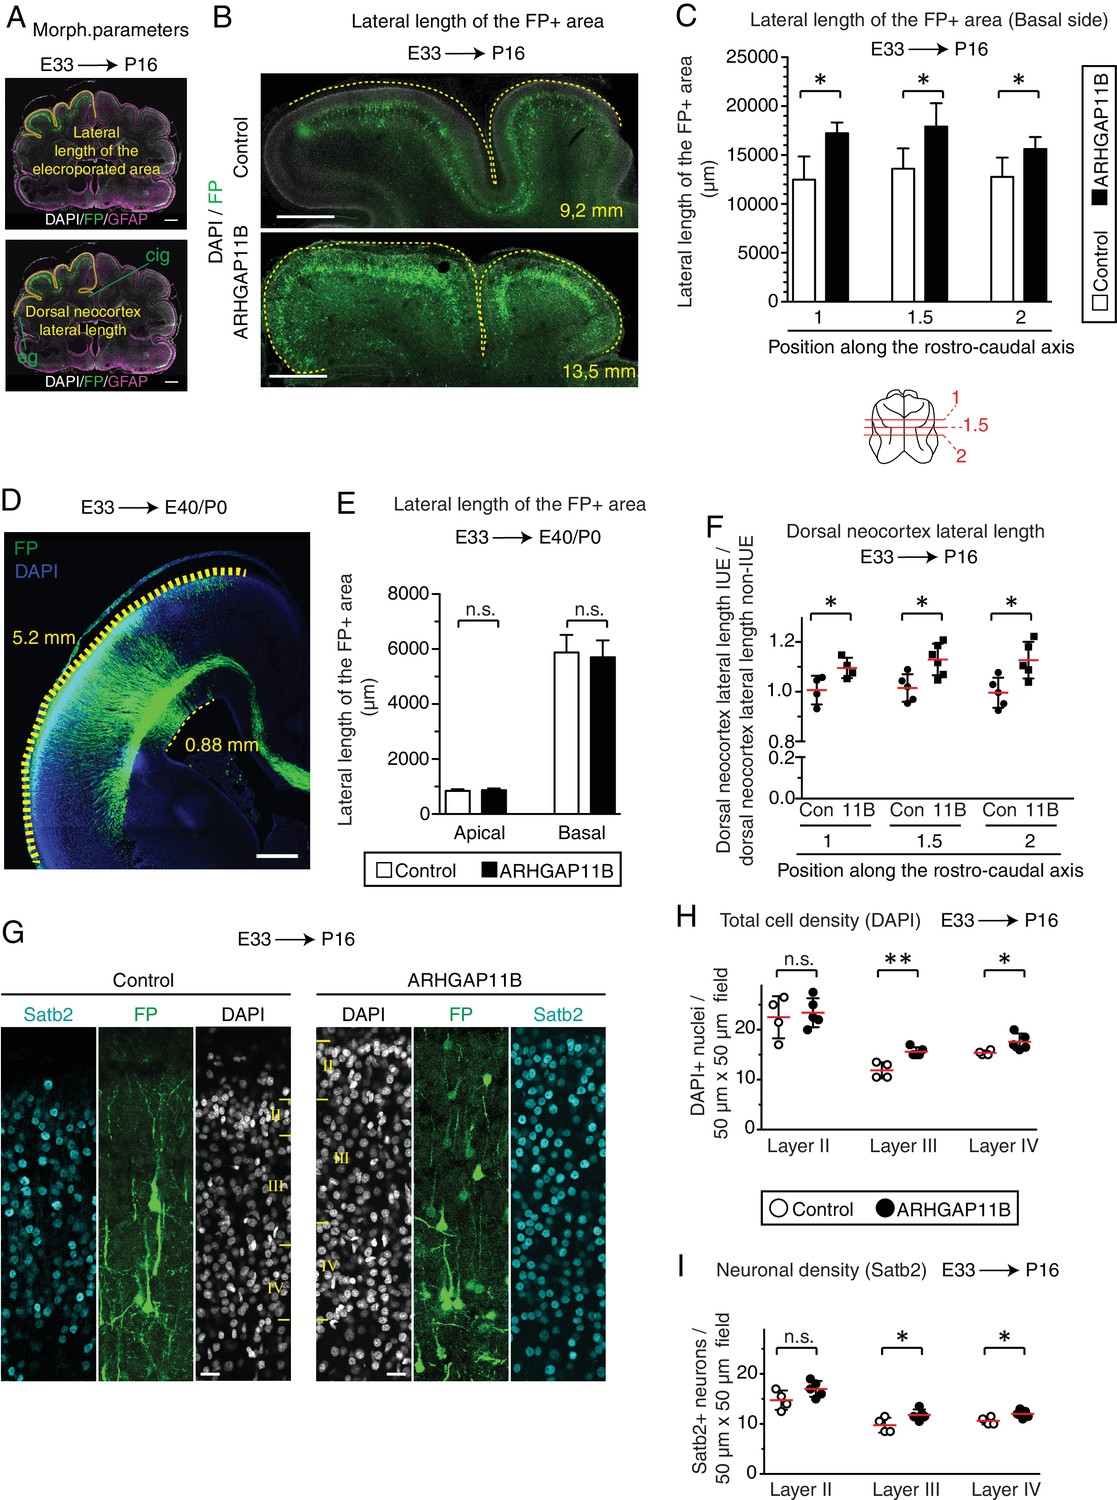
ARHGAP11B expression in developing ferret neocortex leads to its tangential expansion and an increase in cell density.
Ferret E33 neocortex was electroporated in utero with a plasmid encoding FP together with either a plasmid encoding ARHGAP11B or empty vector (Control), followed by analysis of tangential expansion (A–F) and cell density (G–I) at E40/P0 (D, E) and P16 (all other panels). (A) Graphical definition of the lateral length of the FP +area (top) and the lateral length of dorsal neocortex (bottom). Double immunofluorescence for FP (green) and GFAP (magenta), combined with DAPI staining (white), of electroporated brain at position 2 (same image as in Figure 4—figure supplement 3D). Image (shown twice) is a single optical section. Yellow lines indicate the two morphological parameters measured. Lateral length of the FP+ area is defined by the position of FP+ cells. Lateral length of the dorsal neocortex is defined as the distance between the cingulate gyrus (cig) and the ectosylvian gyrus (eg). See also Materials and methods section for details. (B) Immunofluorescence for FP (green), combined with DAPI staining (white), of the areas harbouring FP+ cells (single optical sections). Dashed lines, basal contour of the FP+ area. Lateral length of the respective contour is indicated in the bottom right corner. Note that the images and the countours depict only the areas with a high abundance of FP+ cells, which is distinct from the quantification shown in (C). Scale bars, 1 mm. (C) Quantification of the lateral length of the entire areas harbouring FP+ cells, measured as depicted in (A top), at three different positions along the rostro-caudal axis (positions 1 and 2, and an intermediate position referred to as 1.5) as depicted at the bottom of the panel, upon control (white) and ARHGAP11B (black) electroporations. Data are the mean of 6 experiments. Error bars indicate SD; *, p <0.05; Student's t-test. (D) Immunofluorescence for FP (green), combined with DAPI staining (blue), of an area harbouring FP+ cells at E40/P0 (single optical sections). Thick dashed line, basal contour of the FP+ area; thin dashed line, apical contour of the electroporated area. Numbers indicate basal and apical lateral length of the FP+ area and the electroporated area, respectively. Scale bar, 500 µm. (E) Quantification of the apical (left) and basal (right) lateral lengths of the areas harbouring FP+ cells at E40/P0, measured as depicted in (D), upon control (white) and ARHGAP11B (black) electroporations. Data are the mean of 4 experiments. Error bars indicate SD; n.s., not statistically significant; Student's t-test. (F) Quantification of the lateral length of the dorsal neocortex, measured as depicted in (A bottom), at positions 1, 1.5 and 2 along the rostro-caudal axis, upon control (Con) and ARHGAP11B (11B) electroporations. Data are expressed as ratio between electroporated hemisphere (IUE) and non-electroporated contra-lateral hemisphere (non-IUE). Data are the mean of 6 experiments. Error bars indicate SD; *, p <0.05; Student's t-test. (G) Immunofluorescence for FP (green) and Satb2 (cyan), combined with DAPI staining (white), of the indicated upper layers of the CP at position 2. Images are single optical sections. Scale bars, 20 μm. (H, I) Cell density quantification. Cell density was measured in 50 μm x 50 μm fields of layer II (left), layer III (center) and layer IV (right) of the CP, upon control (white) and ARHGAP11B (black) electroporations. (H) Quantification of the total cell density, as revealed by DAPI staining of nuclei. (I) Quantification of the neuronal density, as revealed by Satb2 staining. Data are the mean (red lines) of 4 (control) and 5 (ARHGAP11B) experiments, with three fields per layer per experiment. Error bars indicate SD; **, p <0.01; *, p <0.05; n.s., not statistically significant, Student's t-test.
Figure 4—figure supplement 6
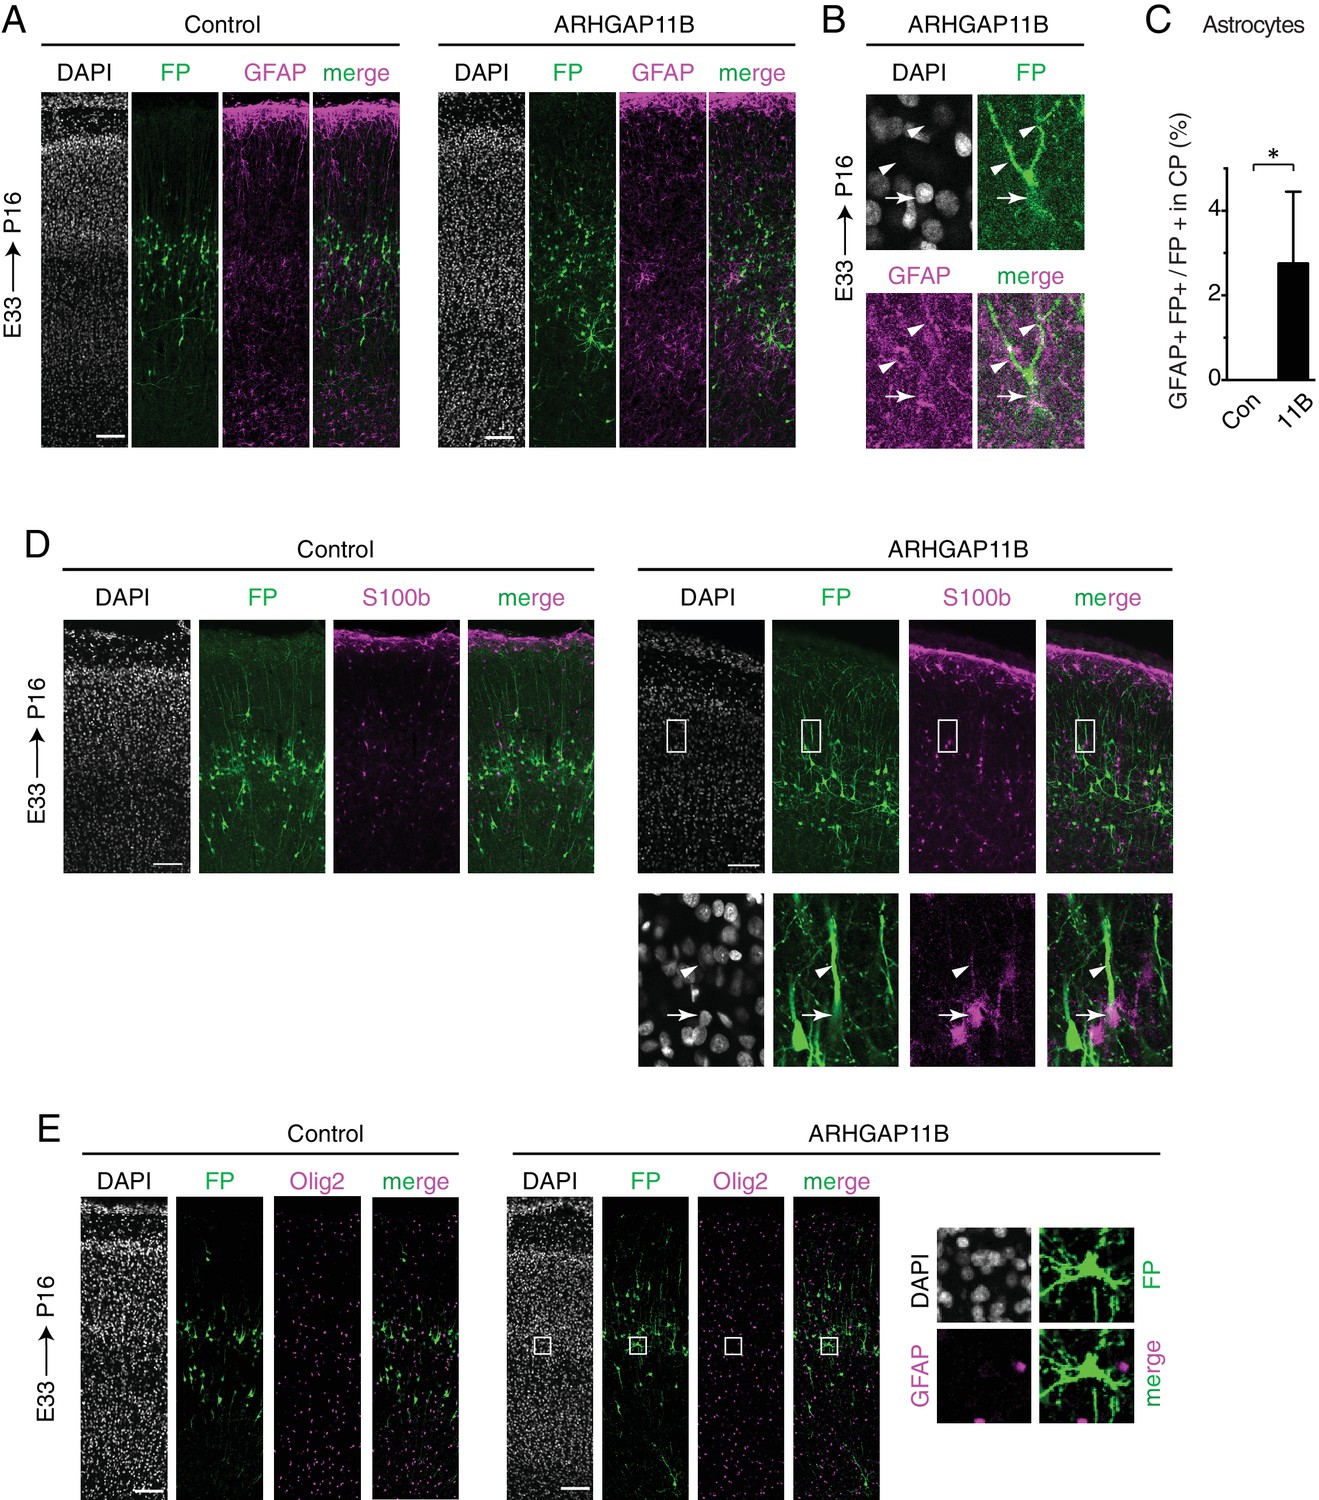
ARHGAP11B induces the appearance of astrocytes from the targeted progenitors in the developing ferret neocortex.
Ferret E33 neocortex was electroporated in utero with a plasmid encoding FP together with either a plasmid encoding ARHGAP11B or empty vector (Control), followed by analysis at P16. (A, B) Double immunofluorescence for FP (green) and GFAP (magenta), combined with DAPI staining (white), of the CP (A, single optical sections). Scale bars, 100 μm. (B) High magnification of an FP+ GFAP+ ARHGAP11B-expressing cell in the CP from a different experiment than (A). Arrows, cell body; arrowheads, cell processes. Image width, 36.7 μm. (C) Percentage of FP+ cells in the CP that are GFAP+, upon control (white) and ARHGAP11B (black) electroporations. Data are the mean of 4 experiments. Error bars indicate SD; *, p <0.05, Student's t-test. (D) Double immunofluorescence for FP (green) and S100ß (magenta), combined with DAPI staining (white), of the CP (single optical sections). Scale bars, 100 μm. Boxes (75.5 μm wide) indicate an FP+ S100ß+ cell in the CP, shown at higher magnification in the bottom images. Arrows, cell body; arrowheads, cell process. (E) Double immunofluorescence for FP (green) and Olig2 (magenta), combined with DAPI staining (white), of the CP (single optical sections). Scale bars, 100 μm. Boxes (52 × 52 μm) indicate an FP+ Olig2– cell in the CP, shown at higher magnification on the right. Note that no cells were found to be FP+ Olig2+.
Tables
Key resources table
| Reagent type (species) or resource | Designation | Source or reference | Identifiers | Additional information |
|---|---|---|---|---|
| Antibody | Goat polyclonal anti-Sox2 | R + D Systems | AF2018, RRID:AB_355110 | (1:200) |
| Antibody | Goat polyclonal anti-Sox2 | Santa Cruz Biotechnology | sc-17320 RRID:AB_2286684 | (1:200) |
| Antibody | Rabbit polyclonal anti-Tbr2 | Abcam | ab23345, RRID:AB_778267 | (1:250) |
| Antibody | Mouse monoclonal anti-PCNA | Millipore | CBL407, RRID:AB_93501 | (1:200) |
| Antibody | Mouse monoclonal anti-PhVim | Abcam | ab22651, RRID:AB_447222 | (1:200) |
| Antibody | Mouse monoclonal anti-Satb2 | Abcam | ab51502, RRID:AB_882455 | (1:200) |
| Antibody | Rabbit polyclonal anti-Tbr1 | Abcam | ab31940, RRID:AB_2200219 | (1:200) |
| Antibody | Rabbit polyclonal anti-Brn2 | Proteintech | 18998–1-AP, RRID:AB_10597389 | (1:100) |
| Antibody | Rabbit polyclonal anti-Olig2 | Millipore | ab9610, RRID:AB_ 570666 | (1:500) |
| Antibody | Rabbit polyclonal anti-GFAP | Dako | Z0334, RRID:AB_10013382 | (1:1000) |
| Antibody | Rabbit polyclonal anti-S100ß | Abcam | ab868, RRID:AB_306716 | (1:200) |
| Antibody | Rabbit polyclonal anti-active Caspase 3 | Abcam | ab2302 RRID:AB_302962 | (1:200) |
| Antibody | Mouse monoclonal anti-ARHGAP11B | MPI-CBG | (1:100) | |
| Antibody | Rabbit polyclonal anti- Arhgap11A | Abcam | ab113261, RRID:AB_ 10866587 | (1:500) |
| Antibody | Chicken polyclonal anti-GFP | Aves labs | GFP1020, RRID:AB_10000240 | (1:1000) |
| Antibody | Goat polyclonal anti-GFP | MPI-CBG | (1:1000) | |
| Antibody | Rat monoclonal anti-RFP | ChromoTek | 5F8, RRID:AB _2336064 | (1:500) |
| Antibody | Rabbit polyclonal anti-RFP | Rockland antibodies | 600-401-379, RRID:AB_2209751 | (1:1000) |
| Antibody | Goat polyclonal anti- Chicken Alexa Fluor 488 | ThermoFisher Scientific | A11039, RRID:AB_142924 | (1:500) |
| Antibody | Donkey polyclonal anti- Goat Alexa Fluor 488 | ThermoFisher Scientific | A11055, RRID:AB_ 2534102 | (1:500) |
| Antibody | Donkey polyclonal anti-Goat Alexa Fluor 555 | ThermoFisher Scientific | A21432, RRID:AB_2535853 | (1:500) |
| Antibody | Donkey polyclonal anti-Goat Alexa Fluor 647 | ThermoFisher Scientific | A21447, RRID:AB_141844 | (1:500) |
| Antibody | Donkey polyclonal anti-Rabbit Alexa Fluor 488 | ThermoFisher Scientific | A21206, RRID:AB_141708 | (1:500) |
| Antibody | Donkey polyclonal anti-Rabbit Alexa Fluor 555 | ThermoFisher Scientific | A31572, RRID:AB_162543 | (1:500) |
| Antibody | Donkey polyclonal anti-Rabbit Alexa Fluor 647 | ThermoFisher Scientific | A-31573, RRID:AB_2536183 | (1:500) or (1:1000) |
| Antibody | Donkey polyclonal anti-Mouse Alexa Fluor 488 | ThermoFisher Scientific | A-21202, RRID:AB_141607 | (1:500) or (`1:1000) |
| Antibody | Donkey polyclonal anti-Mouse Alexa Fluor 555 | ThermoFisher Scientific | A31570, RRID:AB_2536180 | (1:500) |
| Antibody | Donkey polyclonal anti-Mouse Alexa Fluor 647 | ThermoFisher Scientific | A31571, RRID:AB_162542 | (1:500) |
| Antibody | Goat polyclonal anti-Rat Alexa Fluor 555 | ThermoFisher Scientific | A21434, RRID:AB_ 141733 | (1:500) or (1:1000) |
| Antibody | Goat polyclonal anti-Rabbit Cy2 | Jackson Immuno research | # 111-225-144, RRID:AB_2338021 | (1:500) |
| Antibody | Goat polyclonal anti-Mouse Cy3 | Jackson Immuno research | #115-165-166, RRID:AB_2338692 | (1:500) |
| Antibody | Goat polyclonal anti-Mouse Cy5 | Jackson Immuno research | #115-175-166, RRID:AB_2338714 | (1:500) |
| Commercial assay or kit | Maxi prep kit | Qiagen | Cat#12362 | |
| Commercial assay or kit | RNeasy FFPE RNA isolation kit | Qiagen | Cat# 73504 | |
| Commercial assay or kit | NeuroTraceTM 640/660 deep-red fluorescent Nissl stain | Molecular probes | Cat# N-21483, RRID:AB_2572212 | |
| Commercial assay or kit | In Situ Cell Death Detection Kit, TMR red (TUNEL) | Sigma- Aldrich | 12156792910 | |
| Commercial assay or kit | Annexin V Cy5 reagent | Biovision | 1013–200 | |
| Commercial assay or kit | Click-iT EdU Alexa Fluor 647 Imaging Kit | Invitrogen | C10340 | |
| Strain, strain background (Mustela putorius furo) | Ferret | Marshall Bioresources | ||
| Strain, strain background (Mustela putorius furo) | Ferret | Euroferret | ||
| Sequence-based reagent | Hprt1 FqHprt1_F TACGCTGAGGATTTGGAAAAG | This paper | oligonucleotide | |
| Sequence-based reagent | Hprt1 FqHprt1_R CCATCTCCTTCATCACGTCTC | This paper | oligonucleotide | |
| Sequence-based reagent | ARHGAP11B qARHGAP11B_1F CAGAAAAGAAGGGCGTGTAC | This paper | oligonucleotide | |
| Sequence-based reagent | ARHGAP11B qARHGAP11B_1R GGAGTAGCACAGAGACCATCA | This paper | oligonucleotide | |
| Sequence-based reagent | ARHGAP11B qARHGAP11B_2F TGAGAATAAGATGGATAGCAGCA | This paper | oligonucleotide | |
| Sequence-based reagent | ARHGAP11B qARHGAP11B_2R GGTACACGCCCTTCTTTTCTG | This paper | oligonucleotide | |
| Recombinant DNA reagent | pCAGGS | (Florio et al., 2015) | ||
| Recombinant DNA reagent | pCAGGS-ARHGAP11B | (Florio et al., 2015) | ||
| Recombinant DNA reagent | pCAGGS-mCherry | (Tavano et al., 2018) | ||
| Recombinant DNA reagent | pCAGGS-GFP | (Fei et al., 2014) | ||
| Software, algorithm | Fiji/ImageJ | Fiji/Imagej | https://imagej.nih.gov/ij/ | |
| Software, algorithm | Prism | GraphPad software | ||
| Software, algorithm | ZEN | Carl Zeiss |
Additional files
-
Supplementary file 1
Overview of the effects of ARHGAP11B expression on neural progenitor cells and upper-layer neurons in developing ferret neocortex.
Data taken from the indicated figure panels were used for the calculations shown. For the calculations pertaining to upper-layer neurons, it is assumed that the ARHGAP11B-induced increase in the lateral length of the FP+ area in the rostro-caudal dimension is equal to that in the medio-lateral dimension (1.25-fold).
- https://doi.org/10.7554/eLife.41241.018
-
Transparent reporting form
- https://doi.org/10.7554/eLife.41241.019
Download links
A two-part list of links to download the article, or parts of the article, in various formats.
Downloads (link to download the article as PDF)
Open citations (links to open the citations from this article in various online reference manager services)
Cite this article (links to download the citations from this article in formats compatible with various reference manager tools)
Human-specific ARHGAP11B induces hallmarks of neocortical expansion in developing ferret neocortex
eLife 7:e41241.
https://doi.org/10.7554/eLife.41241


