Quantitative uniqueness of human brain evolution revealed through phylogenetic comparative analysis
- Princeton University, United States
- Duke University, United States
- University of Durham, United Kingdom
Figures
Figure 1 with 1 supplement
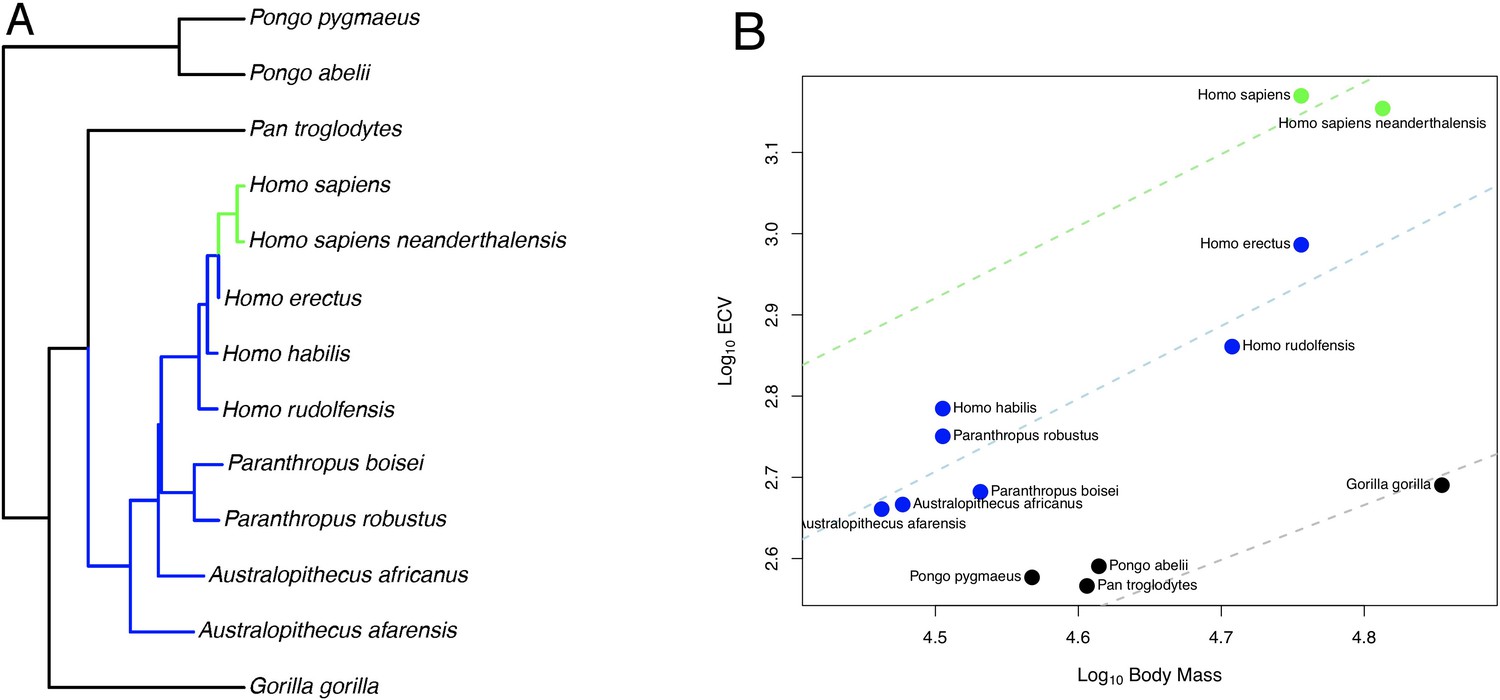
OU Model of ECV Evolution in Primates Panel.
A shows the location of the selection regimes identified in an OU model of ECV predicted by body mass. Panel B shows the corresponding optimum regression lines representing the various selection regimes, along with body mass and ECV data. Data are colored by their corresponding selection regimes. All results are from the un-weighted predictor OU model in the bayou analysis using the alternate hominin phylogeny. Only the great ape clade is shown; selection regimes across the entire primate phylogeny are show in Figure 1—figure supplement 1.
Figure 1—figure supplement 1
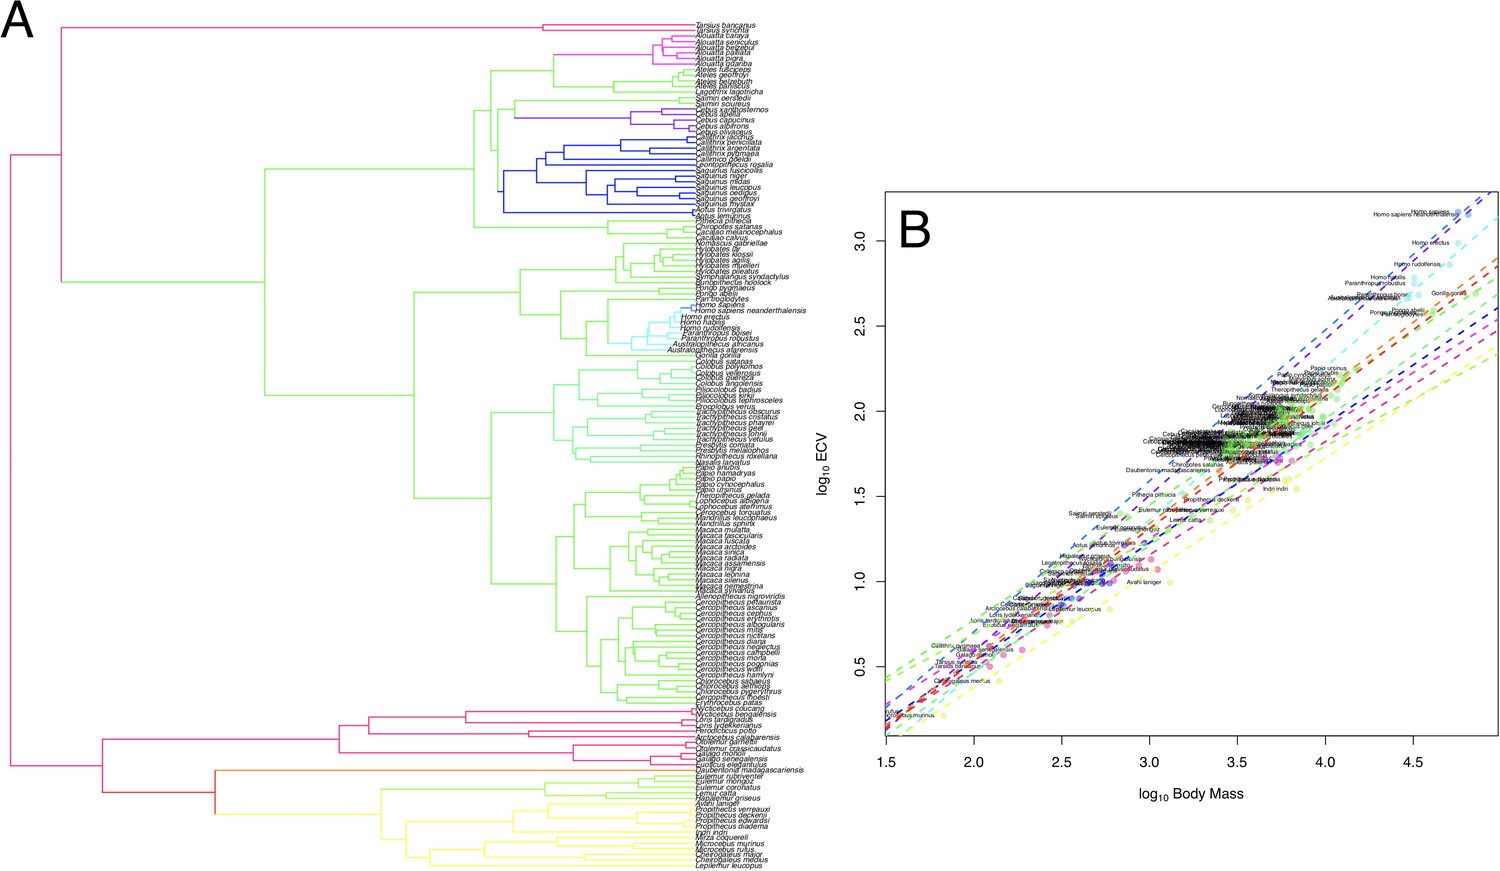
OU Model of ECV Evolution in Primates Results are shown for the un-weighted predictor OU model of ECV predicted by body mass.
Figure 1 displays the same results, but only for great apes. Panel A shows the location of the selection regimes. Panel B shows the optimum regression lines representing the various selection regimes, along with body mass and ECV data. Data in panel B are colored according to the corresponding regimes shown in panel A.
Figure 2 with 1 supplement
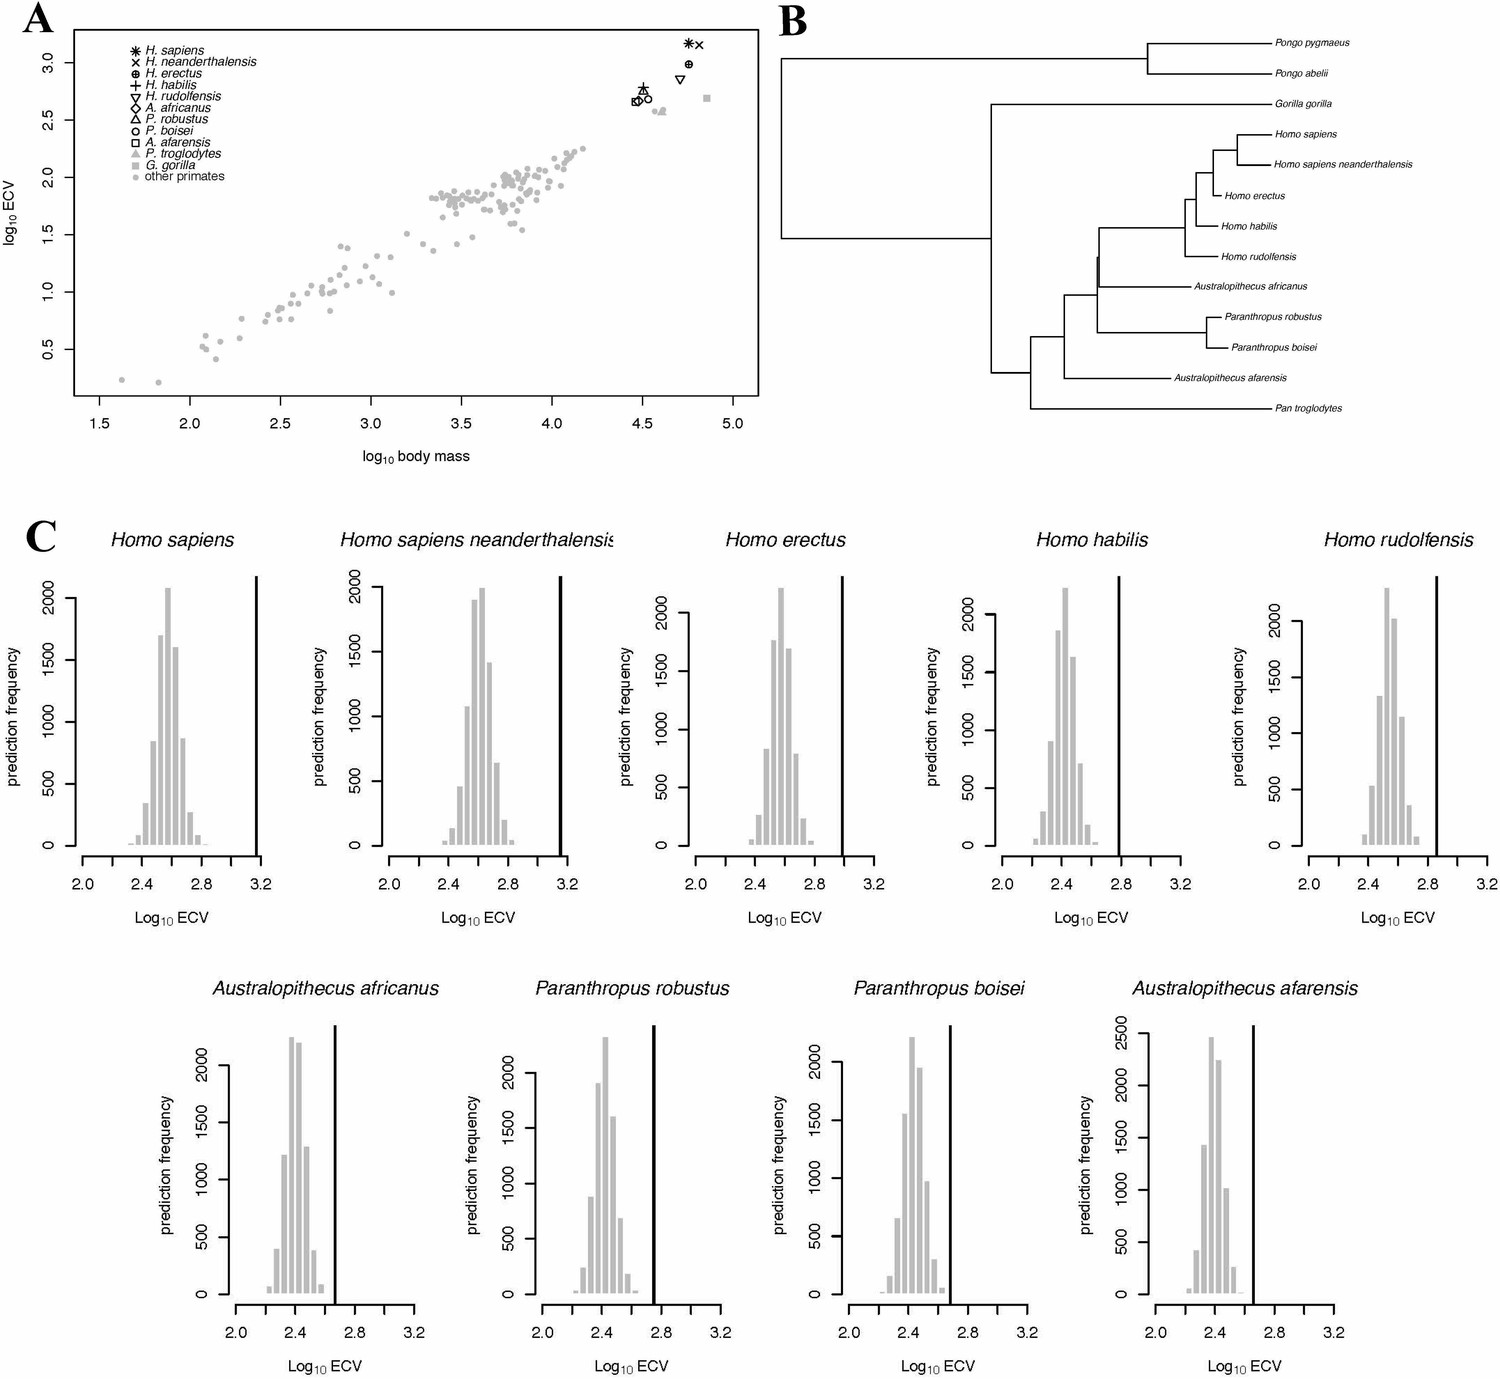
BayesModelS predictions of ECV in hominins.
Panel (A) shows a scatter plot of primate ECV and body mass data. Panel (B) shows the topology of the great ape portion of the hominin phylogeny used in the BayesModelS analyses of hominin ECV. Panel (C) shows the posterior distributions of predicted ECV values generated by BayesModelS for hominin species with body mass used as the predictor variable. Vertical lines indicated observed values.
Figure 2—figure supplement 1
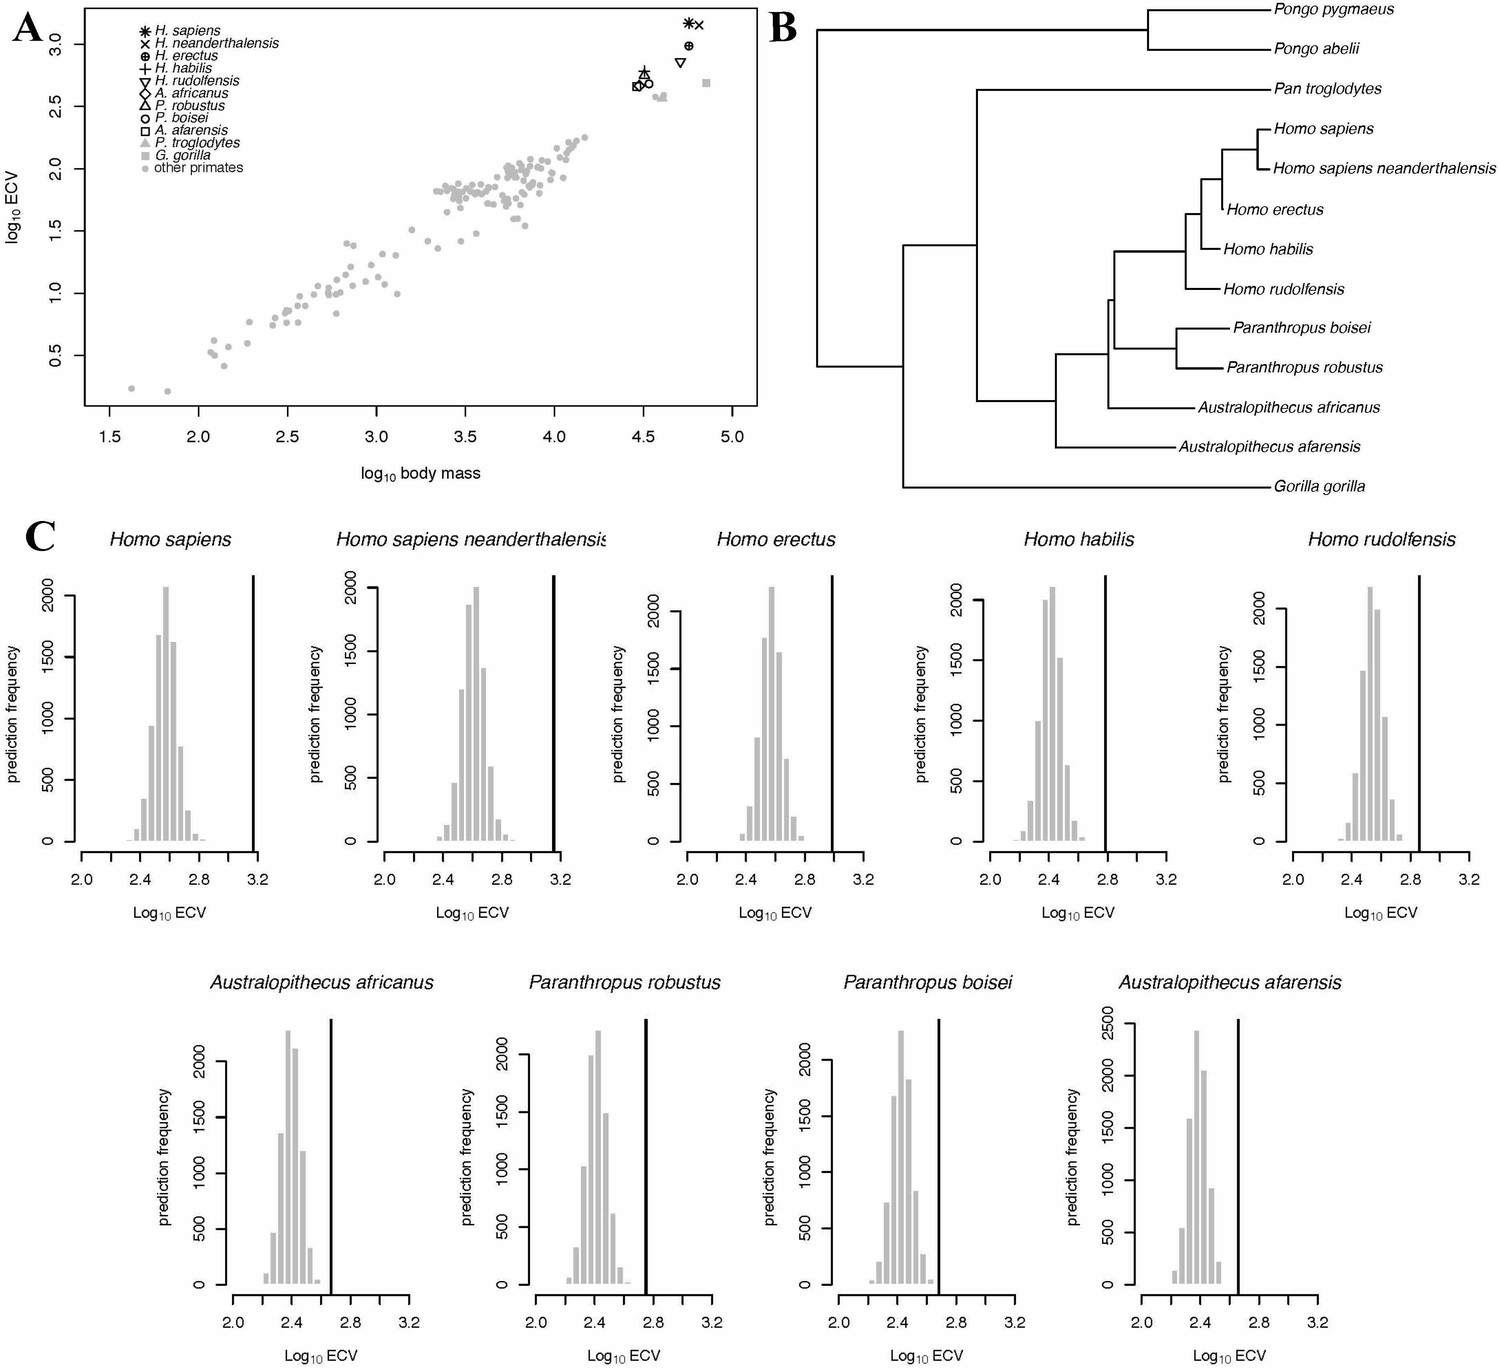
BayesModelS predictions of ECV in hominins.
Panel (A) shows a scatter plot of primate ECV and body mass data. Panel (B) shows the topology of the great ape portion of the alternate hominin phylogeny used in the BayesModelS analyses of hominin ECV. Panel (C) shows the posterior distributions of predicted ECV values generated by BayesModelS for hominin species with body mass used as the predictor variable. Vertical lines indicated observed values. The observed value for H. sapiens s exceeded the mean value predicted by BayesModelS by more than seven standard deviations. All hominin species were strongly supported positive outliers, with >99.9% of predictions falling below the observed values for ECV.
Figure 3 with 1 supplement
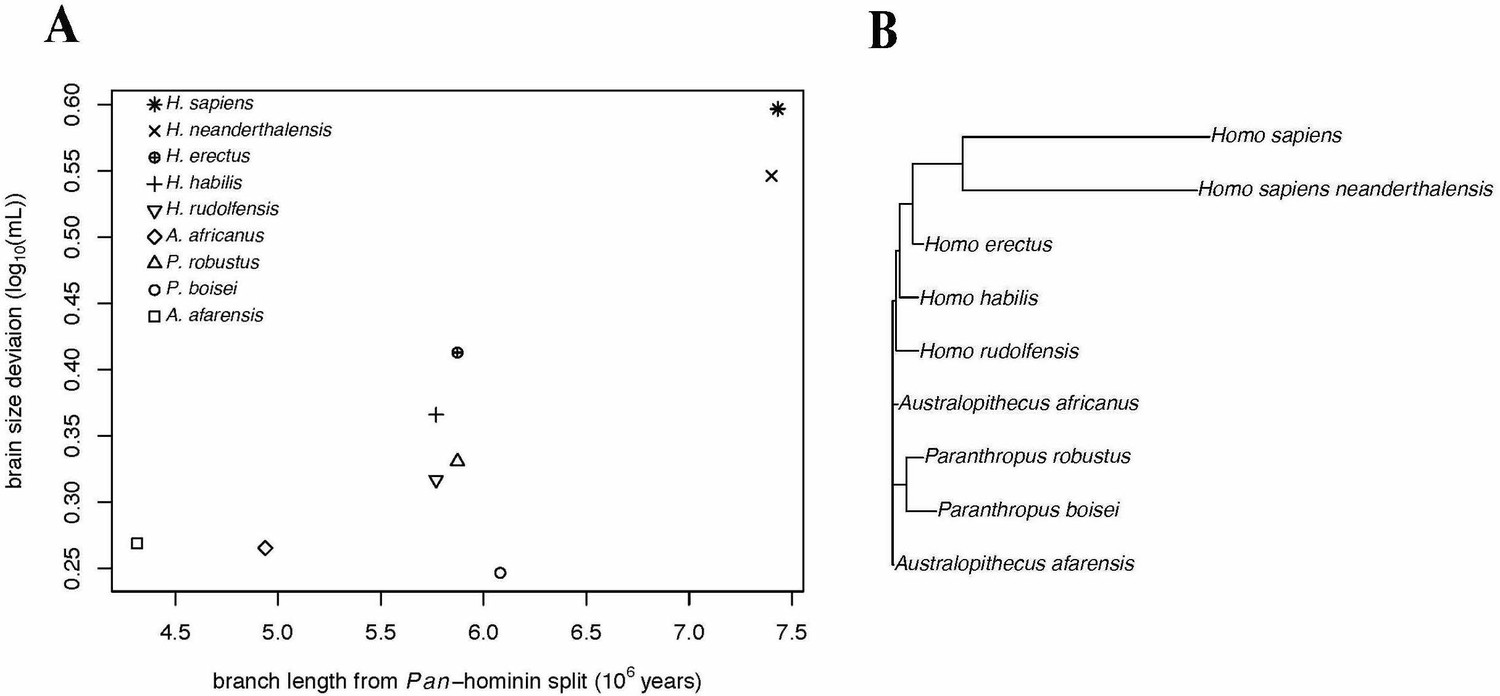
Accelerating Evolution of Brain Size Deviation in Hominins.
(A) Brain size deviation was calculated as the difference between the mean BayesModelS prediction (made while excluding all hominin data from analysis and using the hominin phylogeny) and the observed value. Phylogenetic distance was measured as time since the shared ancestor of hominins and Pan at 7.43 mya. (B) Hominin clade in the hominin phylogeny after δ transformation, with δ = 8.36 following the directional acceleration model.
Figure 3—figure supplement 1
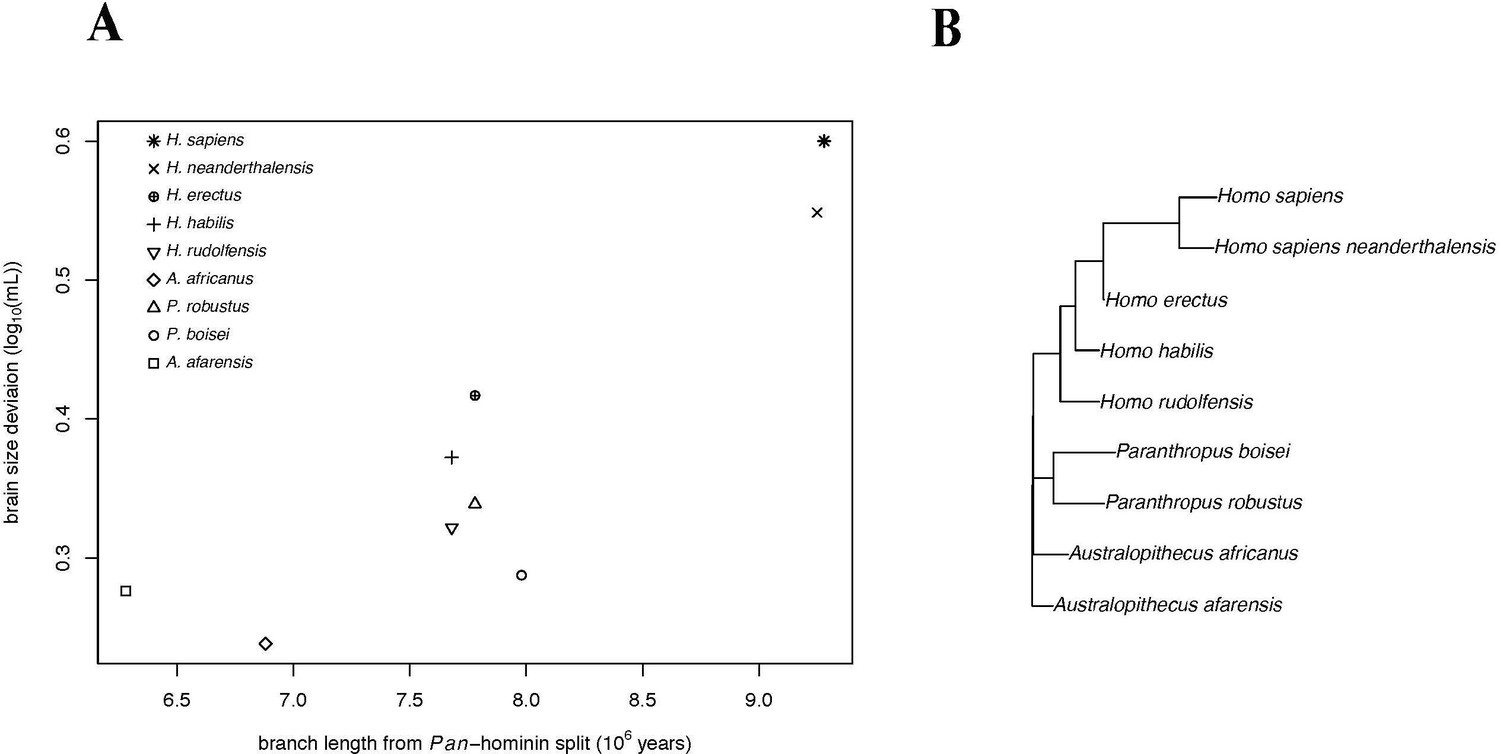
Accelerating Evolution of Brain Size Deviation in Hominins (alternate hominin phylogeny).
(A) Brain size deviation was calculated as the difference between the mean BayesModelS prediction (made while excluding all hominin data from analysis and using the alternate hominin phylogeny) and the observed value. Phylogenetic distance was measured as time since the shared ancestor of hominins and Pan at 9.28 mya. (B) Hominin portion of the alternate hominin phylogeny after δ transformation, with δ = 3.745 following the directional acceleration model. Among the PGLS models fit to this data, the directional acceleration model (AICc = −23.88) was favored, as it outperformed the the Brownian (AICc = −15.71), directional (AICc = −22.12), and accelerating (AICc = −22.38) evolution models. This model gave evidence for both evolution towards larger brain volume relative to body mass (slope = 0.06) and for accelerating evolution (δ = 3.745).
Figure 4 with 1 supplement
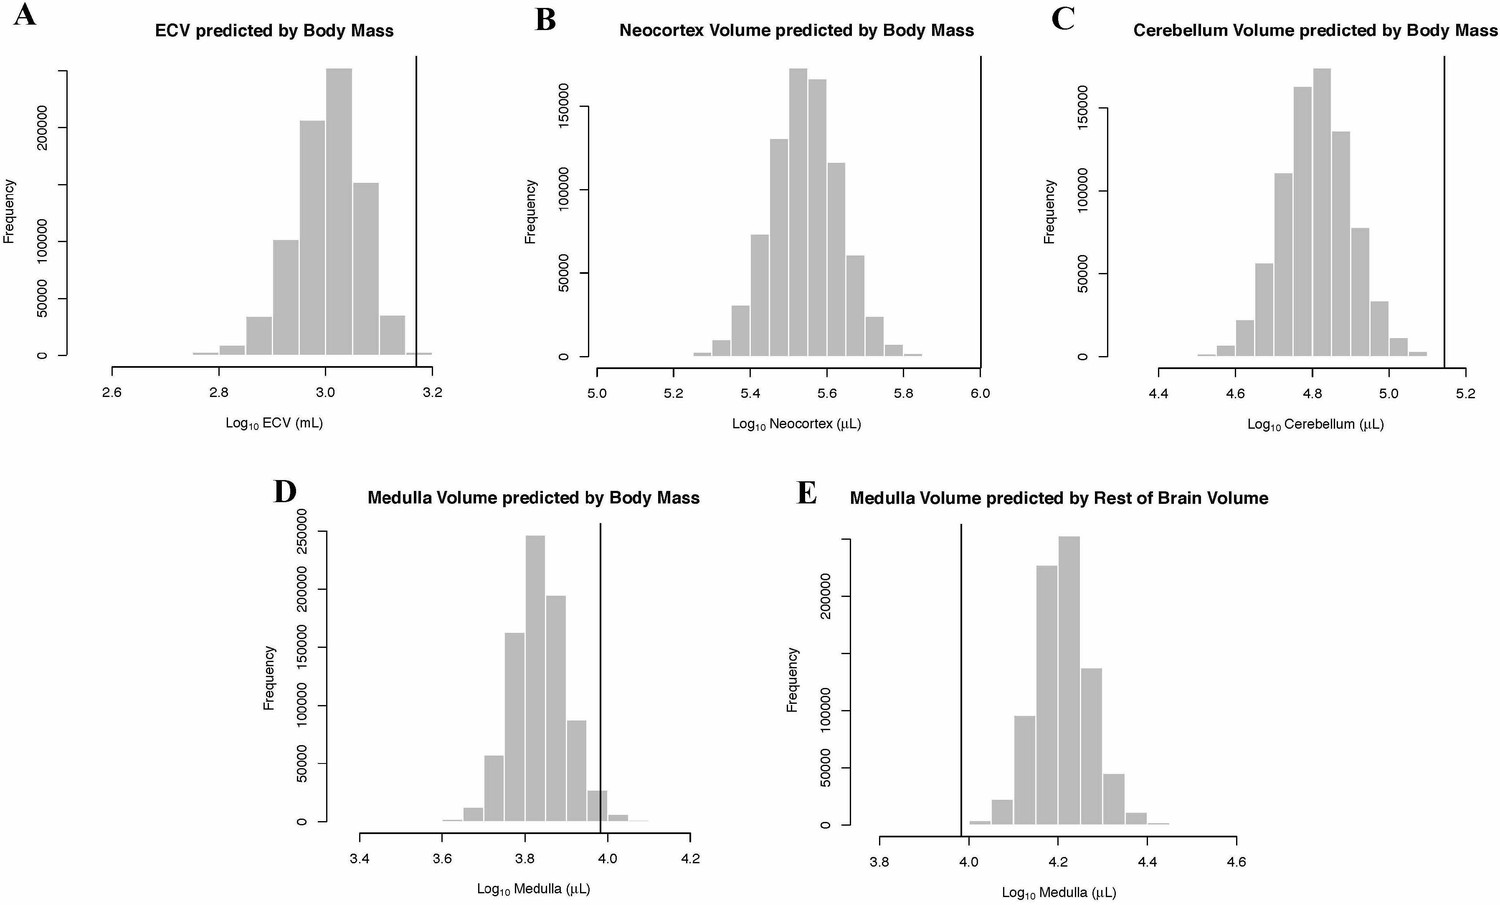
Human Outlier Status for Brain Traits Predicted distributions of trait values generated by BayesModelS are show as histograms.
Vertical bars represent the observed values.
Figure 4—figure supplement 1
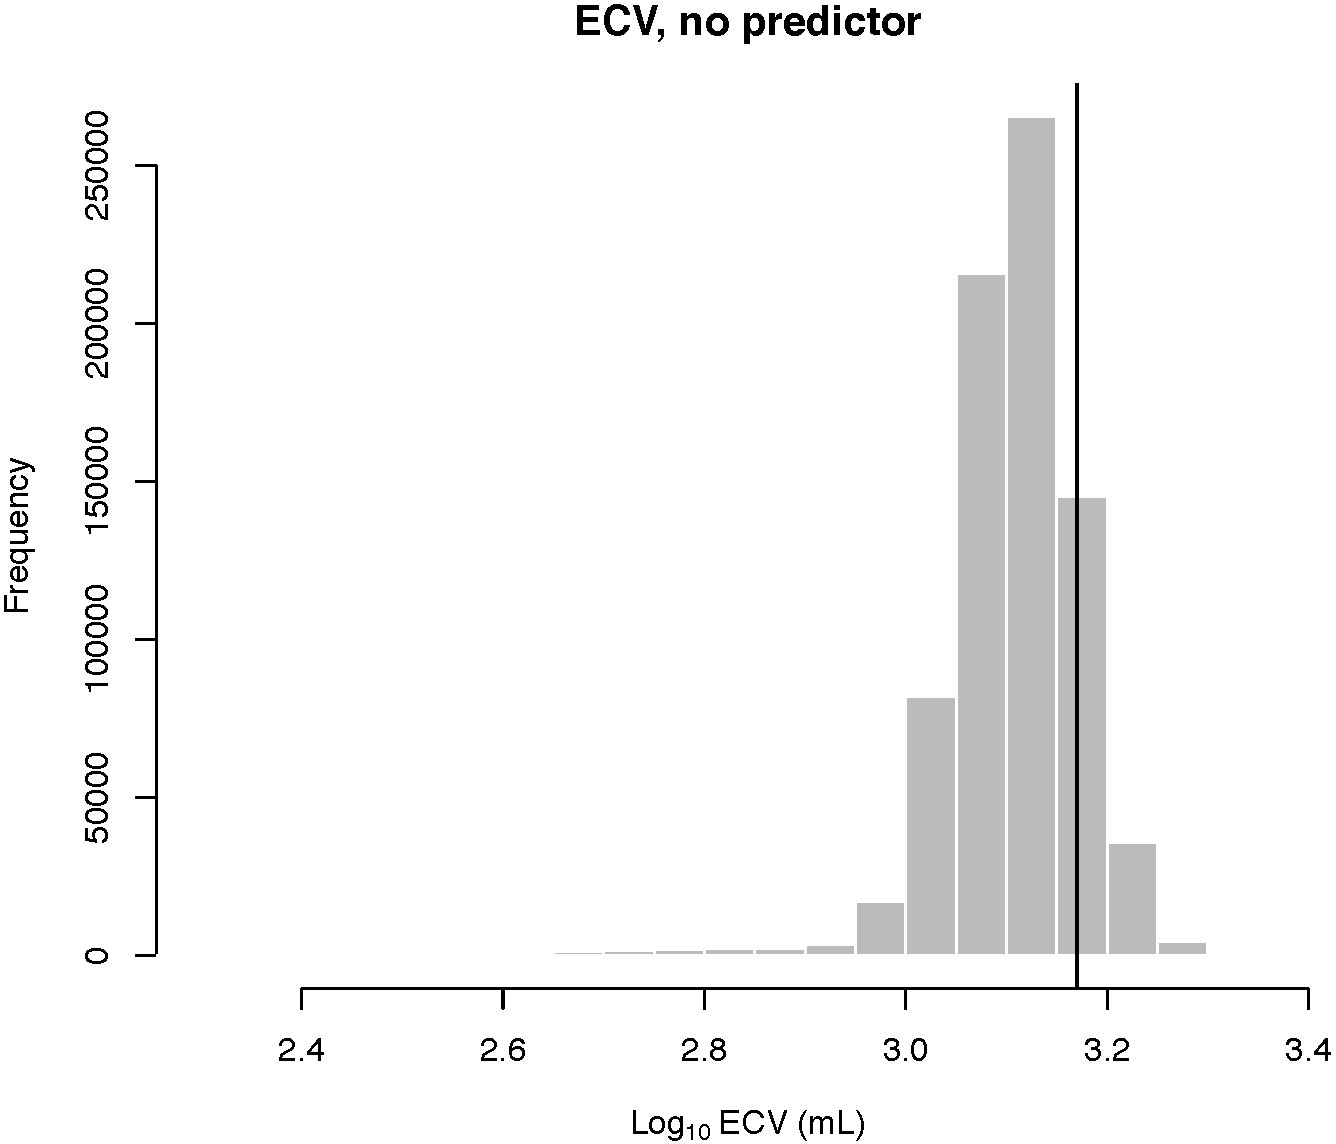
Human outlier status for ECV In the BayesModelS analysis of ECV with no predictor variable, humans were not detected as outliers.
Results for other species are given in Source data 1. Because BayesModelS requires a predictor variable, we assigned each species a random number for the predictor trait. This resulted in the predictor variable not being included in the PGLS model in ~98% of post burn-in MCMC samples. We discarded the remaining samples that included the predictor in the PGLS model before generating predictions.
Figure 5
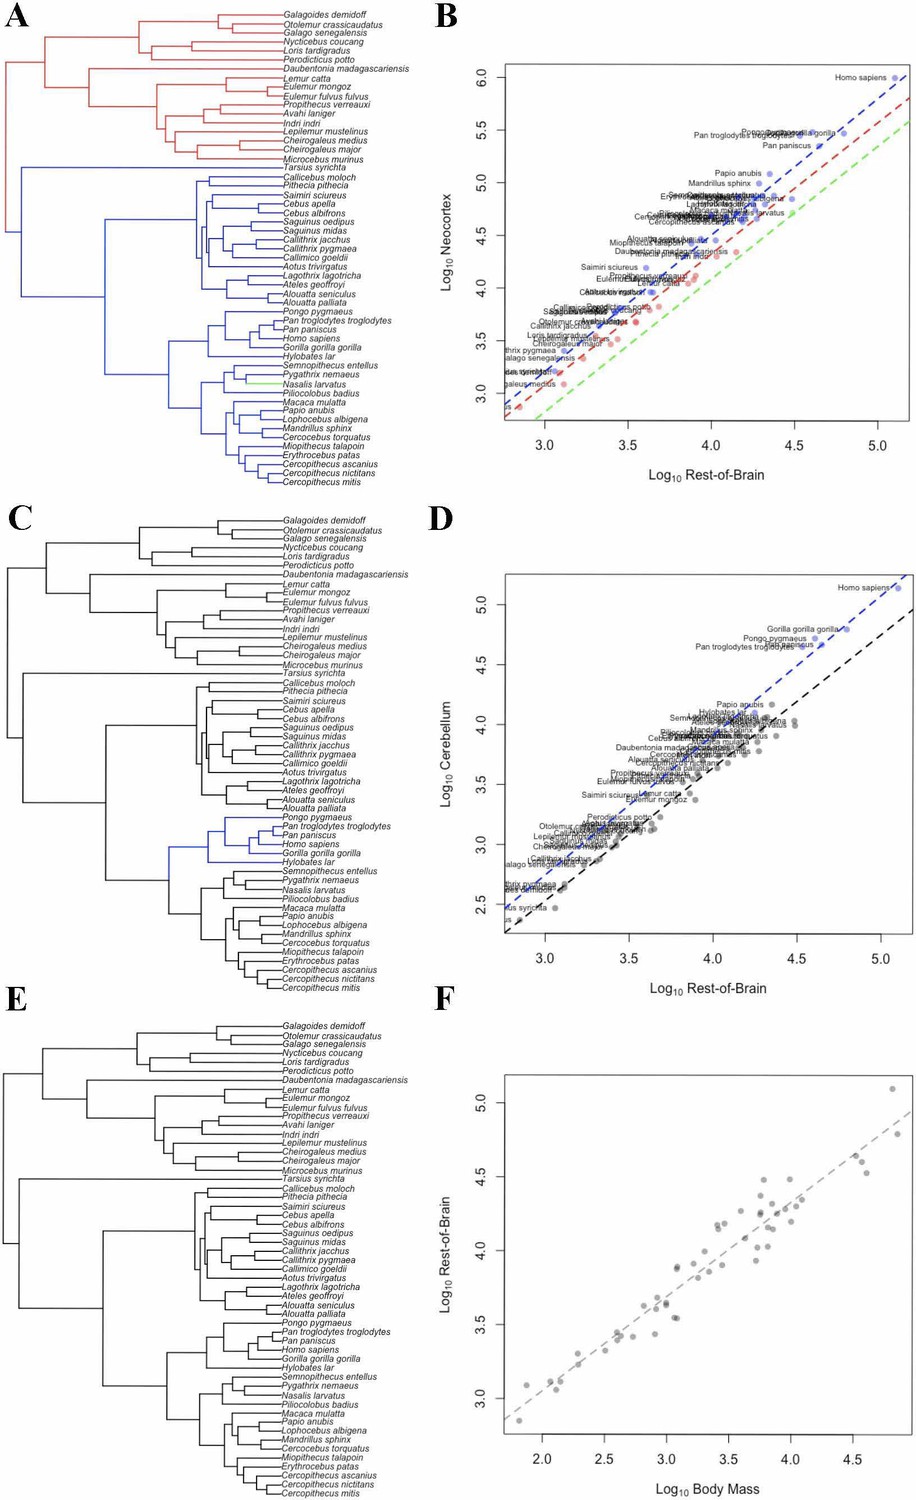
OU Models of Brain Structure Evolution in Primates.
(A and B) correspond to the OU weighted predictor model of neocortex volume predicted by the rest-of-brain. (C and D) correspond to the OU unweighted predictor model of cerebellum volume predicted by the rest-of-brain. (E and F) correspond to the OU weighted predictor model of the rest-of-brain volume predicted by body mass. (A, C) and (E) show the location of selection regimes on the primate phylogeny. (B, D) and (F) show the optimum regression lines associated with the selection regimes. Points show primate trait and predictor data; colors correspond to the selection regimes. Colors in (A, C) and (E) match those in (B, D) and (F).
Tables
Table 1
Hominin ECV and body mass data details.
All values are from Robson and Wood (2008).
| Species | ECV (mL) | Sample size | Female body mass (kg) | Sample size |
|---|---|---|---|---|
| Australopithecus africanus | 464.00 | 8 | 30 | 7 |
| Homo erectus | 969.00 | 40 | 57 | 4 |
| Homo habilis | 609.00 | 6 | 32 | 2 |
| Homo rudolfensis | 726.00 | 3 | 51 | 2 |
| Homo sapiens neanderthalensis | 1426.00 | 23 | 65 | 7 |
| Homo sapiens | 1478.00 | 66 | 57 | 36 |
| Paranthropus boisei | 481.00 | 10 | 34 | 1 |
| Paranthropus robustus | 563.00 | 2 | 32 | 2 |
| Australopithecus afarensis | 458.00 | 6 | 30 | 4 |
Table 2
Human brain data.
https://doi.org/10.7554/eLife.41250.004| Brain trait | Value | Source | Notes | Dataset |
|---|---|---|---|---|
| ECV | 1478.00 mL | (Robson and Wood, 2008) | Composite of values from 66 fossil specimens from locations across Eurasia and africa | 1 |
| Brain volume | 1267.65 mL | (Barton and Harvey, 2000) | Average of measurements of modern human brains | 2 |
| Brain volume | 1251.85 mL | (Stephan et al., 1981) | Measurement of modern human brain | 3 |
Table 3
Priors for bayou MCMC analyses.
https://doi.org/10.7554/eLife.41250.005| Model parameter | Prior distribution |
|---|---|
| α | Half-cauchy with scale factor 1. Fixed at 0 in Brownian model. |
| σ2 | Half-cauchy with scale factor 0.1 |
| β | Normal distribution with standard deviation = 0.5, mean = slope of linear model of trait and predictor data |
| θ | Normal distribution with standard deviation = 1, mean = intercept of linear model of trait and predictor data |
| Number of shifts per branch | Fixed at one |
| Branch-wise shift probability | Uniform |
| Number of shifts | Conditional Poisson distribution* with mean = 0.1*number of edges on phylogeny and maximum = number of edges on phylogeny. Fixed at 0 in Brownian model. |
| Location of shift along branch | Uniform |
-
*Calculated using ‘cdpois’ option in bayou.
Table 4
Predicted Hominin ECV values from BayesModelS analysis using the hominin phylogeny.
https://doi.org/10.7554/eLife.41250.010| True value (ml) | Corrected prediction (ml) | Difference (ml) | % difference | |
|---|---|---|---|---|
| Australopithecus africanus | 464.00 | 294.73 | 169.27 | 57.43 |
| Homo erectus | 969.00 | 438.24 | 530.76 | 121.11 |
| Homo habilis | 609.00 | 306.83 | 302.17 | 98.48 |
| Homo rudolfensis | 726.00 | 409.63 | 316.37 | 77.23 |
| Homo sapiens | 1478.00 | 437.76 | 1040.24 | 237.63 |
| Homo sapiens neanderthalensis | 1426.00 | 474.46 | 951.54 | 200.55 |
| Paranthropus boisei | 481.00 | 319.00 | 162.00 | 50.78 |
| Paranthropus robustus | 563.00 | 307.60 | 255.40 | 83.03 |
| Australopithecus afarensis | 458.00 | 288.52 | 169.48 | 58.74 |
Table 5
Predicted Hominin ECV values from BayesModelS analysis using the alternate hominin phylogeny.
https://doi.org/10.7554/eLife.41250.011| True value (ml) | Corrected prediction (ml) | Difference (ml) | % difference | |
|---|---|---|---|---|
| Australopithecus africanus | 464.00 | 288.18 | 175.82 | 61.00 |
| Homo erectus | 969.00 | 431.04 | 537.96 | 124.81 |
| Homo habilis | 609.00 | 300.16 | 308.84 | 102.89 |
| Homo rudolfensis | 726.00 | 401.94 | 324.06 | 80.62 |
| Homo sapiens | 1478.00 | 431.20 | 1046.80 | 242.76 |
| Homo sapiens neanderthalensis | 1426.00 | 468.41 | 957.59 | 204.44 |
| Paranthropus boisei | 481.00 | 311.41 | 169.59 | 54.46 |
| Paranthropus robustus | 563.00 | 299.74 | 263.26 | 87.83 |
| Australopithecus afarensis | 458.00 | 281.59 | 176.41 | 62.65 |
Table 6
Summary of evidence for exceptional brain evolution among non-human primates.
https://doi.org/10.7554/eLife.41250.012| Species/Clade | Exceptional trait | Evidence |
|---|---|---|
| Alouatta | Reduced ECV relative to body mass | Shift in OU model |
| Aotidae and Callitrichidae | Reduced ECV relative to body mass | Shift in OU model |
| Cacajao calvus | Increased ECV relative to body mass | Outlier Detection |
| Cebinae | Increased ECV relative to body mass | Shift in OU model |
| Cebus albifrons | Increased cerebellum relative to body mass | Outlier detection |
| Chiropotes satanas | Reduced ECV relative to body mass | Outlier Detection |
| Colobinae | Reduced ECV relative to body mass | Shift in OU model |
| Daubentonia madagascariensis | Increased ECV relative to body mass | Shift in OU model |
| Gorilla beringei* | Reduced ECV relative to body mass | Outlier Detection |
| Gorilla gorilla* | Reduced neocortex relative to body mass | Outlier Detection |
| Lemuridae | Increased ECV relative to body mass | Shift in OU model |
| Loris tardigradus | Reduced medulla relative to the rest of brain | Outlier Detection |
| Microcebus murinus | Reduced medulla relative to the rest of brain | Outlier Detection |
| Nasalis larvatus | Reduced neocortex relative to the rest of the brain | Shift in OU model |
| Otolemur crassicaudatus | Reduced neocortex, cerebellum relative to body mass | Outlier Detection |
| Pan troglodytes schweinfurthii | Increased ECV relative to body mass | Outlier Detection |
| Pan troglodytes troglodytes | Reduced ECV relative to body mass | Outlier Detection |
-
*The dataset for this analysis did not contain any other gorilla species.
Additional files
-
Source code 1
Representative Code.
Representative R code files for the bayou analyses ('representative bayou code.R'), BayesModelS analyses ('representative BayesModels code.R’), and pgls model fitting (‘pgls models.R’), are contained in the this file, along with the BayesModelS code (‘mult.spec.BayesModelS_v24.R’) and other necessary data files.
- https://doi.org/10.7554/eLife.41250.018
-
Source data 1
Bayou and BayesModelS Results Details.
Bayou Results details: Diagnostic plots giving details of chain convergence are provided in the 'bayou results summary.html' file along with detailed information on all OU and Brownain motion models for each trait and predictor pair. BayesModelS Results Details: Details of the BayesModelS results and diagnostic parameters of MCMC chains are given in the 'BayesModelS.results.csv' and 'BayesModelS.results.hominins.removed.csv’ files.
- https://doi.org/10.7554/eLife.41250.019
-
Source data 2
All data and trees used in our analyses.
Contains the following files: 1. data set 1.csv 2. data set 2.csv 3. data set 3.csv 4. consensus.tree.txt 5. tree.block.txt 6. grafted.tree.txt
- https://doi.org/10.7554/eLife.41250.020
-
Transparent reporting form
- https://doi.org/10.7554/eLife.41250.021
Download links
A two-part list of links to download the article, or parts of the article, in various formats.
Downloads (link to download the article as PDF)
Open citations (links to open the citations from this article in various online reference manager services)
Cite this article (links to download the citations from this article in formats compatible with various reference manager tools)
Quantitative uniqueness of human brain evolution revealed through phylogenetic comparative analysis
eLife 8:e41250.
https://doi.org/10.7554/eLife.41250


