Synthetic and genomic regulatory elements reveal aspects of cis-regulatory grammar in mouse embryonic stem cells
- Edison Center for Genome Sciences and Systems Biology, Washington University in St. Louis, United States
- Department of Genetics, Washington University in St. Louis, United States
Figures
Figure 1 with 2 supplements

Activity of synthetic elements and genomic sequences.
(A) The activity of synthetic elements with different numbers of binding sites. Expression is the average log of the ratio of cDNA barcode counts/DNA barcode counts for each synthetic element normalized to basal expression (dotted line). (B) The activity of genomic sequences is largely dependent on the presence of pluripotency binding sites. Normalized expression of wild type (gWT) sequences is plotted against expression of matched sequences with all three pluripotency TFBS mutated (gMUT sequences). Red indicates sequences with significantly different expression between matched gWT and gMUT sequences. The diagonal solid line is the expectation if mutation of TFBS had no impact on expression level. Expression of both gWT and gMUT sequences are normalized to basal controls, but basal expression is only plotted for gWT sequences on the y-axis (dotted line).
Figure 1—figure supplement 1
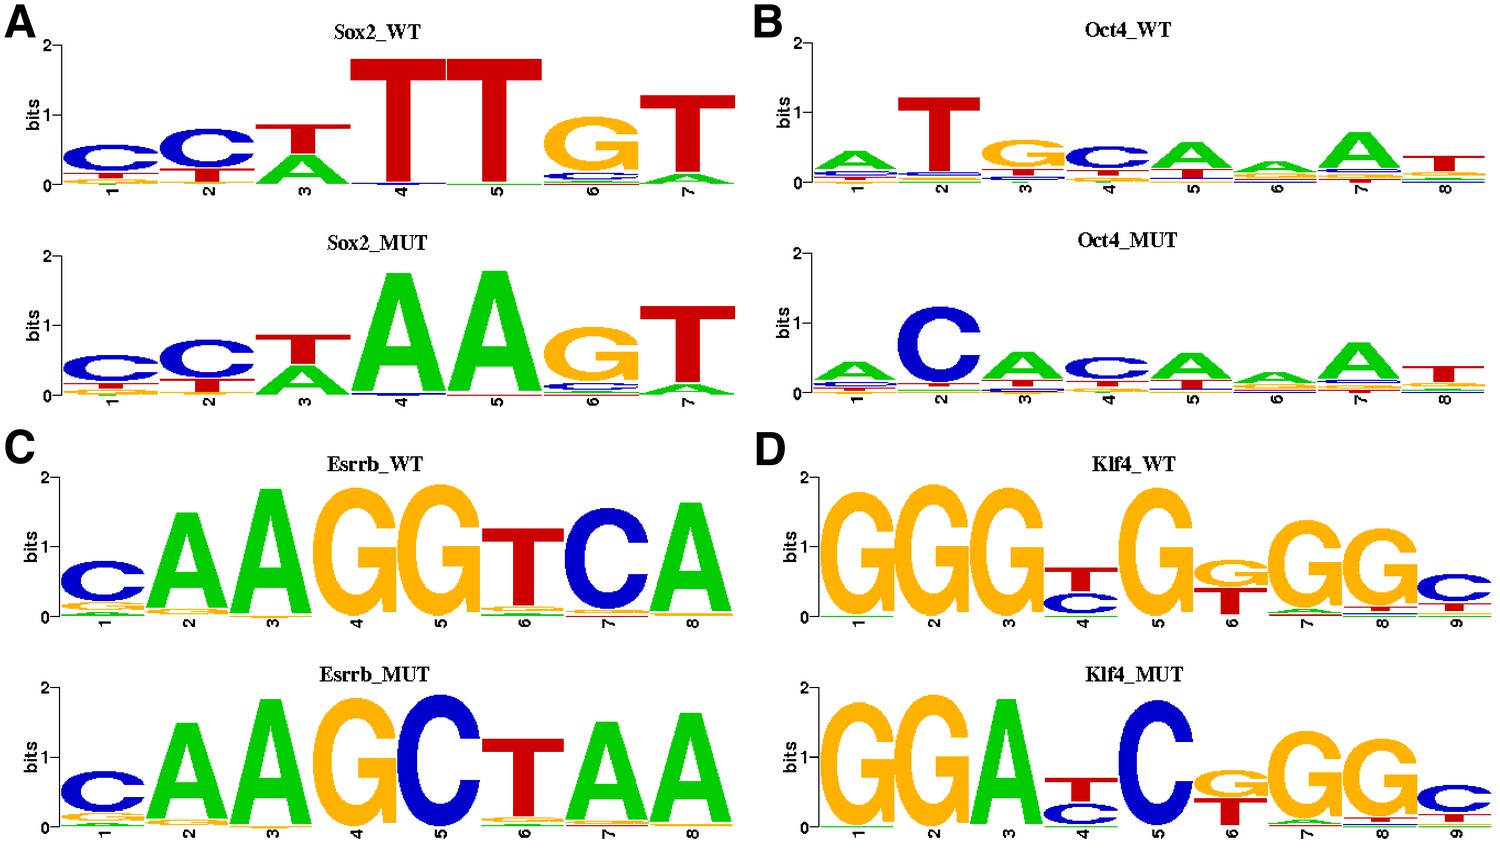
Pluripotency motif substitutions for gMUT sequences.
Highest information content positions in each motif were substituted with least frequent nucleotide for that position. (A) For mutating Sox2 motifs, the reference nucleotides were substituted for ‘A’ in position 4 and 5. (B) For mutating Oct4 motifs, the reference nucleotide was substituted for ‘C’ in position 2 and for ‘A’ in position 3. (C) For mutating Esrrb motifs, the reference nucleotide was substituted for ‘C’ in position five and ‘A’ for position 7. (D) For mutating Klf4 motifs, the reference nucleotide was substituted for ‘A’ in position three and ‘C’ in position 5.
Figure 1—figure supplement 2
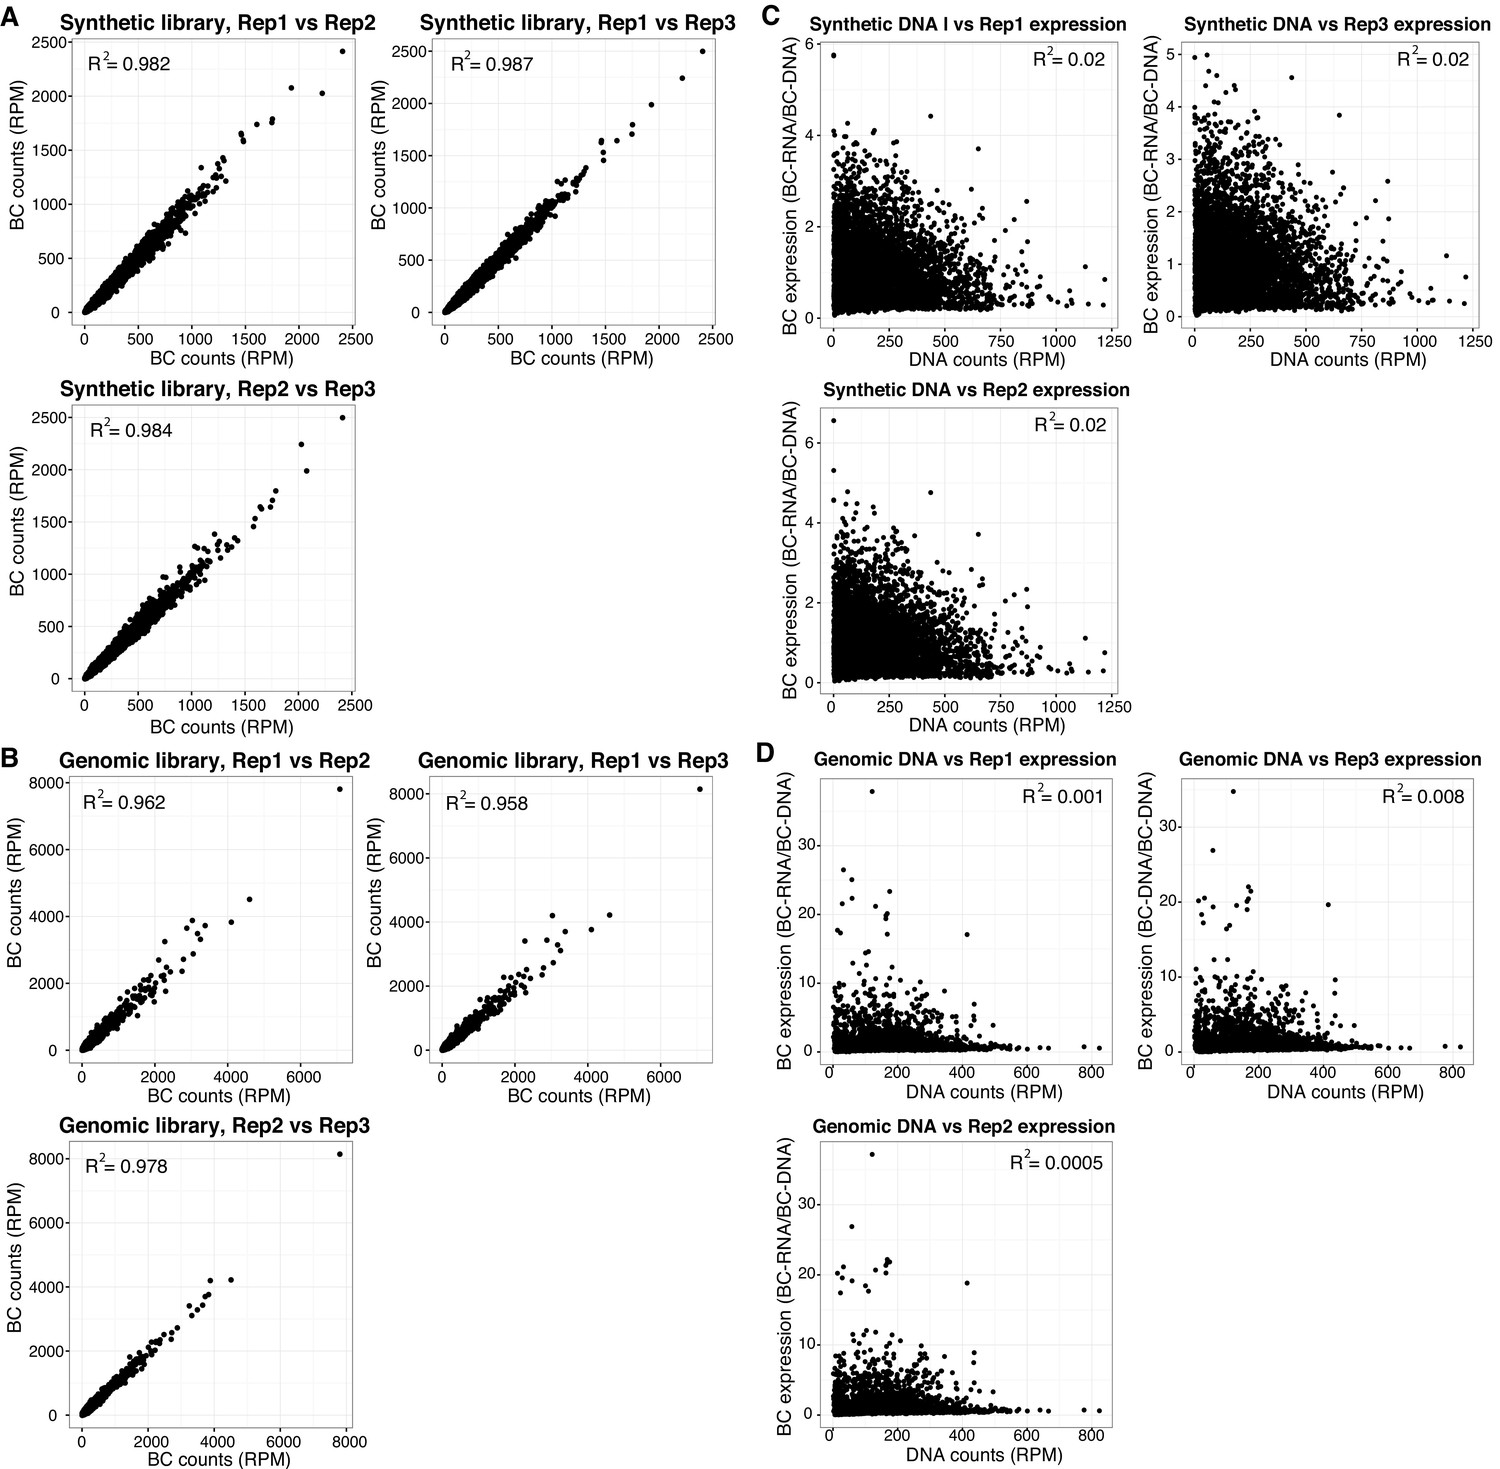
MPRA data quality.
Reproducibility of barcode (BC) counts between biological replicates, normalized as reads per million per RNA replicate for (A) Synthetic library and (B) Genomic, gWT and gMUT, library. Comparison of normalized BC expression (BCRNA/BCDNA) versus DNA counts for (C) Synthetic library and (D) Genomic, gWT and gMUT, library.
Figure 2 with 1 supplement
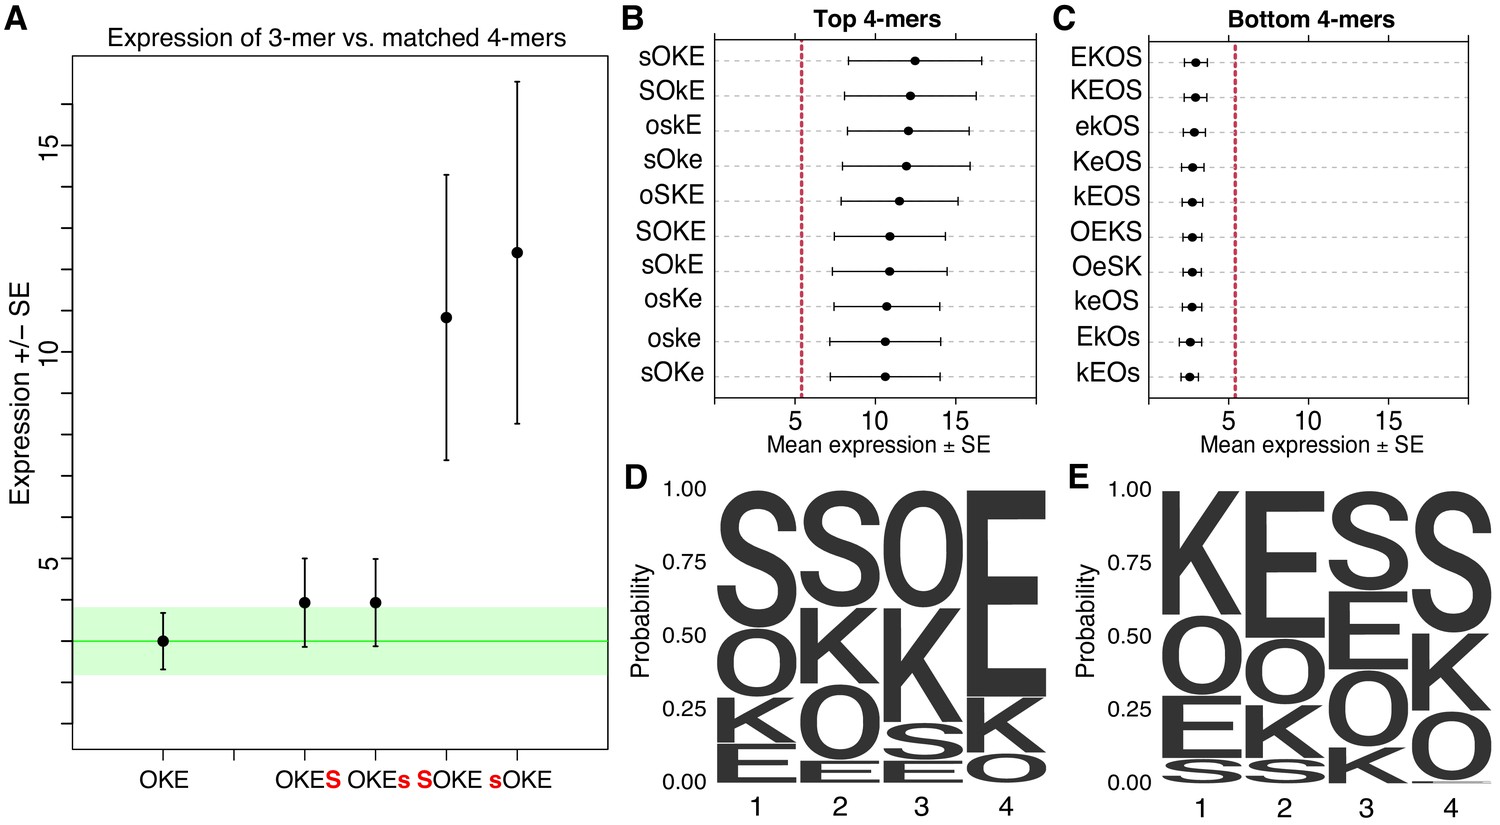
Non-additivity in synthetic elements.
(A) Comparison of synthetic 3-mer elements with matched 4-mer elements containing one additional site in the first or fourth position. Mean expression of elements across barcodes (black dot) is plotted +/- SEM (black whiskers). Green line for comparison to expression of 3-mer; Green transparency highlights SEM of 3-mer shown. Capital letter represents binding site in forward orientation and lower-case letter represents binding site in reverse orientation. Activity of the ten highest (B) and ten lowest (C) expressing 4-mers. Red line represents average expression of all synthetic 4-mer elements. Case represents binding site orientation as in (A) Mean expression of each element across barcodes (black dot) +/- SEM (black whiskers). Activity logos for the top 25% (n = 96) (D) and bottom 25% (E) of 4-mer synthetic elements. Height of letter is proportional to frequency of site in indicated position. Positions organized from 5’ end (Position 1) to 3’ end (Position 4) of elements.
Figure 2—figure supplement 1
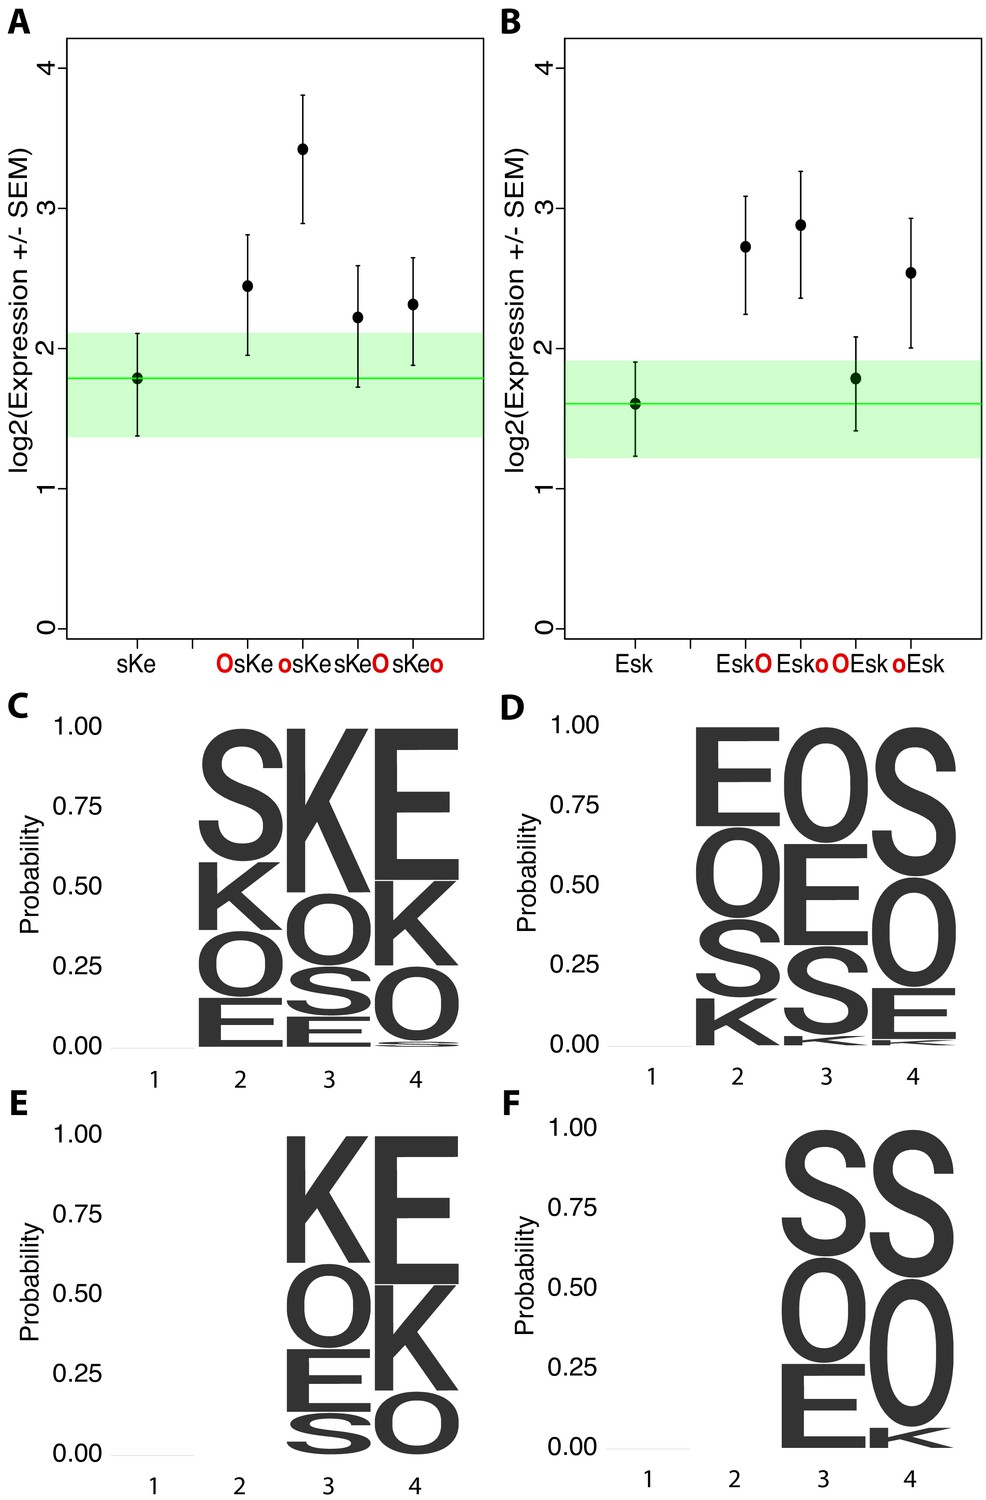
Additional examples of non-additivity in synthetic elements.
Comparisons of synthetic 3-mer elements with matched 4-mer elements containing one additional site in the first or fourth position with (A) three of four matched 4-mers with overlapping expression despite an additional binding site and (B) one of four matched 4-mers with overlapping expression. Activity logos for the top 25% (C), bottom 25% (D) of 3-mer synthetic elements (n = 48 each), and top 25% (E) and bottom 25% (F) of 2-mer synthetic elements (n = 12 each). Height of letter is proportional to frequency of site in indicated position. Positions organized as in Figure 2.
Figure 3 with 3 supplements
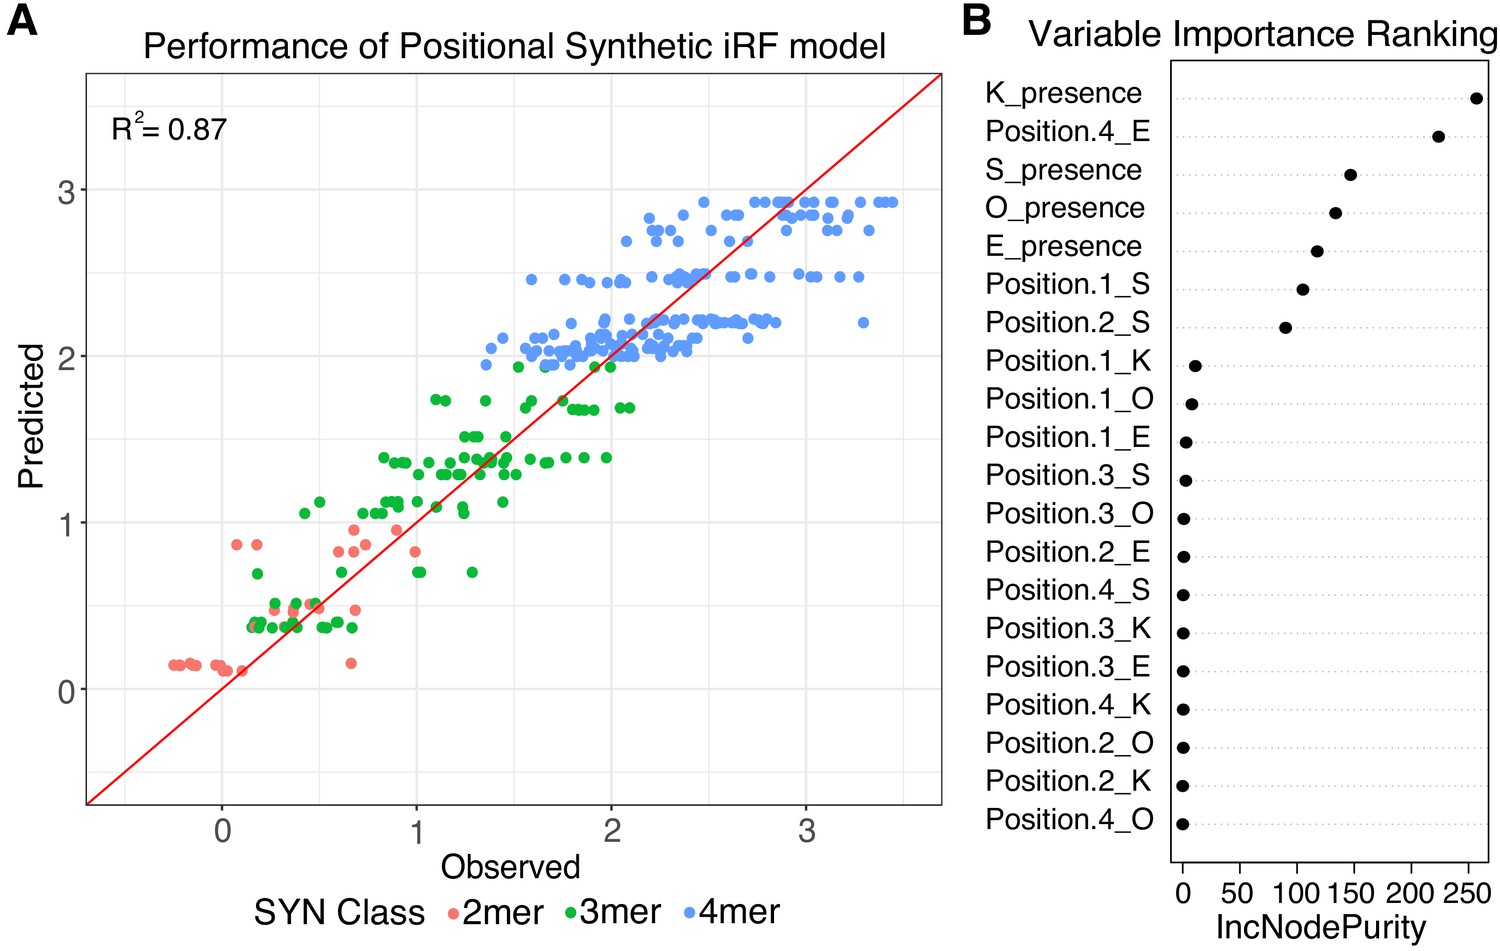
Positional grammar in synthetic elements.
(A) Iterative random forest (iRF) regression model that includes features for presence and position of pluripotency TFBS predicts relative expression of synthetic elements. Number of binding site per element is indicated in pink (2-mers), green (3-mers), and blue (4-mers). Observed and predicted expression are both plotted in log2 space. (B) Ranking of variables in synthetic iRF model. Variable importance is estimated by Increased Node Purity (IncNodePurity), the decrease in node impurities from splitting on that variable, averaged over all trees during training.
Figure 3—figure supplement 1
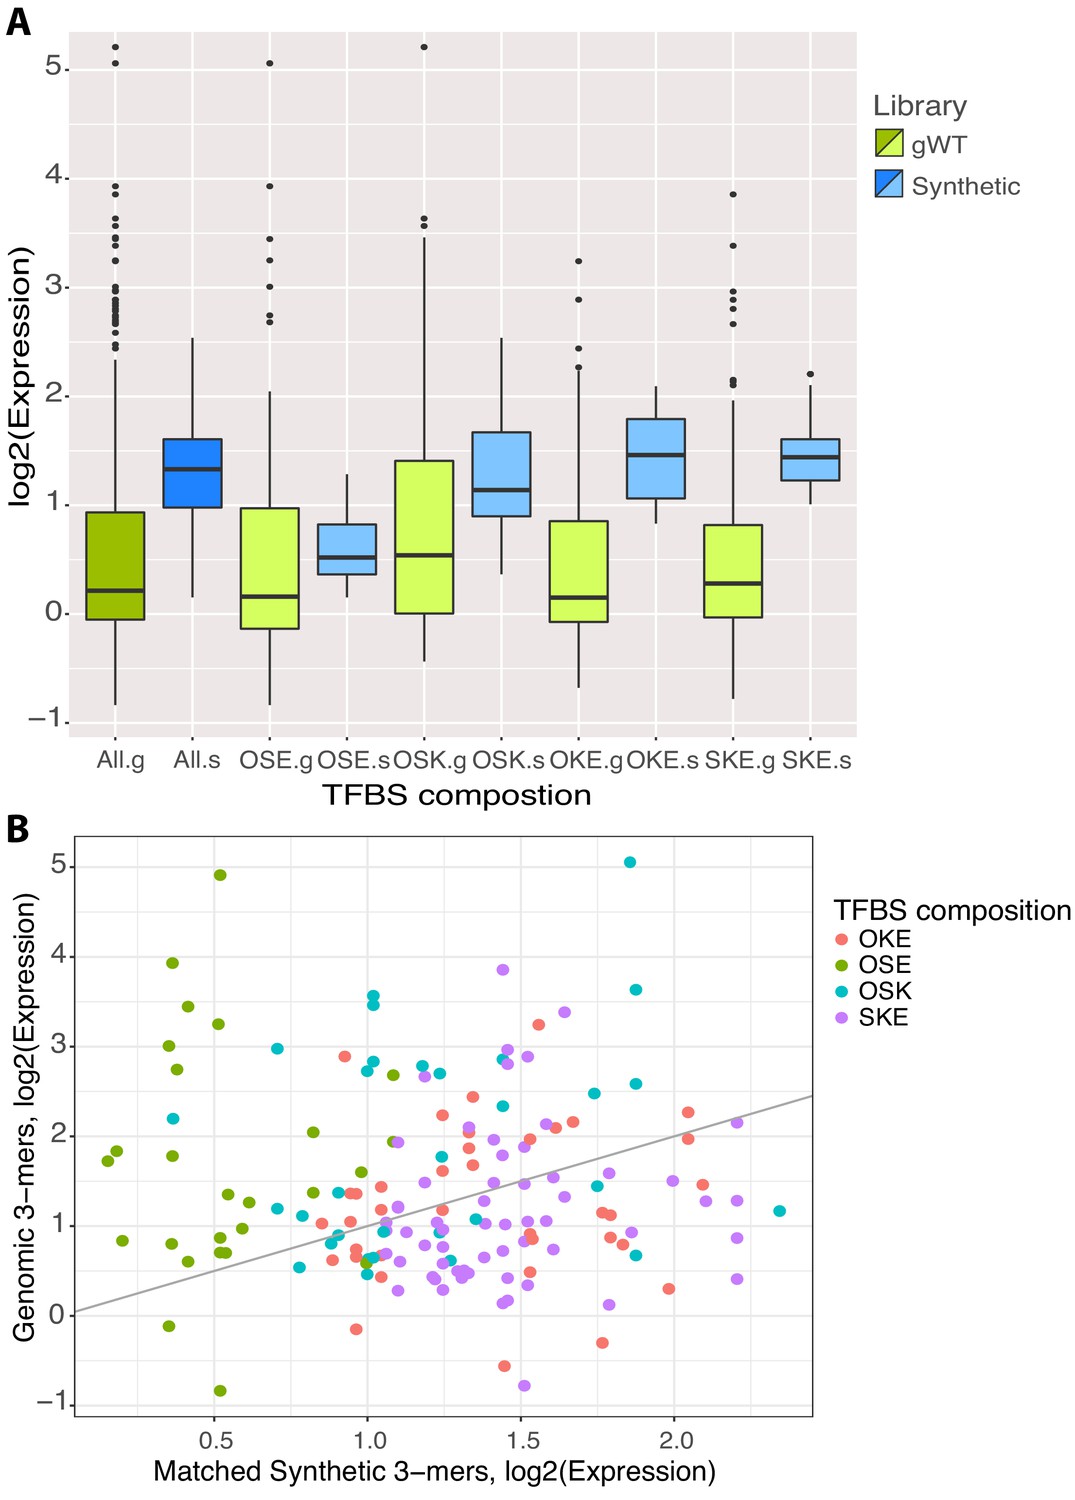
Comparison of synthetic and genomic patterns of transcription factor binding sites (TFBS).
(A) Expression (log2) of all synthetic (dark blue) and gWT (dark green) library members subset by TFBS composition (light blue and light green, respectively). (B) Expression (log2) of synthetic (x-axis) and gWT (y-axis) library members, matched by composition and order of binding sites for OCT4 (O), SOX2 (S), KLF4 (K), and ESRRB (E). Subsets of TFBS composition indicated by color. Gray line indicates x-y diagonal as axis scales differ.133.
Figure 3—figure supplement 2
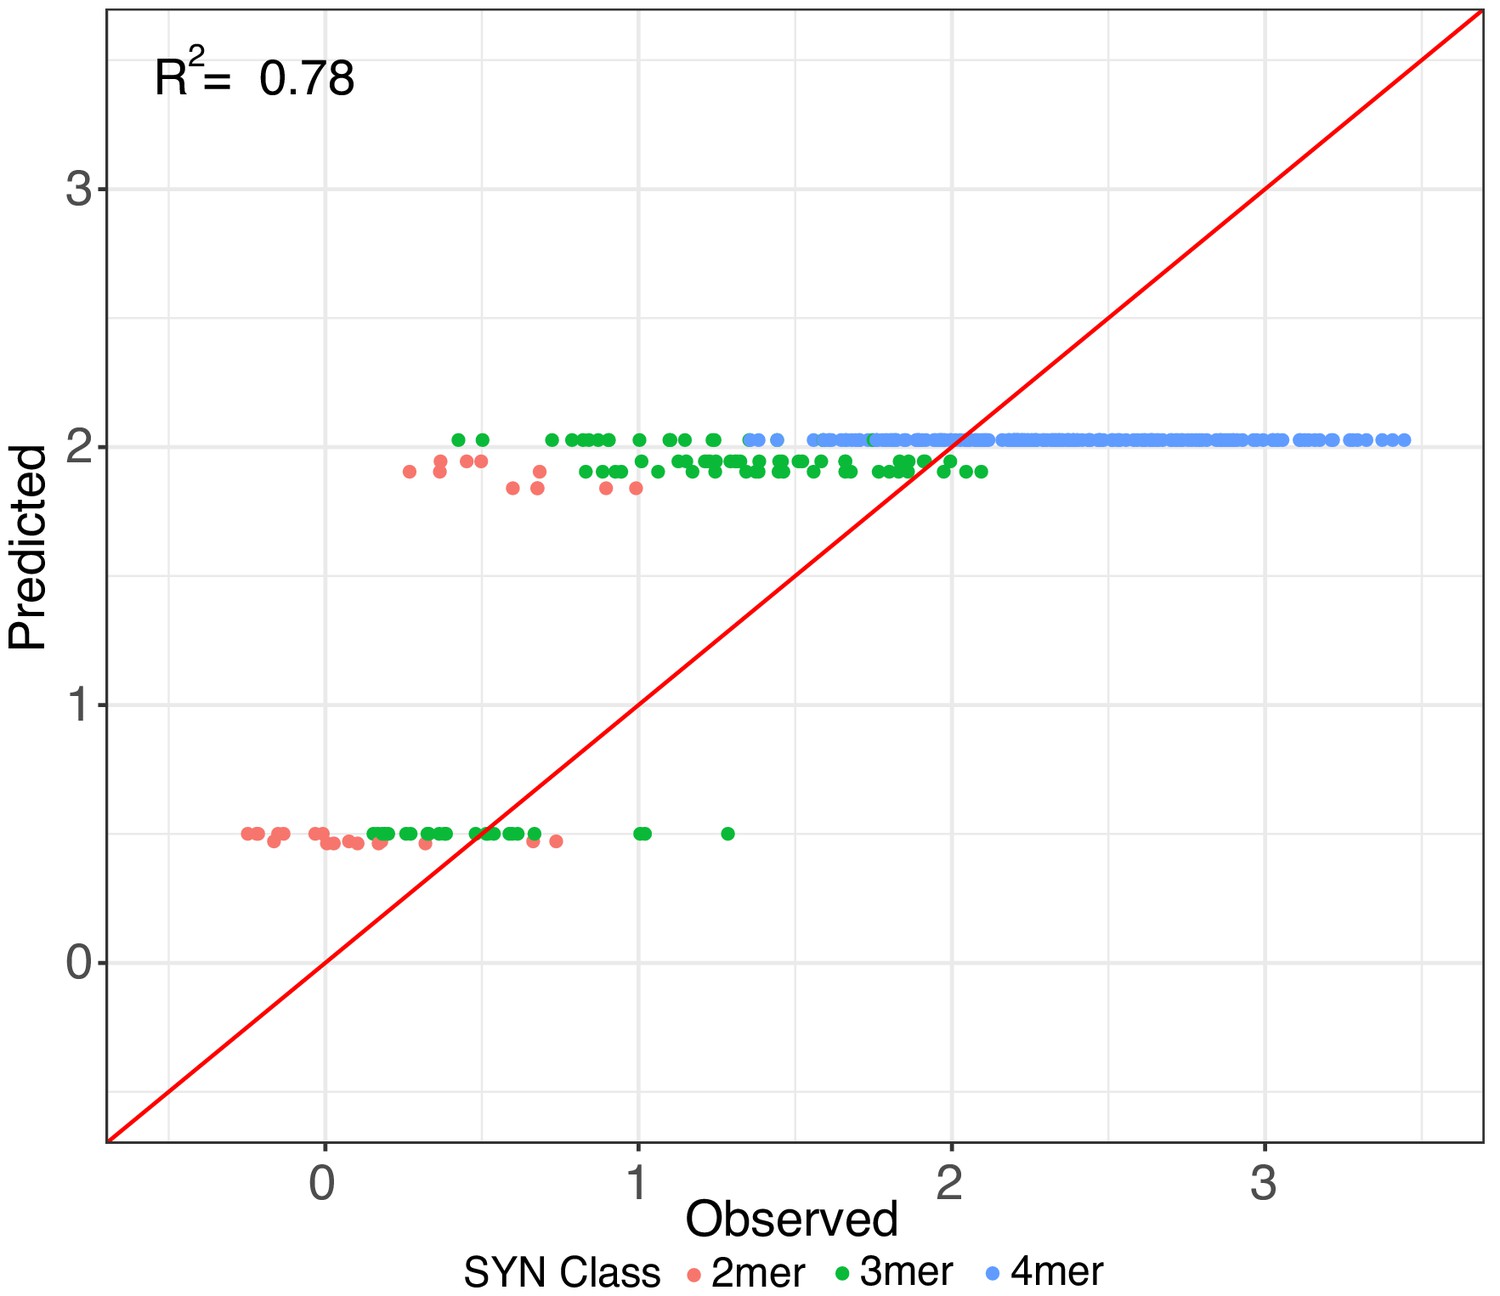
Additive effects in synthetic elements.
Iterative random forest (iRF) regression model that includes features for only presence of pluripotency TFBS to predict the relative expression of held out test set of synthetic elements. Number of binding site per element indicated as in Figure 3. Observed and predicted expression are both plotted in log2 space.
Figure 3—figure supplement 3

Effect of spacer sequences between TFBS on synthetic 4-mer expression.
(A) Expression of sequences in ‘mini spacer’ library with different binding sites. (B) Difference in expression between each 4-mer oligo with new spacer and the original spacer. (C) Expression of each 4-mer oligo with original and new spacers. The numbers next to each point indicate the expression rank of each oligo with its original spacer, with one being the highest expressed and six being the lowest.
Figure 4 with 2 supplements

Sequence features separate active and inactive genomic sequences.
(A) Performance of gkm-SVM for genomic sequences supports contribution of sequence-based features to activity. Word length of 8 bp with gap size of 2 bp was used for training with threefold cross validation. ROC curve (left panel) and PR curve (right panel) is plotted for the average across threefold cross-validation sets +/- standard deviation. (B–E) Primary (O,S,K,E) site affinities across gWT sequences, as output during motif scanning plotted for high genomic sequences (top 25% as ranked by expression, n = 101) and low genomic sequences (bottom 25% as ranked by expression, n = 101). (F–G) Total site affinities is calculated per sequence by summing the predicted affinity of the three primary sites present in each sequence. (H) Total number of occurrences of TFBS for additional TFs in high and low sequences (stratified as in B–G), as determined by motif scanning, excluding primary (O,S,K,E) sites.
Figure 4—figure supplement 1
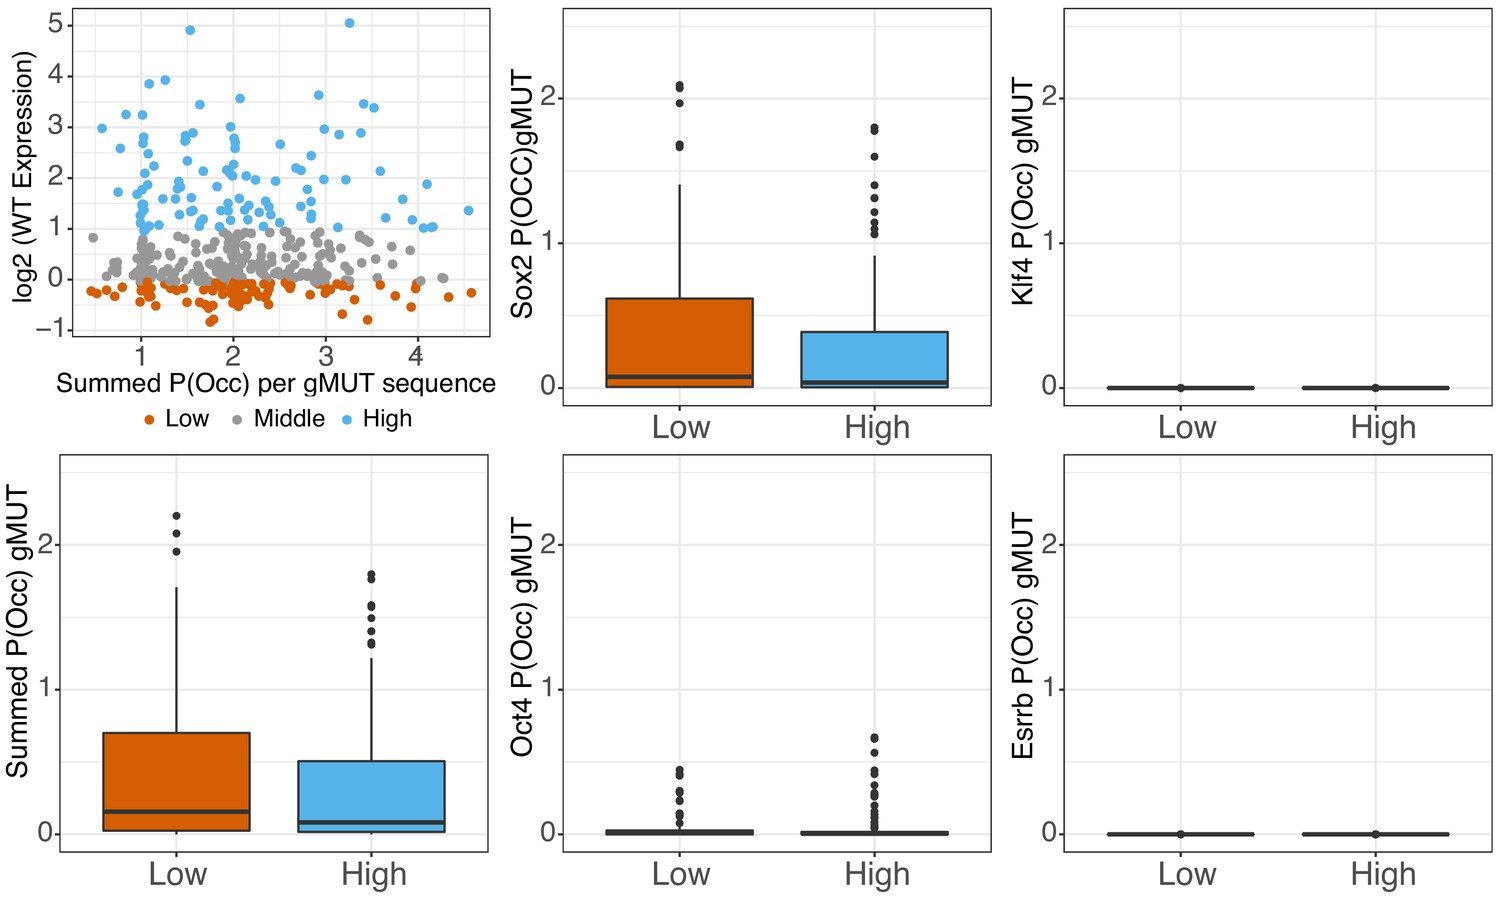
Predicted occupancy of genomic sequences.
Predicted occupancy (P(Occ)) for genomic sequences in the absence of the primary pluripotency sites (gMUT sequences) for high assumed protein concentration (mu) for SOX2 (mu = 8), OCT4 (mu = 10), KLF4 (mu = 8), and ESRRB (mu = 8) shown in middle and right panels. Summed P(Occ) of all factors per gMUT sequence, compared to expression (top left panel) or binned as low or high library members (bottom 25% and top 25% of sequences, ranked by gWT expression, n = 101).
Figure 4—figure supplement 2

Genomic sequences show distance preferences between factors.
Comparison of fraction of sequences (density) with designated edge to edge spacing between S, O, K, and E sites. Site positions outputted by scanning high (top 25% as ranked by gWT expression, n = 101) and low (bottom 25% as ranked by gWT expression, n = 101) sequences. Top two panels show fraction of sequences with indicated distances between site positions relative to the promoter, regardless of identity. Bottom six panels show fraction of sequences with indicated distances between adjacent sites, accounting for site identities.
Figure 5 with 1 supplement
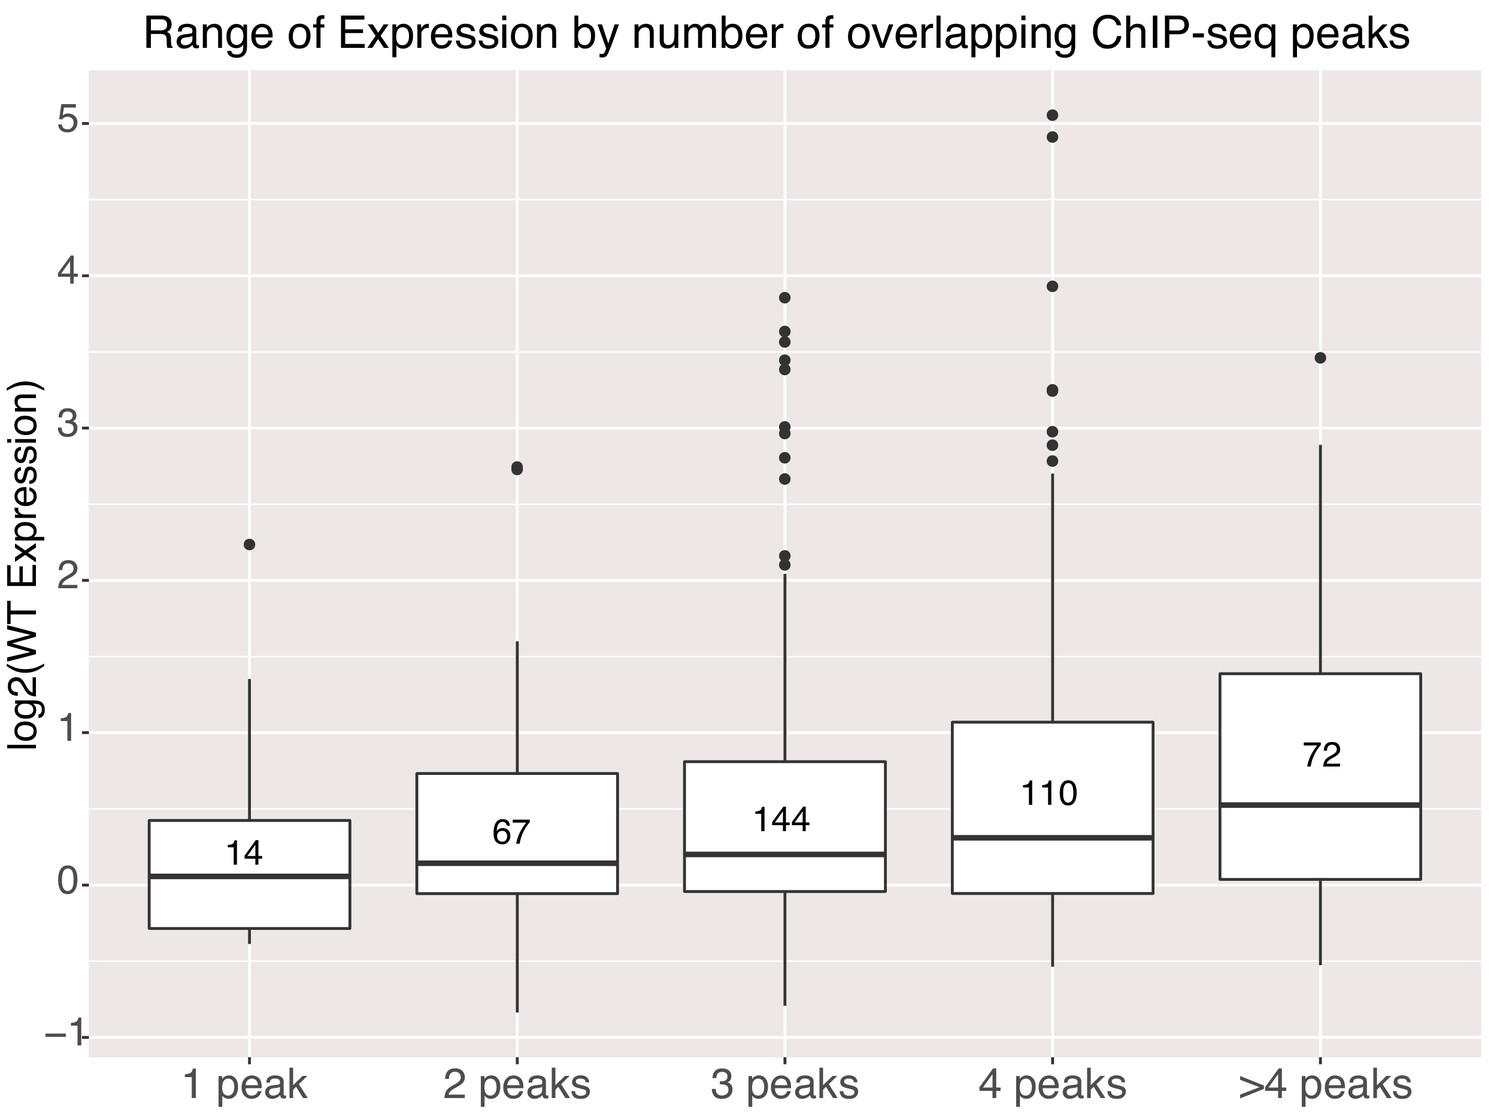
Activity of genomic sequences scales with increased occupancy in the genome.
Expression of elements binned by number of intersected ChIP-seq peak signals for different factors. Number of sequences in each bin indicated in center of boxplot. All gWT sequences overlapped at least one ChIP-seq peak as per library design.
Figure 5—figure supplement 1
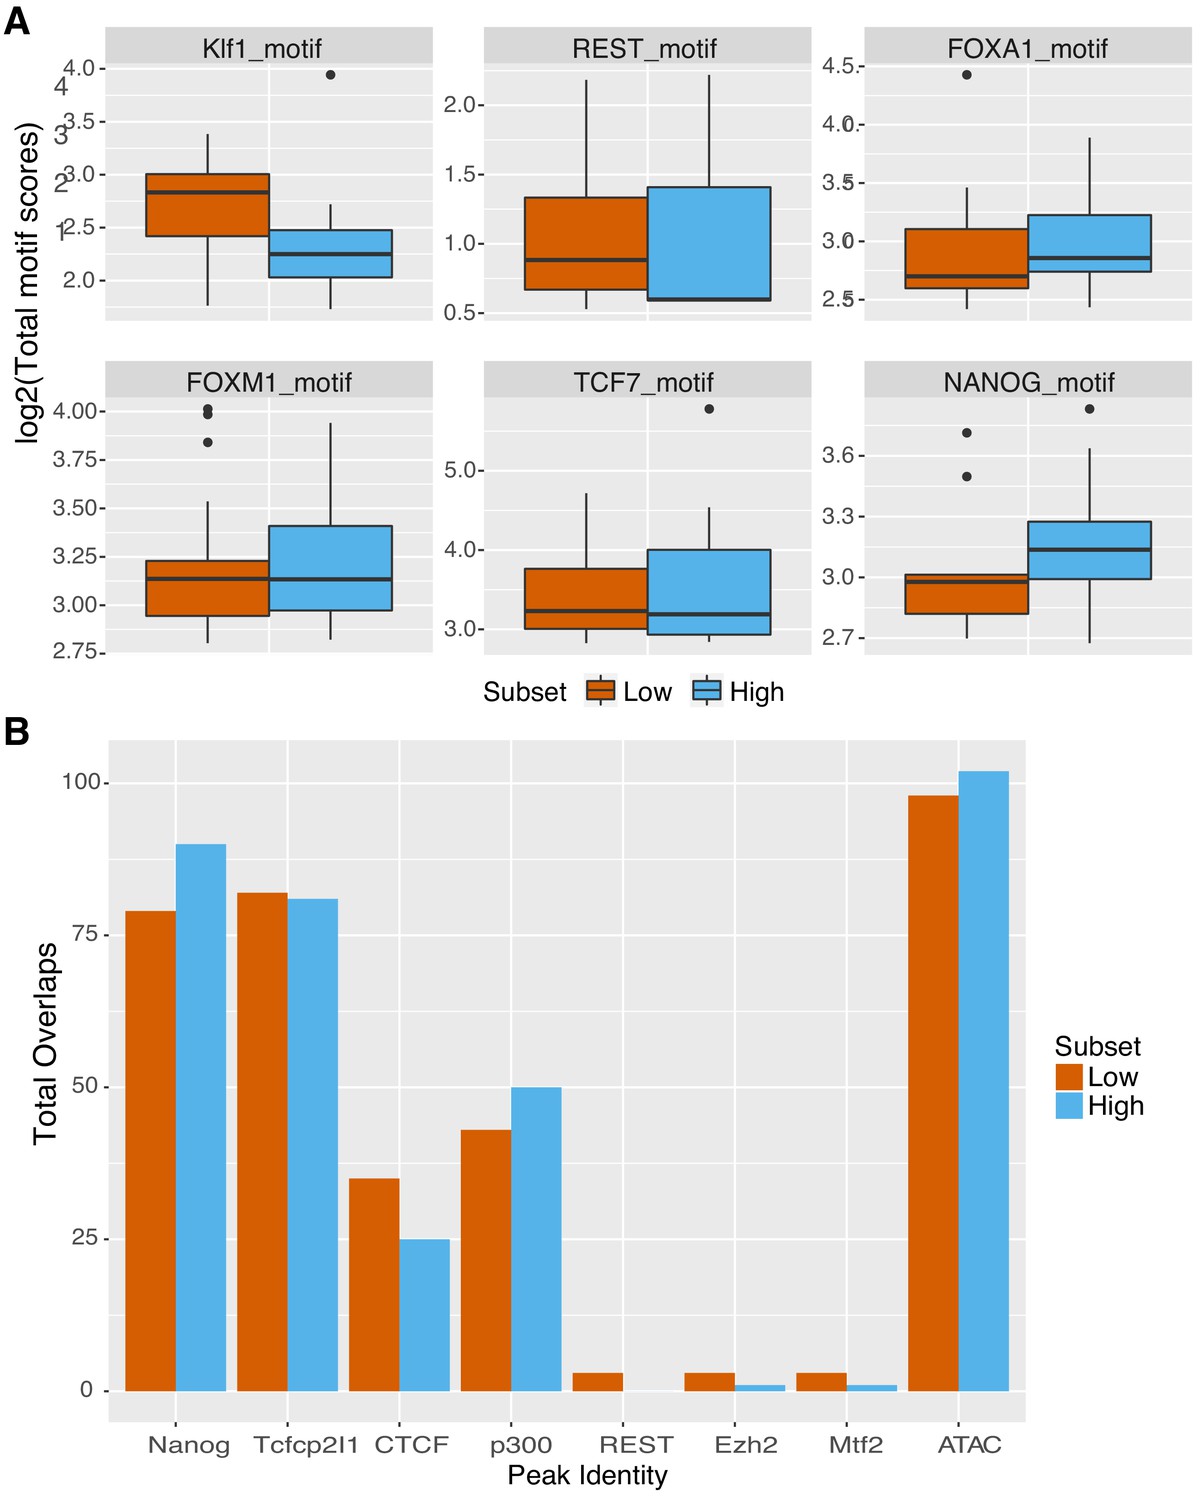
Genomic sequences show signatures for other factors.
(A) Summed motif scores for indicated motif across genomic sequences, excluding primary pluripotency sites. Site scores output during motif scanning of high (top 25% as ranked by gWT expression, n = 101) and low (bottom 25% as ranked by gWT expression, n = 101) gMUT sequences to prevent scoring of O, S, K, or E TFBS sequences. (B) Overlapping TF occupancy, as measured by ChIP-seq, or accessibility, as measured by ATAC-seq, for high (top 25% as ranked by gWT expression, n = 101) and low (bottom 25% as ranked by gWT expression, n = 101) genomic sequence intervals.
Figure 6
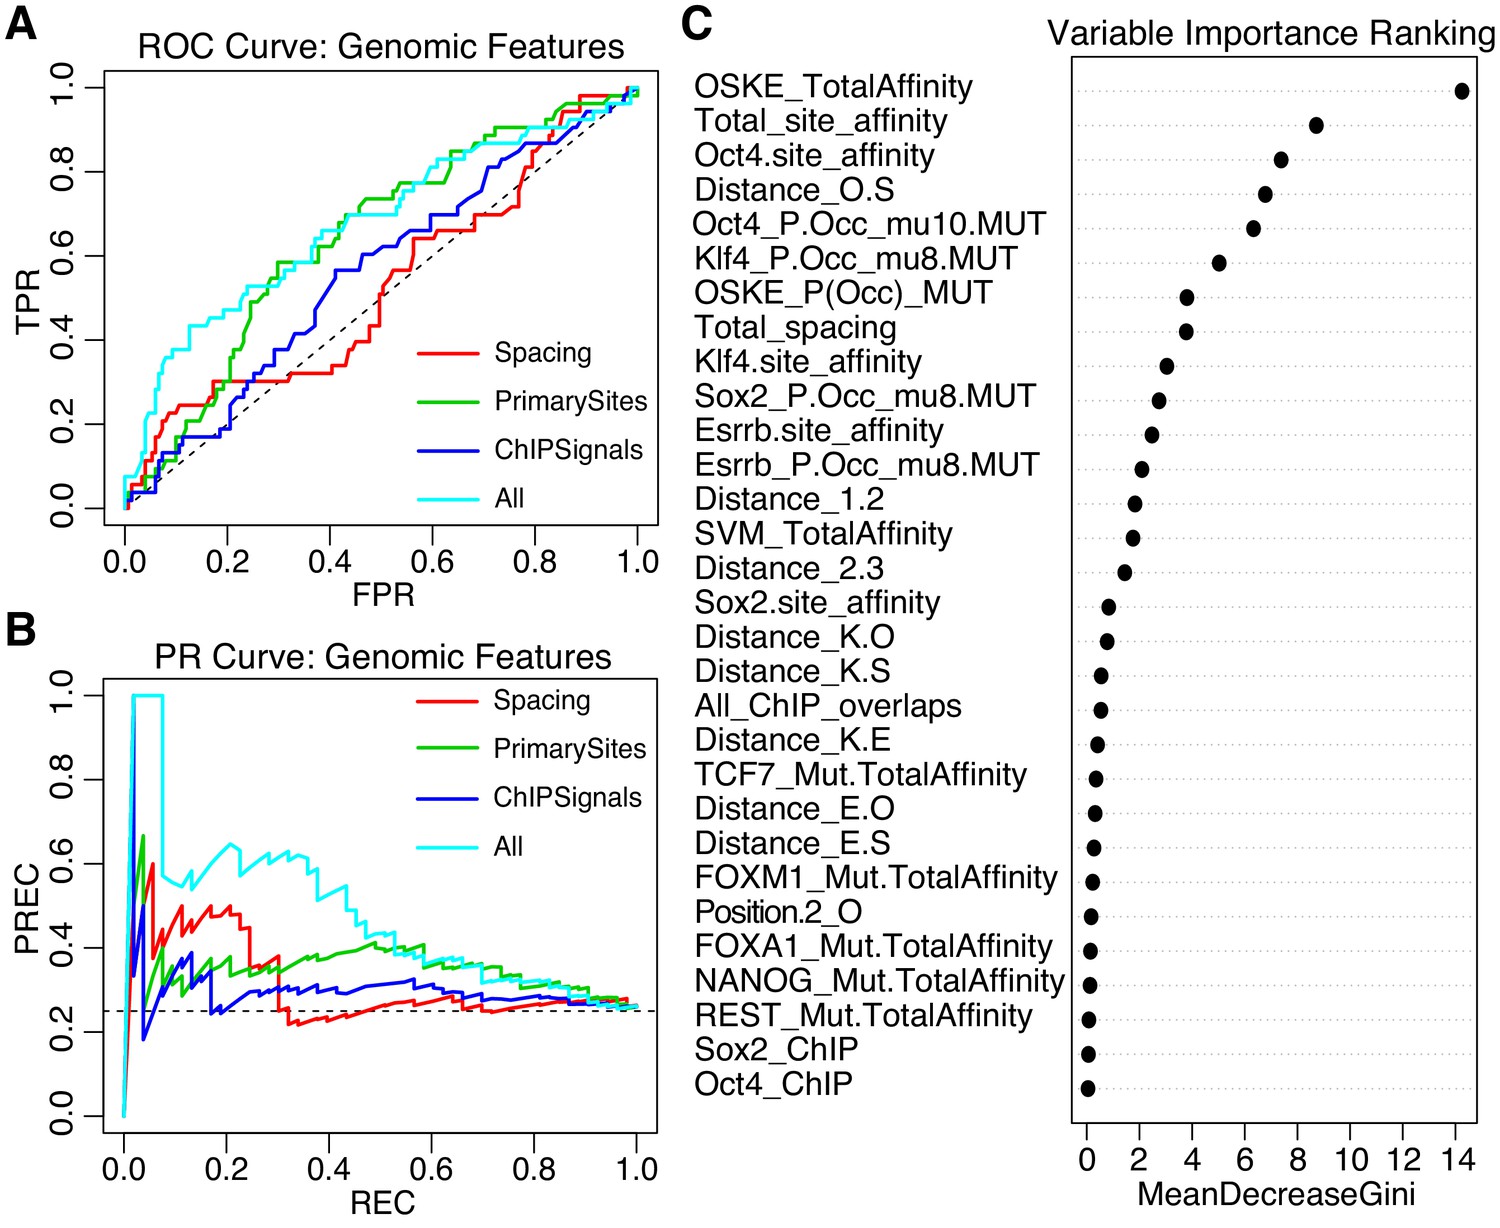
Performance of iRF classification models that include features specific to genomic sequences.
(A) ROC Curve and (B) Precision-Recall (PR) Curve comparing genomic iRF models. Color indicates set of features used to train model. (C) Variable importance as evaluated for the feature by the average reduction in the Gini index (Chen et al., 2008c).
Tables
Key resources table
| Reagent type (species) or resource | Designation | Source or reference | Identifiers | Additional information |
|---|---|---|---|---|
| Cell line (Mus musculus mouse) | RW4 | other | RRID:CVCL_6442 | Gift from Mitra Lab, CGS, Department of Genetics, Washington University School of Medicine in St. Louis. The cell line tested negative for mycoplasma contamination by the Genome Editing and iPSC core at Washington University in St. Louis. |
| Commercial assay or kit | PureLink RNA Mini Kit | ThermoFisher Scientific/Invitrogen | Cat#:12183018A | Followed manufacturer’s protocol |
| Commercial assay or kit | PureLink DNase Set | ThermoFisher Scientific/Invitrogen | Cat#:12185010 | Followed manufacturer’s protocol |
| Commercial assay or kit | TURBO DNA-free | ThermoFisher Scientific/Invitrogen | Cat#:AM1907 | Followed manufacturer’s protocol |
| Commercial assay or kit | SuperScript III Reverse Transcriptase | ThermoFisher Scientific/Invitrogen | Cat#:18080044 | Followed manufacturer’s protocol |
| Commercial assay or kit | anti-Alkaline Phosphatase (AP) staining | System Biosciences | Cat.#:AP100R-1 | Followed manufacturer’s protocol |
| Recombinant DNA reagent | SYN | this paper | Recombinant plasmid library of synthetic (SYN) elements upstream of a minimal Pou5f1 promoter and dsRed/SV40 UTR reporter element | |
| Recombinant DNA reagent | GEN | this paper | Recombinant plasmid library of sequences identified in the mouse genome (GEN) upstream of a minimal Pou5f1 promoter and dsRed/SV40 UTR reporter element | |
| Recombinant DNA reagent | miniSpacer | this paper | Recombinant plasmid library of synthetic elements with swapped spacer (miniSpacer) sequences upstream of a minimal Pou5f1 promoter and dsRed/SV40 UTR reporter element | |
| Software, algorithm | Bedtools v2.2 | https://bedtools.readthedocs.io/en/latest/ | RRID:SCR_006646 | DOI:10.1093/bioinformatics/btq033 |
| Software, algorithm | iRF v2.0.0 | https://cran.r-project.org/web/packages/iRF/index.html | DOI:10.1073/pnas.1711236115 | |
| Software, algorithm | gkm-SVM | https://cran.r-project.org/web/packages/gkmSVM/index.html | DOI:10.1093/bioinformatics/btw203 | |
| Software, algorithm | BEEML | http://stormo.wustl.edu/beeml/ | DOI:10.1371/journal.pcbi.1000590 |
Additional files
-
Supplementary file 1
Composition of libraries and expression measurements.
- https://cdn.elifesciences.org/articles/41279/elife-41279-supp1-v2.xlsx
-
Supplementary file 2
Features, weights and motifs of iRF and gkmSVM models.
- https://cdn.elifesciences.org/articles/41279/elife-41279-supp2-v2.xlsx
-
Supplementary file 3
Sequences of primers used in this study.
- https://cdn.elifesciences.org/articles/41279/elife-41279-supp3-v2.xlsx
-
Supplementary file 4
FASTA-format input file of GEN library sequences for gkmSVM.
- https://cdn.elifesciences.org/articles/41279/elife-41279-supp4-v2.fasta
-
Transparent reporting form
- https://cdn.elifesciences.org/articles/41279/elife-41279-transrepform-v2.docx
Download links
A two-part list of links to download the article, or parts of the article, in various formats.
Downloads (link to download the article as PDF)
Open citations (links to open the citations from this article in various online reference manager services)
Cite this article (links to download the citations from this article in formats compatible with various reference manager tools)
Synthetic and genomic regulatory elements reveal aspects of cis-regulatory grammar in mouse embryonic stem cells
eLife 9:e41279.
https://doi.org/10.7554/eLife.41279


