Subunit exchange enhances information retention by CaMKII in dendritic spines
- Tata Institute of Fundamental Research, India
Figures
Figure 1
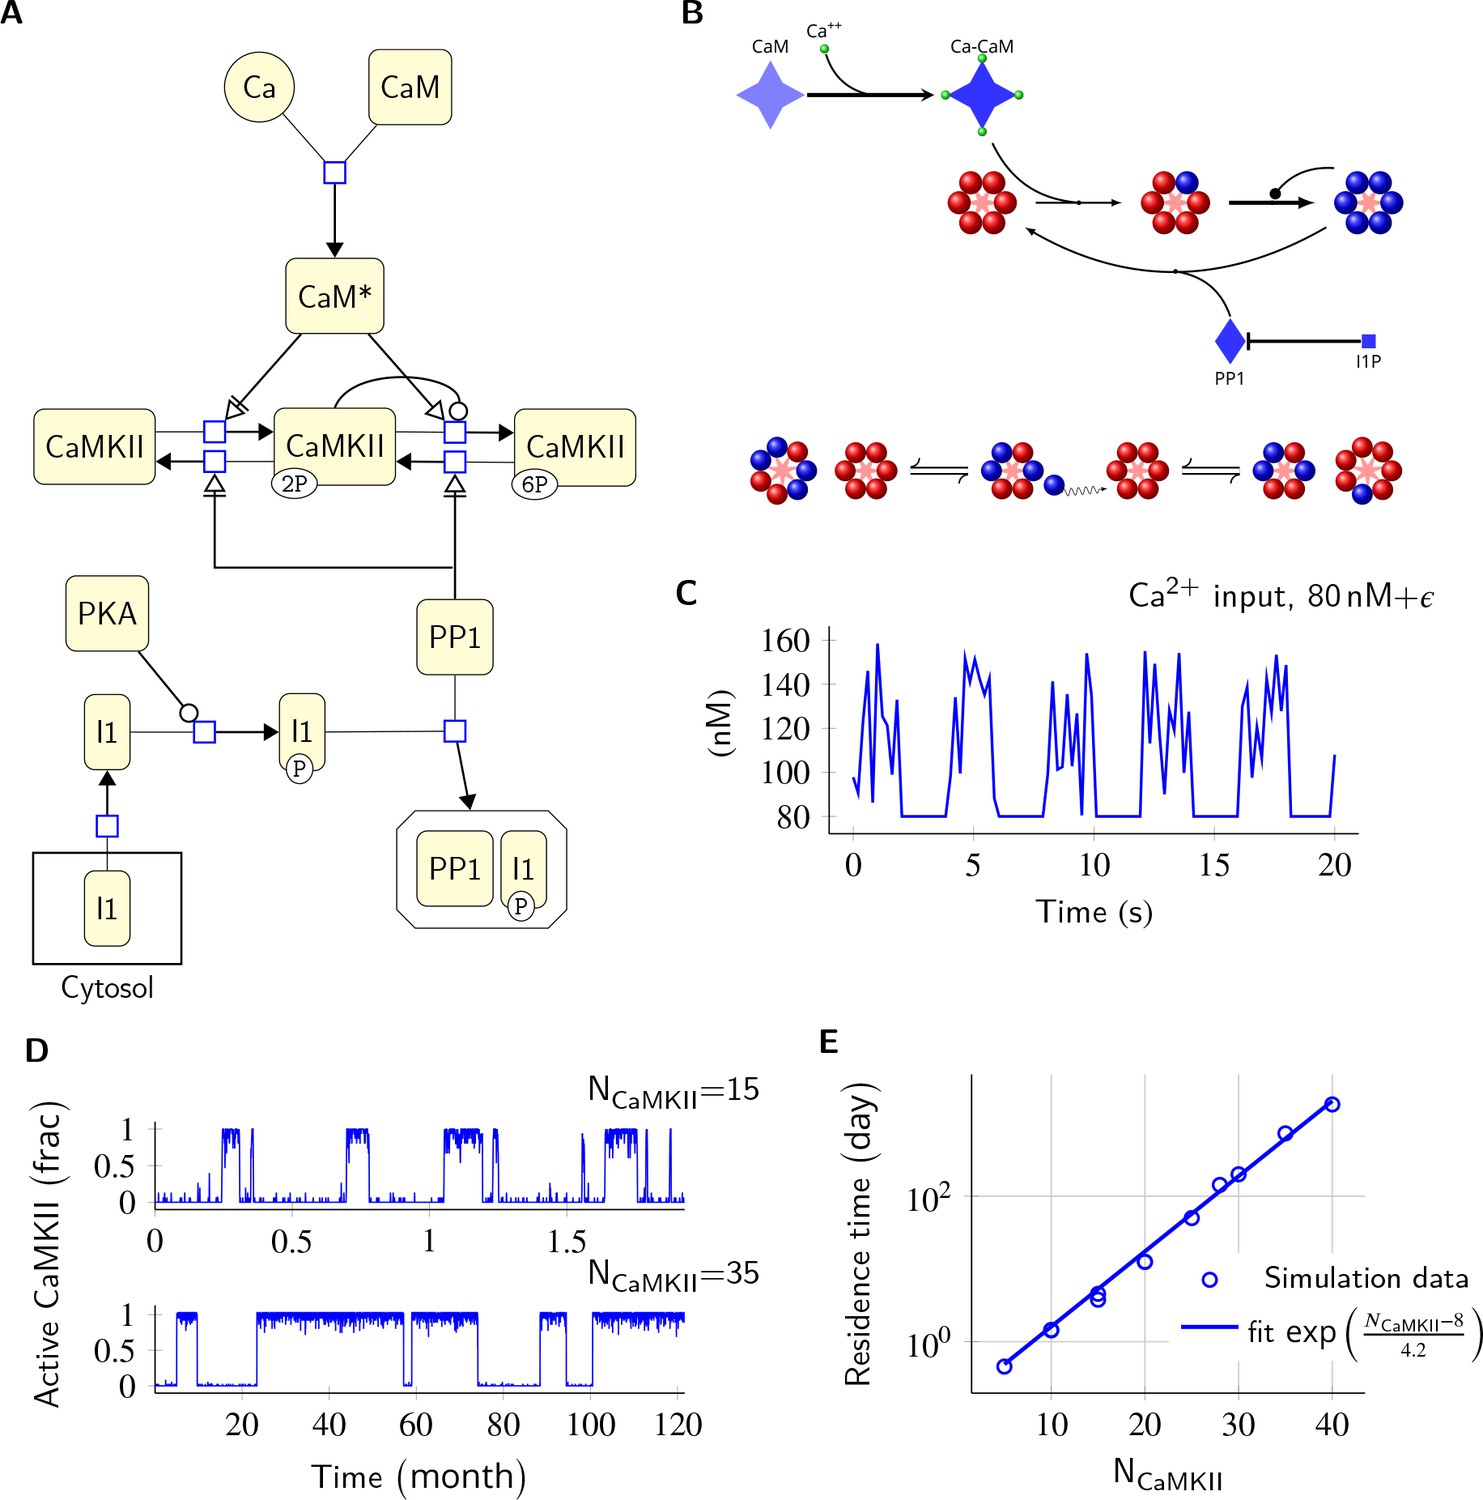
Model description and validation.
(A) CaMKII/PP1 pathway described in System Biology Graphical Notation (SBGN) – Process Description (PD) Language (Le Novère et al., 2009). (B) (above) Major chemical reactions in the CaMKII/PP1 pathway. (below) Subunit exchange between two CaMKII holoenzymes. Blue and red balls represent phosphorylated and un-phosphorylated subunits respectively. (C) Basal Ca2+ profile in spine and PSD. Basal Ca2+ level is 80 nM with fluctuations every 2 s, lasting for 2 s. These fluctuations (represented by symbol ) are sampled from a uniform distribution with median of 120 nM and range of 40 nM (see Materials and methods). (D) Without diffusion and subunit exchange, CaMKII in our model is bistable. Two trajectories of CaMKII activity (fraction of total CaMKII holoenzymes with at least two subunits phosphorylated) are shown for different system sizes NCaMKII = 15 (top) and NCaMKII = 35 (bottom). (E) Switch stability (measured as average residence time in the stable states) increases exponentially with system size NCaMKII. Turnover rate . Panels C, D, and E show key properties of our model that are very similar to those of the MZ model. Source data are available at https://github.com/dilawar/SinghAndBhalla_CaMKII_SubunitExchange_2018/tree/master/PaperFigures/elifeFigure1 (Singh and Bhalla, 2018).
Figure 2
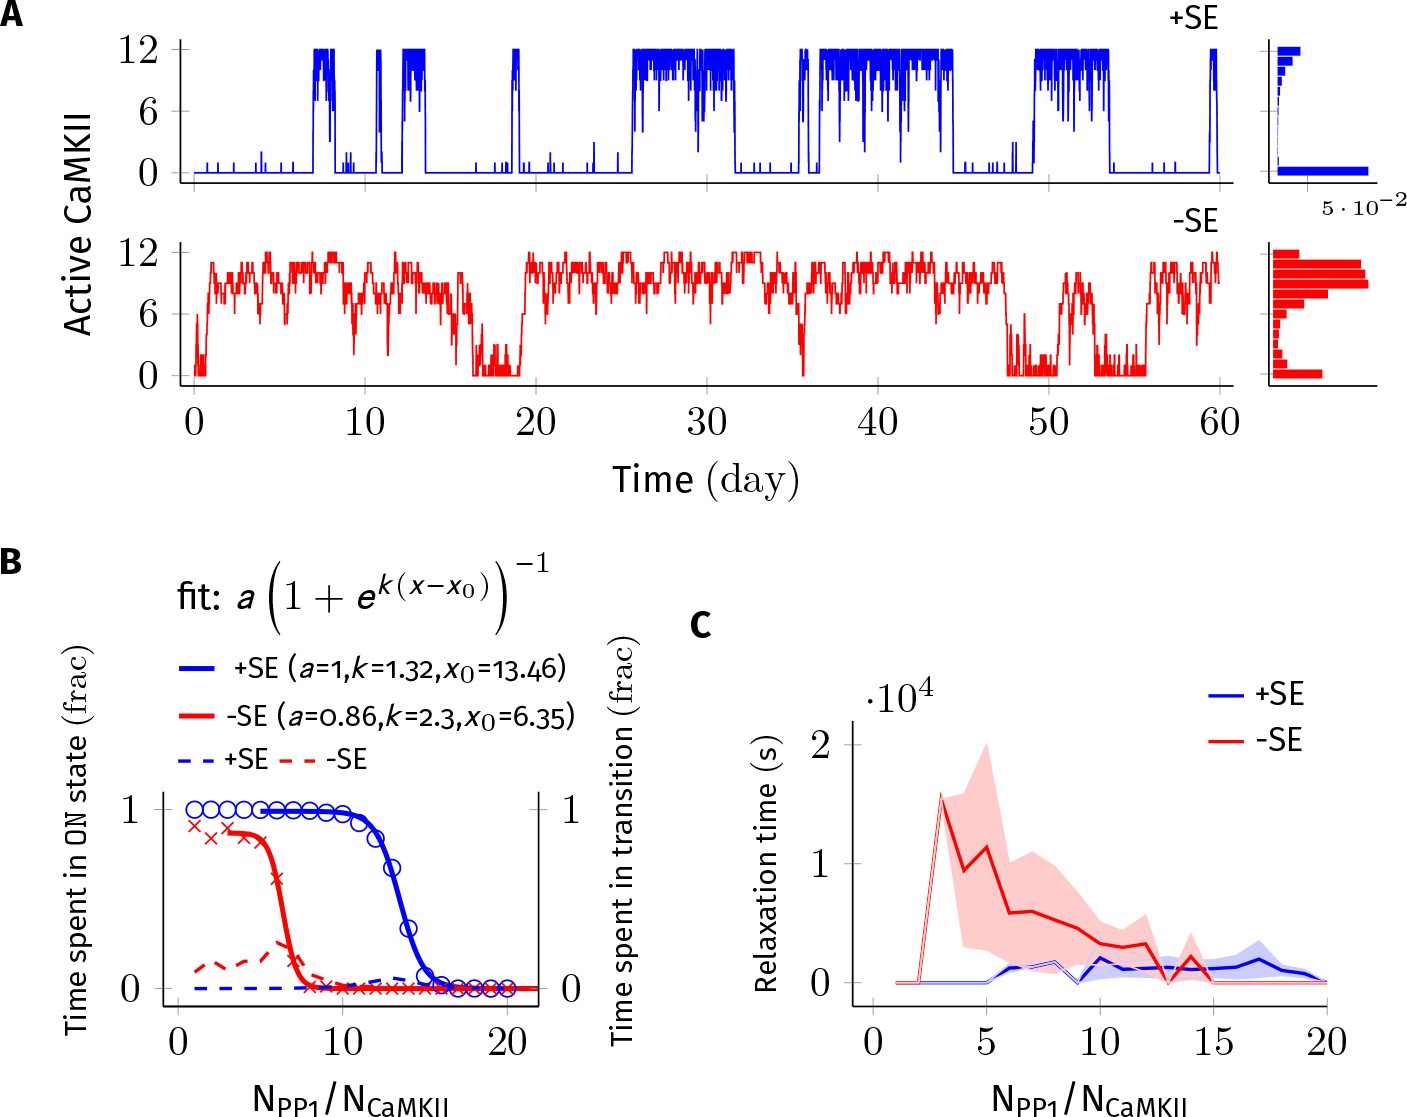
Subunit exchange improves the switch’s tolerance of PP1 by acting as a compensatory mechanism for the dephosphorylation of CaMKII by PP1.
(A) Two representative bistable trajectories (NCaMKII = 12) are shown with subunit exchange (+SE, blue) and without subunit exchange (-SE, red) respectively (Dsub = 0.1 µm2 s−1, and DPP1 = 0.5 µm2 s−1 for both blue (+SE) and red (-SE); and NPP1 = 168 for blue (+SE) and 72 for red (-SE), respectively). (B) Blue and red solid lines represent the fraction of total time spend by the switch in the ON state with and without subunit exchange, respectively. The lines are fitted with the function . Dotted red and blue lines show the fraction of time that the switch spends in intermediate states (, 2 < a < n-2) with and without subunit exchange, respectively. Due to subunit exchange, the switch tolerated a larger amount of PP1 ( value 6.35 vs 13.46 that is a change of 7.11NCaMKII). The range of PP1 for which switch remained bistable saw a moderate change (, 1.32 vs. 2.3). The fraction of time spent in intermediate states (dashed lines) is much smaller when subunit exchange is enabled (blue dashed line), that is the switching time is shorter. (C) Due to subunit exchange, relaxation time becomes independent of NPP1 (blue vs red). Shaded area represents standard deviation. Source data are available at https://github.com/dilawar/SinghAndBhalla_CaMKII_SubunitExchange_2018/tree/master/PaperFigures/elifeFigure2 (Singh and Bhalla, 2018).
Figure 3
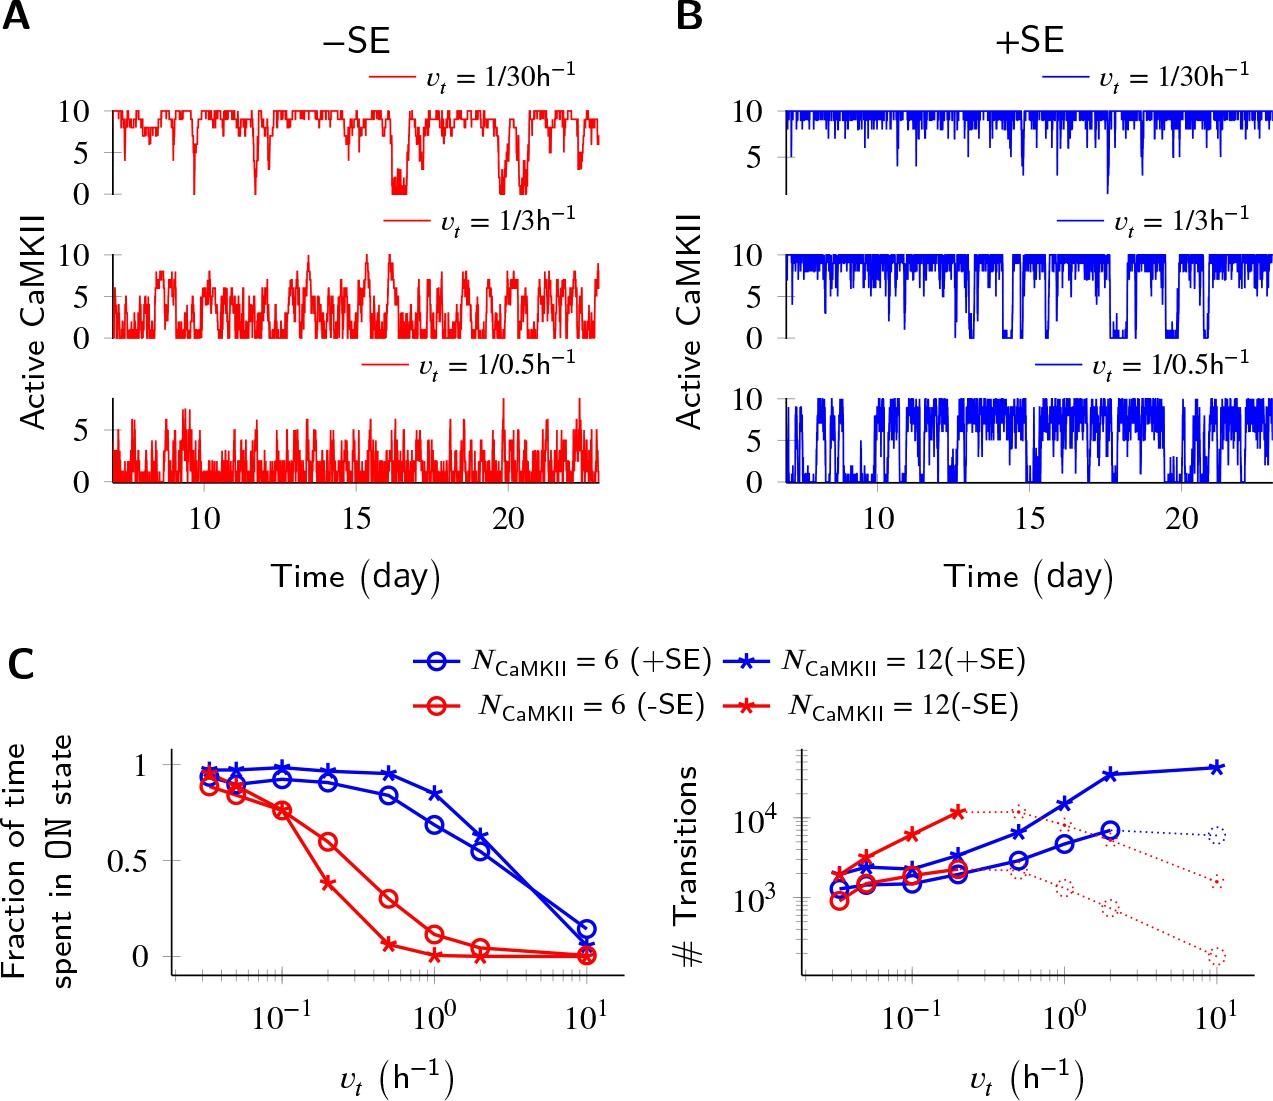
Subunit exchange improves switch tolerance of higher rates of protein turnover.
(A,B) Three sample trajectories are shown for a switch of size NCaMKII = 10 without subunit exchange (-SE, red) and with it (+SE, blue). We consider three different turnover rates of 1 per 30 h, 1 per 3 h, and 1 per 0.5 h. As turnover is increased, the state stability of the ON state of the switch decreases. (C, left) Normalized residence time of the ON state vs. turnover rate for two switches of size 6 and 12. Without subunit exchange, switch stability decreases steeply with turnover rate (red); however, when subunit exchange is enabled, switch stability is not affected by turnover rates as high as 1 h-1 (blue). (C, right) In the bistable regime (solid lines), the number of switching events increases monotonically with turnover rate. Source data are available at https://github.com/dilawar/SinghAndBhalla_CaMKII_SubunitExchange_2018/tree/master/PaperFigures/elifeFigure3 (Singh and Bhalla, 2018).
Figure 4 with 1 supplement
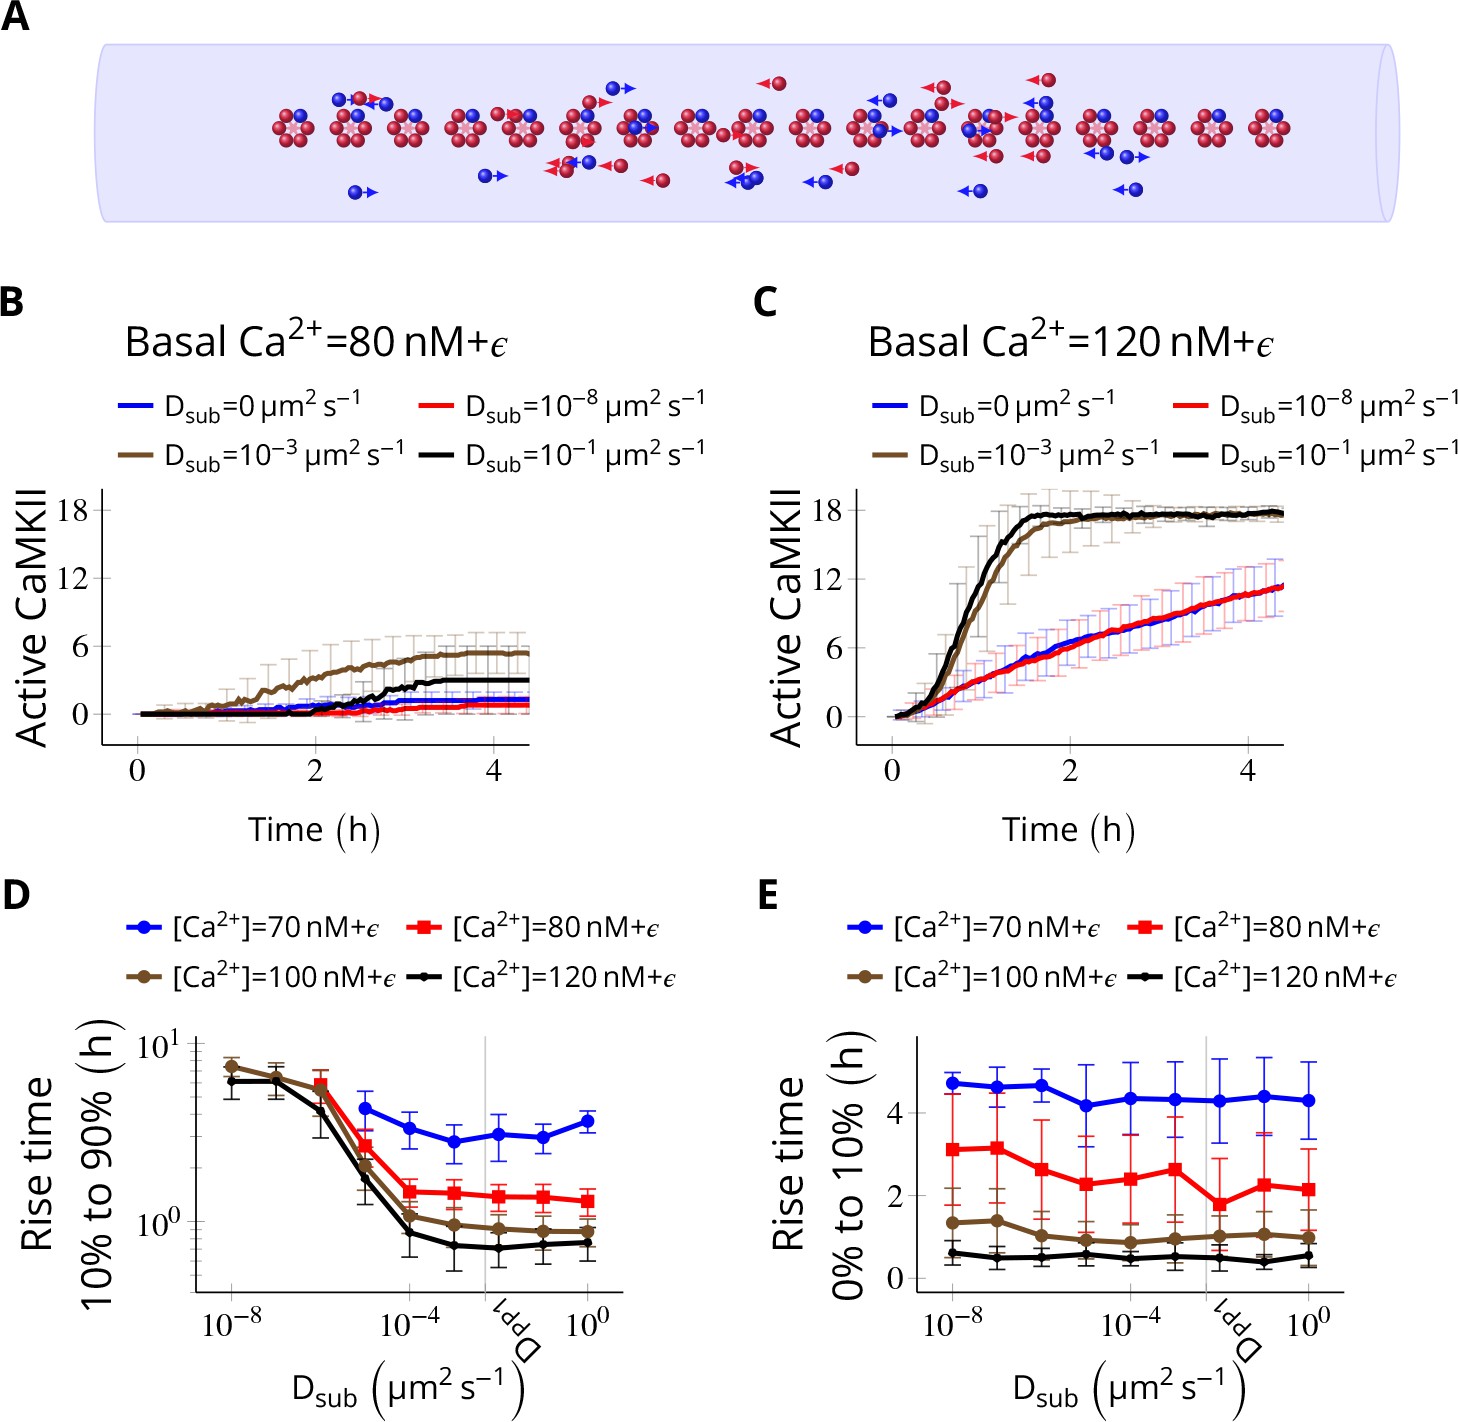
Subunit exchange facilitates the spread of kinase activity (Stratton et al., 2014).
(A) 18 CaMKII holoenzymes were simulated in a cylindrical arena of volume 0.0275 µm3, discretized into 18 voxels, each separated by 30 nm. Red and blue balls represent unphosphorylated and phosphorylated subunits, respectively. (B) Activation profile of CaMKII at mean basal calcium level of 80 nM+ ( is fluctuation in basal Ca2+ levels Figure 1A) for various values of Dsub with NPP1 = 15× NCaMKII. For this value of NPP1, we see moderate or no mean activity of CaMKII for various values of Dsub for basal Ca2+ = 80 nM + . This serves as the baseline for comparisons. (C) At a slightly higher level of basal Ca2+ (120 nM+), subunit exchange has a stronger effect on CaMKII activation. When subunits were modeled with zero or very small diffusion coefficients (Dsub = 0 and Dsub = 10-8 µm2 s−1), the effect of subunit exchange was smaller than when subunits were tested with moderate-to-high diffusion coefficients (Dsub = 0.001 and 0.1 µm2 s−1), (D) Quantification of the effect of subunit exchange (shown in B and C) as measured by the time taken by CaMKII to rise from 10% to 90% of its maximum value (rise time) in hours vs Dsub and basal Ca2+ levels. The effect of subunit exchange is greater (i.e. shorter rise times) at higher calcium levels for all values of Dsub. Rise time is also shorter for larger Dsub for all values of [Ca2+]. Error bars represents standard deviation (n = 40 trajectories). (E) The time to onset of CaMKII activity is independent of Dsub and depends only on [Ca2+]. The time to onset of activity is measured as the time taken by inactive CaMKII to rise from 0 to 10% of its maximum value. Average time for the onset of activity decreased with increasing basal [Ca2+] levels but remained independent of Dsub suggesting that subunit exchange does not play a significant role at the beginning of activation of CaMKII by Ca2+. Error bar represents standard deviation (n = 40 trajectories). DPP1 = 0.5 µm2 s−1 for all simulations. Source data are available at https://github.com/dilawar/SinghAndBhalla_CaMKII_SubunitExchange_2018/tree/master/PaperFigures/elifeFigure4 (Singh and Bhalla, 2018).
Figure 4—figure supplement 1
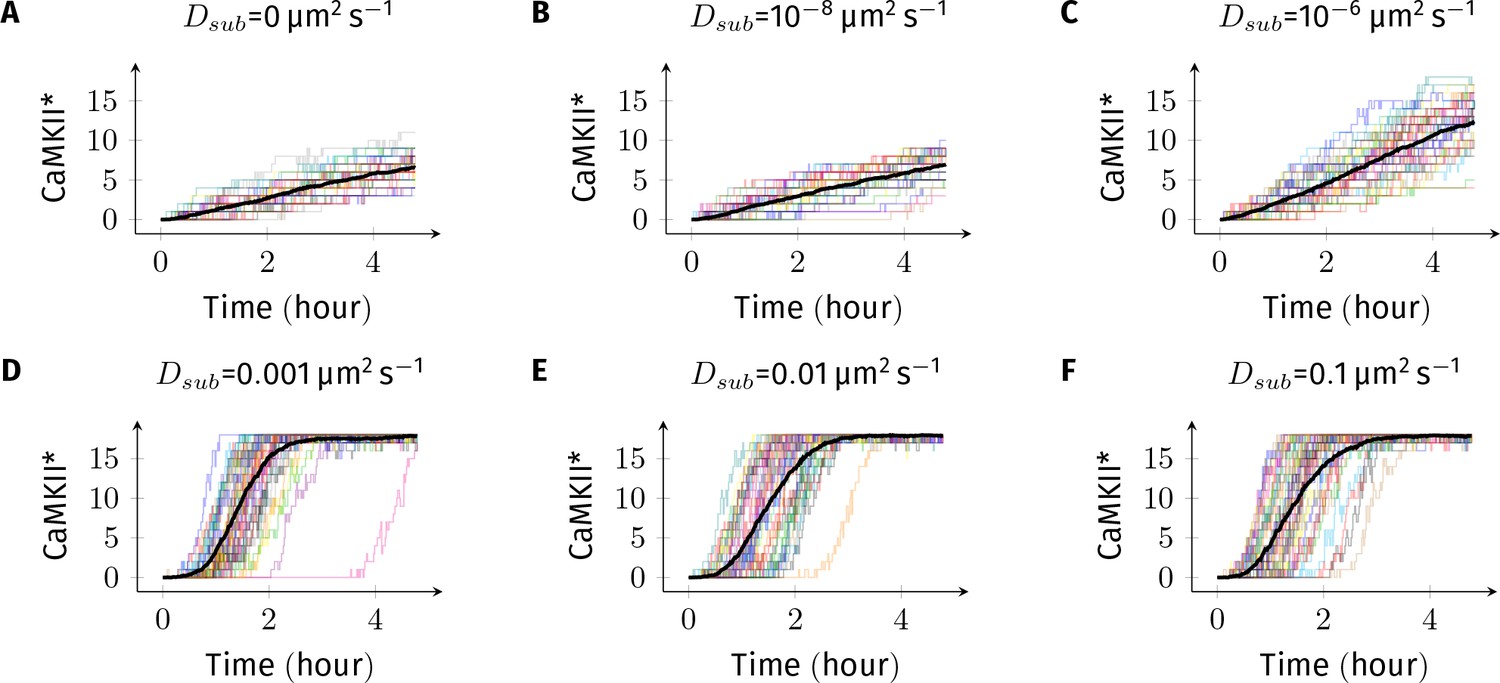
Sample trajectories of CaMKII activation for basal Ca2+ concentration of +.
In all simulations, DPP1 was set to 0.5 µm2 s−1 and Dsub was varied. Each plot contains 40 trajectories. Dark black trajectory in each plot shows the average trajectory.
Figure 5
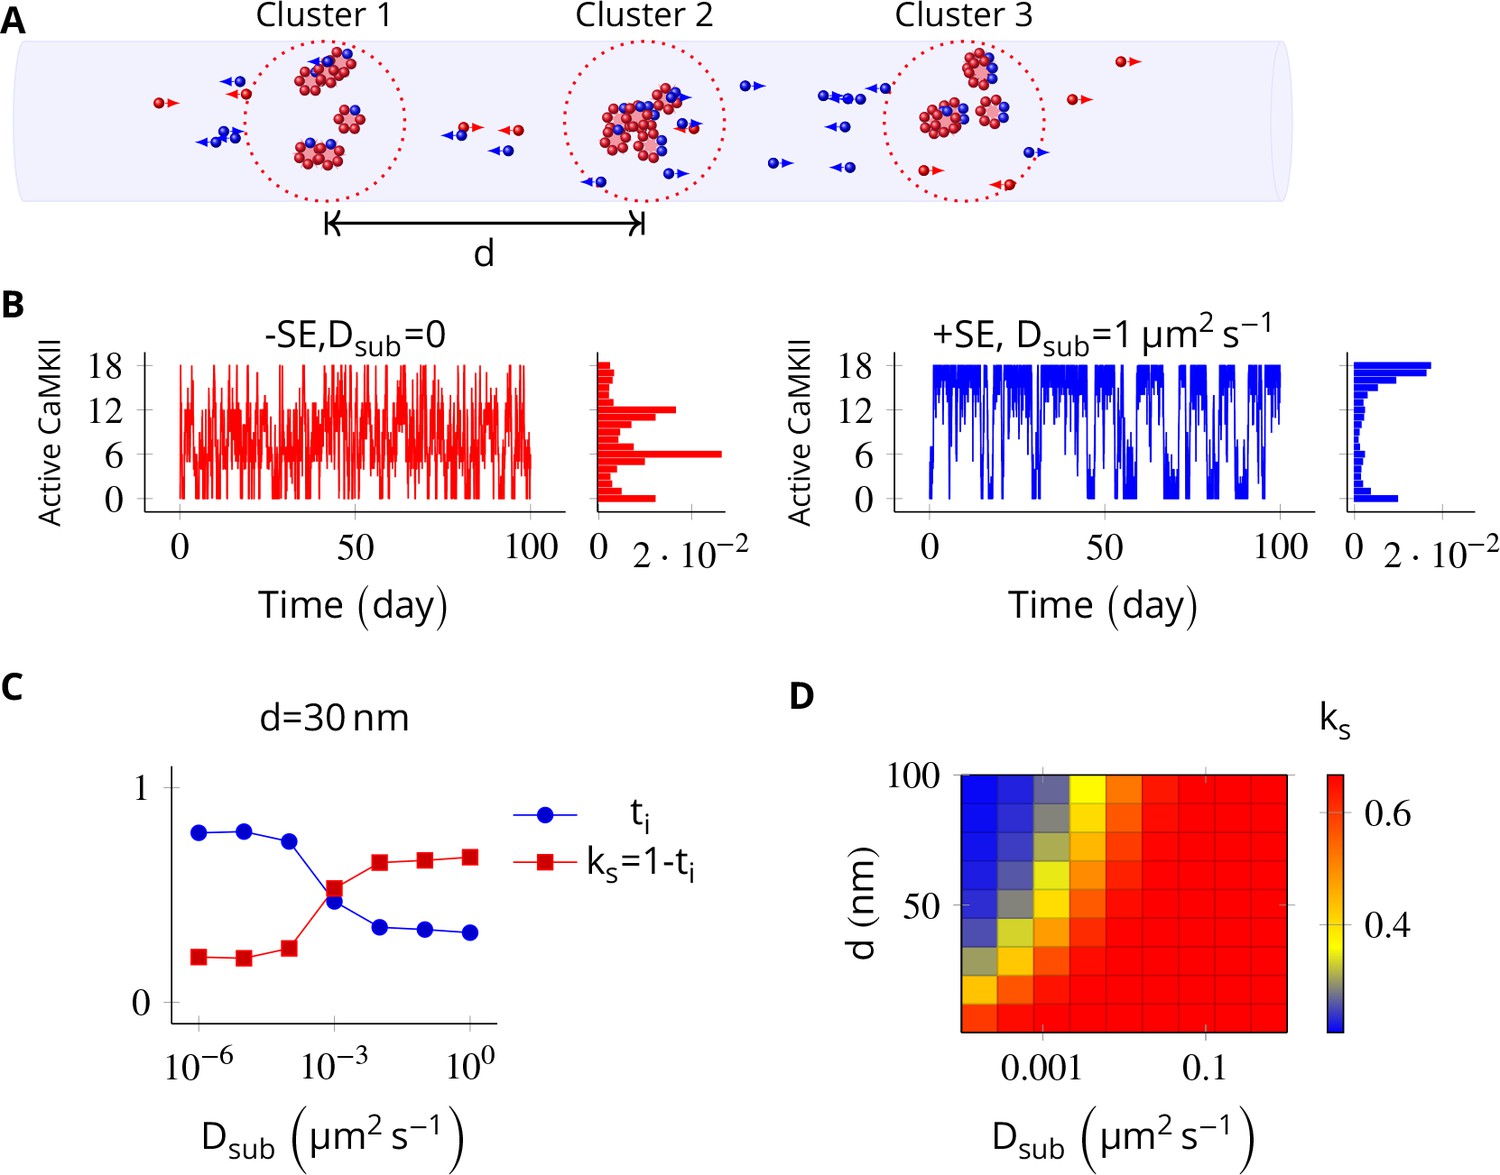
In the PSD, subunit exchange synchronizes activity of CaMKII clusters.
(A) Three clusters, each of size 6 (i.e., NCaMKII = 6) separated by distance were simulated in a cylindrical arena of volume 0.0275 µm3 discretized into three voxels. CaMKII subunits are shown as red (unphosphorylated) and blue (phosphorylated) balls. (B) (left) Without subunit exchange, all three switches flipped independently with a low residence time, resulting in a binomial distribution of states (Bar chart on right, in red). (right) With subunit exchange, all switches synchronized their activity that is they acted as a single bistable switch with a longer residence time. (C) Strength of synchronization () vs. diffusion constant Dsub for a system consisting of three switches each separated from each other by a distance of 30 nm. Variable where is the fraction of total time spent by the switches in the intermediate states xayn-a; 1 < a < n. Synchronization is strong if ks > 0.4. (D) 2-D plot of vs. Dsub and . The effect of synchronization due to subunit exchange is strong (red region) and robust to changes in Dsub, and effective for inter-cluster distance () as large as 100 nm. DPP1 = 0.5 µm2 s−1 for all simulations. Source data are available at https://github.com/dilawar/SinghAndBhalla_CaMKII_SubunitExchange_2018/tree/master/PaperFigures/elifeFigure5 (Singh and Bhalla, 2018).
Figure 6
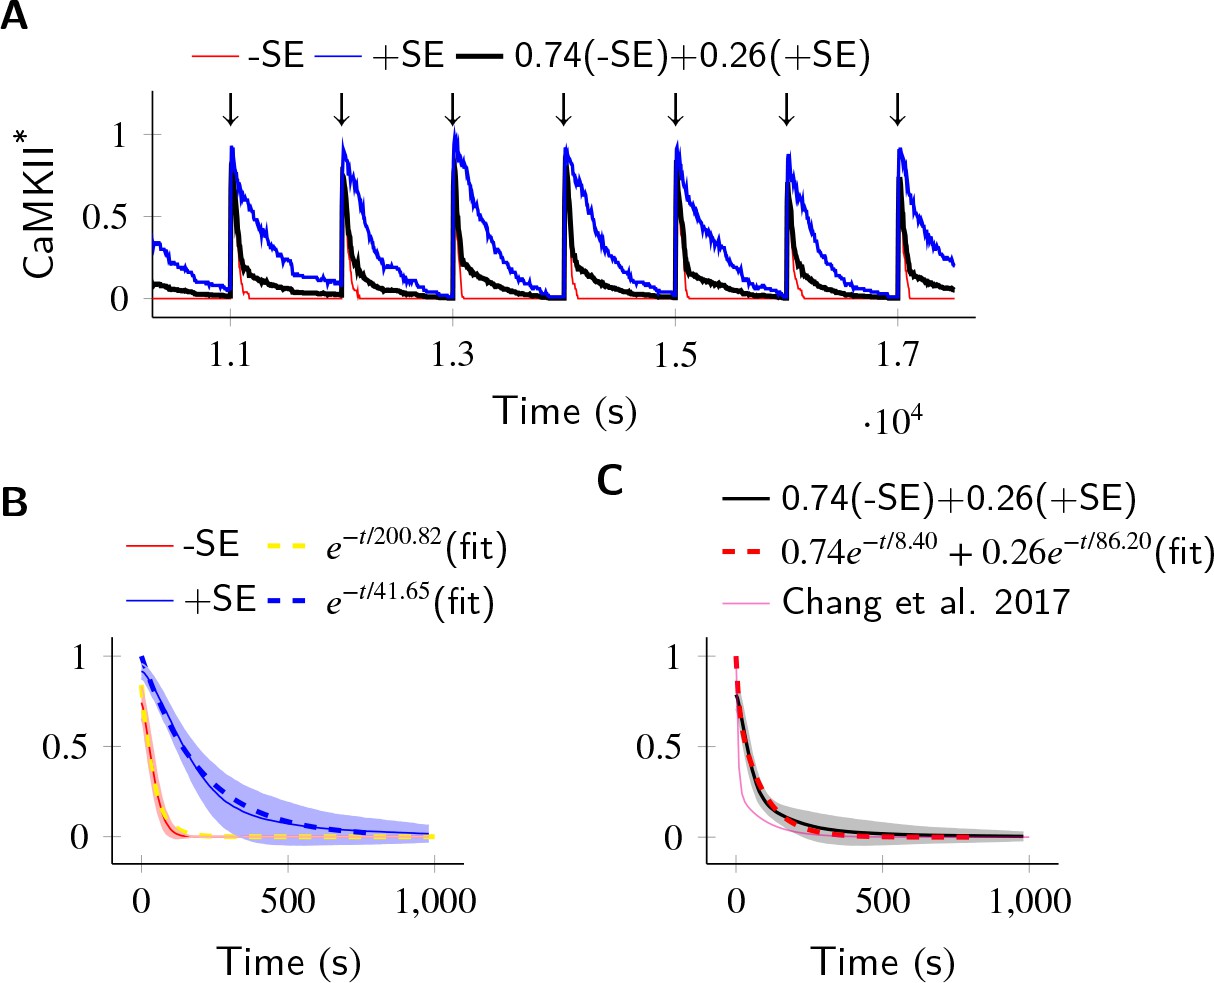
In the PP1-rich spine cytosol, CaMKII acts as a leaky integrator of Ca2+ activity.
The clustered CaMKII population decays more slowly than the non-clustered population, due to subunit exchange. Thus, a mixed population of clustered and non-clustered CaMKII can explain observed two time-constants of CaMKII decay (Chang et al., 2017). (A) Trajectories of CaMKII activity (fraction of all CaMKII which are active) when a strong periodic Ca2+ pulse of 3 s duration was applied to the system after every 1000 s (). After the pulse, Ca2+ levels were brought down to 80 nM. Three trajectories are shown: without subunit exchange (red), with subunit exchange (blue), and a weighed sum of red and blue (74% red +24% blue as estimated in [Chang et al., 2017]). (B) Average decay dynamics after the onset of strong Ca2+ pulse (). When there was no subunit exchange, CaMKII decayed with a time- course of approximately 41.65 s (red and dashed yellow [fit]). When subunit exchange was enabled, CaMKII decay had a slower time-constant of 200.82 s (blue and dashed blue [fit]). (C) Average dynamics of the mixed population (black). This was fit to a double exponential that is for (dashed red). For a given (estimated in [Chang et al., 2017]), our estimate of time-constants (8.4 s, 86.2 s) matched well with experimentally estimated time-constants (6.4 s ± 0.7, 92.6 s ± 50.7). Shaded areas are the standard deviation. Number of voxels Nv = 10, Dsub = 1 µm2 s−1, DPP1 = 0.5 µm2 s−1. Source data are available at https://github.com/dilawar/SinghAndBhalla_CaMKII_SubunitExchange_2018/tree/master/PaperFigures/elifeFigure6 (Singh and Bhalla, 2018).
Figure 7
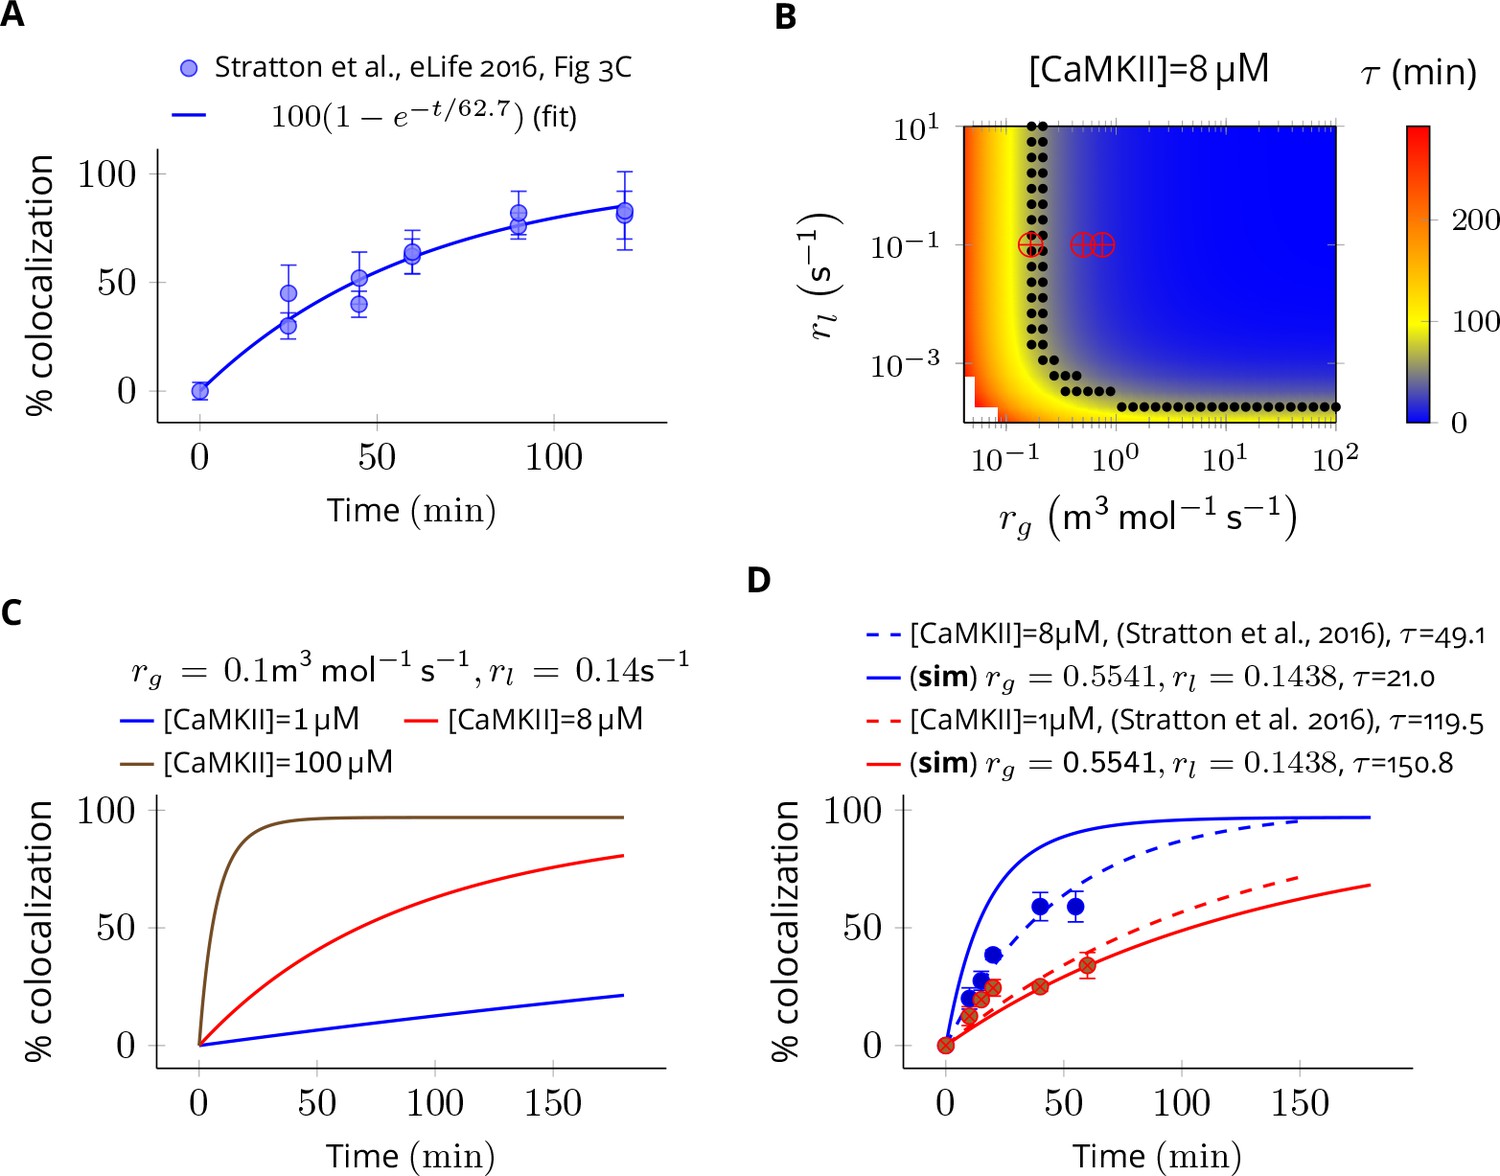
Estimation of subunit exchange rate by fitting experimental data to a model of a single molecule assay (Stratton et al., 2014).
(A) Colocalization dynamics as reported in Stratton et al., 2014 (all data scraped from figures) at CaMKII = 8 µM (blue dots). Solid blue line shows a best fit with =62.7 min. (B) Phase plot of of colocalization trajectories generated for various values of and (Equation 4). Black dots show values of and for which = 62.7 ± 20% (S.E.M.). Red marks show the values of rate constants (Equation 3) used in this study at various volumes and NCaMKII. (C) For the fixed values of and , three trajectories are shown at different CaMKII concentrations. As seen in the experimental data, the rate of colocalization increases with increasing CaMKII concentration. (D) For typical values of exchange rates used in this paper, we plotted simulation results (solid lines) with experimental values (dots) and their best exponential fit (dashed lines). The was −10.06 min/µM (data) and −18.54 min/µM (simulation). Source data are available at https://github.com/dilawar/SinghAndBhalla_CaMKII_SubunitExchange_2018/tree/master/PaperFigures/elifeFigure7 (Singh and Bhalla, 2018).
Figure 8 with 1 supplement
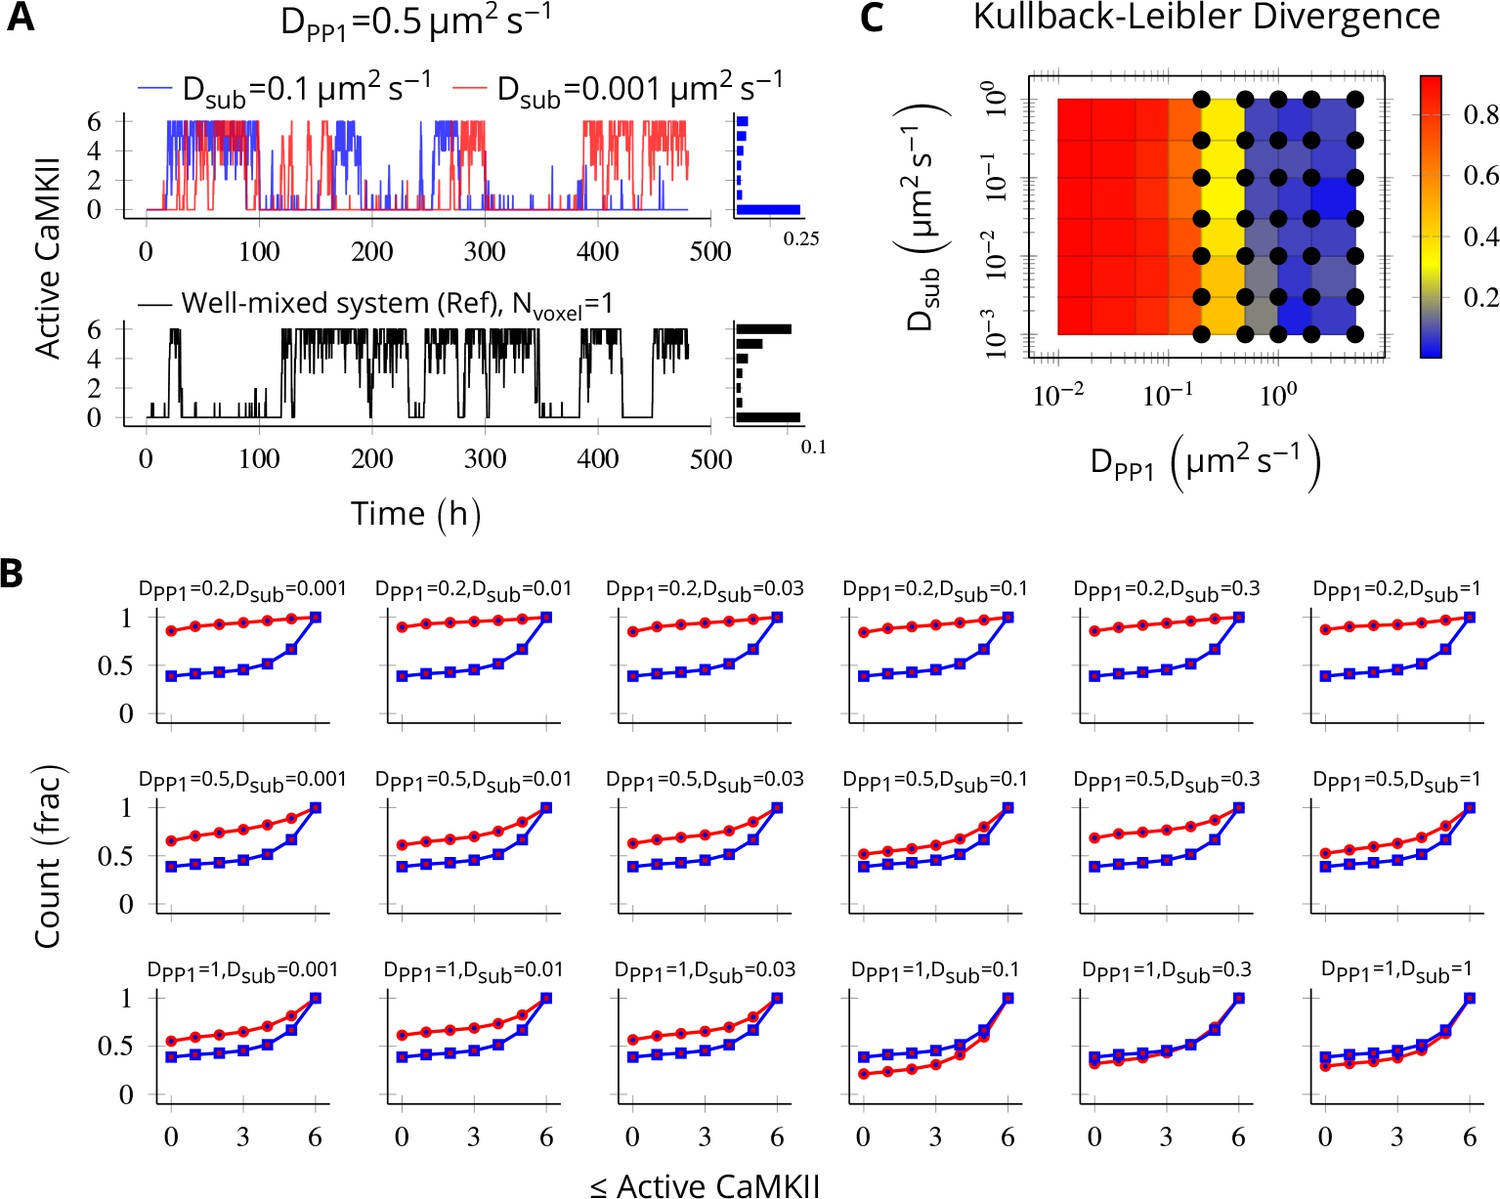
Method validation.
NCaMKII = 6 holoenzymes as described in Figure 4 were simulated in a cylindrical arena divided into six voxels separated by 30 nm. Basal Ca2+ was set to 100 nM+. (A, above) For a typical value of DPP1 = 0.5 µm2 s−1 used in our model, varying Dsub did not result in loss of bistability of CaMKII activity. The distribution of state occupancy is shown for the case of Dsub = 0.1 µm2 s−1 in bar chart on the right. (A, below) Reference well-mixed system for comparison. Six holoenzyme were simulated in a single well-mixed cylinder of same length and volume, and with same parameter values as above. The distribution of state occupancy is shown on the right. (B) Cumulative histograms of CaMKII activity for various values of DPP1 and Dsub (unit µm2 s−1). The red and blue lines represent spatially discretized and well-mixed reference system (shown in A, black) respectively. The spatially discretized system (red) converges to the well-mixed system (blue) for higher DPP1 values. For fixed value of DPP1, changing Dsub has little or no effect on convergence. For a typical value of DPP1 = 0.5 µm2 s−1 , the system shows reasonable convergence (second row, also see A). (C) Quantification of convergence to well-mixed case. We used Kullback-Leibler divergence (relative entropy) to quantify the similarity between the state occupancy histograms (e.g. as in panel A) for the spatially extended case, and the reference well-mixed system, respectively. Identical histograms will have zero Kullback-Leibler divergence. The phase plot shows Kullback-Leibler divergence between the histograms for the spatially extended system and the reference bistable system. Black dots represent bistable configurations with at least four transitions observed in a simulation of the spatially discretized system, lasting 20 days. Thus, the spatially extended, discretized system converged to the behavior of the reference bistable system. Source data are available at https://github.com/dilawar/SinghAndBhalla_CaMKII_SubunitExchange_2018/tree/master/PaperFigures/elifeFigure8 (Singh and Bhalla, 2018).
Figure 8—figure supplement 1
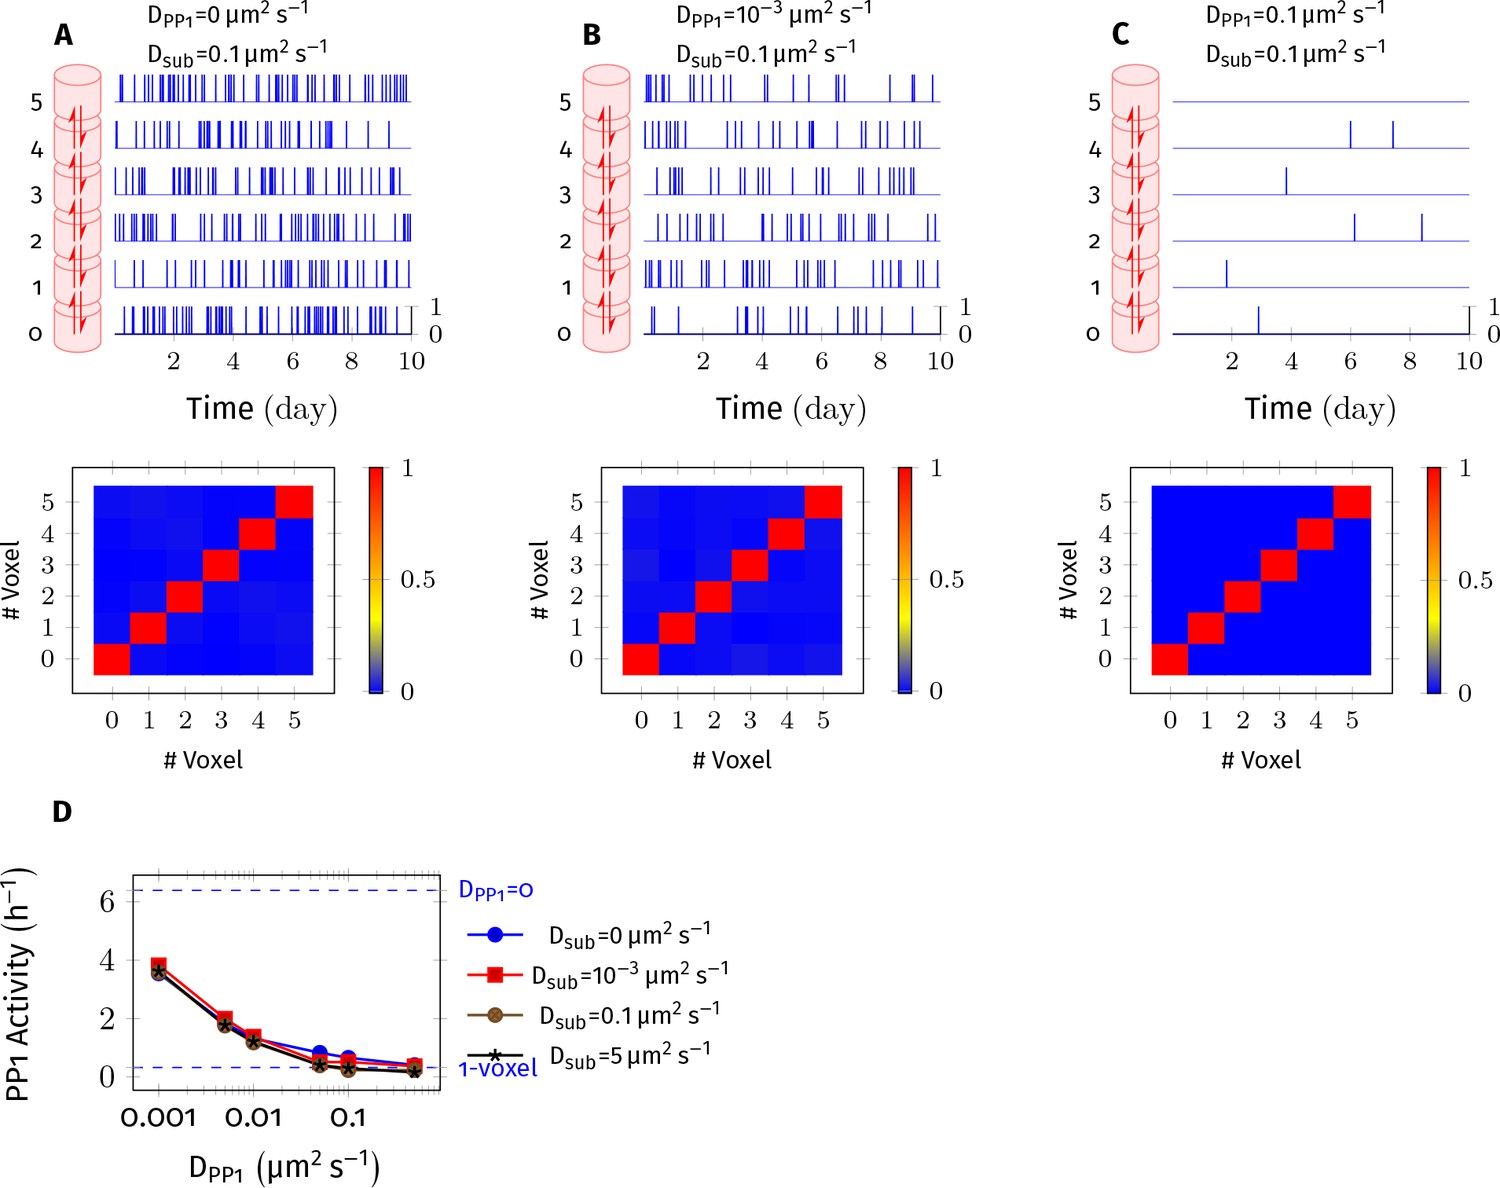
PP1 potency reduces as DPP1 increases.
CaMKII/PP1 system was simulated in a cylindrical arena discretized into 6 voxels of equal volume separated by distance = 30 nm. (A) (above) For each voxel, the trajectory of active PP1 vs. time is plotted in blue. (below) Cross-correlation matrix of PP1 activity that is the entry of the matrix shows the value of correlation coefficient of PP1 activity inside voxel and inside voxel (Pearson product-moment correlation coefficient, using numpy.corrcoef function). (B,C) Same as A but with different value of DPP1 , 0.001 µm2 s−1 and 0.1 µm2 s−1, respectively. PP1 activity reduced in all voxels with increased DPP1. The correlation of PP1 activity among voxels did not improve with increased DPP1 therefore non-uniform distribution of PP1 in voxels is unlikely to be a significant contributor to the observed loss of PP1 potency. (D) PP1 activity decreased with increased DPP1 but remained independent of diffusion coefficient of subunit (Dsub). On the y-axis, PP1 activity is measured as ratio of sum of number of all active PP1 in all voxels during the simulation divided by the simulation time in hours. On top, dashed blue line (labeled blue DPP1 = 0) represents the case where PP1 was not allowed to diffuse. At bottom, dashed blue line (labeled blue1-voxel) shows the case where the cylinder consists only of 1 voxel and diffusion is instantaneous that is it is a well-mixed system. As expected, as DPP1 increased, the six voxels system converged to a well-mixed system of 1 voxel of 6x volume. Note that a similar effect is seen for a range of Dsub, including Dsub = µm2 s−1, for which = 0.33 nm, satisfying the condition (Isaacson, 2009; Erban and Chapman, 2009; also see Appendix 1—figure 2). Thus, we do not expect that this is a numerical artifact due to our use of cross-voxel jump reactions to approximate diffusion (Isaacson, 2009).
Appendix 1—figure 1
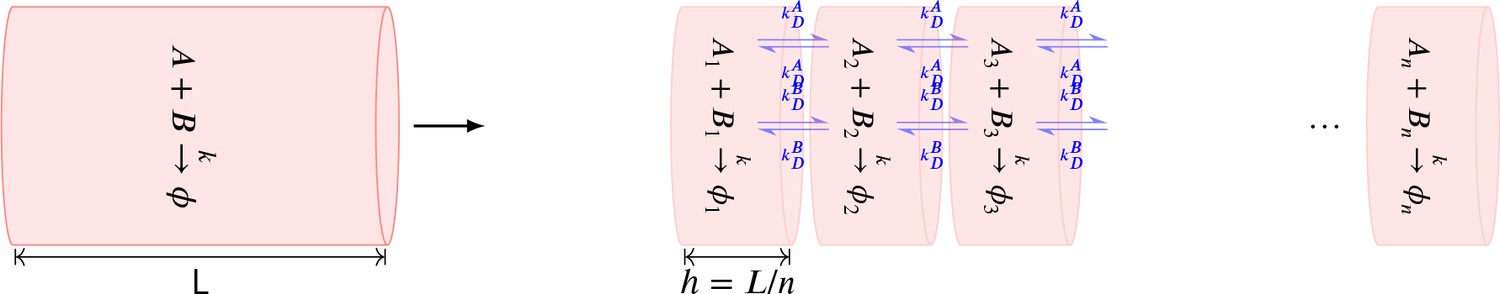
Summary of the stochastic reaction diffusion method employed.
https://doi.org/10.7554/eLife.41412.017
Appendix 1—figure 2
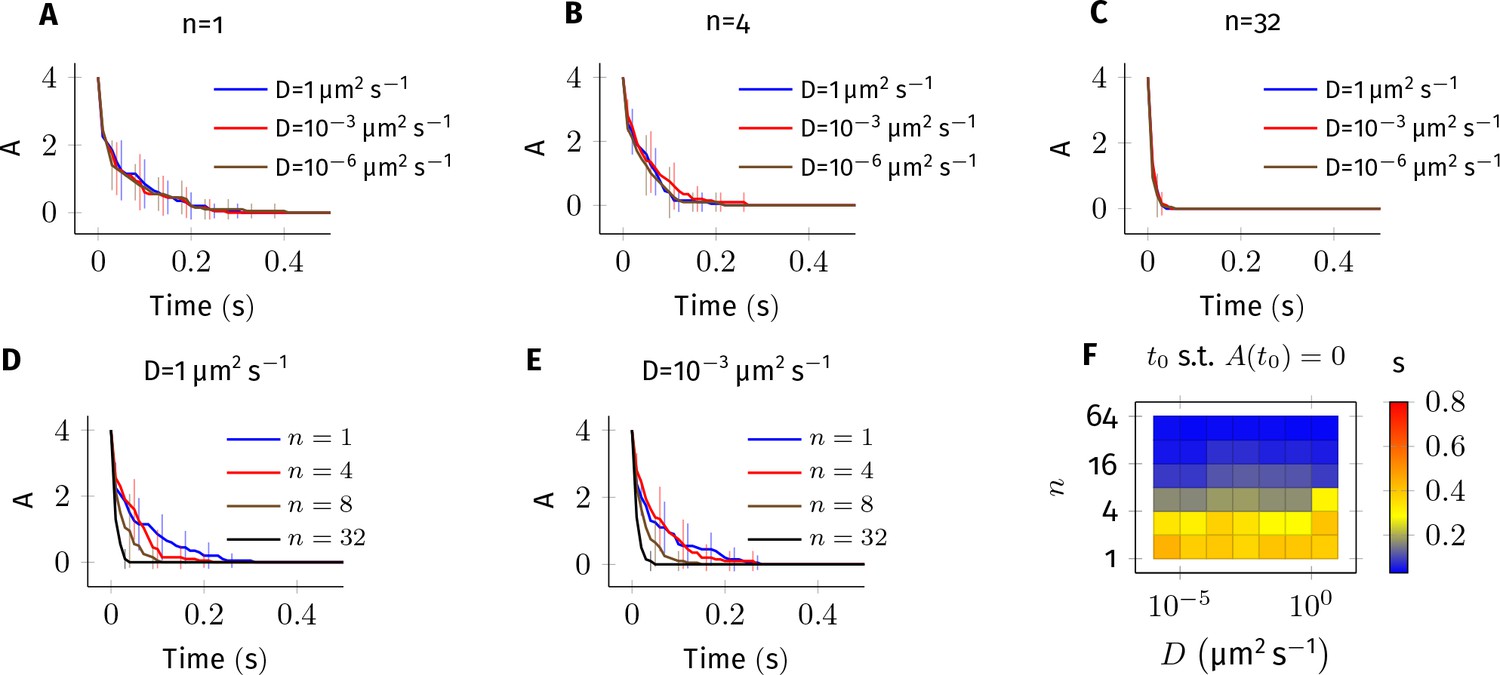
Error estimate for the bimolecular reaction where .
The values of parameters used in this system are similar to the reaction Equation 2 in main text. 4 molecules of A and B each were simulated in a cylindrical arena of length and radius . This arena was divided into equal subvolumes, each of length . Diffusion of A and B was implemented as described Equation 8 in where . (A–E) Average of 20 trajectories of A vs. time for different combinations of and . Error bars are standard-deviation. For fixed values of and non-zero values of , the kinetics are indistinguishable from each other (panels A, B and C). This suggests that the results described in Figure 4—figure supplement 1 are numerically correct. For fixed values of , however, changing has a large impact on the dynamics of A (panels D,E) especially when there is less than 1 molecule in each voxel (compare plots where n = 1,4 vs n = 8,16). In all simulations presented here, we maintained at least one diffusing molecule in every voxel. (F) Time for A to reach zero () vs. and .
Tables
Table 1
Diverse timescales of activity shown by CaMKII
https://doi.org/10.7554/eLife.41412.010| Type | Location | Timescale | Ref/Notes |
|---|---|---|---|
| Leaky integrator | Spine cytosol | ~10 s | Chang et al., 2017, This paper |
| Leaky integrator decaying slowly due to subunit exchange | Spine cytosol | ~100 s | This paper, Chang et al., 2017 |
| Small bistable (Size 4 to 10) | PSD | Few hours to days | This paper |
| Large bistable (Size 12 to 20) | PSD | Few weeks to months | This paper |
| Synchronized population of bistables coupled by subunit exchange | PSD | Years | This paper |
Table 2
Table of parameters used in model.
https://doi.org/10.7554/eLife.41412.014| Symbol | Parameter | Value | Reference/Notes |
|---|---|---|---|
| Vspine | Volume of Spine | 1 to 5×10-20 m3 | (Bartol et al., 2015) |
| VPSD | Volume of PSD (Thickness . Surface area 0.05µm2) | 1 to 5×10-21 m3 | Farley, 2015; Bartol et al., 2015 |
| NCaMKII | Total CaMKII holoenzymes in PSD/Spine | 100 ± 18 | Farley, 2015 |
| NPP1 | Total PP1 in PSD Total PP1 in Spine | 4 to 20× NCaMKII 10 to 100× NCaMKII | This paper This paper |
| I1 | Concentration of free I1 | 10 µM | Miller et al., 2005 |
| VCaN | Activity of calcineurin divided by its | 1 | Miller et al., 2005 |
| VCaM | Activity of PKA divided by its Michaelis constant | 1 s-1 | Miller et al., 2005 |
| KM | The Michaelis constant of PP1 | 10 µM | 0.4 to 20 µM (Zhabotinsky, 2000) |
| KH1 | Hill constant of CaMKII (Ca2+ ) activation) | 0.7 µM | (De Koninck and Schulman, 1998) |
| nH1 | Hill constant of CaMKII (Ca2+ ) activation) | 3 | (Stemmer and Klee, 1994) |
| KH2 | Hill constant of CaMKII (Ca2+ ) activation) | 0.3 µM | (Stemmer and Klee, 1994) |
| nH2 | Hill constant of CaMKII (Ca2+ ) activation) | 3 | (Stemmer and Klee, 1994) |
| k1 | The catalytic constant of autophospho-rylation | 1.5 s-1 | (Hanson et al., 1994) |
| k2 | The catalytic constant of autophospho-rylation | 1 s-1 | (Bradshaw et al., 2003; Ichikawa et al., 1996) |
| k3 | The association rate constant of PP1.I1P complex | 100 µM-1s-1 | (Endo et al., 1996; Miller et al., 2005) |
| k4 | The dissociation rate constant of PP1.I1P complex | 0.1 s-1 | (Endo et al., 1996; Miller et al., 2005) |
| The rate of adding unphosphorylated subunit x | 1 s-1 per NCaMKII | This paper | |
| The rate of adding phosphorylated sub- unit y | 1 s-1 per NCaMKII | This paper | |
| The rate of losing unphosphorylated subunit x | 0.1 s-1 | This paper | |
| The rate of losing phosphorylated sub- unit y | 0.1 s-1 | This paper | |
| vt | Turnover rate of CaMKII | 30 h-1 | (Ehlers, 2003; Miller et al., 2005) |
| DPP1 | Diffusion coefficient of PP1 | 0.5 µm2 s−1 | This paper and (Harvey et al., 2008) |
| Dsub | Diffusion coefficient of CaMKII subunits | 10-5 – 10µm2 s−1 | This paper |
Additional files
-
Transparent reporting form
- https://doi.org/10.7554/eLife.41412.015
Download links
A two-part list of links to download the article, or parts of the article, in various formats.
Downloads (link to download the article as PDF)
Open citations (links to open the citations from this article in various online reference manager services)
Cite this article (links to download the citations from this article in formats compatible with various reference manager tools)
Subunit exchange enhances information retention by CaMKII in dendritic spines
eLife 7:e41412.
https://doi.org/10.7554/eLife.41412


