In vivo imaging of β-cell function reveals glucose-mediated heterogeneity of β-cell functional development
- Peking University, China
- Institute of Basic Medical Sciences, China
- South China Normal University, China
Figures
Figure 1 with 4 supplements
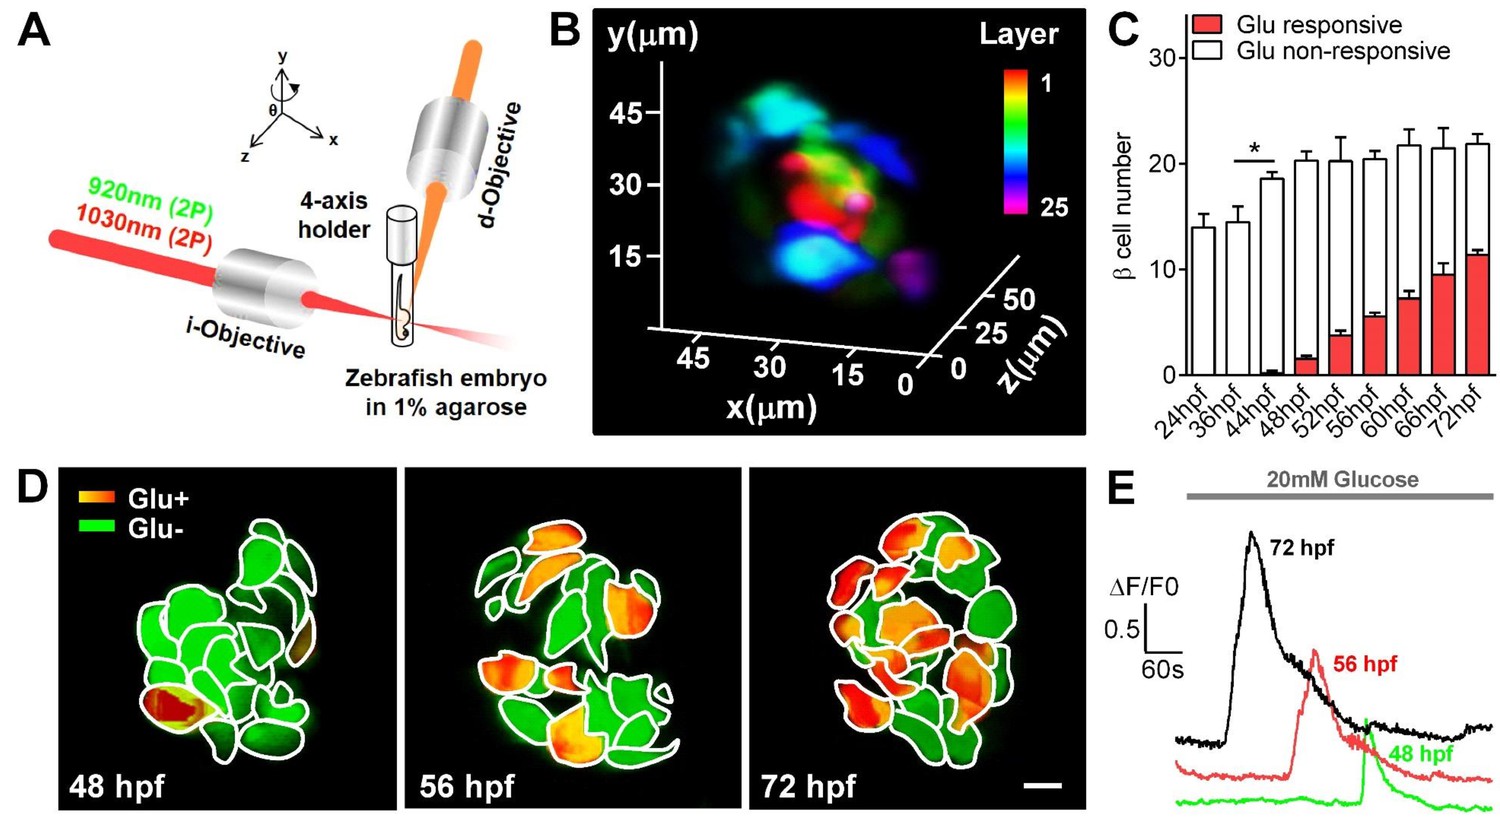
Visualization and characterization of β-cell functional development in vivo using 2P3A-DSLM.
(A) An abbreviated scheme of the dual-color 2P3A-DSLM imaging system. (B) 3D-projection of all pancreatic β-cells in a live Tg (ins:Rcamp1.07) zebrafish embryo at 72 hpf. The different colors in the color bar represent different depths in the islet. (C) Quantification of glucose-responsive and glucose-nonresponsive β-cells at different stages from 24 to 72 hpf in live Tg (ins:Rcamp1.07);Tg (ins:EGFP) embryos. n = 10–16 embryos per stage. *p<0.05. (D) An illustration of the glucose-responsive (red) and glucose-nonresponsive (green) β-cells in islets in live Tg (ins:Rcamp1.07) embryos at 48, 56 and 72 hpf. (E) Representative traces of glucose-triggered maximum Ca2+ transients at the indicated stages. Scale bar: 10 μm. See also Figure 1—figure supplements 1–4 and Videos 1–3.
Figure 1—figure supplement 1
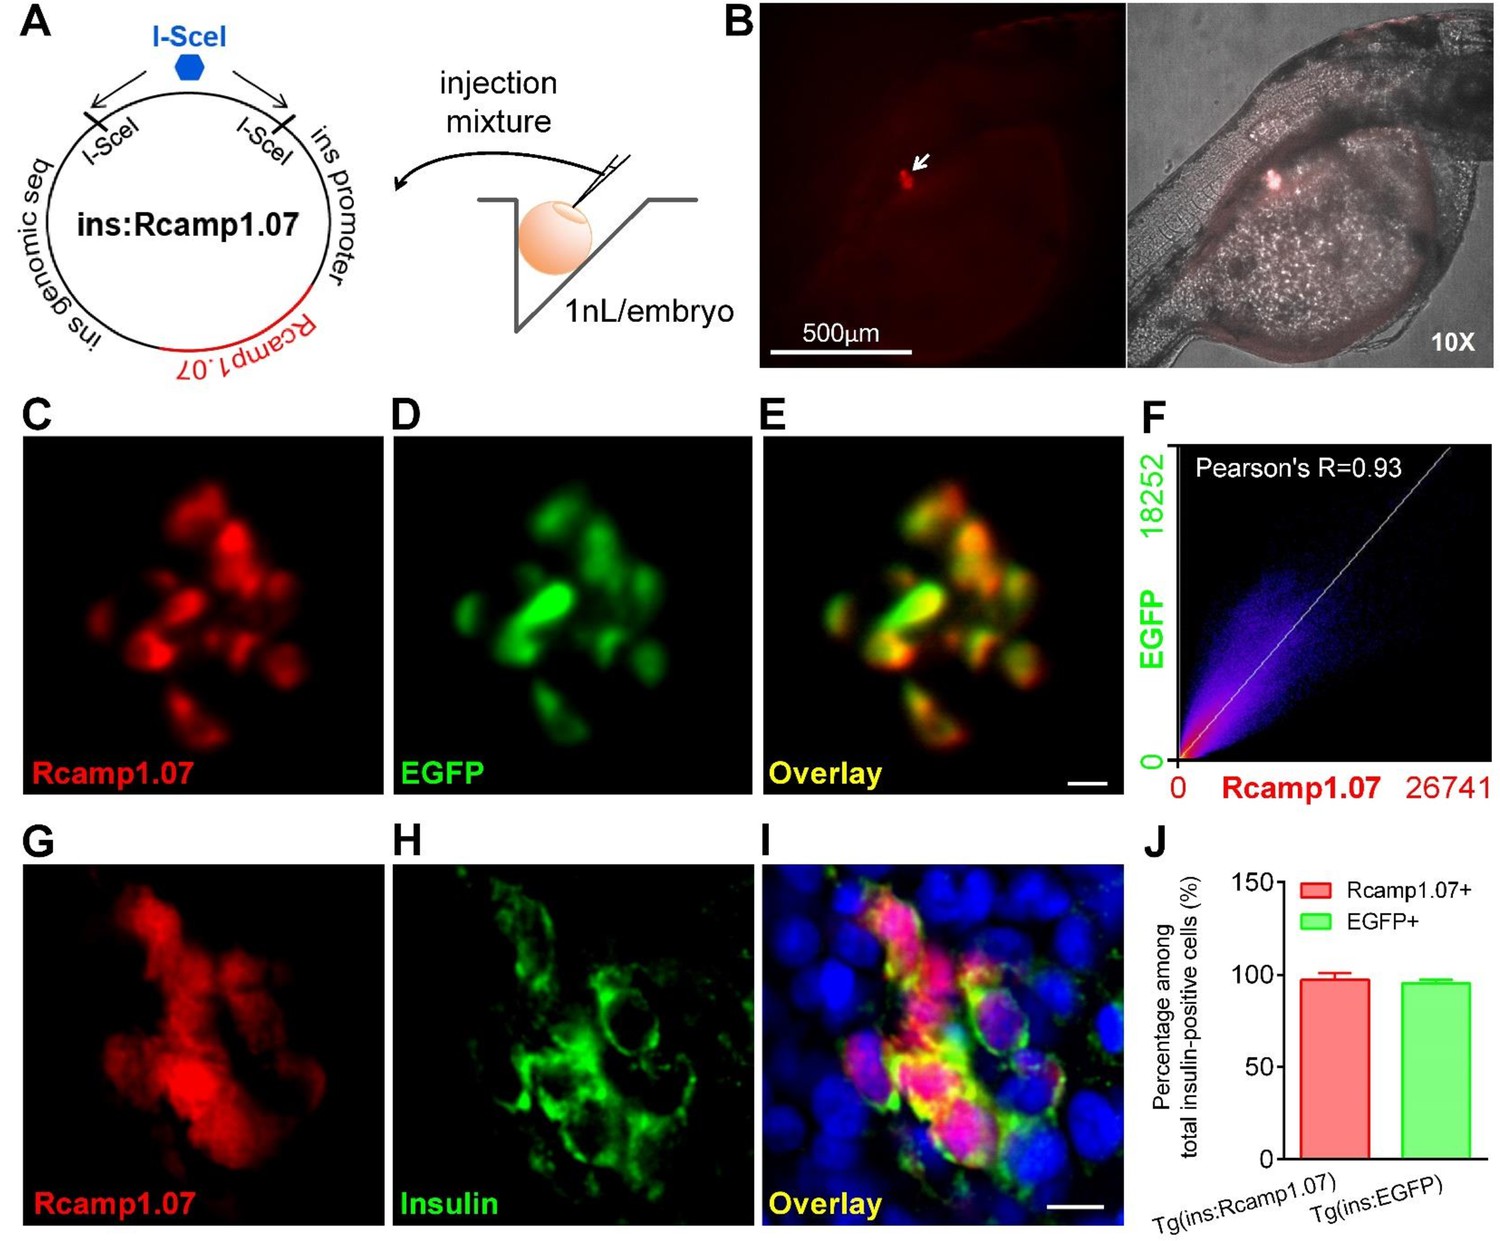
Rcamp1.07 was specifically expressed in pancreatic β-cells in Tg (ins:Rcamp1.07) zebrafish.
(A) An illustration showing the protocol for generating the Tg (ins:Rcamp1.07) zebrafish line. (B) Rcamp1.07 fluorescent signals were specifically localized in the islet region in Tg (ins:Rcamp1.07) zebrafish under a fluorescence stereomicroscope. (C–E) Representative dual-color 2P3A-DSLM images of Rcamp1.07 (C), EGFP (D) and the merged image (E) of the islet β-cells in a live Tg (ins:Rcamp1.07);Tg (ins:EGFP) embryo at 72 hpf. (F) Co-localization of Rcamp1.07 and EGFP was analyzed using Mander’s intensity correlation (Fiji), and Pearson’s R value was 0.93. (G–I) Representative confocal images of immunofluorescent staining for Rcamp1.07 (G), insulin (H) and DAPI (blue) in the merged image (I) of the islet cells in Tg (ins:Rcamp1.07) embryos at 72 hpf. (J) Percentages of Rcamp1.07-positive and EGFP-positive cells among total insulin-positive cells in Tg (ins:Rcamp1.07) and Tg (ins:EGFP) embryos. n = 8 embryos per condition. Scale bars: 10 μm; scale bars apply to C–E and G–I.
Figure 1—figure supplement 2
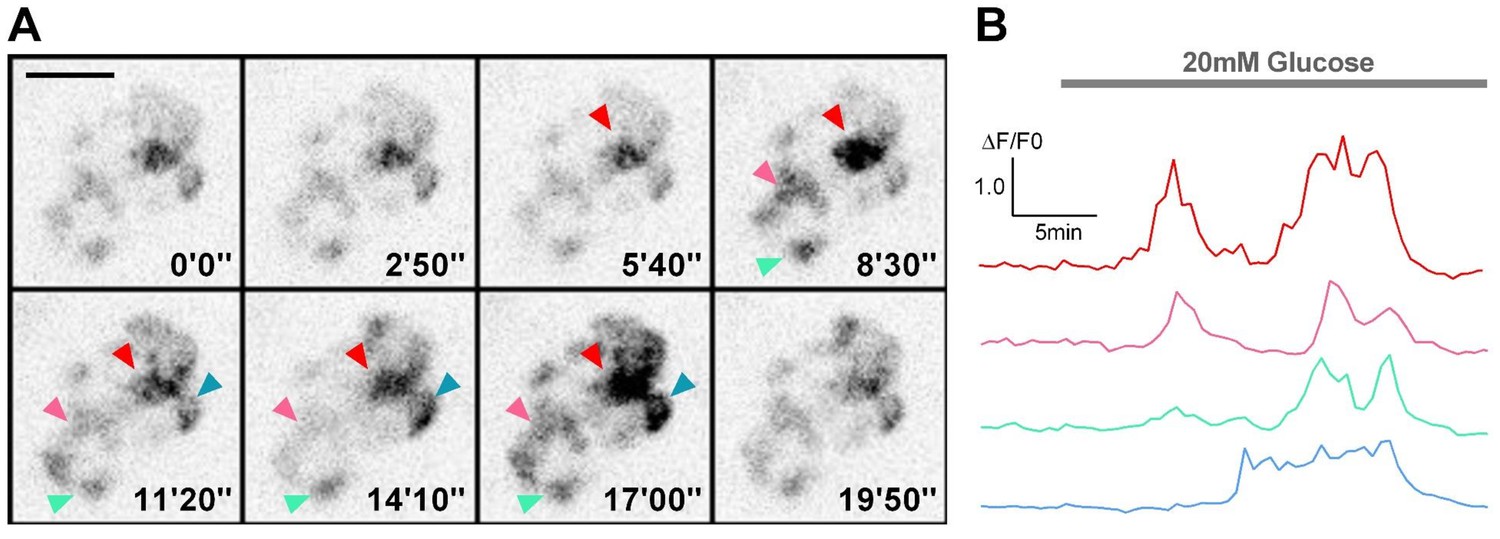
Visualization of glucose-stimulated calcium transients in β-cells in live Tg (ins:Rcamp1.07) embryos under a spinning-disc confocal microscope.
(A) Representative images of Rcamp1.07-indicated calcium transients in β-cells in a live Tg (ins:Rcamp1.07) embryo at 72 hpf before and after 20 mM glucose stimulation. At the 5 min time point, 20 mM glucose was added. Arrowheads indicate four representative regions within the islet. (B) Time courses of the calcium transients in the regions marked in (A). Scale bars: 20 μm.
Figure 1—figure supplement 3
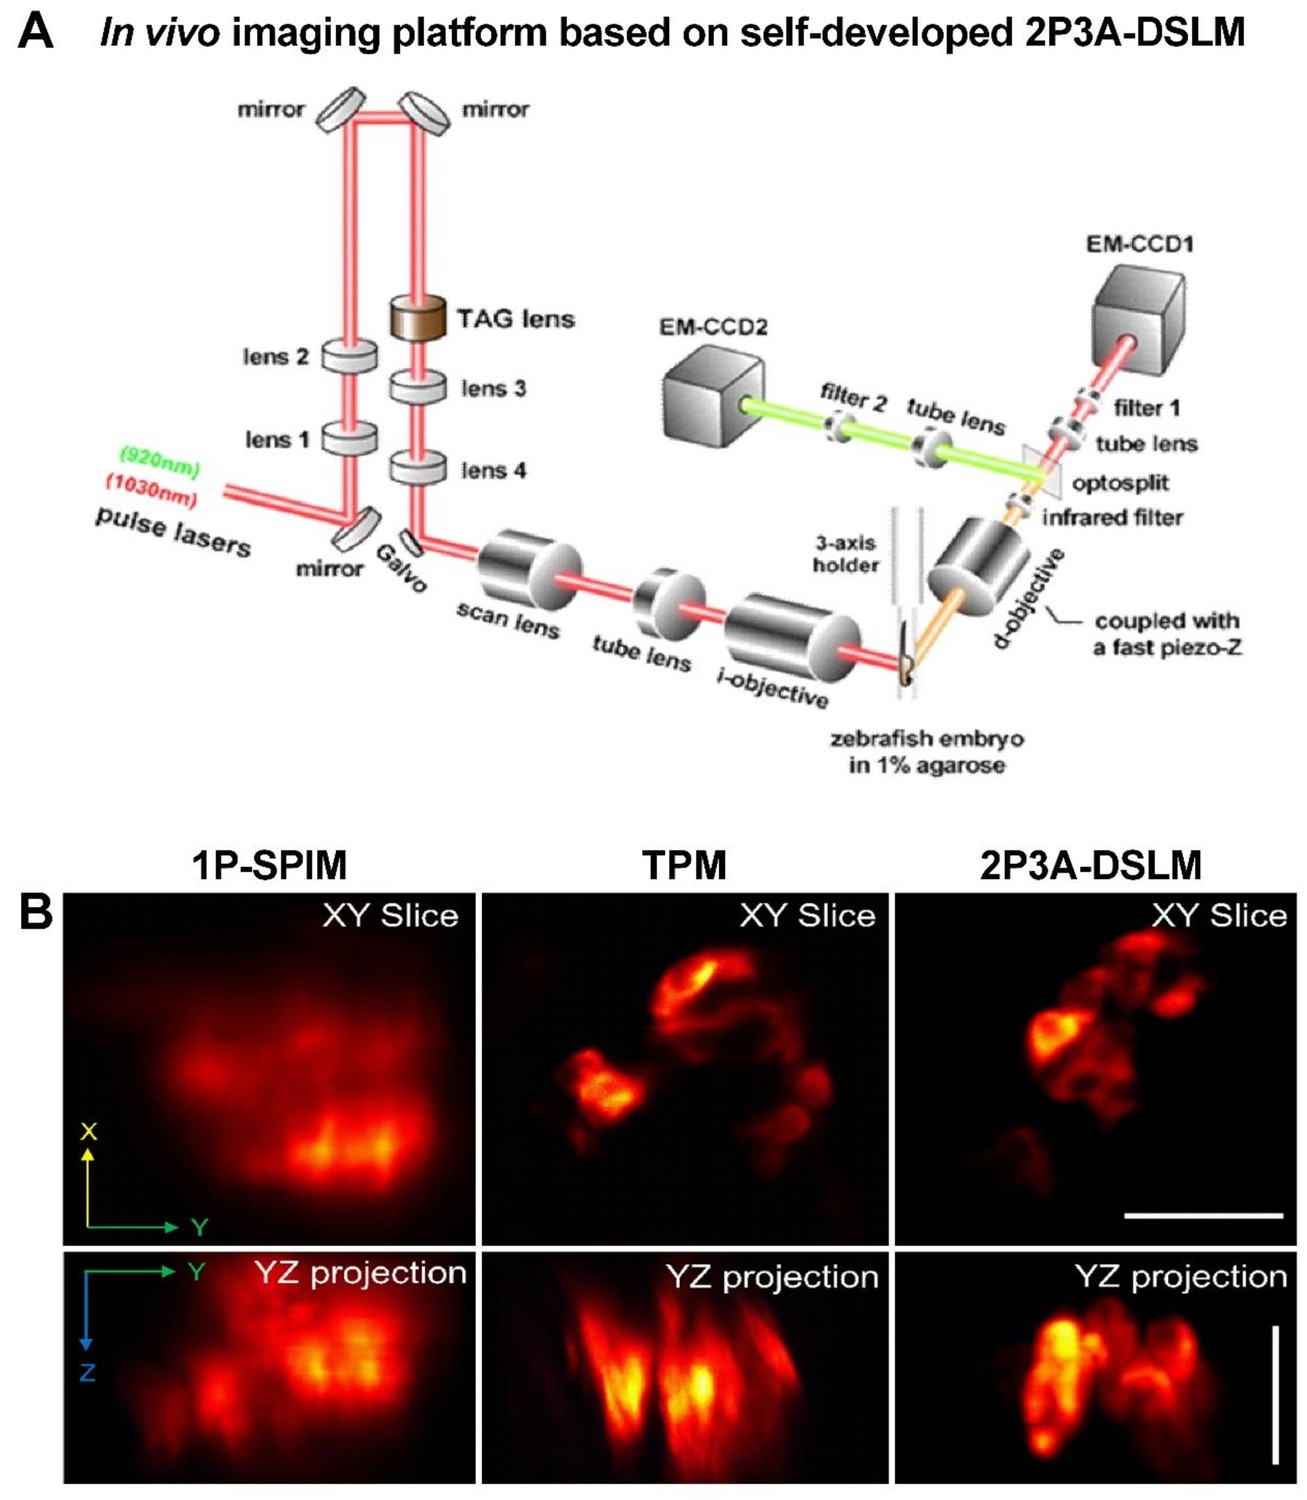
Reconstruction of a clear 3D structure of the islet in live zebrafish embryos with our 2P3A-DSLM setup.
(A) A detailed scheme of the in vivo imaging platform based on our self-developed dual-color 2P3A-DSLM. (B) Comparison of image qualities among single-photon selective-plane illuminative microscope (1P-SPIM), two-photon microscope (TPM) and 2P3A-DSLM. Scale bars: 20 μm. See also Video 1.
Figure 1—figure supplement 4
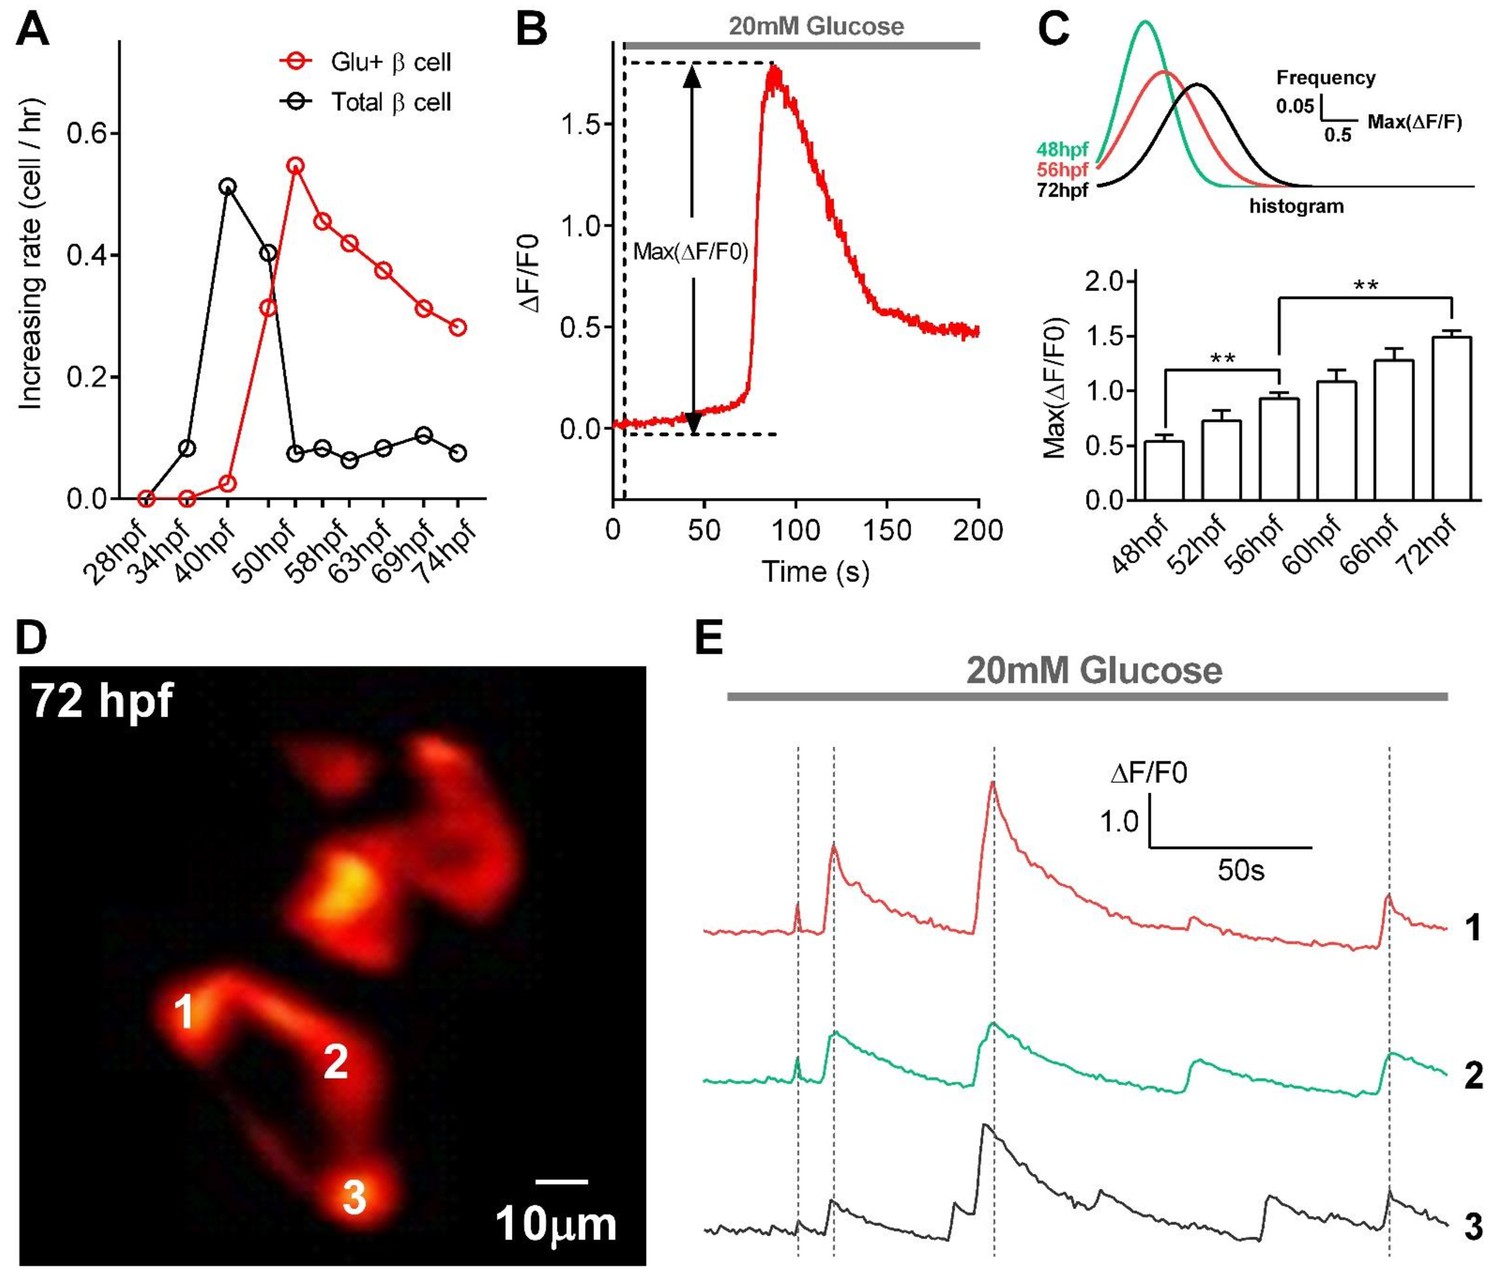
Quantification of glucose-responsive β-cells, evaluation of their functional states, and observation of glucose-induced synchronized calcium transients in β-cells in live Tg (ins:Rcamp1.07) embryos under 2P3A-DSLM.
(A) Increases in the numbers of total β-cells and glucose-responsive β-cells at different stages from 28 to 74 hpf. n = 10–16 embryos per stage. (B) An illustration of the maximum amplitude (Max ΔF/F0), a parameter describing the kinetics of glucose-stimulated Ca2+ transients. (C) The maximum amplitudes of Ca2+ transients in glucose-responsive β-cells from 48 to 72 hpf. The top inset shows histograms of the maximal amplitudes of Ca2+ transients from β-cells in 48 hpf, 56 hpf and 72 hpf zebrafish by Gaussian fitting. n = 10–16 embryos per stage. **p<0.01. (D) Representative images of Rcamp1.07 in β-cells in a live Tg (ins:Rcamp1.07) embryo at 72 hpf after 20 mM glucose stimulation. Numbers indicate three neighboring β-cells with synchronized calcium transients. (E) Time courses of glucose-induced synchronized calcium transients in the β-cells marked in (D). See also Video 2.
Figure 2 with 3 supplements
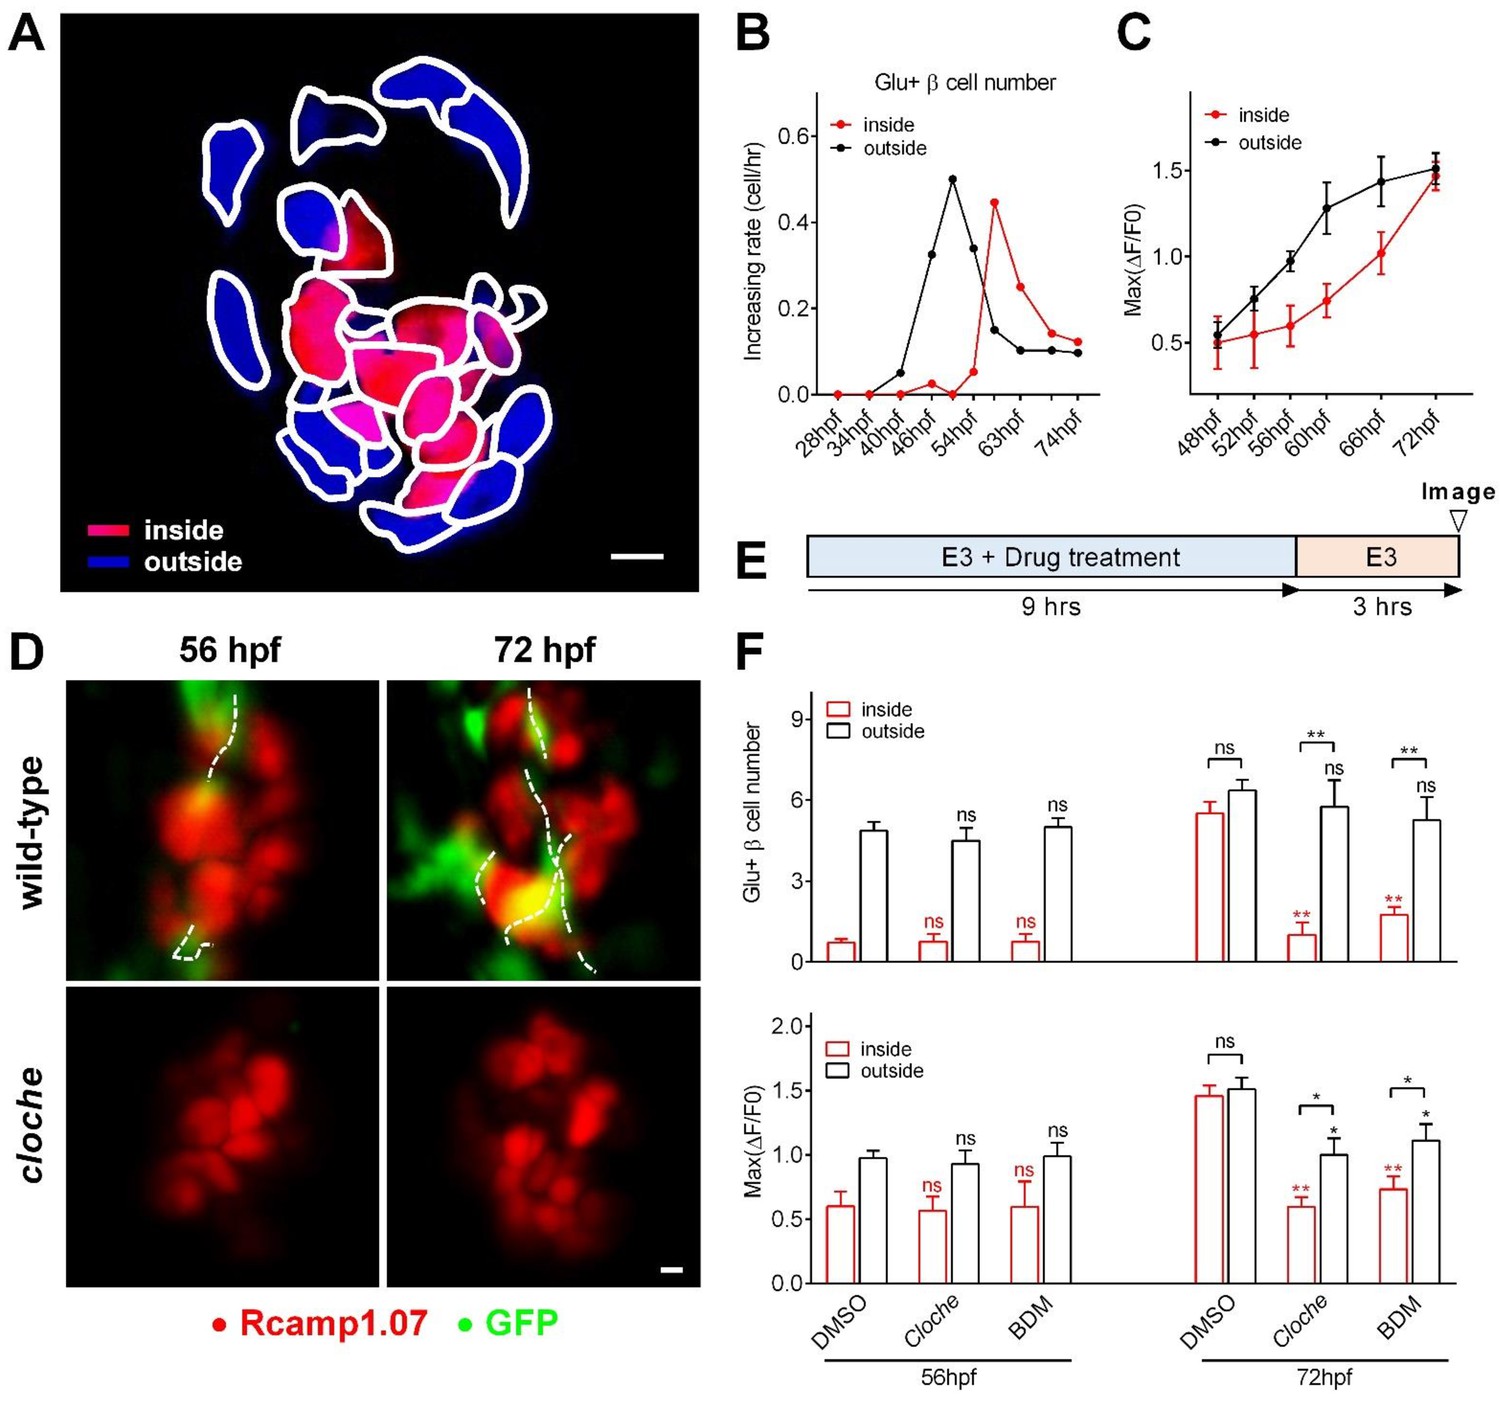
Sequential functional acquisition of β-cells from the mantle to the core of the islet was coordinated by islet microcirculation.
(A) A schematic illustrating the classification of β-cells into two populations: the cells in the outside (mantle, blue) and the cells in the inside (core, red) of the islet. (B) Time-dependent increases in the number of glucose-responsive β-cells in the mantle (dark) and core (red) of the islet. n = 12–16 embryos per stage. (C) Time-dependent increases in the maximum amplitude of the glucose-triggered Ca2+ transients in β-cells from the mantle and the core of the islet. n = 12–16 embryos per stage. (D) Representative 3D-projections of the β-cells (red) and blood vessels (green) in live wild type or cloche-/- Tg (ins:Rcamp1.07);Tg (flk1:GFP) embryos. (E) The experimental design for 2,3-BDM treatment used in (F). (F) The number of glucose-responsive β-cells (top) and their maximal Ca2+ responses to glucose (bottom) in the mantle and the core of the islets in cloche-/- mutants and 2,3-BDM-treated embryos. n = 4–6 embryos per stage. *p<0.05, **p<0.01; ns, not significant. Scale bars: 10 μm; scale bars apply to (A) and (D). See also Figure 2—figure supplements 1–3 and Video 4.
Figure 2—figure supplement 1
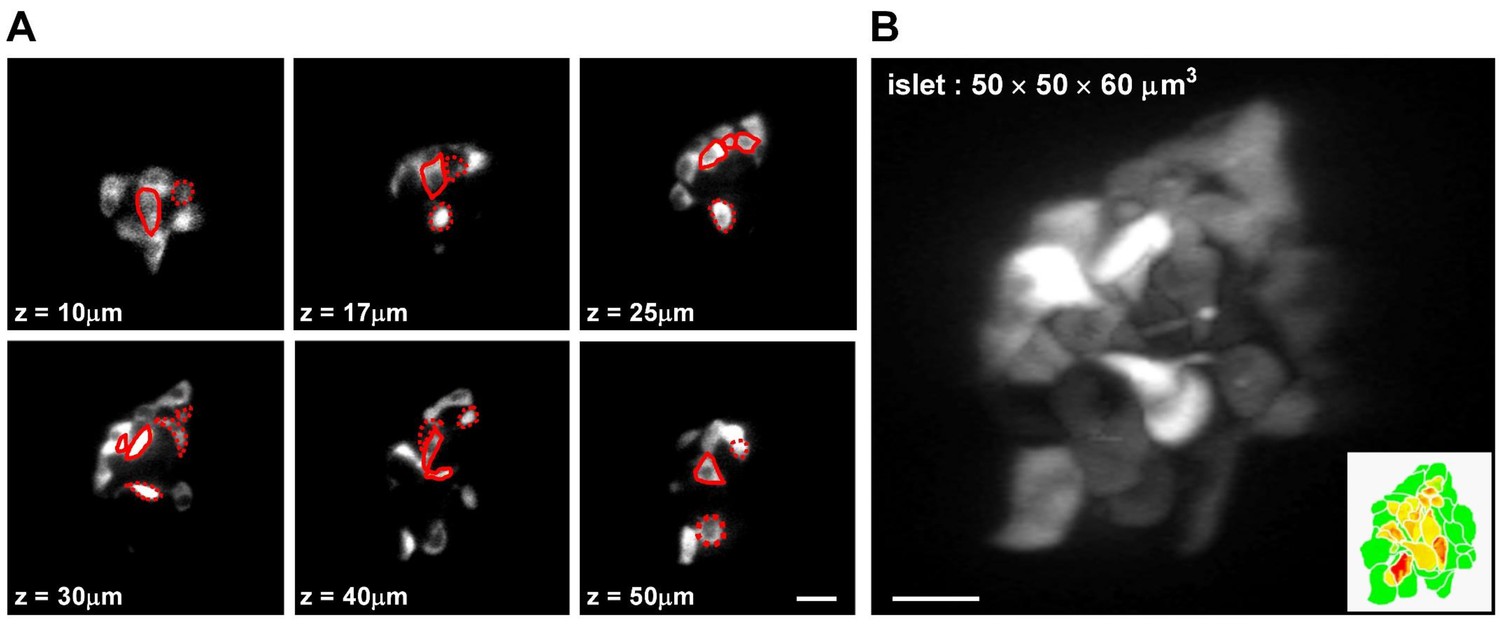
Categorization of β-cells based on their mantle/core localization in the islet.
(A) Representative z-stack images of β-cells in a live Tg (ins:Rcamp1.07) zebrafish embryo at 72 hpf. Red solid circles mark β-cells in the islet core determined in the current focal plane; red dotted circles mark β-cells in the islet core determined in other focal planes. (B) 3D-projection of the islet showed in (A). The inset describes an illustration of β-cells in the mantle (green) and β-cells in the core (yellow to red) of the islet. Scale bars: 10 μm; scale bars apply to (A–B).
Figure 2—figure supplement 2
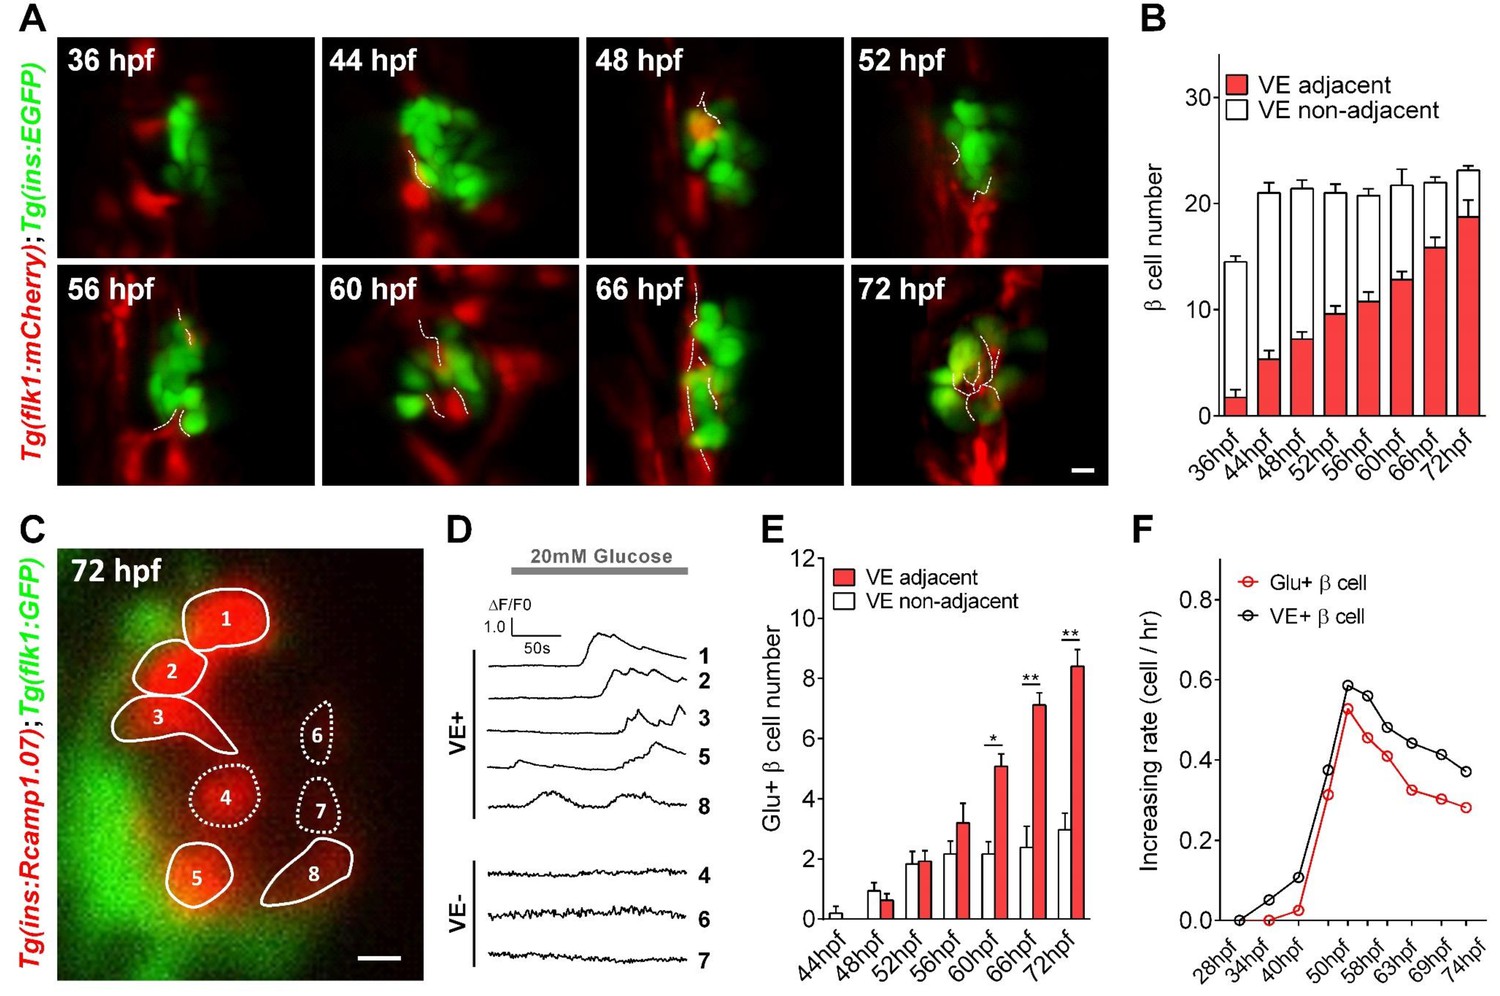
Islet vascularization did not affect the total β-cell number but correlated with the sequential acquisition of glucose-responsiveness of β-cells.
(A) Representative 3D-projections of β-cells (green) and blood vessels (red) at different stages in live Tg (ins:EGFP);Tg (flk1:mCherry) embryos. (B) Quantification of pancreatic β-cells located adjacent or non-adjacent to blood vessel (VE) cells from 36 to 72 hpf. n = 6–8 embryos per condition. (C) Representative image of Rcamp1.07-positive β cells, in which VE-adjacent (VE+) β-cells were outlined with solid lines and VE-non-adjacent (VE-) β-cells were outlined with dotted lines, in a live Tg (ins:Rcamp1.07);Tg (flk1:GFP) embryo. (D) Time courses of glucose-stimulated calcium transients from β-cells indicated in (C). (E) Quantification of glucose-responsive β-cells located adjacent or non-adjacent to VE cells from 44 to 72 hpf. n = 4–7 embryos per condition. *p<0.05, **p<0.01. (F) Comparison of the increasing number of β-cells located adjacent to the blood vessel with glucose-responsive β-cells at different stages from 28 to 74 hpf. n = 4–7 embryos per stage. Scale bars: 10 μm; scale bars apply to (A) and (C). See also Video 4.
Figure 2—figure supplement 3
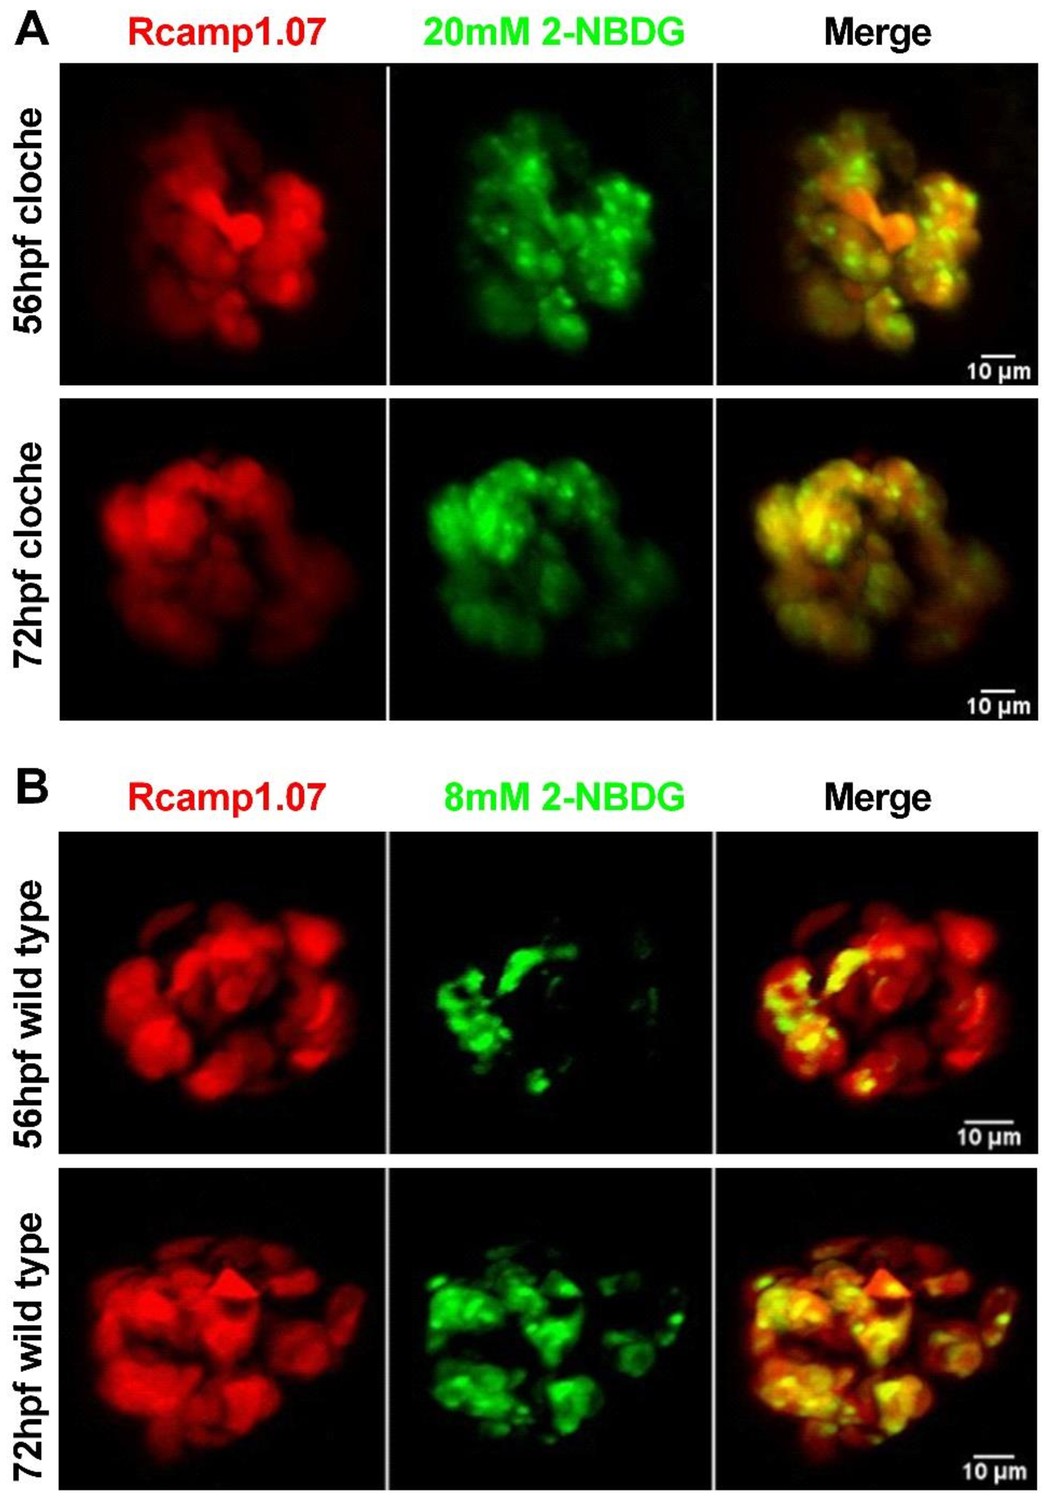
Absence of intra-islet circulation caused inefficient delivery of a low concentration of glucose to β-cells in the islet core, whereas either a high concentration of glucose or the complete establishment of islet circulation overcame this deficiency.
(A) Representative images of Rcamp1.07 (red) and 2-NBDG (green) signals in β-cells in live Tg (ins:Rcamp1.07);cloche-/- mutants at 56 hpf (top panel) and 72 hpf (bottom panel) after incubation with 20 mM 2-NBDG for 5 min. (B) Representative 3D-projection images of Rcamp1.07 (red) and 2-NBDG (green) signals in β-cells in live Tg (ins:Rcamp1.07) embryos at 56 hpf (top panel) and 72 hpf (bottom panel) after incubation with 8 mM 2-NBDG for 1 hr.
Figure 3
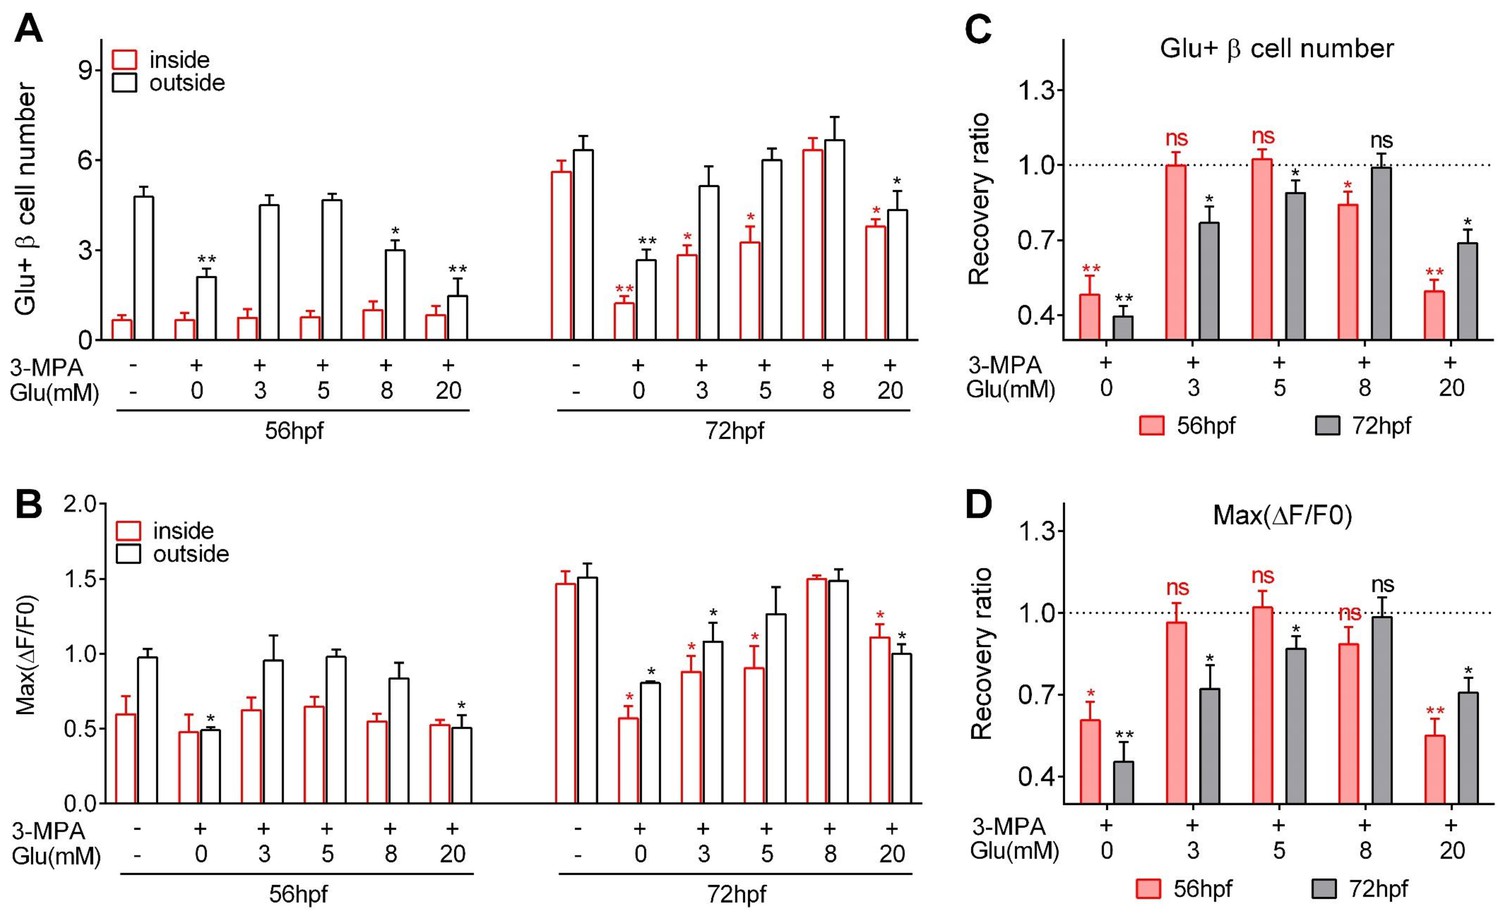
Optimal glucose concentrations were required to induce heterogeneous and optimal β-cell functionality at different developmental stages.
(A–B) Numbers of glucose-responsive β-cells (A) and their maximal Ca2+ responses to glucose (B) in the mantle and the core of the islets from embryos treated with 3 MPA and different concentrations of glucose. n = 4–8 embryos per condition in (A) and (B). *p<0.05, **p<0.01. (C–D) Recovery ratios of glucose-responsive β-cells (C) and their maximal Ca2+ responses to glucose (D) following treatment with different concentrations of exogenous glucose in the presence of 3 MPA to inhibit endogenous glucose production. The ratios are presented as the normalized numbers of glucose-responsive β-cells or the normalized maximal amplitudes of the calcium transients compared with those in the control embryos. n = 4–8 embryos per condition in (C) and (D). *p<0.05, **p<0.01; ns, not significant. See also Video 5.
Figure 4 with 2 supplements
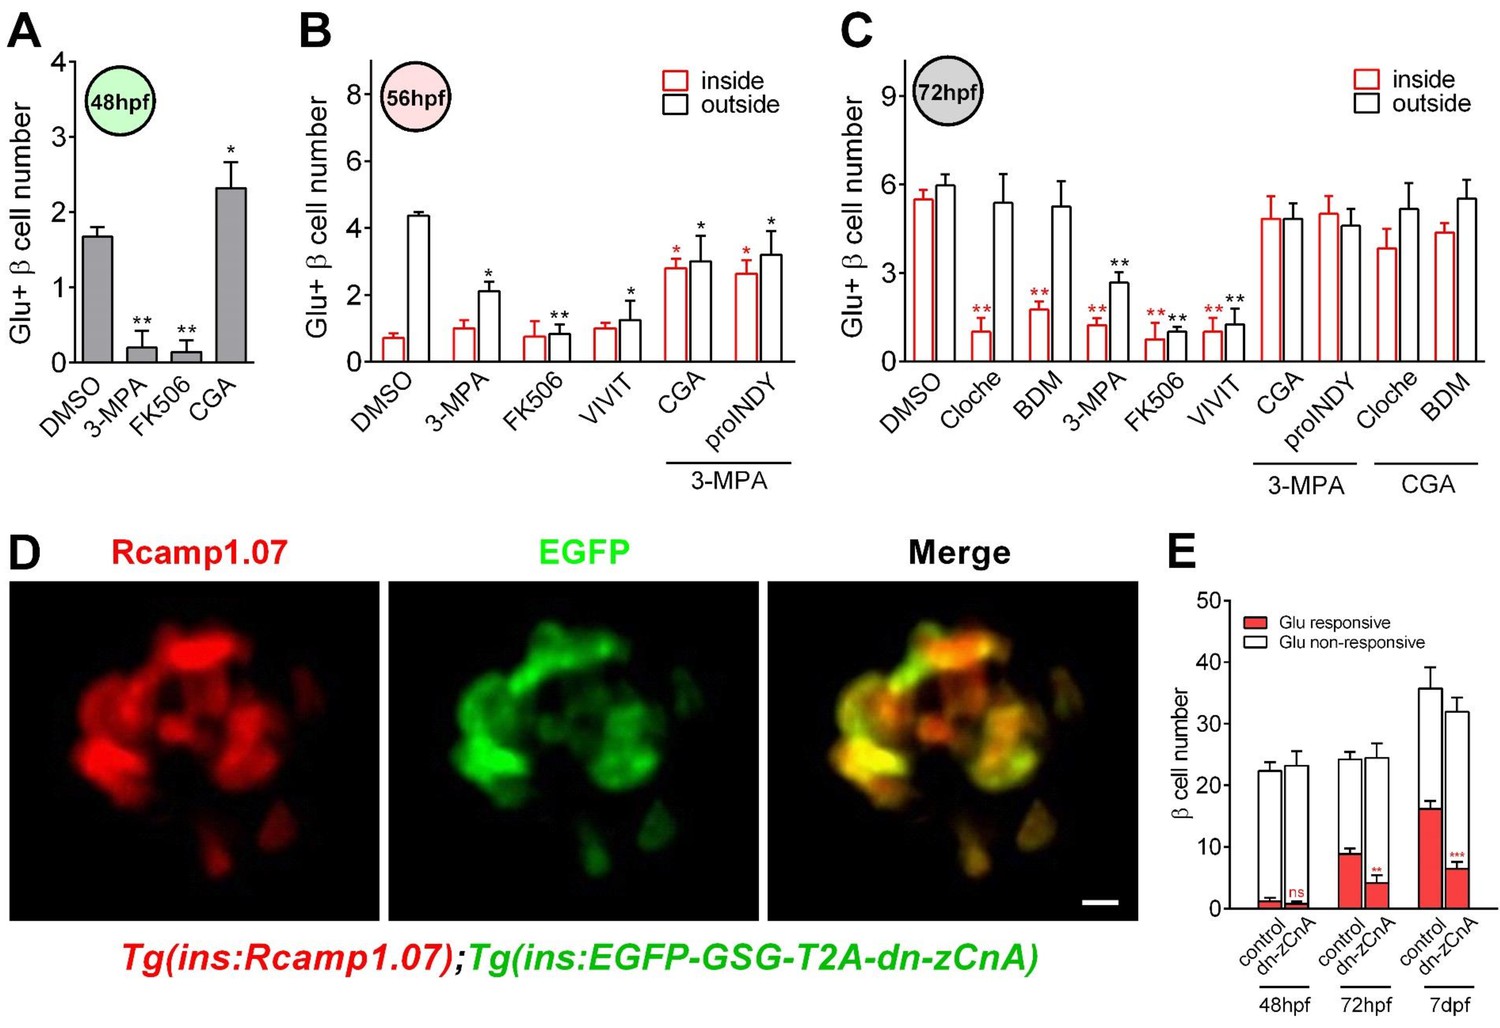
Calcineurin/NFAT signaling acted as the downstream of glucose to initiate and enhance β-cell functionality.
(A) Numbers of glucose-responsive β-cells in 48 hpf embryos that had been treated with the indicated reagents. n = 4–8 embryos per condition. *p<0.05, **p<0.01. (B) Numbers of glucose-responsive β-cells in the mantle and the core of the islet in 56 hpf embryos that had been treated with the indicated reagents. n = 5–9 embryos per condition. *p<0.05, **p<0.01. (C) Numbers of glucose-responsive β-cells in the mantle and the core of the islet in 72 hpf embryos that had been treated with the indicated reagents. n = 5–9 embryos per condition. **p<0.01. (D) Representative two-photon images of Rcamp1.07 (left), EGFP (middle) and the merged image (right) of the islet cells in a living Tg (ins:Rcamp1.07);Tg (ins:EGFP-GSG-T2A-dn-zCnA) embryo. (E) Numbers of glucose-responsive β-cells in age-matched controls and dn-zCnA-expressing embryos at 48 hpf, 72 hpf and seven dpf. n = 4–6 embryos per stage. **p<0.01, ***p<0.001; ns, not significant. Scale bar: 10 μm. See also Figure 4—figure supplements 1–2 and Videos 5–6.
Figure 4—figure supplement 1
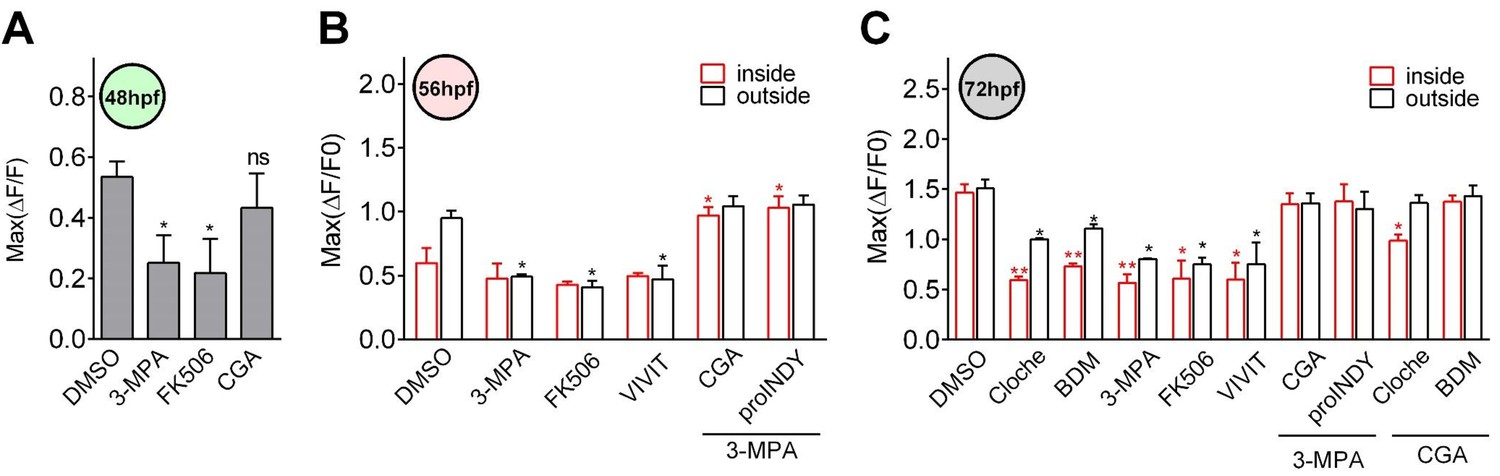
Glucose activated calcineurin/NFAT to enhance and sustain the functionality of β-cells during the late hatching period.
(A) The maximum amplitudes of glucose-responsive β-cells in 48 hpf embryos that had been treated with the indicated reagents. n = 4–8 embryos per condition. *p<0.05; ns, not significant. (B) The maximum amplitudes of glucose-responsive β-cells in the mantle and the core of the islet in 56 hpf embryos that had been treated with the indicated reagents. n = 5–9 embryos per condition. *p<0.05. (C) The maximum amplitudes of glucose-responsive β-cells in the mantle and the core of the islet in 72 hpf embryos that had been treated with the indicated reagents. n = 5–9 embryos per condition. *p<0.05, **p<0.01.
Figure 4—figure supplement 2
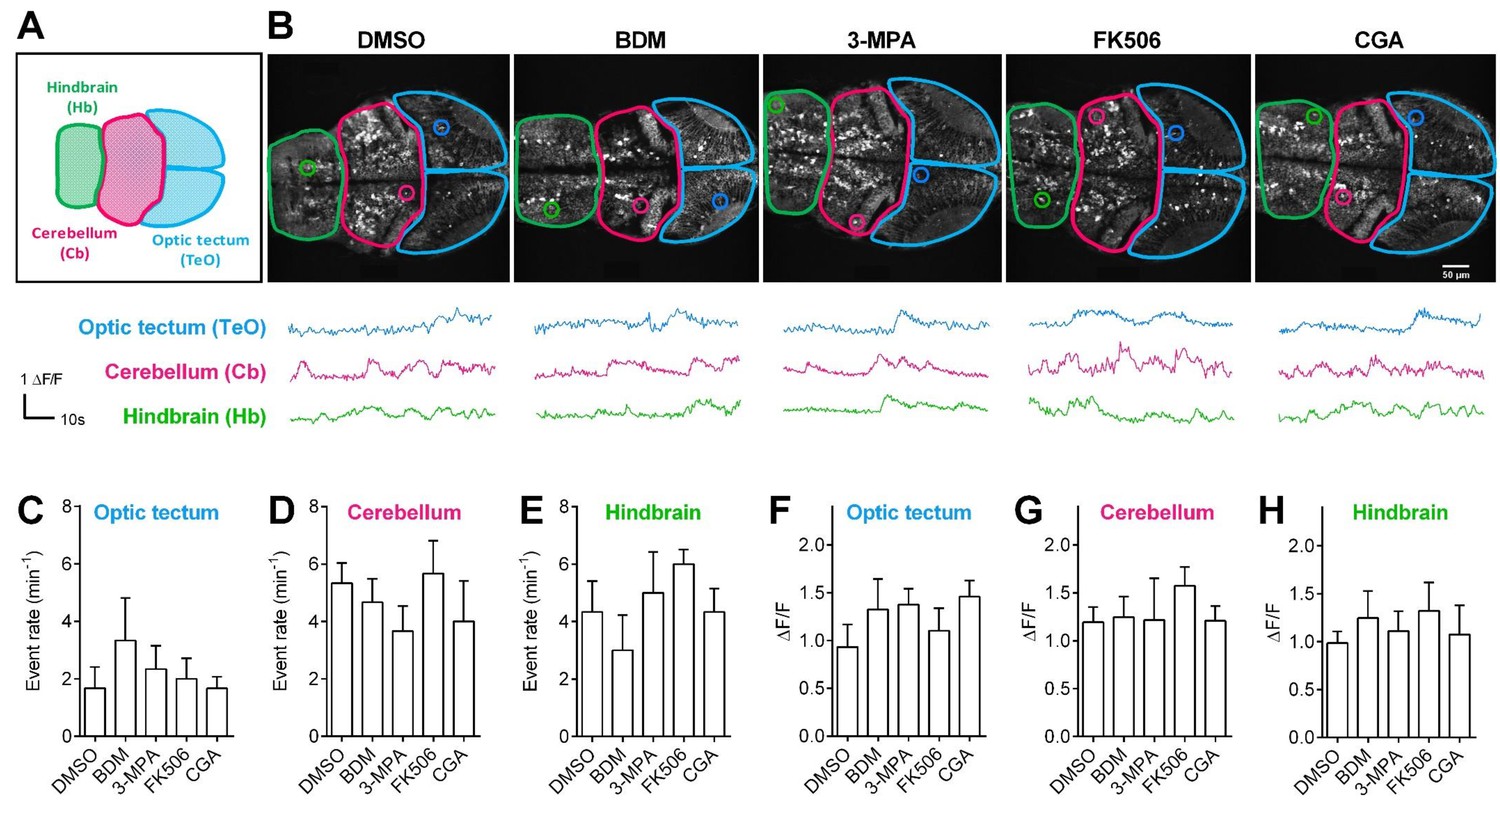
Pharmacological treatments did not affect calcium activities of CNS neurons in living Tg (elavl3:Gcamp6s) zebrafish embryos.
(A) The schematic illustrates three different brain regions in zebrafish embryos. (B) Representative 72 hpf Tg (elavl3:Gcamp6s) embryos (top) and time courses of calcium transients (bottom) from individual neurons in living embryos that had been treated with the indicated pharmacological reagents. (C–E) Quantification of event rate of calcium transients from neurons in living 72 hpf Tg (elavl3:Gcamp6s) embryos that had been treated with the indicated pharmacological reagents used in this study. 10–20 neurons were randomly selected in the indicated three brain regions from three embryos per condition. (F–H) Average amplitudes of calcium transients from neurons in living 72 hpf Tg (elavl3:Gcamp6s) embryos that had been treated with the indicated pharmacological reagents used in this study. 10–20 neurons were randomly selected in the indicated three brain regions from three embryos per condition.
Figure 5 with 1 supplement
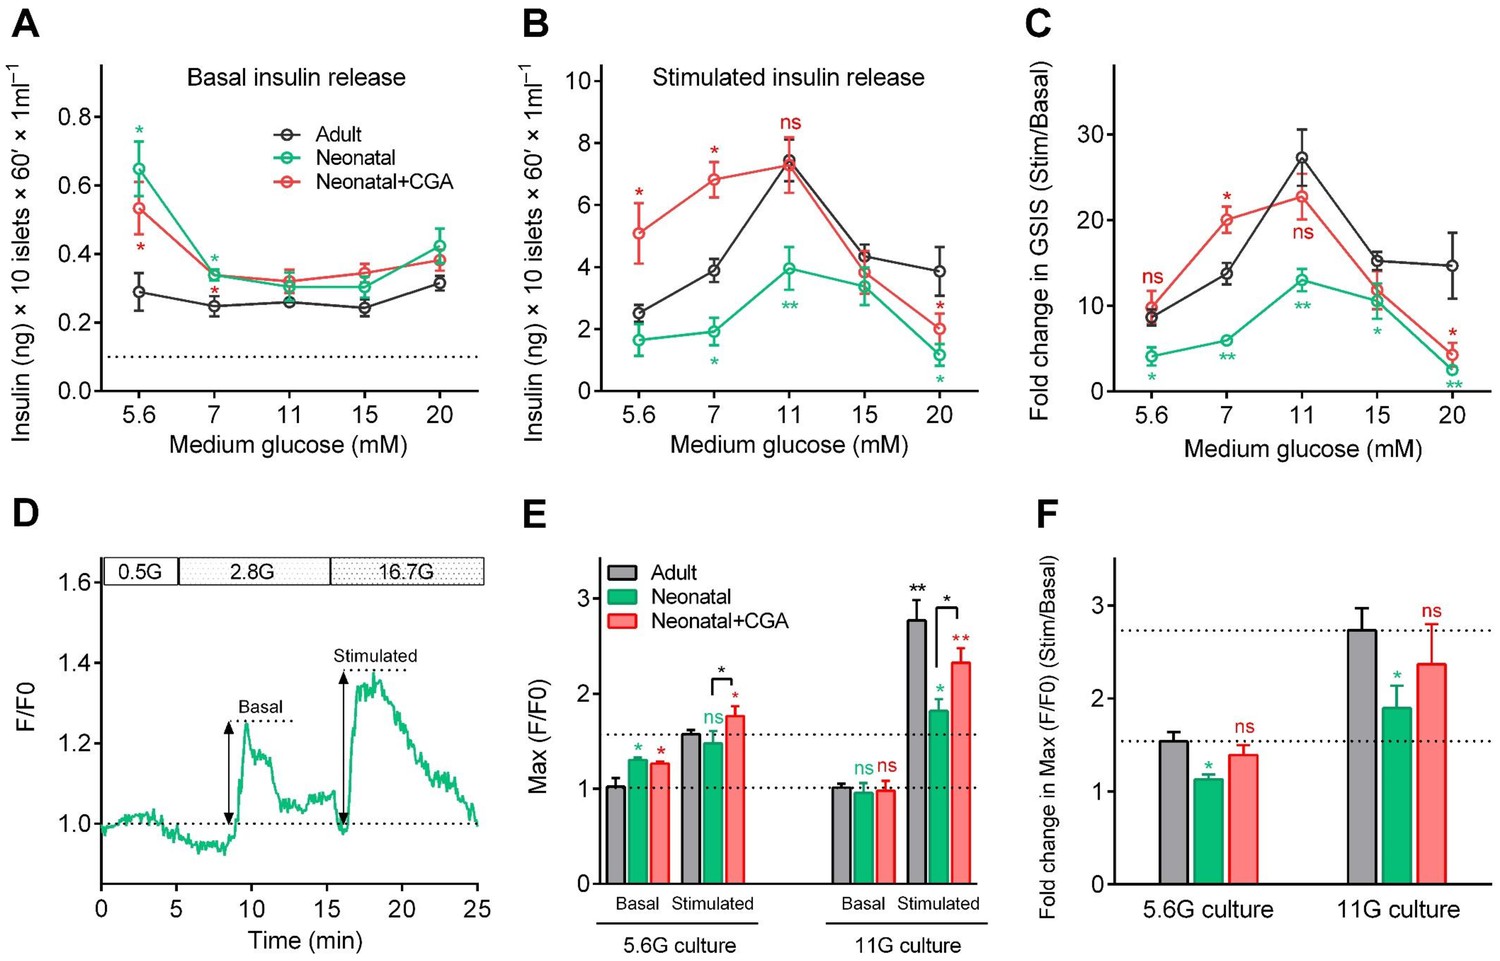
Direct activation of calcineurin promoted the optimal maturity of neonatal mouse β-cells in isolated islets in vitro.
(A–B) Glucose-induced insulin secretion from neonatal and adult mouse islets sequentially stimulated with 3 mM glucose (A) and 20 mM glucose (B) after isolation from P0 and 8-week-old mice, and for 3 days of culture in different types of media (different concentrations of glucose combined with or without CGA) in vitro. The black dotted line in A indicates the value of the ELISA kit detection limit. n = 4–10 experiments per condition. *p<0.05, **p<0.01; ns, not significant. (C) Glucose Stimulation Index (fold change in GSIS) of the mouse islets described in (A) and B). n = 4–10 experiments per condition. *p<0.05, **p<0.01; ns, not significant. (D) An illustration of the maximum amplitude of calcium influx in islets under 2.8 mM and 16.7 mM glucose stimulation. (E) Quantification of maximal amplitude of glucose-induced calcium influx in islets under different culture conditions. n = 4–7 islets per condition. *p<0.05, **p<0.01; ns, not significant. (F) Fold change in maximal amplitude of glucose-induced calcium influx in islets under stimulation and resting conditions described in (E). n = 4–7 islets per condition. *p<0.05; ns, not significant. See also Figure 5—figure supplement 1.
Figure 5—figure supplement 1
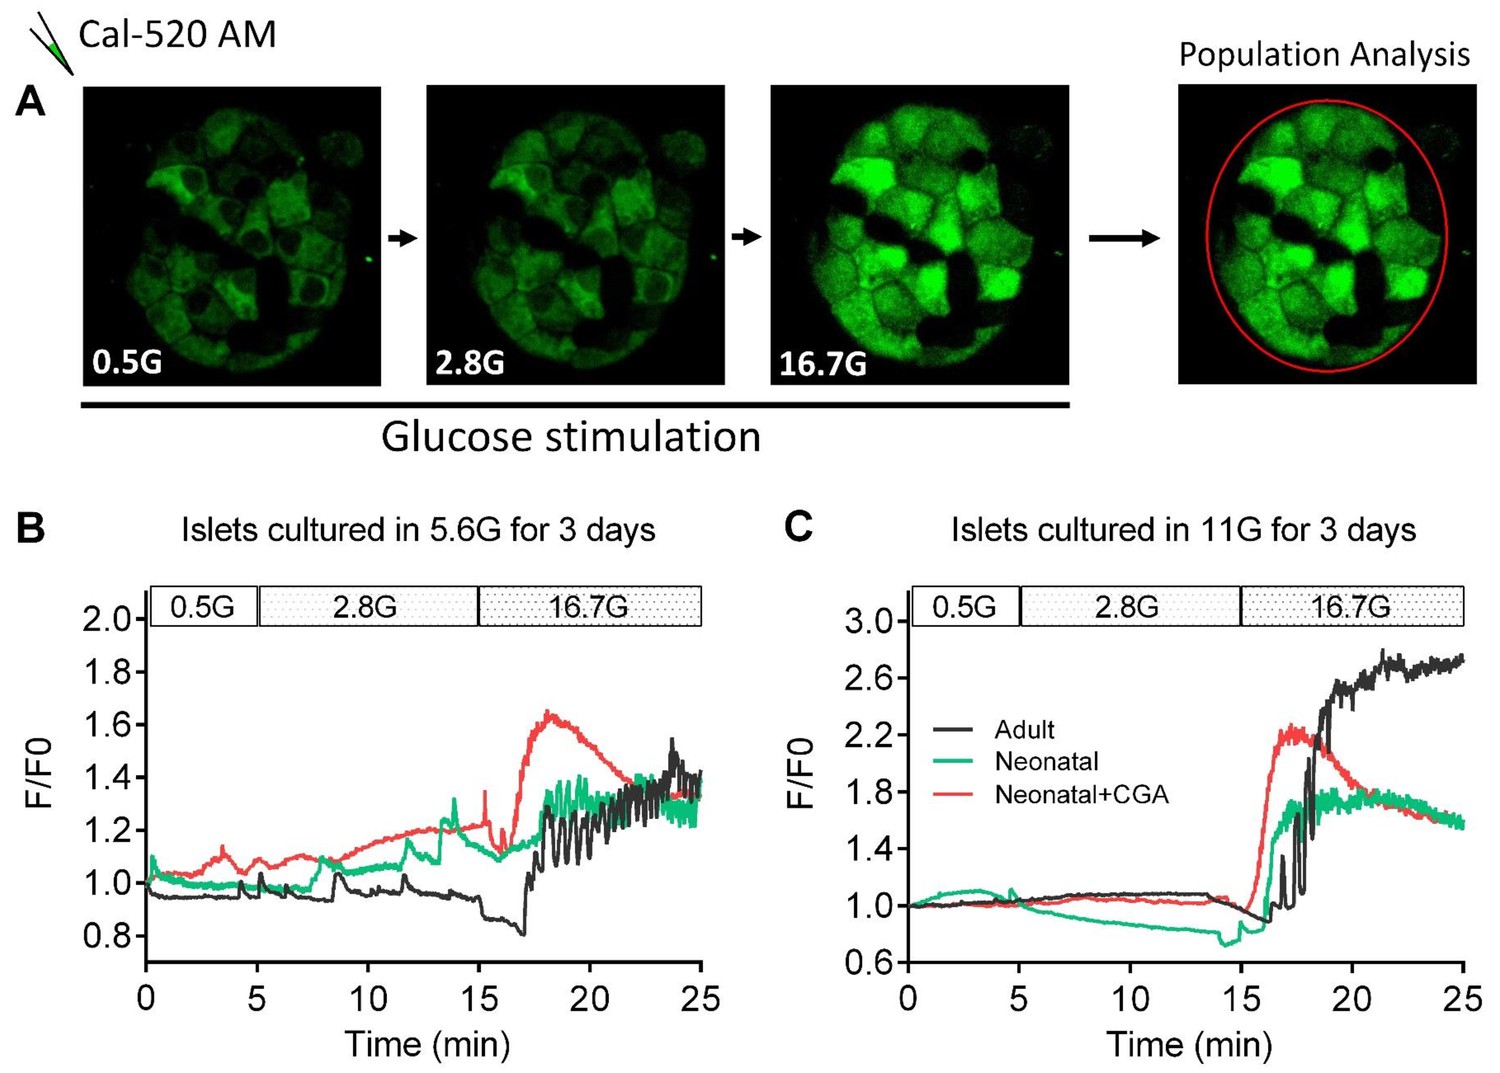
Direct activation of calcineurin promoted the optimal maturity of neonatal mouse β-cells in isolated islets in vitro, as indicated by ex vivo islet calcium imaging.
(A) The experimental design for ex vivo islet calcium imaging used in (B–C). (B–C) Representative time courses of calcium transients under indicated glucose stimulations in islets that had been cultured in media with 5.6 mM glucose (B) and 11 mM glucose (C) for 3 days with or without CGA.
Author response image 1

Supplementing CGA rescued the defective β-cell function in both the core and the mantle of the islet in 72 hpf cloche mutants.
(A-B) In Tg (ins:Rcamp1.07); cloche mutants at 72 hpf, supplementing CGA significantly rescued the number (A) and the maximal Ca2+ influx (B) of glucose-responsive β-cells both in the islet core and in the islet mantle. *P < 0.05, **P < 0.01; ns, not significant.
Author response image 2

MafA antibody used in mouse exhibited non-specific cytoplasmic signals in β-cells of zebrafish.
https://doi.org/10.7554/eLife.41540.027
Author response image 3
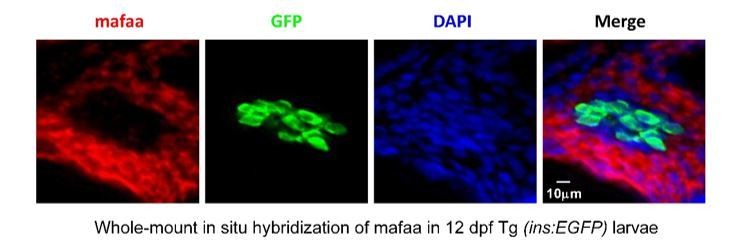
MafA was not expressed in the β-cells, but was expressed in the exocrine pancreas in larval zebrafish.
https://doi.org/10.7554/eLife.41540.028
Author response image 4
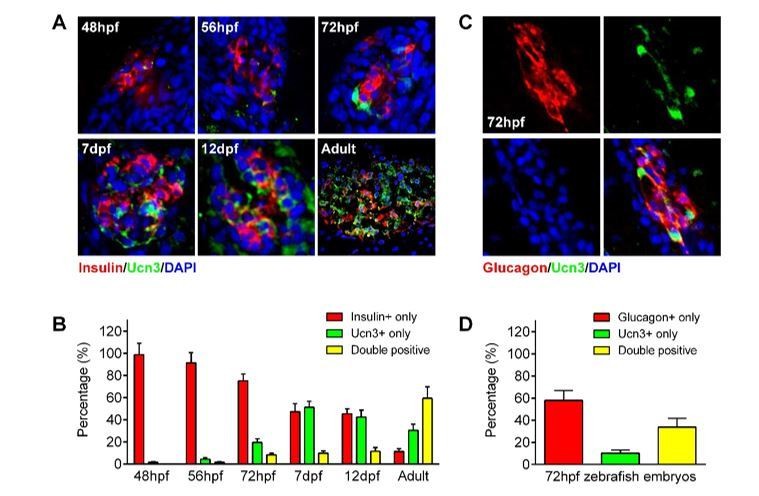
ucn3 expression pattern in zebrafish islets at different developmental stages.
(A) Immunofluorescent labelling of insulin and ucn3 in zebrafish islets at indicated stages. (B) Quantification of ucn3-positive β-cells in zebrafish islets at the indicated stages in A. n = 6-12 islets per condition. (C) Immunofluorescent labelling of glucagon and ucn3 in zebrafish islets at 72 hpf. (D) Quantification of ucn3-positive α-cells in zebrafish islets at 72 hpf. n = 10 embryos.
Author response image 5
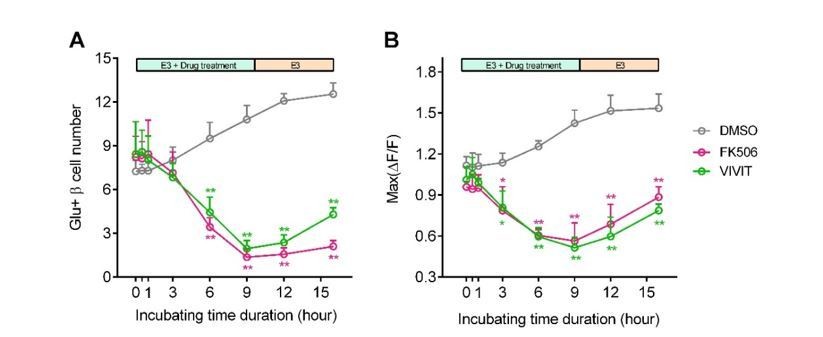
Blockade of calcineurin/NFAT led to reduced β-cell maturity.
(A-B) In 60 hpf Tg (ins:Rcamp1.07) embryos, not acute/short-term, but only long-term incubation with calcineurin/NFAT inhibitors significantly reduced the number (A) and the maximal Ca2+ influx (B) of high glucose-responsive β-cells. After drug removal, the Ca2+ influx of some cells was recovered faster than the number of the glucose-responsive β-cells. *P < 0.05, **P < 0.01.
Author response image 6
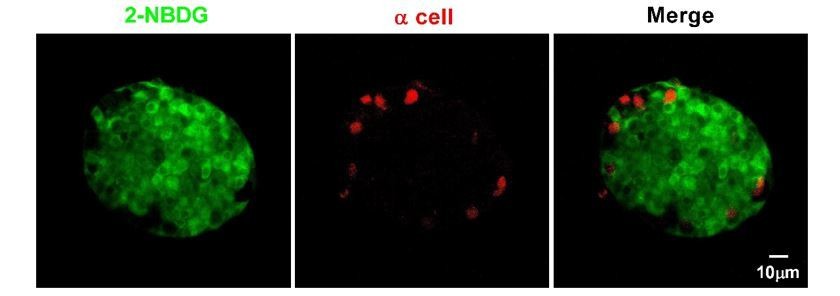
α-cells in isolated mouse islets almost did not take up 2-NBDG.
Representative z-stack images of 2-NBDG (green) and EYFP (a red pseudo-color) signals in isolated 8-week-old mouse islets from the transgenic mice, whose α-cells are genetically labeled with EYFP after incubation with 20 mM 2-NBDG for 10 min.
Author response image 7
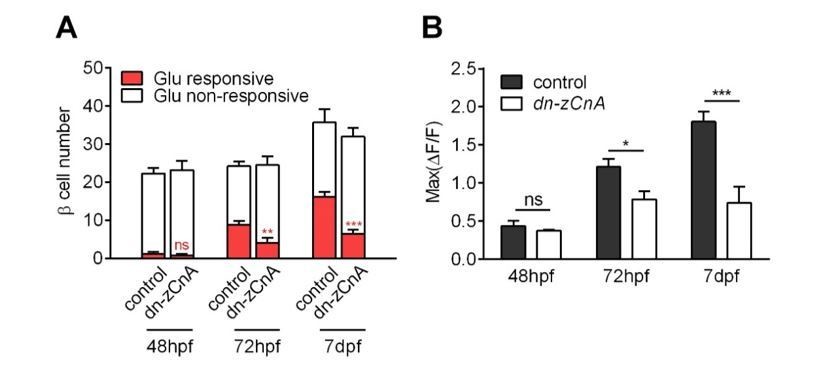
Genetic perturbation of calcineurin/NFAT signaling persistently prevented the glucose-responsiveness of β-cells.
(A-B) Numbers of glucose-responsive β-cells (A) and their maximal Ca2+ responses to glucose (B) in age-matched control and dn-zCnA-expressing embryos at 48 hpf, 72 hpf and 7 dpf. n = 5-7 embryos per stage. *p < 0.05, **p < 0.01, ***p < 0.001; ns, not significant.
Videos
Video 1
A schematic illuminating the dual-color 2P3A-DSLM and comparison of image qualities among 1P-SPIM, TPM and 2P3A-DSLM in islet 3D imaging of live zebrafish.
https://doi.org/10.7554/eLife.41540.008
Video 2
Representative time-lapse images of glucose-induced synchronized calcium transients in neighboring β-cells in a live Tg (ins:Rcamp1.07) embryo at 72 hpf under 2P3A-DSLM.
https://doi.org/10.7554/eLife.41540.009
Video 3
Representative time-lapse volumetric reconstruction of glucose-stimulated calcium transients in all β-cells in a live Tg (ins:Rcamp1.07) embryo at 72 hpf under 2P3A-DSLM.
https://doi.org/10.7554/eLife.41540.010
Video 4
Volumetric reconstruction of pancreatic β-cells and their nearby blood vessels in live Tg (ins:EGFP);Tg (flk1:mCherry) embryos from 36 to 72 hpf.
https://doi.org/10.7554/eLife.41540.015
Video 5
Representative time-lapse volumetric reconstruction of glucose-stimulated calcium transients in all β-cells in a live Tg (ins:Rcamp1.07) embryo at 72 hpf that had been treated with 3 MPA for 9 hr under 2P3A-DSLM.
https://doi.org/10.7554/eLife.41540.017
Video 6
Representative time-lapse volumetric reconstruction of glucose-stimulated calcium transients in all β-cells in a live Tg (ins:Rcamp1.07) embryo at 72 hpf that had been co-treated with 3 MPA and CGA for 9 hr under 2P3A-DSLM.
https://doi.org/10.7554/eLife.41540.021
Author response video 1
Additional files
-
Supplementary file 1
Comparison of the critical events and the time windows in zebrafish and mouse pancreas development.
The table shows comparison of developmental process and critical stage in zebrafish and mouse pancreas development.
- https://doi.org/10.7554/eLife.41540.024
-
Transparent reporting form
- https://doi.org/10.7554/eLife.41540.025
Download links
A two-part list of links to download the article, or parts of the article, in various formats.
Downloads (link to download the article as PDF)
Open citations (links to open the citations from this article in various online reference manager services)
Cite this article (links to download the citations from this article in formats compatible with various reference manager tools)
In vivo imaging of β-cell function reveals glucose-mediated heterogeneity of β-cell functional development
eLife 8:e41540.
https://doi.org/10.7554/eLife.41540


