Fusion pore regulation by cAMP/Epac2 controls cargo release during insulin exocytosis
- Uppsala University, Sweden
- University of Bergen, Norway
Figures
Figure 1 with 1 supplement
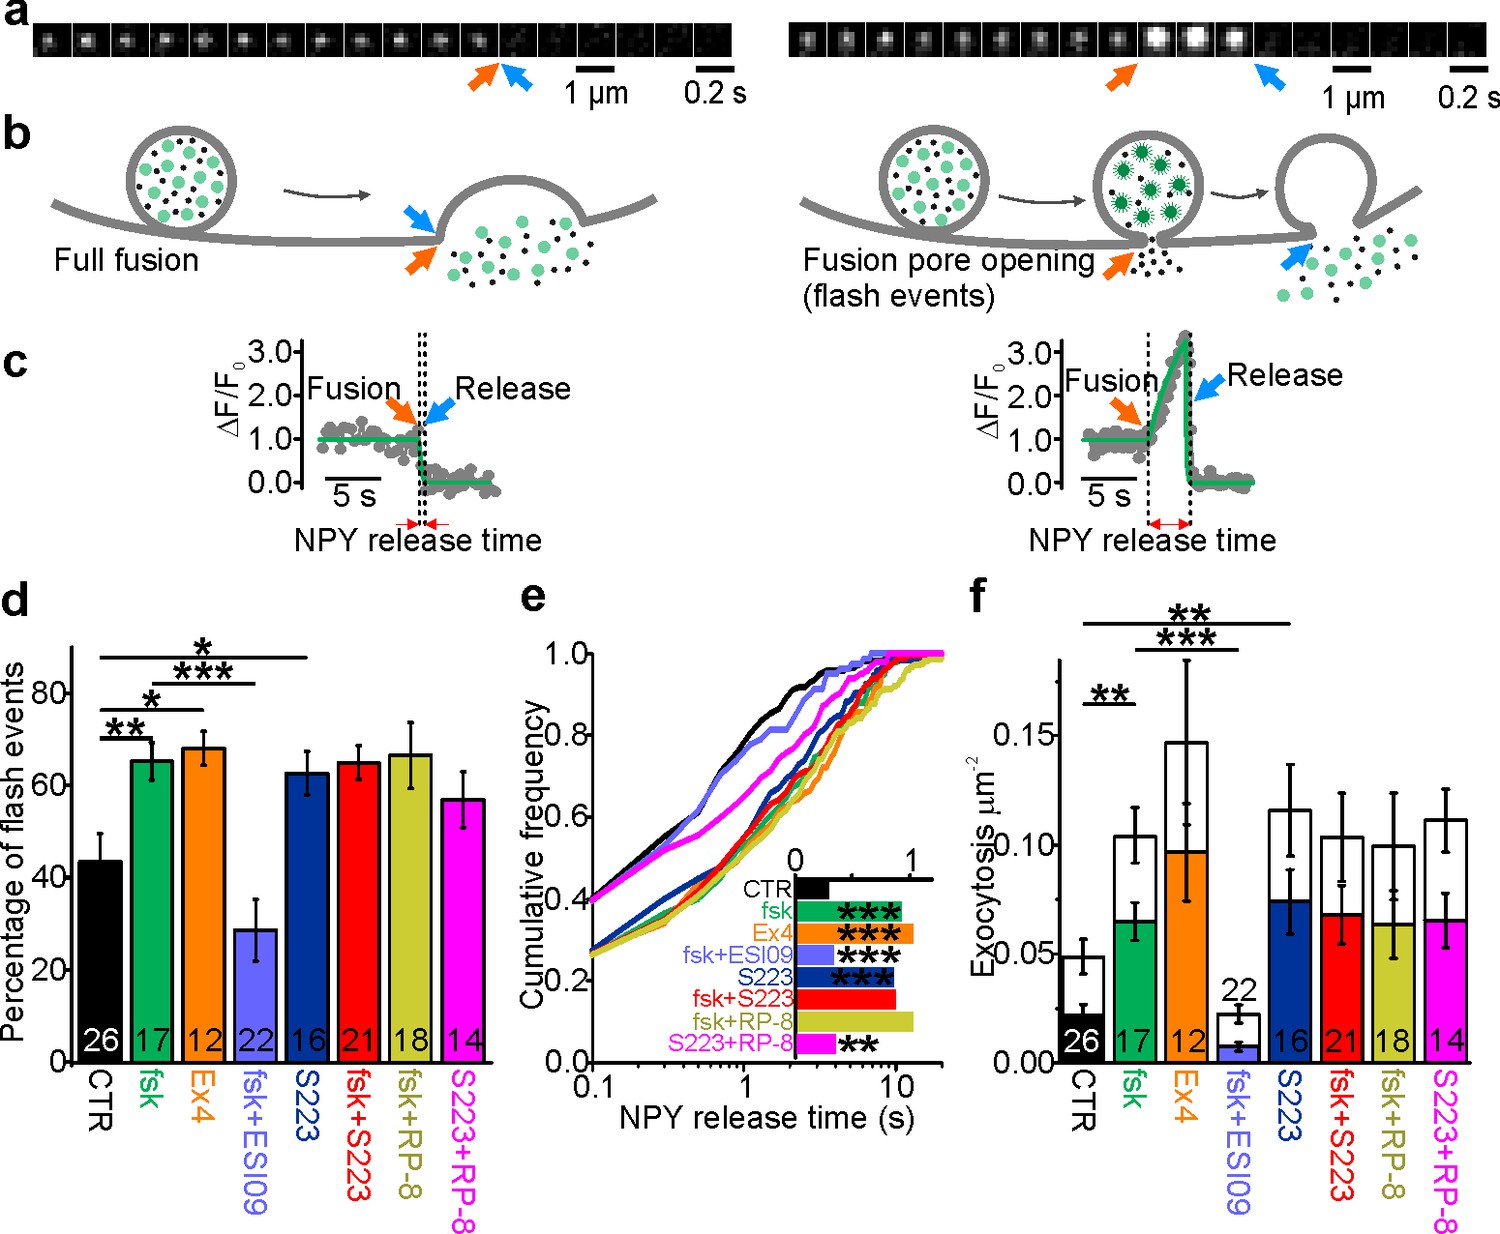
cAMP-dependent fusion pore restriction depends on Epac (but not PKA).
(a) Examples of single granule exocytosis in human β-cells expressing NPY-Venus and challenged with 75 mM K+. Full fusion (left) and flash event (right), where sudden loss of the granule label was preceded by a transient fluorescence increase. Arrows indicate moment of fusion pore opening (orange) and content release (blue). (b) Cartoons illustrating the interpretation of events in a. (c) Fluorescence time courses for the events in b. Overlaid (green) are fitted functions used to estimate NPY release time. (d) Fraction of flash events in experiments as in a-c, in cells exposed to the indicated agents; forskolin (fsk, p=0.01 vs ctrl), exendin-4 (Ex4, p=0.02 vs ctrl), ESI-09 (p=3*10−4 vs fsk), S223 (p=0.04 vs ctrl), fsk +S223 (p=0.99 vs fsk), RP-8 (p=0.91 vs fsk) and Rp-8 +S223 (p=0.19 vs ctrl; Kruskal Wallis/Dunn). Number of donors analyzed: 7 (CTR); 5 (fsk); 4 (Ex4); 7 (fsk +ESI09); 6 (S223); 6 (fsk +S223); 7 (RP-8); 4 (Rp-8 +S223). n, number of cells. (e) Cumulative frequency histograms of NPY release times; fsk (p=9*10−7 vs ctrl), Ex4 (p=1*10−6 vs ctrl), ESI-09 (p=2*10−4 vs fsk), S223 (p=4*10−6 vs ctrl),Fsk +S223 (n.s. vs fsk), RP-8 (n.s. vs fsk) and RP-8 +S223 (p=0.016 vs ctrl); Kolmogorov-Smirnov test). Inset shows median NPY release times for 170 (CTR), 197 (fsk), 155 (Ex4), 81 (ESI-09), 240 (S223), 328 (fsk +S223), 277 (RP-8) and 227 (Rp-8 +S223) events. (f) Exocytosis during 40 s of K+-stimulation for control (CTR) and with forskolin (fsk, 2 µM, p=0.002 vs ctrl; Kruskal Wallis/Dunn) or Exendin-4 (Ex4, 10 nM, p=0.005 vs ctrl) or S223 (5 µM, p=0.002 vs ctrl) or RP-8 +S223 (p=0.012 vs ctrl and n.s. vs S223) in the bath solution. Inhibitors of Epac (ESI-09, 10 µM, p=9*10-7 vs fsk) or PKA (RP-8, 100 µM, n.s. vs fsk) or Epac2 activator S223 (n.s. vs fsk), one-way ANOVA with Games-Howell post hoc test) were supplied in addition to forskolin. Flash exocytosis (in color) and full fusions (in white) are shown separately. n, number of cells.
Figure 1—figure supplement 1
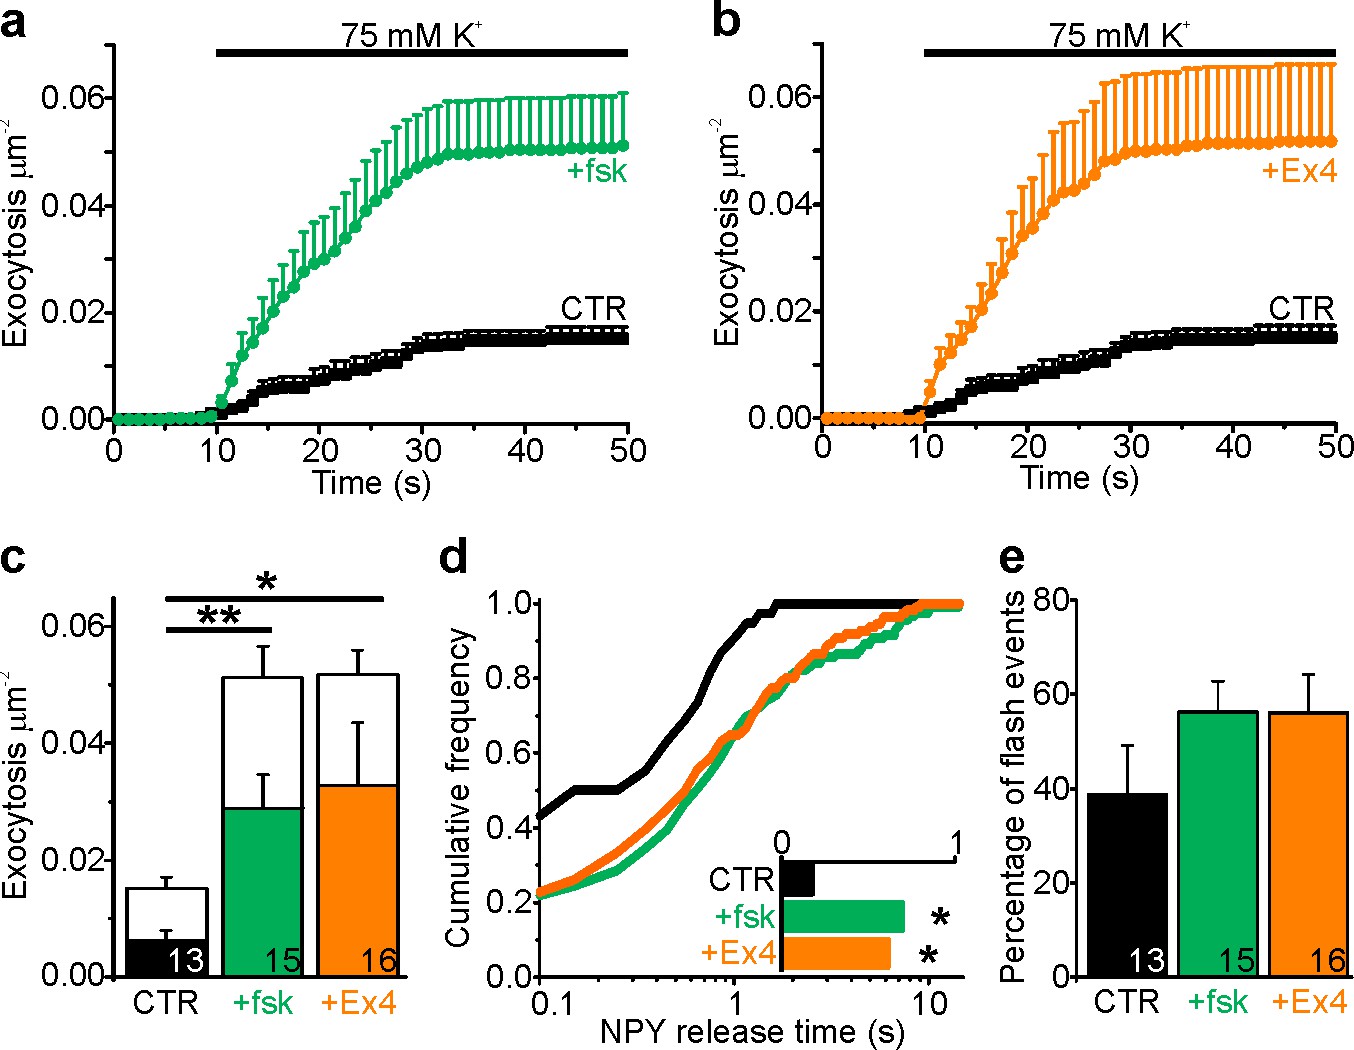
cAMP increases NPY release times in INS1 cells.
(a–b) K+ stimulated exocytosis of NPY-tdmOrange2 granules in INS1 cells is significantly increased in presence of (A) forskolin (fsk; 2 µM; p=0.002) or (B) exendin-4 (Ex4; 10 nM; p=0.03). CTR, n = 13 cells; Fsk, n = 15; Ex4, n = 16. n of preps: 4 (CTR); 5 (+fsk); 2 (+Ex4). (c) Total exocytosis in (A–B) separated for events with flashes (in color) and full fusion events (in white); significance (t-test) is given for flash events. (d) Cumulative frequency histograms of NPY release times in (A–B); note longer NPY release times in presence of fsk (p=0.011) or Ex4 (p=0.018, Kolmogorov-Smirnov test). Inset plots the median NPY release times for 38 (CTR), 119 (fsk) and 111 (Ex4) events. (e) Percentage of flash events (p=0.23 for fsk, p=0.14 for Ex4 vs. control, u-test). n, number of cells.
Figure 2
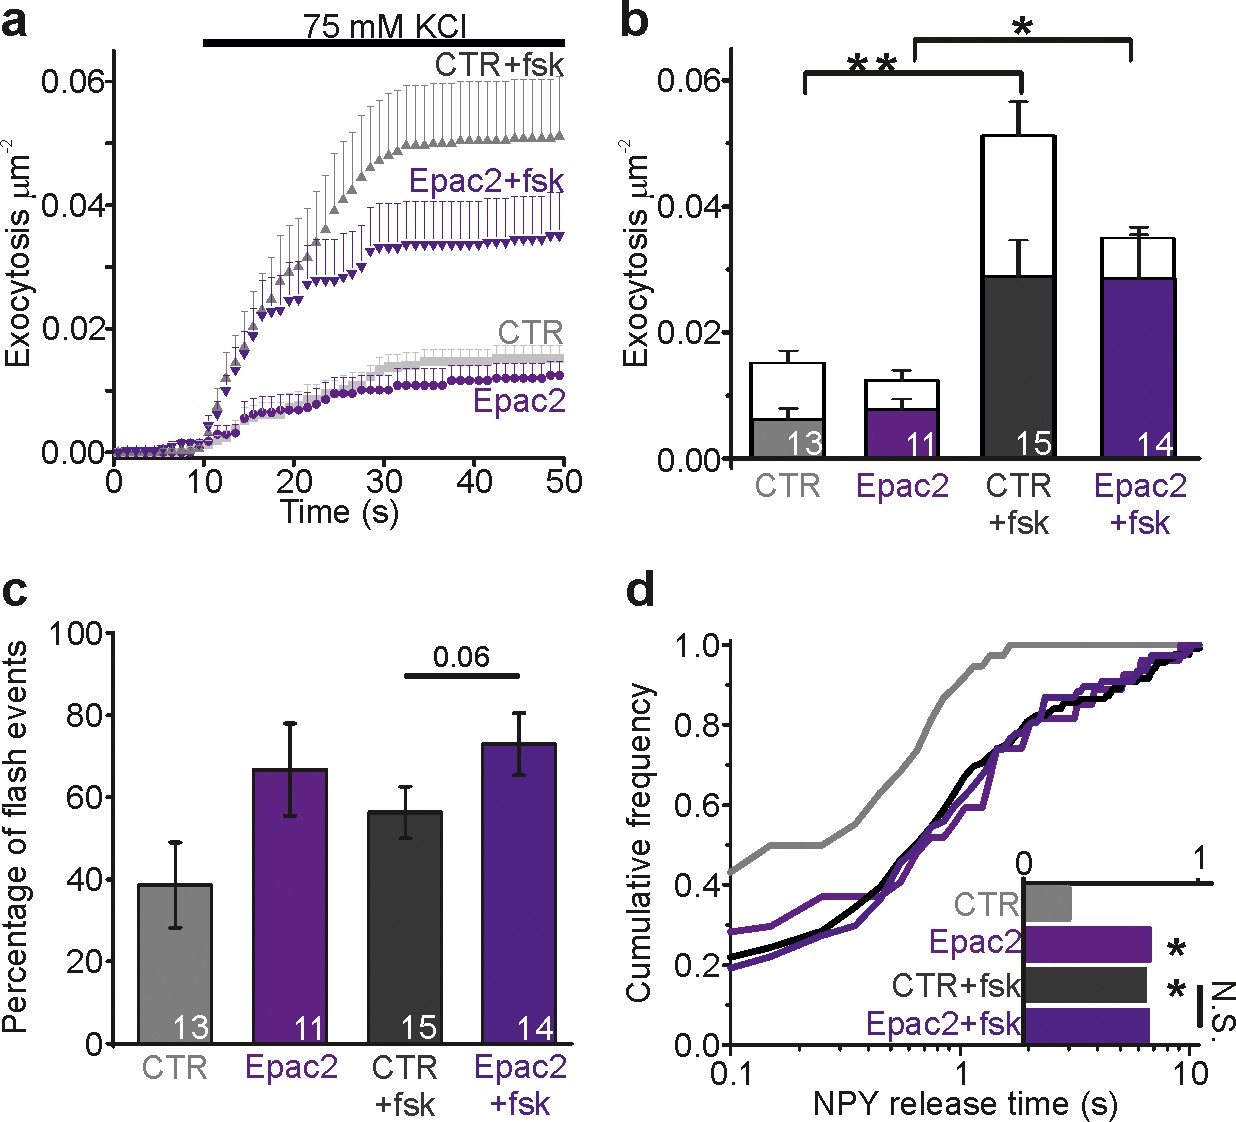
Epac2 overexpression prolongs NPY release times.
(a) Cumulative exocytosis in INS-1 cells stimulated with 75 mM K+; gray for control cells, purple for cells expressing Epac2-EGFP (both also expressed NPY-tdmOrange2); fsk indicates forskolin in the bath solution. CTR, n = 13 (4 preps); Epac2, n = 11 (2 preps); CTR +fsk, n = 15 (5 preps); Epac2 +fsk, n = 14 cells (2 preps). (b) Total exocytosis in (a), separated into flash events (color) and full fusion (white). Epac2 expression reduced full fusion events (no fsk p=0.06; with fsk p=0.01, Kruskal Wallis/Dunn). n, number of cells. (c) Fraction of flash events in (a–b). (Kruskal Wallis/Dunn). n, number of cells. (d) NPY release times for conditions in a-c. Epac overexpression increased NPY release times in absence (p=0.014) but not in presence of fsk (p=0.87, Kolmogorov-Smirnov test). Inset shows the NPY release times for 38 (CTR), 27 (Epac2), 119 (CTR +fsk) and 77 (Epac2 +fsk) events.
Figure 3

Cytosolic cAMP slows ATP release by activating Epac.
(a) Electrophysiological detection of nucleotide release events in INS-1 cells expressing P2X2-RFP. Cartoon of the assay (left) and example current spike (black) with fit and analysis parameters (red; Thalf, tau and slope during 25% to 75% of peak). (b) Representative P2X2 currents for control (black), and with cAMP (green) or with cAMP together with ESI-09 (purple) in the electrode solution. (c) Spike frequency conditions in (b). n of events (on top) and n of cells (on bars); two preps for each condition. (d–f) Cumulative frequency histograms of spike half width (d), decay constant tau (e), and slope of the rising phase (25% and 75% of peak, (f)) for CTR (n = 410 spikes, 14 cells), +cAMP (n = 1240, 14 cells) and +ESI-09 + cAMP (n = 552, 15 cells) with medians in the insets. cAMP increased half-width (p=4.1*10−31 vs ctrl, Kolmogorov-Smirnov test), tau (p=2.7*10−32, Kolmogorov-Smirnov test), and rising slope (p=4.7*10−19, Kolmogorov-Smirnov test); the effects were reversed by ESI-09 (p=3.4*10−21, p=3.6*10−22, and p=1.3*10−9, Kolmogorov-Smirnov test), respectively.
Figure 4
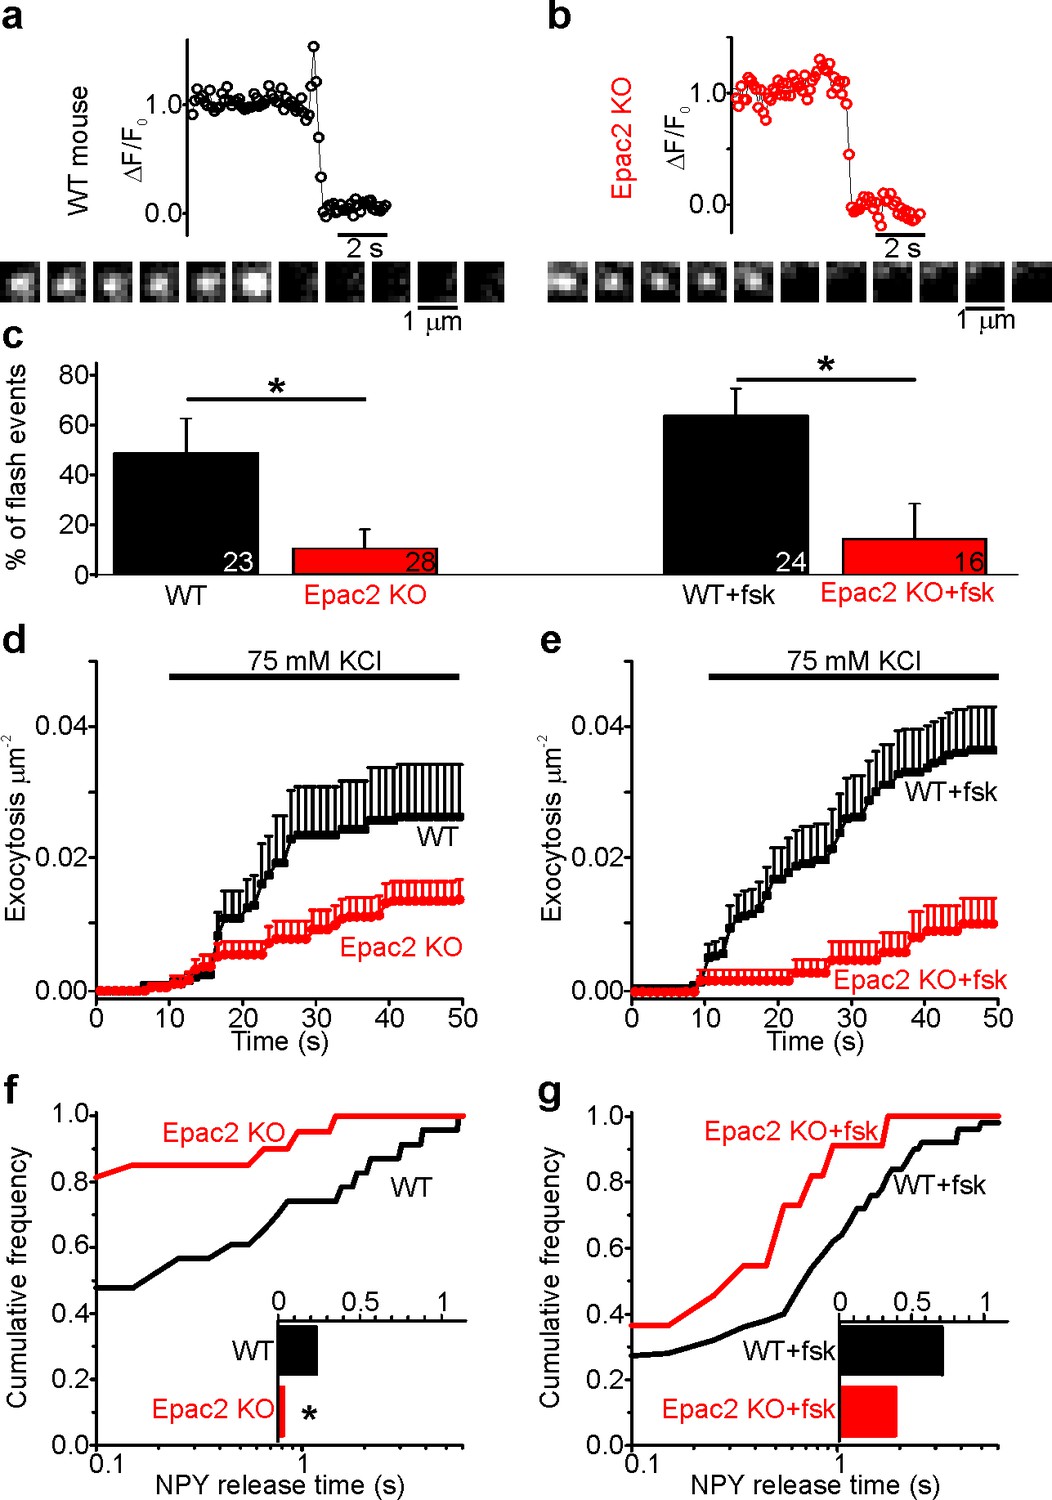
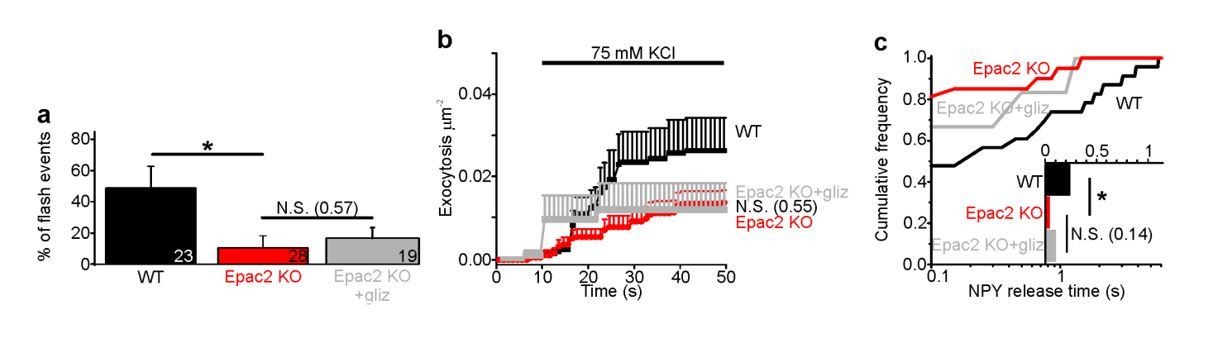
Fusion pores expand rapidly in Epac2-/- (Rapgef4-/-) mice.
(a–b) Examples of NPY-tdmOrange2 exocytosis events in β-cells from Epac2-/- mice or from wildtype littermates, stimulated with 75 mM K+ in presence of forskolin. Note absence of a flash in Epac2 ko. (c) Fraction of flash events for experiments in (a–b); differences are significant in absence (p=0.027, Kruskal Wallis/Dunn test) or presence of fsk (p=0.011). Number of mice: 4 (WT); 4 (Epac2 KO); 5 (WT + fsk); 2 (Epac2 KO + fsk). n, number of cells. (d) Cumulative exocytosis for experiments in absence of forskolin (a,c left) for wildtype (black) and Epac2-/- cells (red), differences are n.s. (e) Cumulative exocytosis for experiments in presence of forskolin (b,c right) for wildtype (black) and Epac2-/- cells (red). p=0.003, Kruskal Wallis/Dunn test. (f–g) Cumulative frequency histograms and medians (inset) of NPY release times for exocytotic events in d (no forskolin, 23 events for wt, 22 for Epac2-/-) and E (with forskolin, 50 events for wt, nine for Epac2-/-). Differences in f are significant (p=0.043; Kolmogorov-Smirnov test).
Figure 5 with 2 supplements
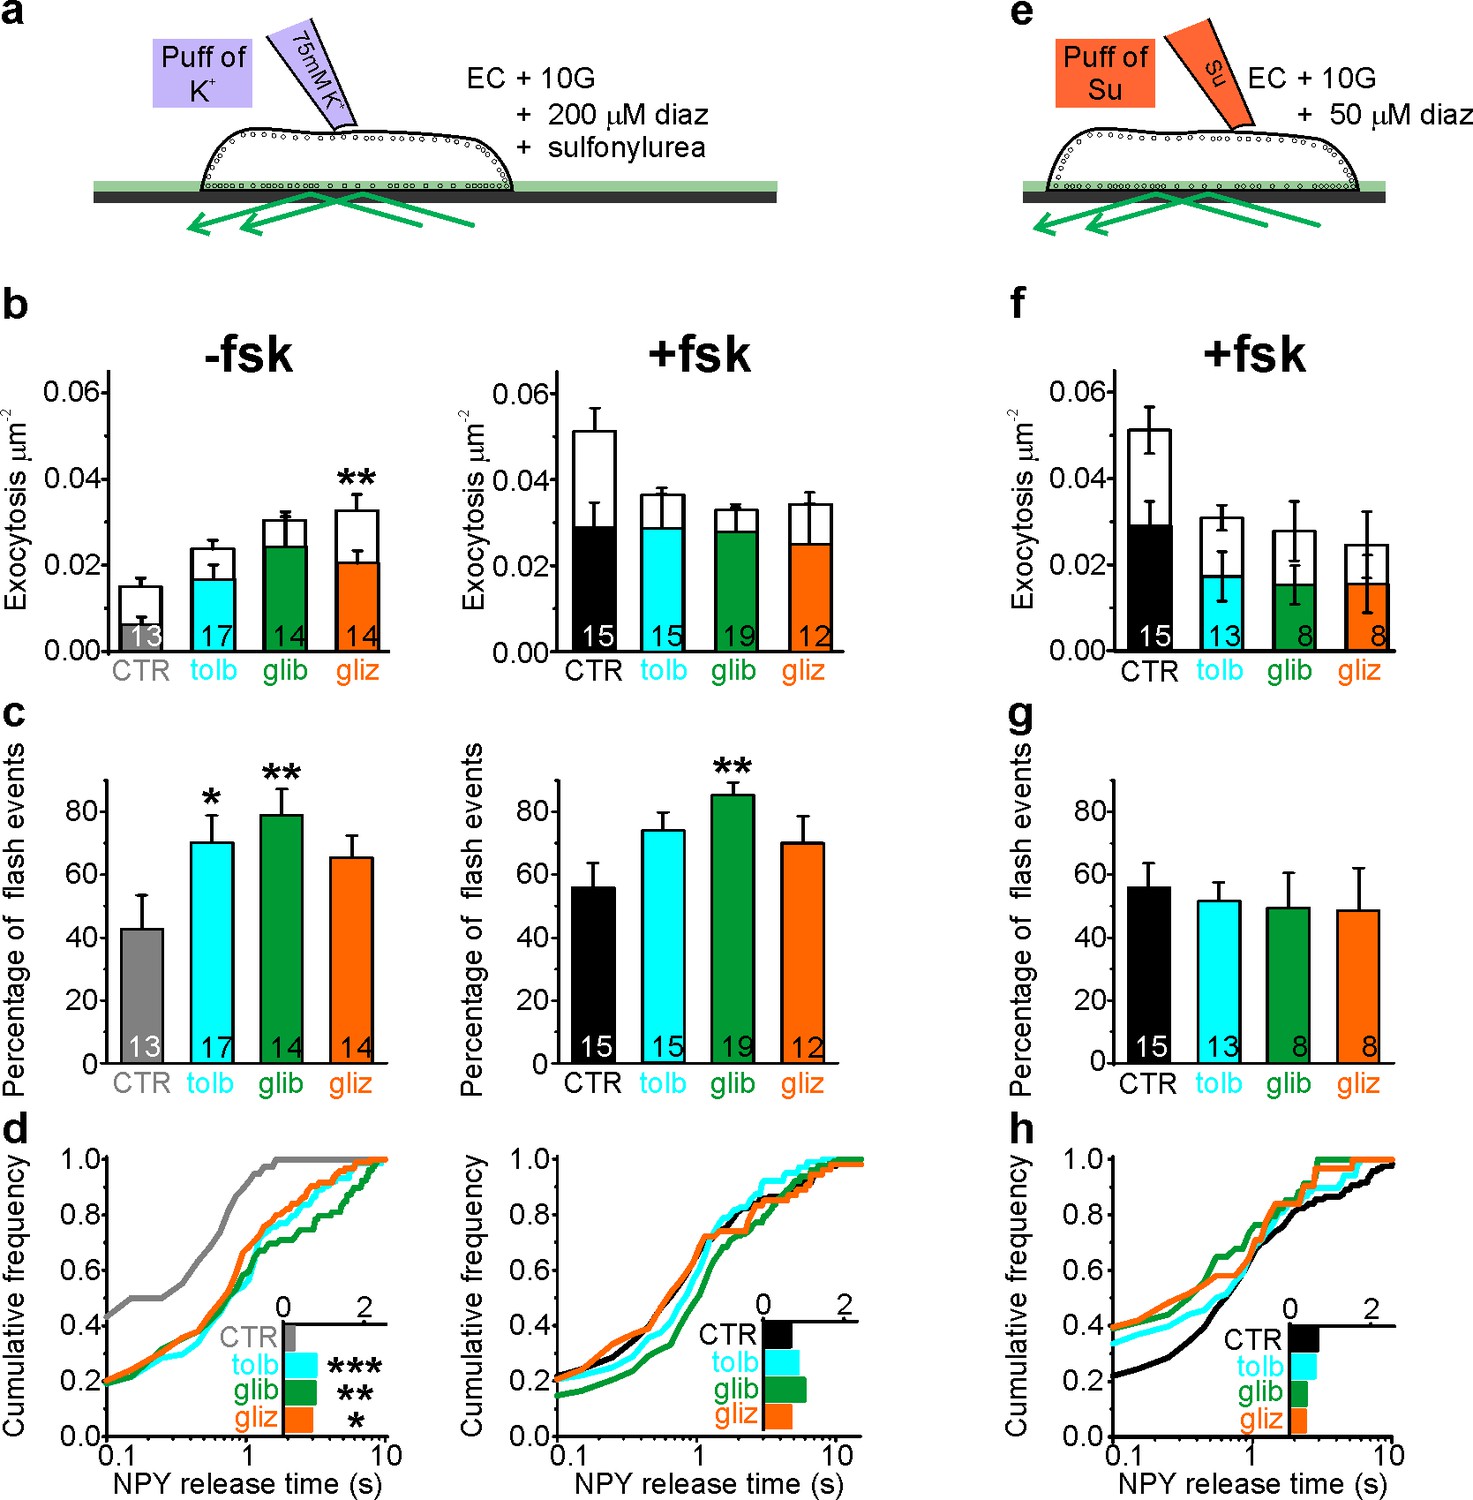
Sulfonylureas cause fusion pore restriction.
(a) Cartoon of the experimental design in (b–d). INS-1 cells expressing NPY-tdmOrange2 were bathed in 10 mM glucose, diazoxide (200 µM) and either 200 µM tolbutamide (tolb), 50 µM glibenclamide (glib) or 50 µM gliclizide (gliz); exocytosis was evoked by acute exposure to 75 mM K+. (b) Exocytosis in absence (left) or presence (right) of fsk (2 µM) for flash events (color) and full fusions (white). Total exocytosis was increased by sulfonylurea in absence of fsk (p=0.15 tolb; p=0.05 glib, p=0.005 gliz, Kruskal Wallis/Dunn test vs ctrl/no fsk), but not in its presence (p=0.23 tolb; p=0.16 glib, p=0.10 glic). Sulfonylurea reduced full fusion events in presence of fsk (p=0.0045 tolb, p=0.00032 glib, 0.022 gliz, t-test). n of preps: 4 (CTR); 3 (tolb); 2 (glib); 3 (gliz); 5 (CTR + fsk); 3 (tolb + fsk); 3 (glib + fsk); 2 (gliz + fsk). n, number of cells. (c) Fraction of flash events for experiments in (b); Kruskal-Wallis/Dunn Test against ctrl/no fsk: p=0.015 tolb, p=0.001 glib, p=0.097 gliz, and against control +fsk: p=0.07 tolb; p=0.002 glib; p=0.14 gliz;); n, number of cells. (d) Cumulative frequency histograms and medians (insets) of NPY release times for (b–c). Differences vs control are significant in the absence of fsk: p=9.1*10−4 tolb, p=0.003 glib, p=0.015 gliz, Kolmogorov-Smirnov test). Insets show NPY release times for 38 (CTR), 74 (tolb), 79 (glib), 95 (gliz) events and inset on the right for 111 (CTR), 104 (tolb), 127 (glib) and 54 (gliz) events in presence of fsk. (e) Cartoon of the experimental design in (f–h). Cells were bathed in 10 mM glucose, 2 µM fsk, 50 µM diazoxide and acutely exposed to sulfonylureas (500 µM tolb, 100 µM glib or 100 µM gliz) during the recording period. (f) Exocytosis in presence of fsk (2 µM) for flash events (color) and full fusions (white). Differences are not significant (p=0.16 Kruskal Wallis test). n, number of cells. (g) Fraction of flash events for experiments in (f). Differences are not significant (p=0.98 Kruskal Wallis test). (h) Cumulative frequency histograms and medians (inset) of NPY release times for (f–g). Inset shows NPY release times for 111 (CTR), 68 (tolb), 34 (glib) and 31 (gliz) events.
Figure 5—figure supplement 1
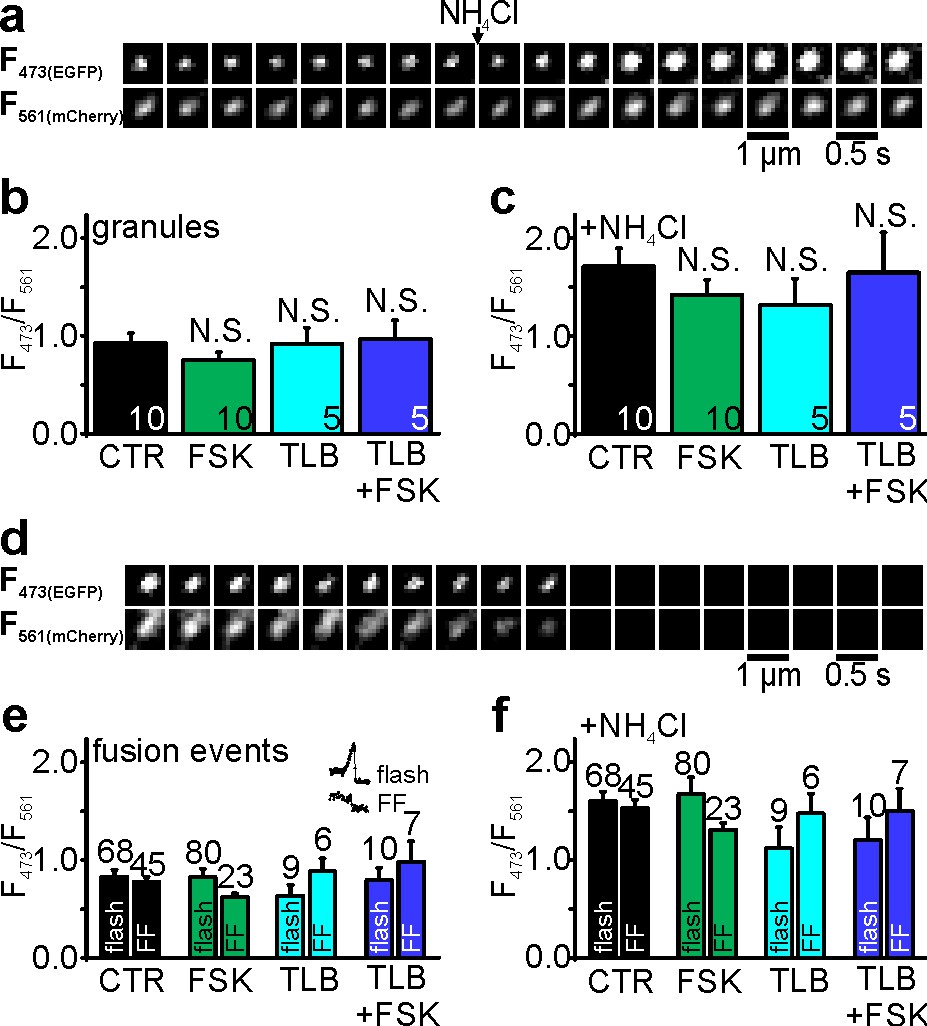
Granule pH is unchanged by forskolin or tolbutamide and does not affect pore lifetime.
(a) Image sequences of a single NPY-EGFP-mCherry granule in an INS1 cells, exposed to 10 mM NH4+ (arrow); the green (top) and red color channels (bottom) of this ratiometric pH-probe are shown. (b) Green/red fluorescence ratio as measure of granule pH in controls (black), presence of fsk (green), tolbutamide (tlb, cyan), or both (blue); none of the values is significantly different from control; n, number of cells (20 granules each). (c) The fluorescence ratio for the same granules as in (b), after alkalization with 10 mM NH4+ was similar with fsk (p=0.06), tlb (p=0.06) or tlb + fsk (p=0.91). (d) K+-stimulated exocytosis of a single NPY-EGFP-mCherry granule; green (top) and red fluorescence (bottom) are shown. (e) Green/red ratio of granules as in (d), just prior to exocytosis, and separated for events with (flash) or without flash (FF). n, number of events. (f) As in (e), but for exocytosis events in presence of 10 mM NH4+. Values for flash and FF in e-f were not significantly different. n, number of events.
Figure 5—figure supplement 2
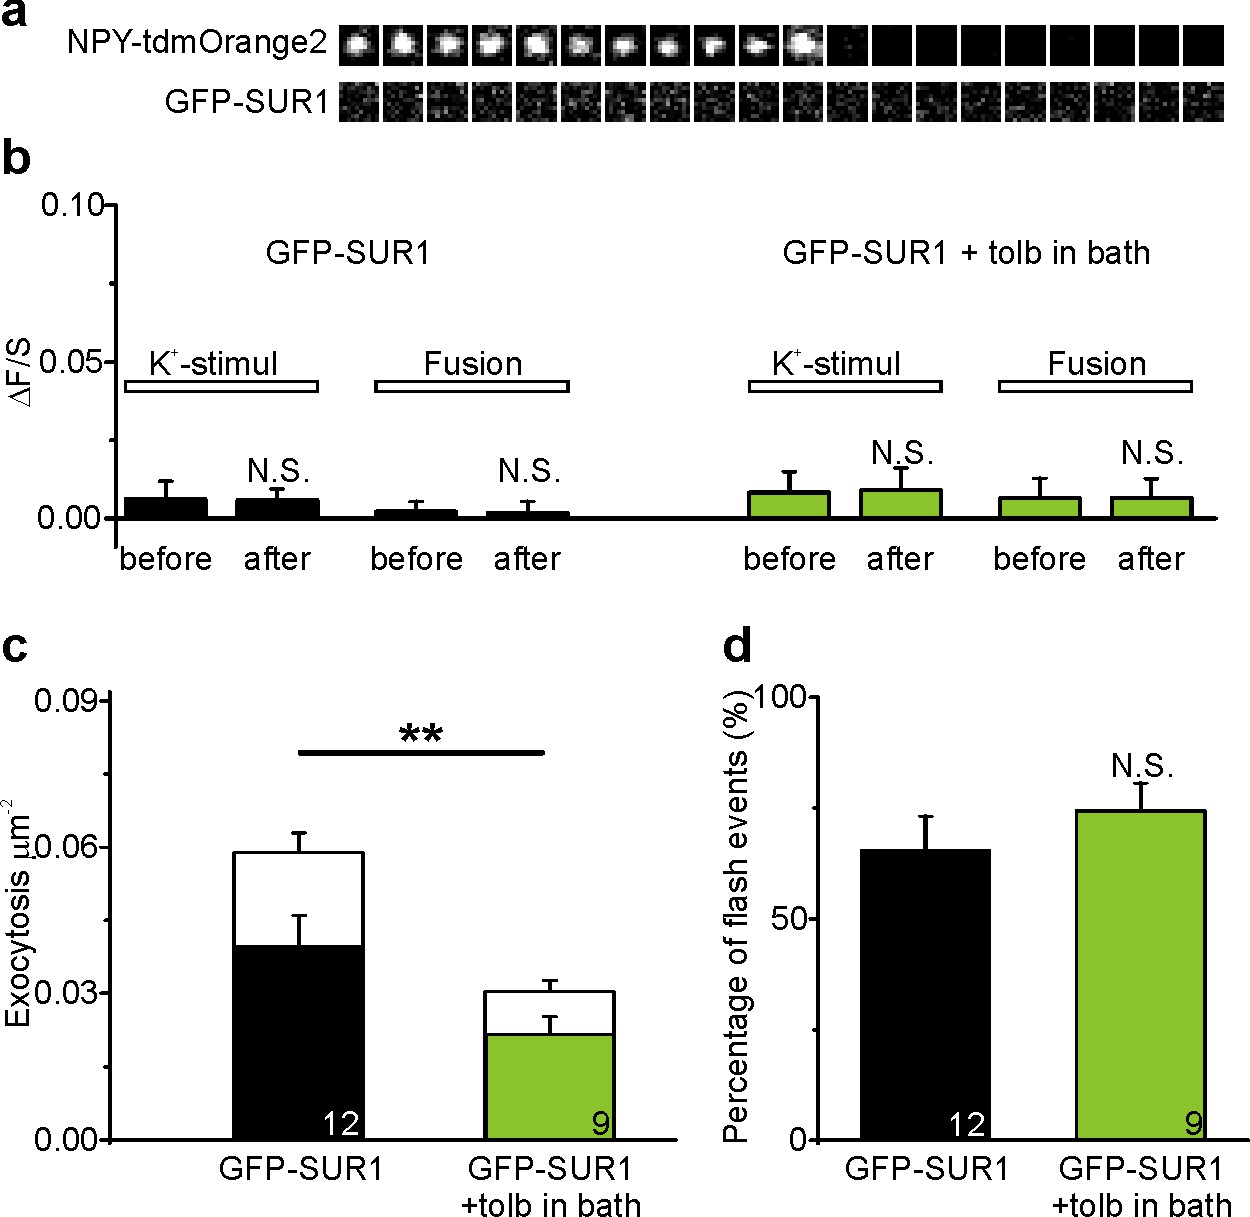
Activation of SUR1 by tolbutamide does not affect fusion pore restriction.
(a) Image sequences of a granule undergoing K+-stimulated exocytosis in an INS-1 cell expressing NPY-tdmOrange2 and GFP-SUR1. (b) Quantification of GFP-SUR1 binding to the granule site (ΔF/S) in presence (green) or absence (black) of tolbutamide. (c) Exocytosis (40 s K+) in cells as in (a), separated for restricted fusion pores (flash events, in color) and full fusion events (in white); the decrease with tolbutamide was significant (p=0.001); n, number of cells. (d) Percentage of flash events in cells expressing EGFP-SUR, with or without tolbutamide.
Figure 6 with 2 supplements
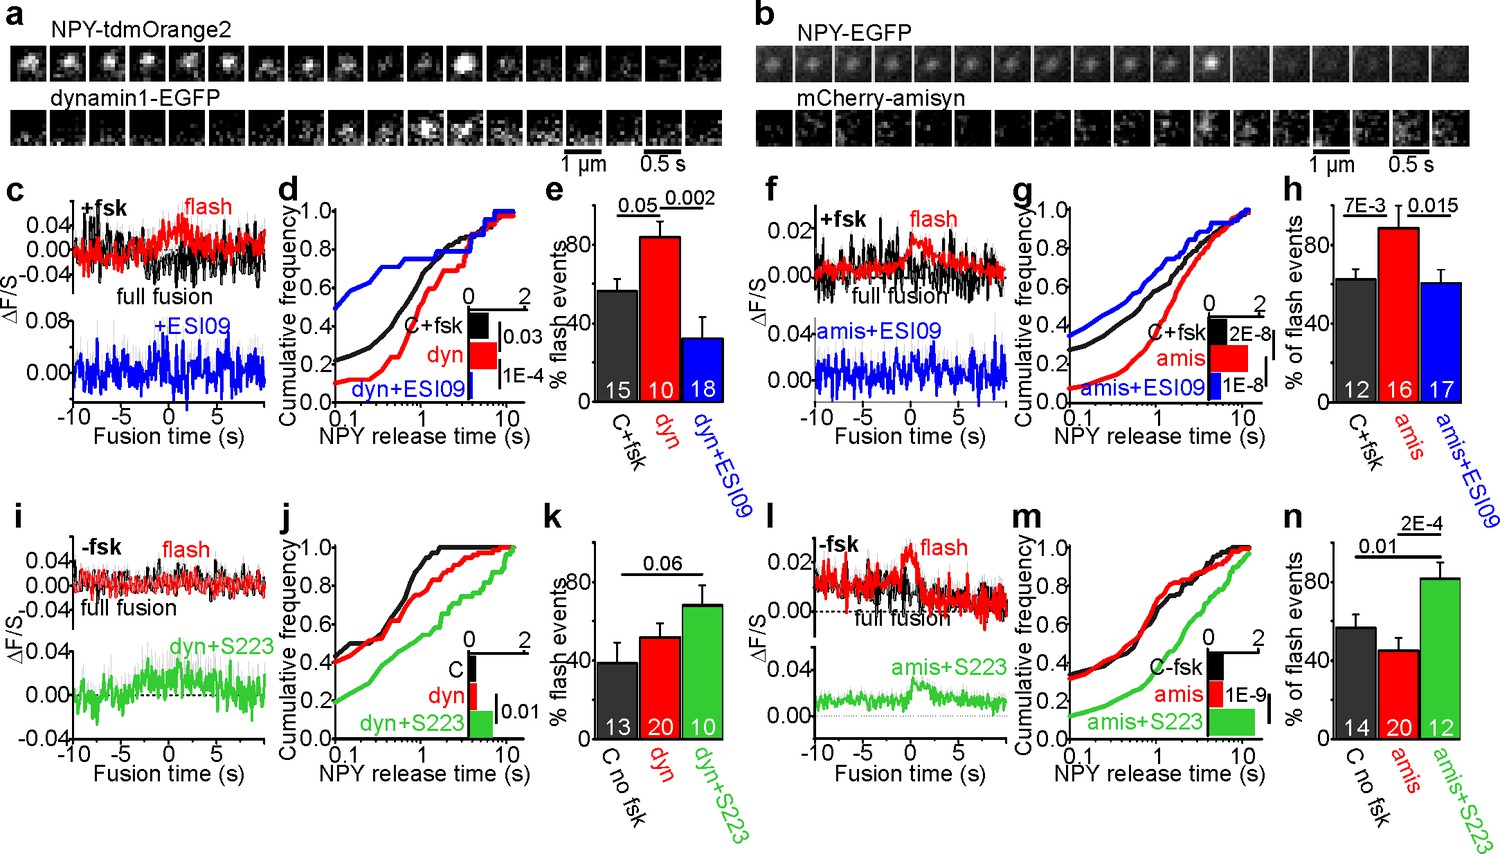
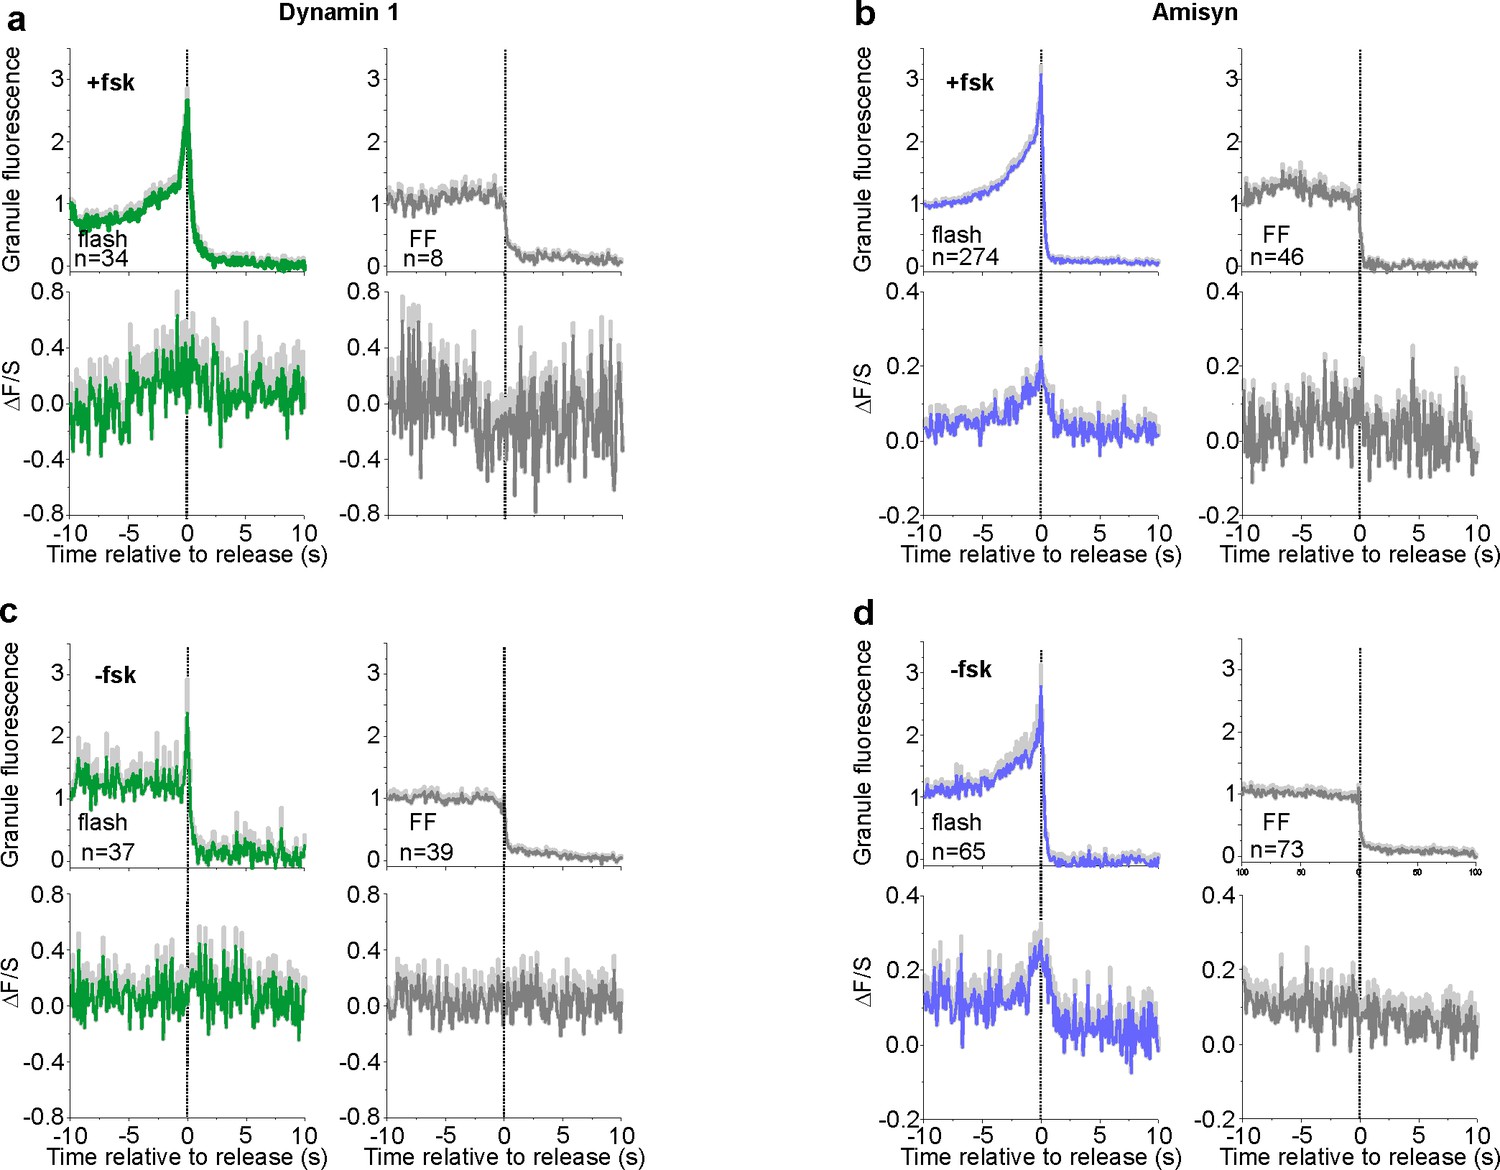
Fusion pore regulation by dynamin1 and amisyn is cAMP-dependent.
(a–b) Example image sequence of transient recruitment of dynamin1-GFP (a, lower) or mCherry-amisyn (b, lower) to granules (upper, labeled with NPY-tdmOrange2 or NPY-EGFP) during K+-stimulated exocytosis in presence of forskolin. (c) Average time course (± SEM) of dynamin1-GFP (dyn) fluorescence during 34 flash-type exocytosis events (red) and eight full-fusion type events (black) in presence of forskolin; and nine flash events in presence of fsk + ESI09 (blue); data points represent average of five frames and time is relative to the flash onset in the granule signal. (d) Cumulative frequency histograms and medians (inset, with p for Kolmogorov-Smirnov test) of NPY release times in presence of fsk in cells expressing dynamin1-EGFP (red), dynamin with added ESI09 (blue) or control (black). 119 (CTR), 42 (dyn), 24 (dyn + ESI09) events. n of preps: 5 (C + fsk); 1 (dyn); 2 (dyn + ESI-09). (e) Fraction of flash events in (d). n, number of cells, p for Kruskal-Wallis/Dunns test. (f) Average time course (± SEM) of mCherry-amisyn (amis) fluorescence (red n = 274 flash events; black n = 46 full fusion events) or in presence of fsk + ESI09 (blue; n = 56 flash events). (g) Cumulative frequency histograms and medians (inset, with Kolmogorov-Smirnov test) of NPY release times in cells expressing mCherry-amisyn, amysin with ESI09, or control; fsk was present. 213 (CTR), 320 (amisyn), and 90 (amis +ESI09) events. n of preps: two for each. (h) Fraction of flash events in (g); p for Kruskal-Wallis/Dunn test. n, number of cells. (i) As in c, but without forskolin for control (black), dynamin (red), and dynamin with S223 (green); n = 37 flash events, n = 39 full fusion events for dyn and n = 40 flash events for dyn +S223. (j–k) As in (d–e), but for 38 (ctrl, black), 76 (dynamin1, red) and 55 (Dyn + S223, green) events in the absence of forskolin. n of preps: 4 (C-fsk); 2 (dyn); 2 (dyn + S223). (l) As in f, but without forskolin present; 65 flash events (red) and 73 full fusion events (black) for amisyn, and 154 flash events for amisyn + S223 (green). (m–n) As in (g–h), but for 123 (ctrl, black), 138 (amisyn, red) and 174 (amis + S223, green) events in the absence of forskolin. n of preps: 1 (C-fsk); 2 (amis); 2 (amis + S223).
Figure 6—figure supplement 1
NPY and amisyn/dynamin1 recruitment profiles at the point of release.
(a) Exocytosis events separated for flashes (left, green) and full fusions (right, gray) for dynamin1-GFP and NPY-tdmOrange2 expressing INS-1 cells in presence of forskolin from Figure 6. n, number of events (b) As in a, but for mCherry-amisyn and NPY EGFP expressing INS-1 cells from Figure 6. n, number of events (c) As in a, but in absence of forskolin. n, number of events (d) As in b, but in absence of forskolin. n, number of events.
Figure 6—figure supplement 2
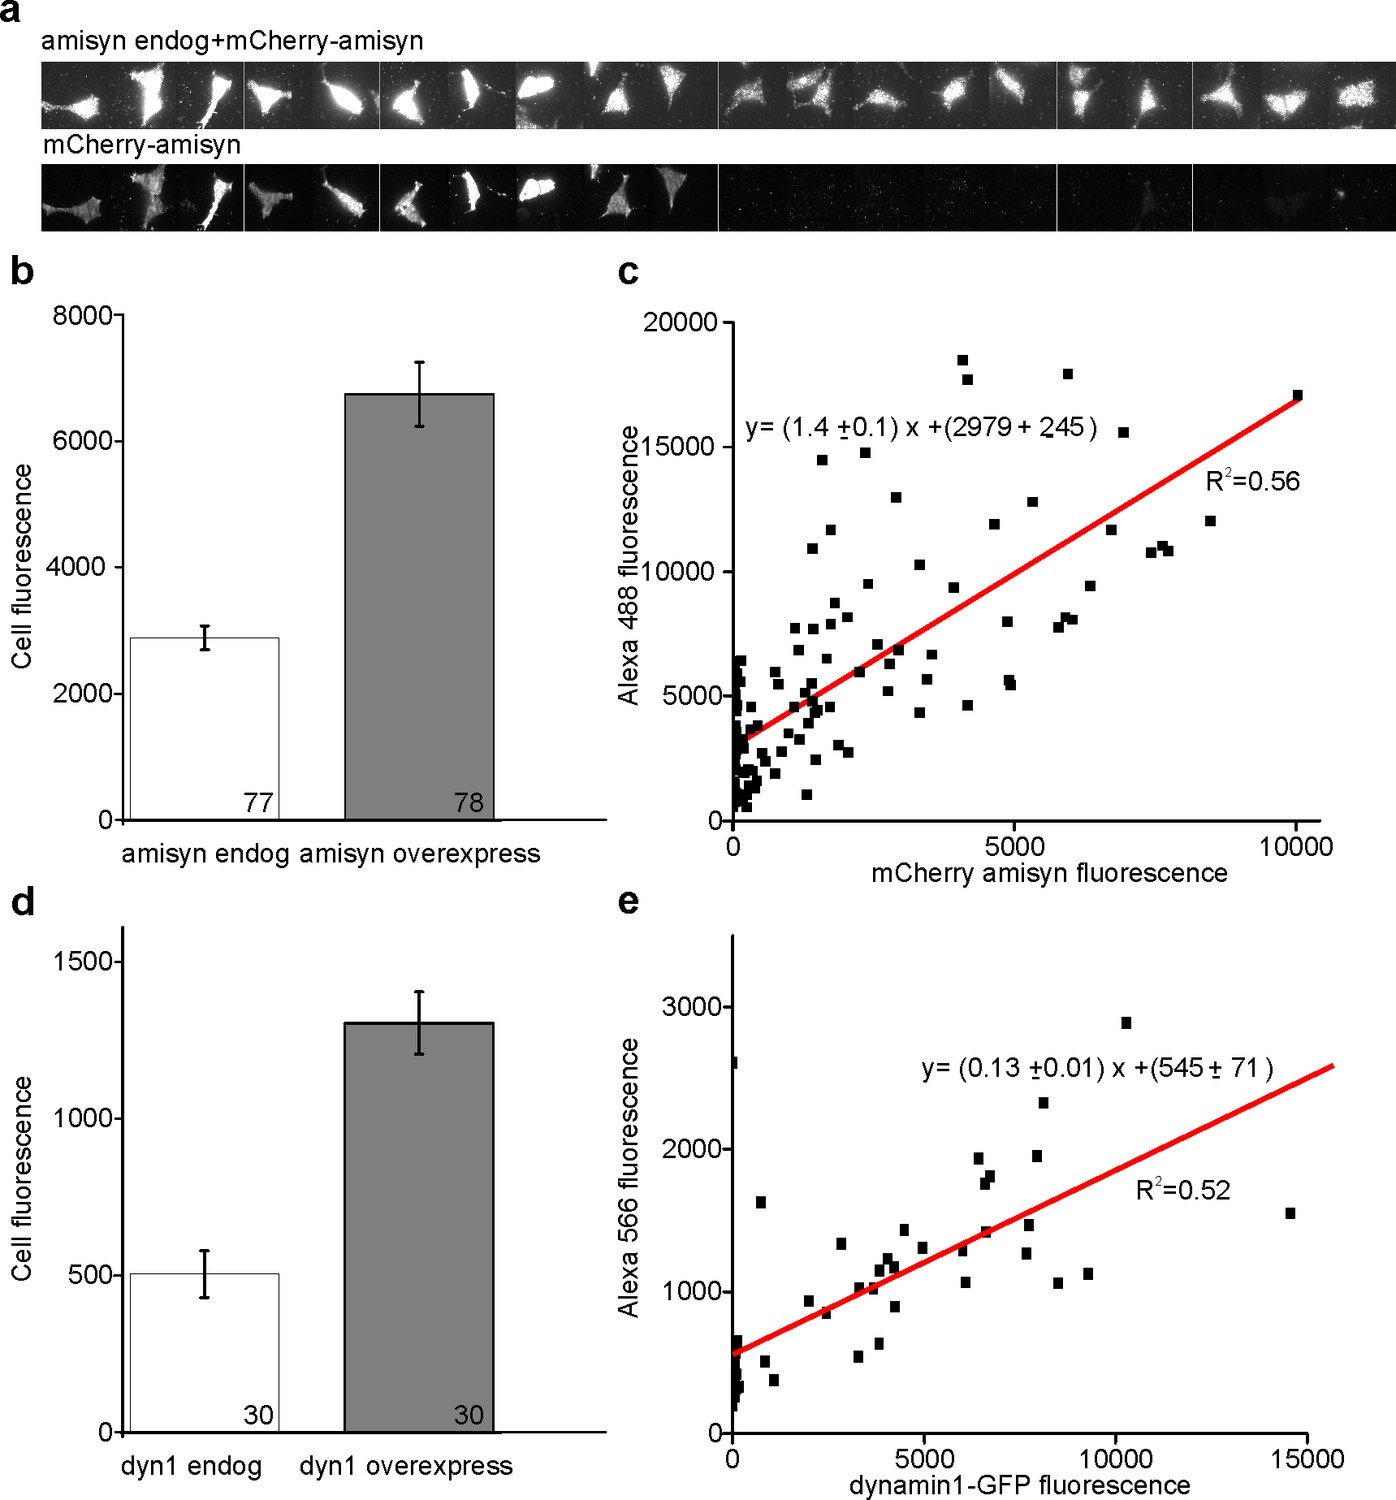
Quantification of overexpression.
Ins1-cells expressing mCherry-amisyn or dynamin1-GFP were fixated and immunostained using anti-amisyn or anti-dynamin1 and fluorescence was quantified for both labels by TIRFM of single cells. (a) Example images of immunostaining (upper) and mCherry-amisyn (lower). (b) Average fluorescence (cell-background) for immunostaining (white) and mCherry-amisyn (gray). (c) Plot of mCherry-amisyn vs immunostaining fluorescence; each symbol represents one cell. The offset at the y-axis corresponds to cells that only express endogenous amisyn. (d–e) as b-c but for dynamin1.
Figure 7
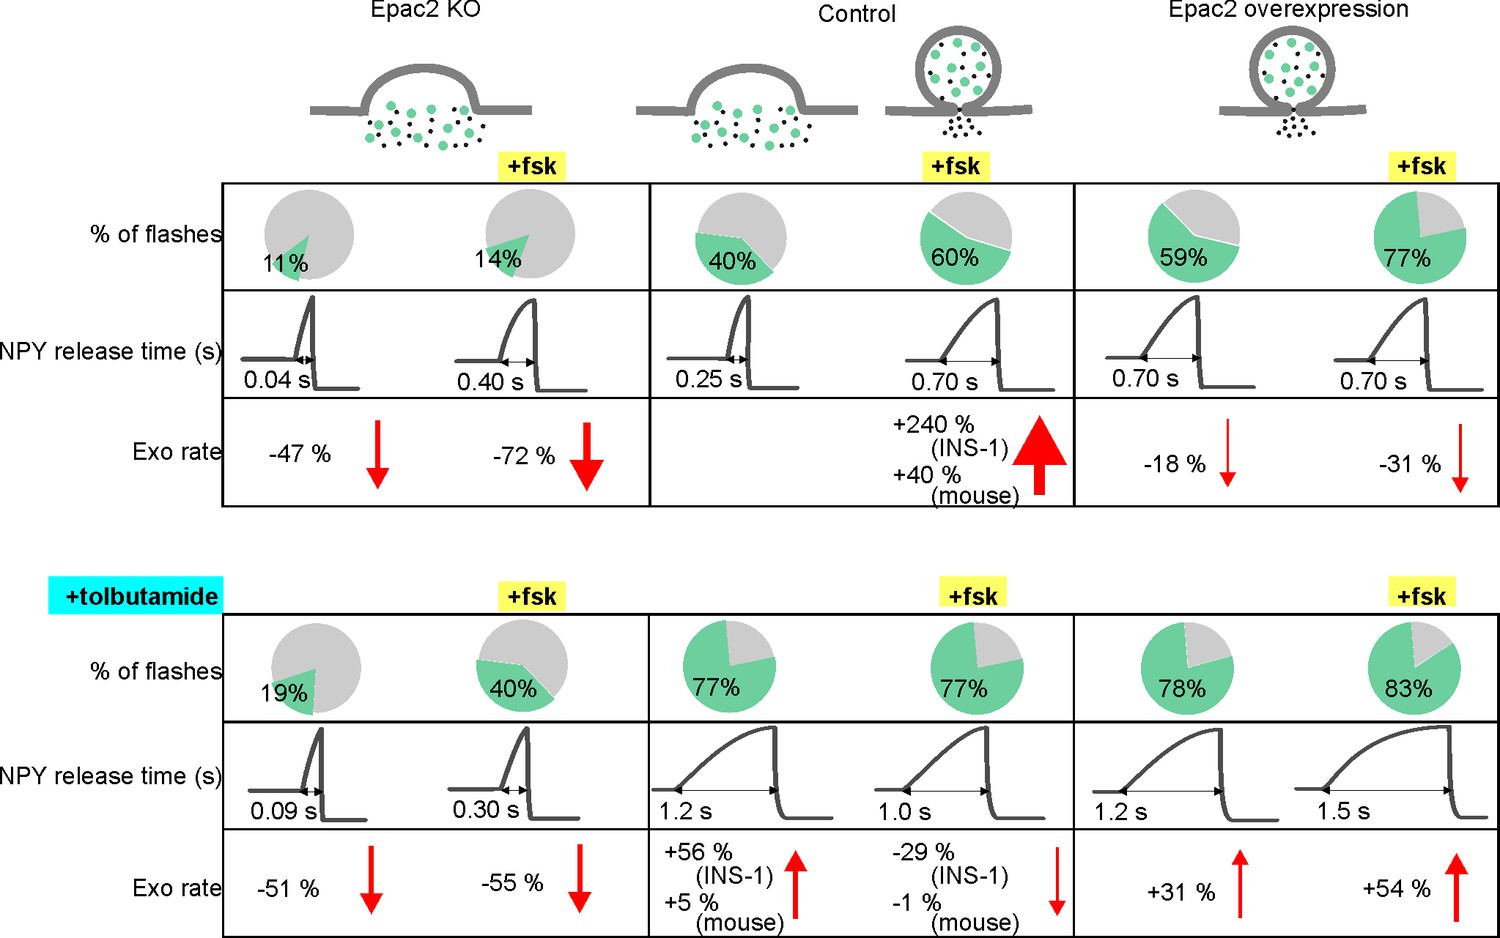
Summary of fusion pore characteristics.
Fraction of events with restricted fusion pores, NPY release time and exocytosis rate for Epac2 KO (first column), controls (second column) and with Epac2 overexpression (third column) in absence (upper rows) and presence of tolbutamide (bottom rows). Changes in exocytosis are compared to controls without (left half columns) or with (right half columns) forskolin. See Figure 7—source data 1 for details.
-
Figure 7—source data 1
- https://doi.org/10.7554/eLife.41711.015
Author response image 1
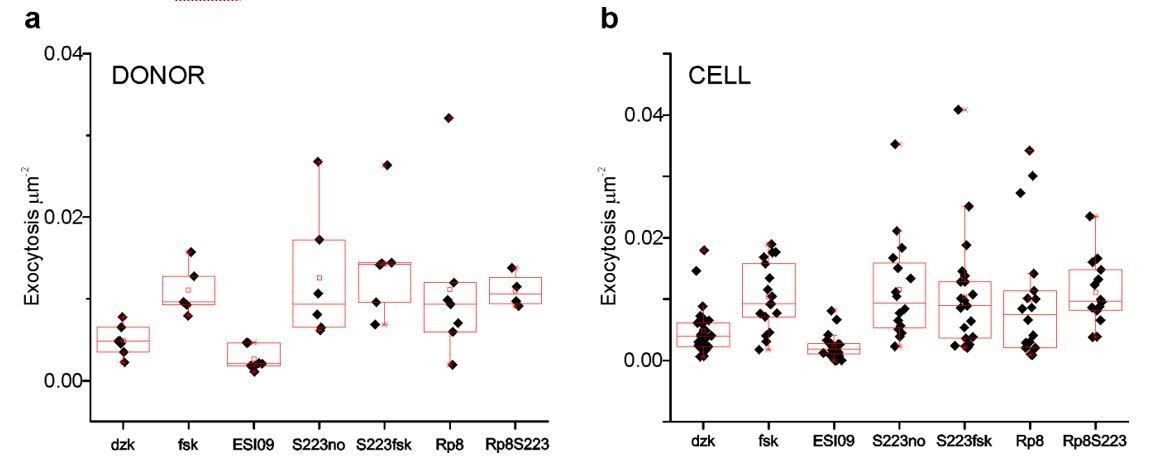
K+-stimulated exocytosis in the indicated conditions.
In (a) each symbol represents the average of a donor, in (b), each symbol represents one cell.
Author response image 2
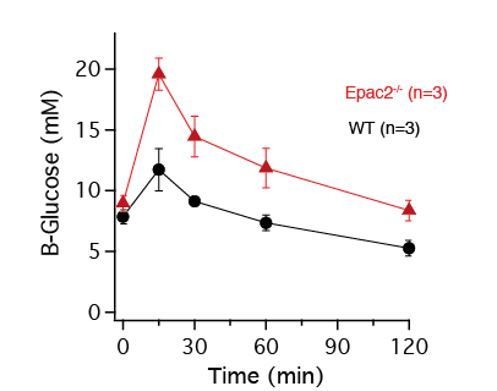
Means ± s.e.m. for blood glucose during intraperitoneal glucose tolerance tests in three 10-11-month-old wild type and Epac2-deficient mice.
Author response image 3
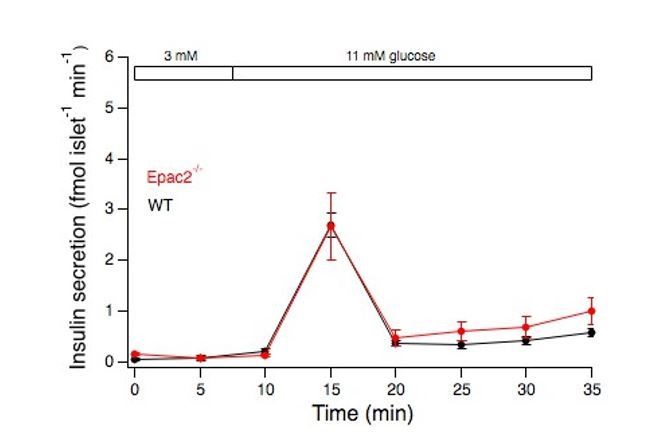
Means ± s.e.m. for insulin from isolated islets stimulated by an elevation of the glucose concentration from 3 to 11 mM.
N=4 mice for each genotype.
Author response image 4

Means ± s.e.m. for blood for insulin from isolated islets stimulated by an elevation of the glucose concentration from 3 to 20 mM and addition of 10 nM glucagon.
N=3 mice for each genotype.
Author response image 5
Tables
Key resources table
| Reagent or Resource | Designation | Source of Reference | Identifiers | Additional Information |
|---|---|---|---|---|
| Strain, strain background (Adenovirus) | NPY-Venus | P Rorsman (Oxford) | ||
| Strain, strain background (Adenovirus) | NPY-tdmOrange2 | this paper | See Constructs in Materials and methods | |
| Genetic reagent (Mus musculus) | Rapgef4 KO and WT | (Kopperud et al., 2017) | ||
| Cell line (Rattus norvegicus domesticus) | INS-1 Clone 832/12 | (Hohmeier et al., 2000) | RRID:CVCL_7226 | H Mulder (Malmö) |
| Transfected construct (Mus musculus) | EGFP-Epac2 | (Idevall-Hagren et al., 2013) | 1068 | |
| Transfected construct (Homo sapiens) | NPY-tdmOrange2 | (Gandasi et al., 2015) | 1140 | |
| Transfected construct (Rattus norvegicus) | P2X2-mRFP1 | (Obermüller et al., 2005) | 1226 | |
| Transfected construct (Homo sapiens) | NPY EGFP mCherry | this paper | See Constructs in Materials and methods | |
| Transfected construct (Homo sapiens) | Cherry2-amisyn | This paper | NM_001351940.1; 1286 | See Constructs in Materials and methods |
| Transfected construct (Homo sapiens) | dynamin1-GFP | W Almers (Portland) | 1342 | |
| Transfected construct (Homo sapiens) | NPY EGFP | W Almers (Portland) | 1008 | |
| Biological sample (Homo sapiens) | Human pancreatic islets | (Goto et al., 2004) | Nordic Network for Clinical Islet Transplantation Uppsala | |
| Antibody | Rabbit polyclonal anti-amisyn | ab153974 abcam | 1/50 | |
| Antibody | Rabbit monoclonal anti-dynamin1 | ab52852 abcam | PMID:28171750 | 1/50 |
| Chemical compound, drug | Cell dissociation buffer | Thermo Fisher | 13150016 | |
| Chemical compound, drug | Trypsin solution | Thermo Fisher | 12604–021 | |
| Chemical compound, drug | Lipofectamine 2000 | Thermo Fisher | 11668–019 | |
| Chemical compound, drug | Forskolin; Fsk | Sigma-Aldrich | F6886 | |
| Chemical compound, drug | Polylysine | Sigma-Aldrich | P5899 | |
| Chemical compound, drug | Exendin-4; Ex4 | Anaspec (Fremont CA) | AS-24463 | |
| Chemical compound, drug | Diazoxide | Sigma-Aldrich | D9035 | |
| Chemical compound, drug | BSA | Sigma-Aldrich | F0804 | |
| Chemical compound, drug | RPMI 1640 | SVA | 992680 | |
| Chemical compound, drug | L-Glutamine | Hyclone | SH30034.01 | |
| Chemical compound, drug | Tolbutamide; tolb | Sigma-Aldrich | 64-77-7 | |
| Chemical compound, drug | Glibenclamide; glib | Hoechst | ||
| Chemical compound, drug | Gliclizide; gliz | Sigma-Aldrich | 21187-98-4 | |
| Chemical compound, drug | S223 | Biolog | B 056–01 | |
| Software, algorithm | MetaMorph | Molecular Devices |
Additional files
-
Transparent reporting form
- https://doi.org/10.7554/eLife.41711.016
Download links
A two-part list of links to download the article, or parts of the article, in various formats.
Downloads (link to download the article as PDF)
Open citations (links to open the citations from this article in various online reference manager services)
Cite this article (links to download the citations from this article in formats compatible with various reference manager tools)
Fusion pore regulation by cAMP/Epac2 controls cargo release during insulin exocytosis
eLife 8:e41711.
https://doi.org/10.7554/eLife.41711


