Munc18-1 catalyzes neuronal SNARE assembly by templating SNARE association
- Yale University School of Medicine, United States
- Princeton University, United States
- University of California, San Diego, United States
Figures
Figure 1
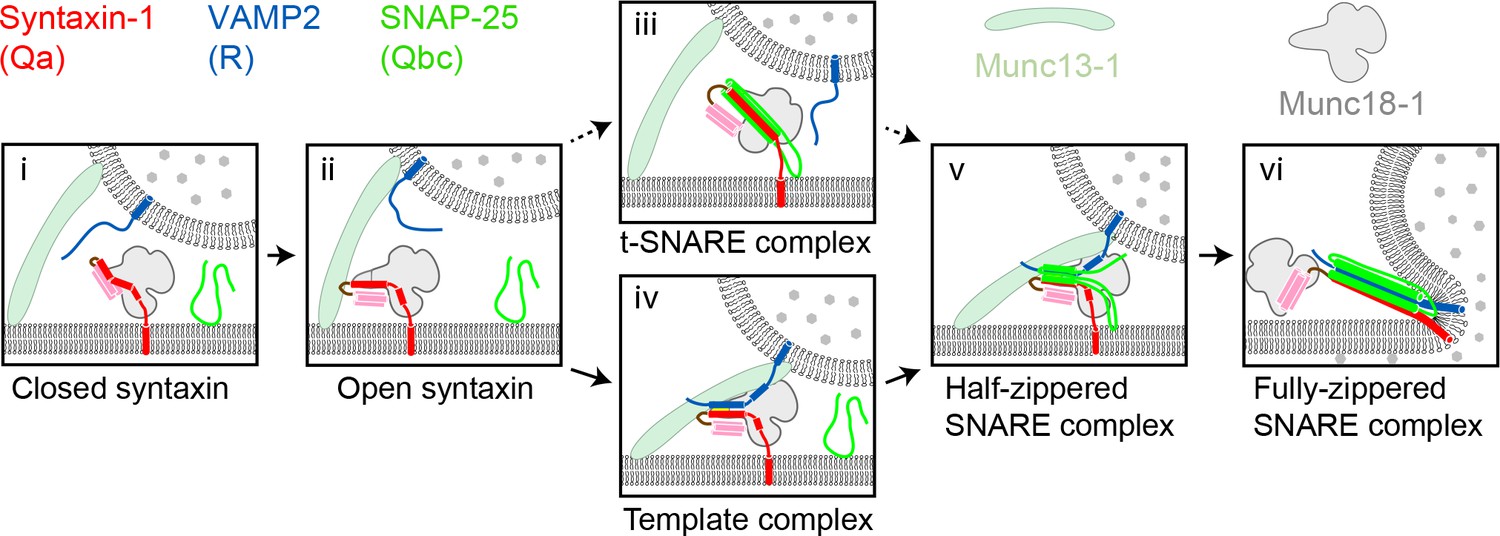
Two potential pathways for Munc18-1-regulated neuronal SNARE assembly.
(i) Munc18-1 first serves as a syntaxin chaperone and binds syntaxin to inhibit its association with other SNAREs. (ii) Closed syntaxin is opened by Munc13-1, a large multifunctional protein that also helps tether vesicles to the plasma membrane and binds, albeit with low affinity, both syntaxin and VAMP2. (iii) Open syntaxin may bind SNAP-25 to form a syntaxin:SNAP-25 or a Munc18-1:syntaxin:SNAP-25 complex. (iv) Alternatively, open syntaxin may bind VAMP2 to form a Munc18-1:syntaxin:VAMP2 template complex, as proposed here. Both complexes, (iii) and (iv), have been proposed to be ‘activated’ for SNARE assembly. (v) and (vi) Other factors such as synaptotagmin (not shown) target the half-zippered SNARE complex to enable calcium-triggered further SNARE zippering and vesicle fusion.
Figure 2 with 7 supplements
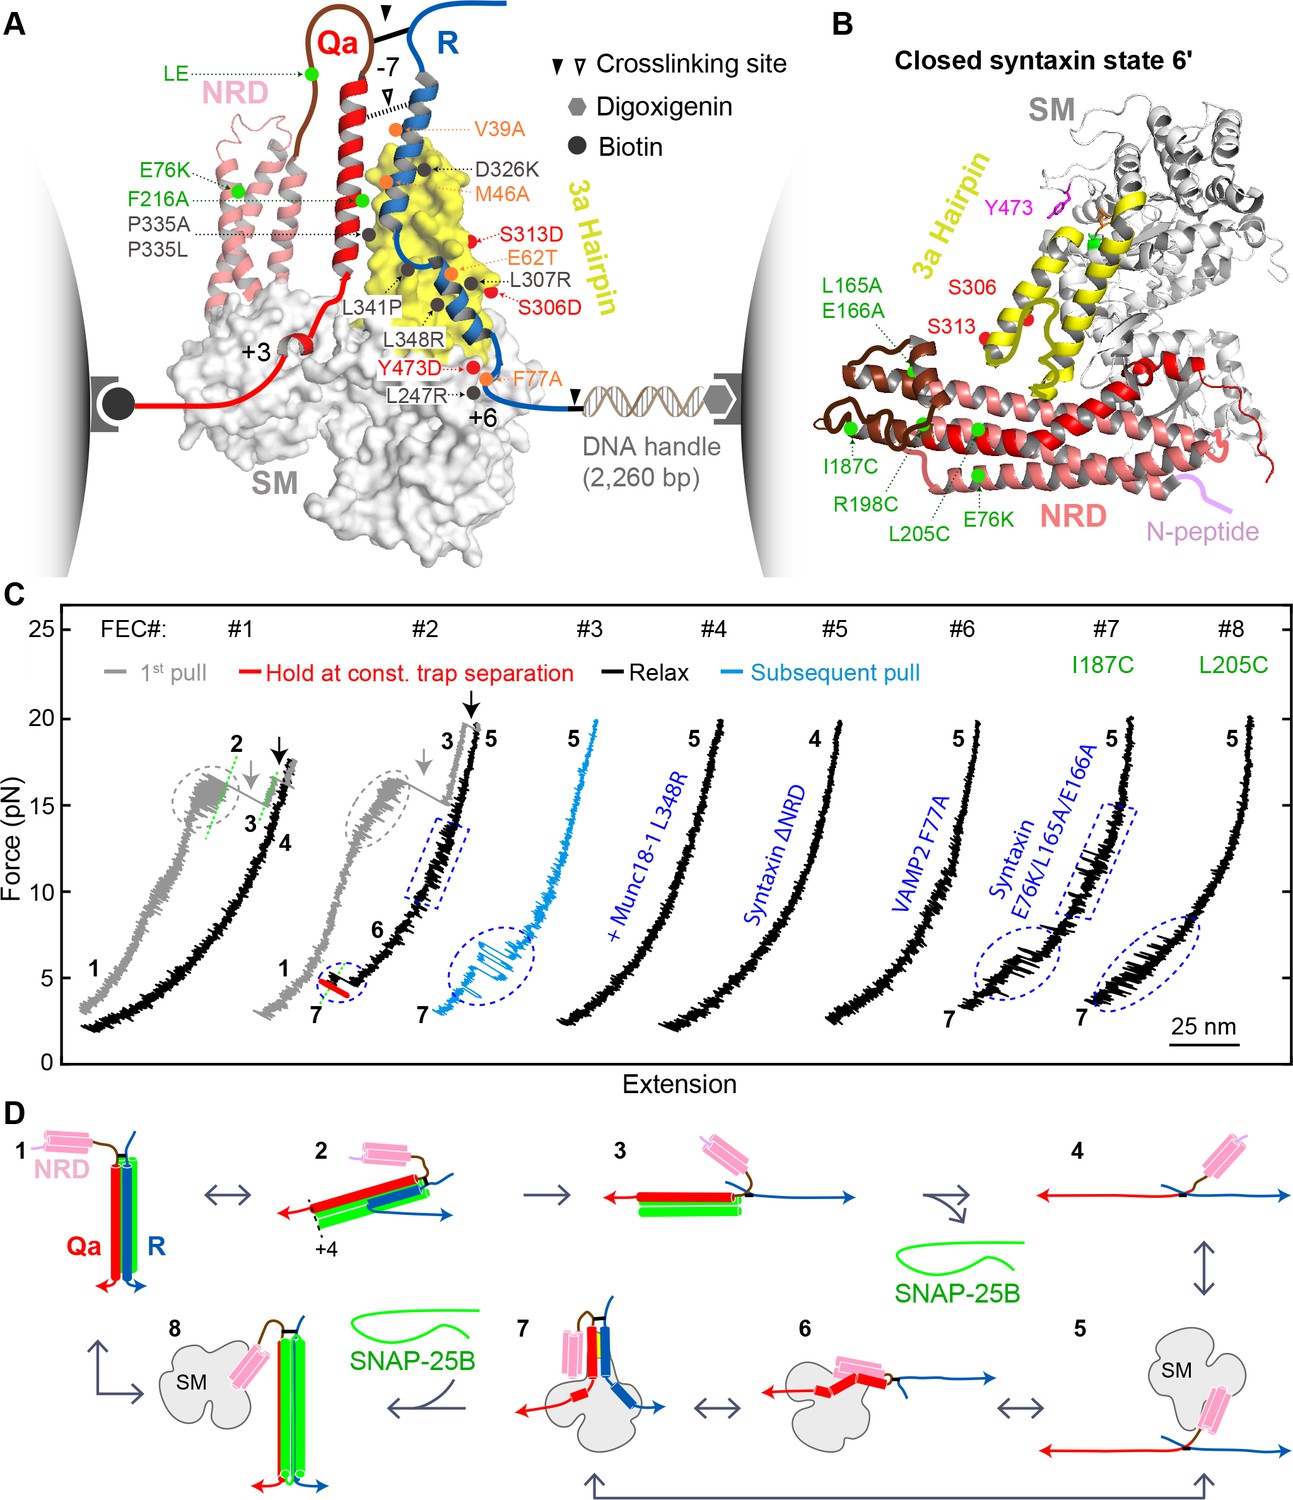
Single-molecule manipulation based on optical tweezers revealed a ternary template complex.
(A) Experimental setup and structural model of the template complex. Some key mutations tested in this study are indicated by dots: red (phosphomimetic mutations) or gray (others) for Munc18-1, green for syntaxin, and orange for VAMP2. The helical hairpin of Munc18-1 domain 3a is highlighted in yellow. The NRD of syntaxin comprises an N-peptide (a.a. 1–26, see B), a three-helical Habc domain (27–146, deep salmon), and a linker region (147–199, brown). The structural model of the template complex is derived from a similar model of Vps33:Vam3:Nyv1 (Baker et al., 2015) by extending the N-terminal helix of the R-SNARE to the −7 layer, as justified herein. The NRD stabilizes the template complex, but its positioning in this model is arbitrary. See also Figure 2—figure supplement 1. (B) Crystal structure of closed syntaxin bound to Munc18-1 (PDB ID 3C98) (Misura et al., 2000). Highlighted are crosslinking sites (I187, R198, and L205), sites of mutations used to destabilize closed syntaxin (E76K, L165A, and E166A, green dots), and sites of phosphomimetic mutations (red dots and Y473). (C) Force-extension curves (FECs) obtained in the absence (#1) or presence (other FECs) of Munc18-1 in solution. Throughout the figures, all FECs are color coded in the same fashion: gray for pulling the initial purified SNARE complex, blue for subsequent pulls, black for relaxation, and red for holding the system at constant force. The states associated with different extensions (marked by green dashed lines as needed) are numbered as in Figure 2D. CTD transitions are indicated by gray ovals, NTD unfolding by gray arrows, t-SNARE unfolding by black arrows, syntaxin transitions by blue rectangles, and template complex transitions by blue ovals. See also Figure 2—figure supplement 2 and Figure 2—source datas 1 and 2 in Dataset 1. (D) Schematic diagrams of different states: 1, fully assembled SNARE complex; 2, half-zippered SNARE bundle; 3, t-SNARE complex; 4, fully unfolded SNARE motifs; 5, unfolded SNARE motifs with Munc18-1 bound; 6, partially closed syntaxin; 7, template complex; and 8, Munc18-1-bound assembled SNARE complex. In states 2 and 3, the t-SNARE complex is ordered up to the +4 layer (Gao et al., 2012; Ma et al., 2015; Zhang et al., 2016b). The states are numbered according to the same convention throughout the text and figures.
-
Figure 2—source data 1
MATLAB figure for the FECs shown in Figure 2C.
- https://doi.org/10.7554/eLife.41771.011
-
Figure 2—source data 2
Complete time-dependent instantaneous force, extension, and trap separation obtained in a representative single-molecule experiment in the presence of WT 2 µM Munc18-1.
Data here correspond to Figure 2C (FECs #2–3) and Figure 2—figure supplement 2.
- https://doi.org/10.7554/eLife.41771.012
Figure 2—figure supplement 1
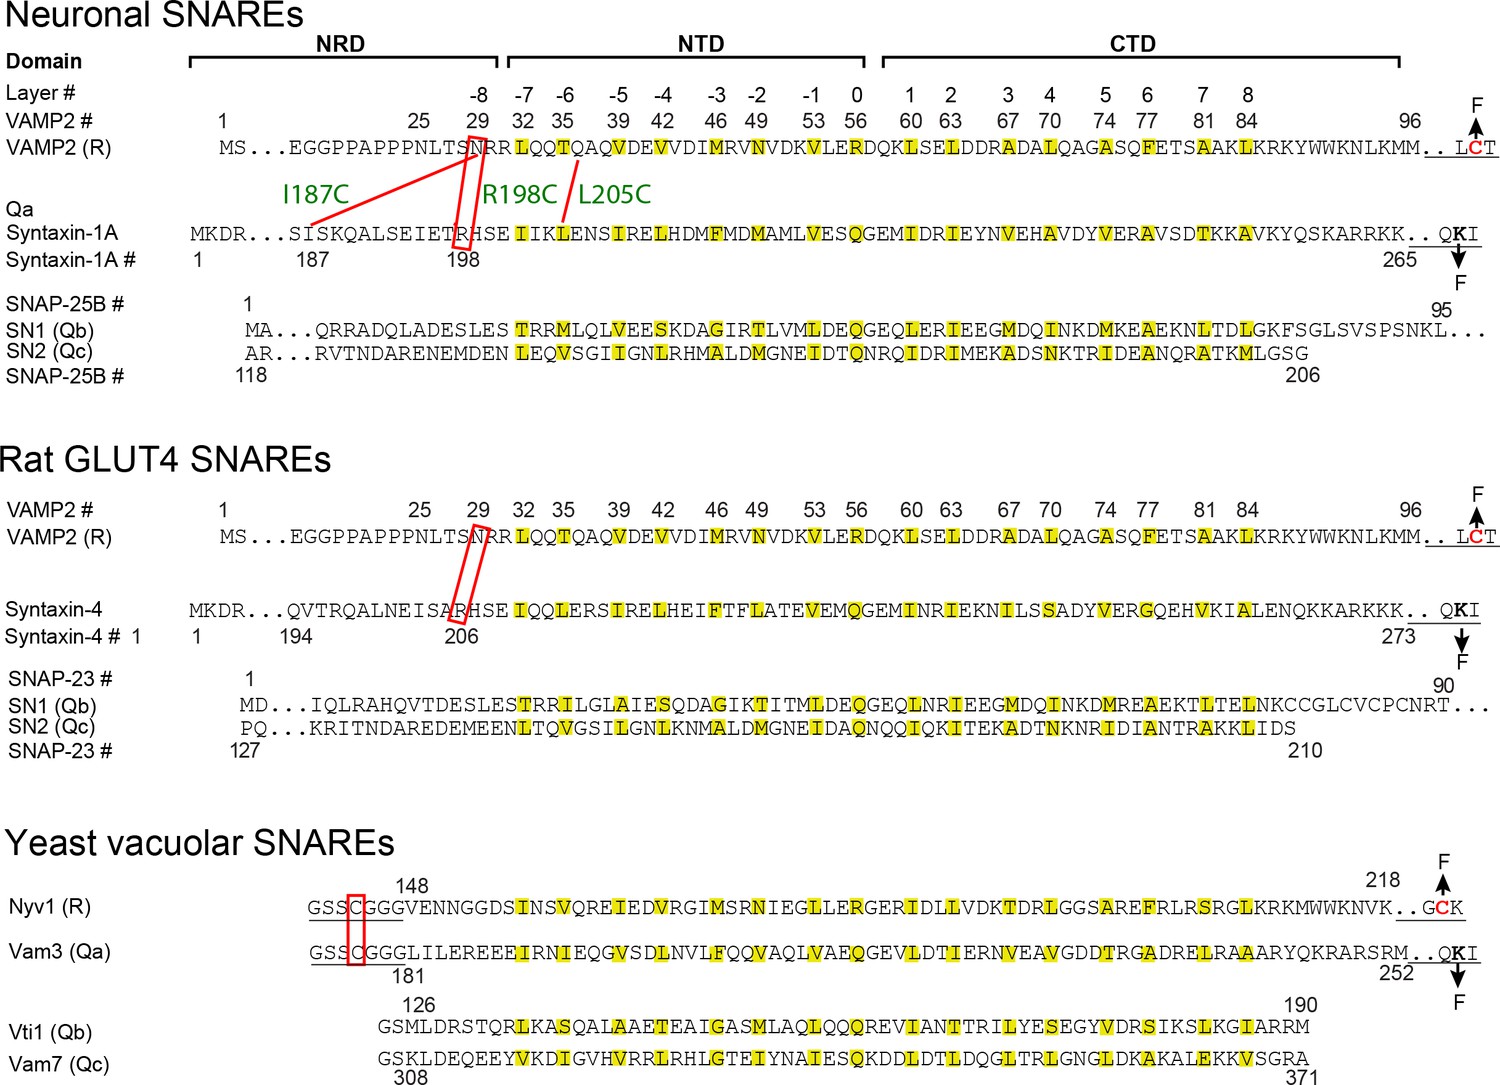
Sequences, domains, and crosslinking sites of the SNARE proteins used in this study.
The amino acids in hydrophobic layers (from −7 to +8) and the central ionic layer (0 layer) are colored yellow. The underlined sequences are added to facilitate crosslinking of Qa and R SNAREs, crosslinking of R SNAREs to DNA handles, and attachment of Qa SNAREs to bead surfaces (Figure 2A). The pulling sites are indicated by arrows labeled by F (for Force). The crosslinking sites are indicated by red rectangles or red lines. For neuronal SNAREs, the three crosslinking sites tested are designated by their corresponding syntaxin residues (R198C, I187C, and L205C, Figure 2B,C). N-terminal crosslinking facilitated formation of the template complex by destabilizing the closed syntaxin, increasing the local SNARE concentrations, and minimizing nonspecific Munc18-1-VAMP2 and SNARE-SNARE interactions (Brunger, 2005; Lai et al., 2017; Sitarska et al., 2017); see the Materials and methods section ‘Estimation of the affinity between VAMP2 and Munc18-bound syntaxin in the absence of crosslinking’ for additional discussion. To facilitate assembly of the Qa-R conjugate and the SNARE-DNA tether, we typically crosslinked the Qa- and R-SNAREs in purified SNARE complexes and then removed the Qbc-SNAREs by unfolding the complexes. The force-extension curves (FECs) corresponding to the first pull to unfold these pre-assembled SNARE complexes are shown in gray throughout the text.
Figure 2—figure supplement 2
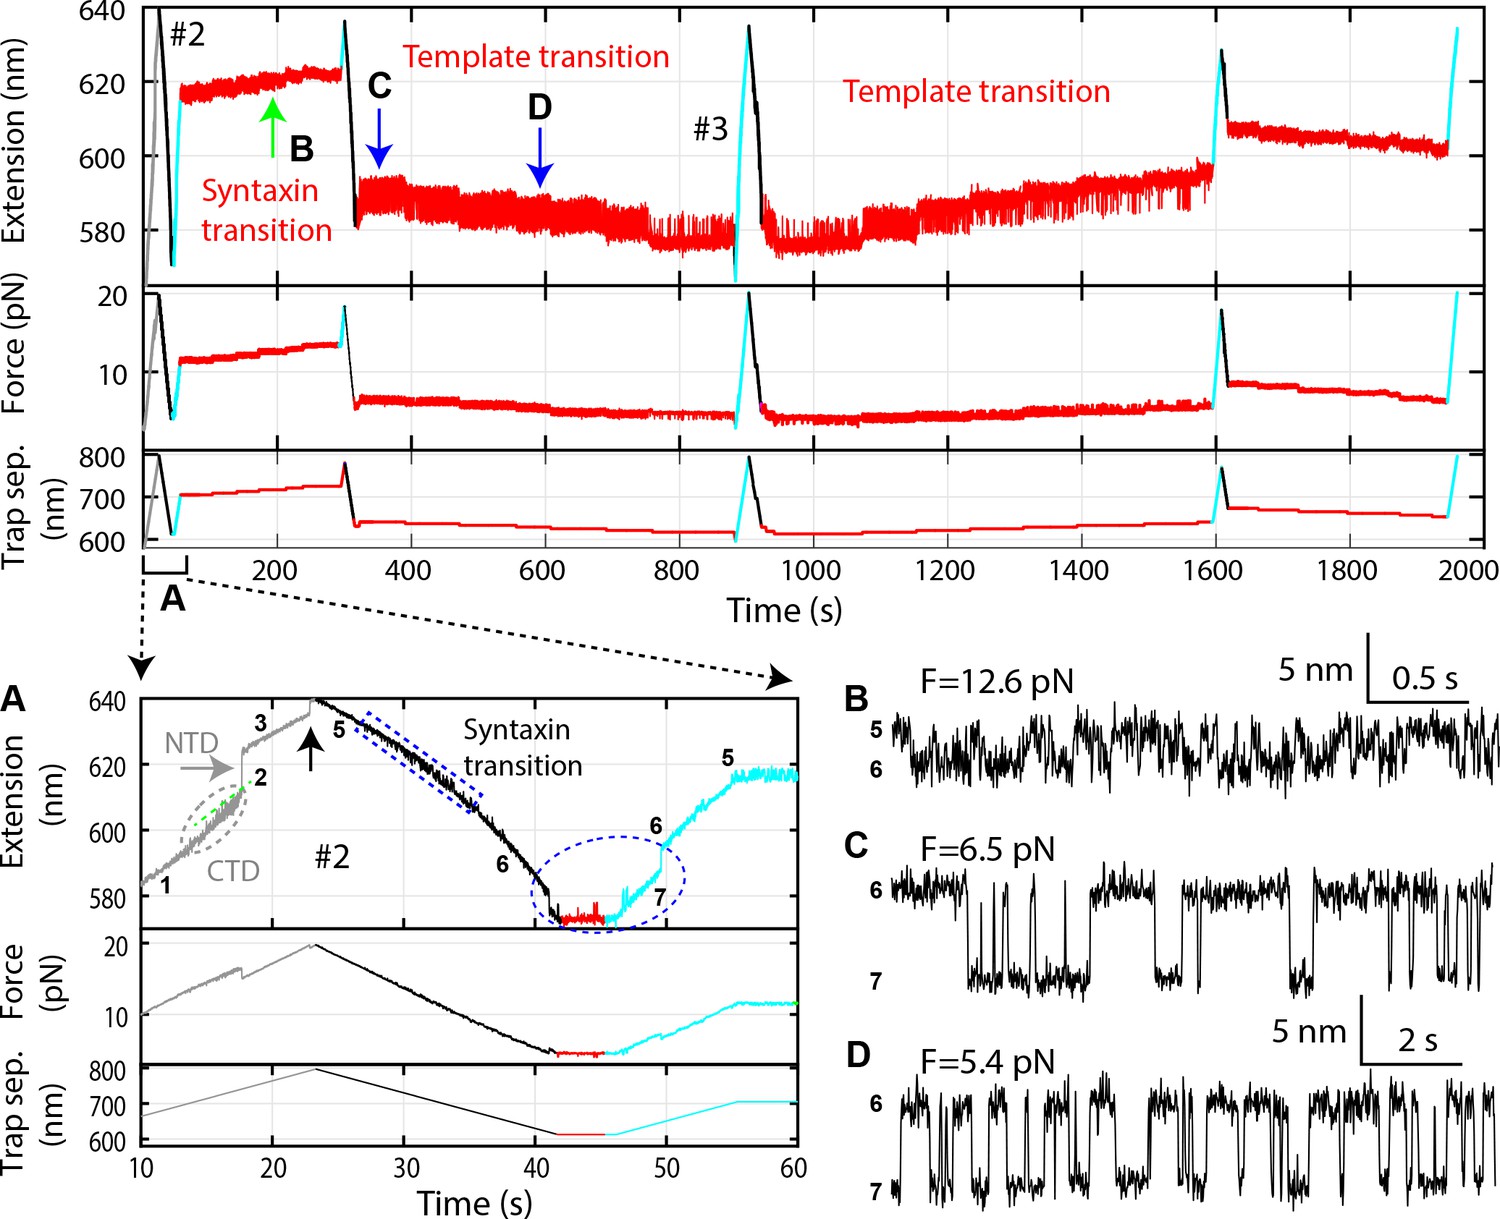
Time-dependent extension (top panel), force (middle panel), and trap separation (bottom panel) for a typical experiment to test template complex formation (Figure 2—source data 2).
Data here and FECs #2 and #3 in Figure 2C are acquired on the same Qa-R SNARE conjugate, with the same pulling round numbering. Close-up views of different time regions indicated by A-D are shown: (A) Close-up view of the first round of pulling and relaxation. Regions of characteristic transitions are indicated: the CTD transition by the gray oval, the NTD unfolding by the gray arrow, the t-SNARE complex unfolding and SNAP-25B dissociation by the black arrow, the syntaxin open-partial closing transition by the blue rectangle, and the template complex transition by the blue oval. States associated with different extensions are indicated by the corresponding state numbers (Figure 2D). Note that binding of Munc18-1 to the NRD in state five did not cause any change in the extension of the Qa-R conjugate compared to the state 4, thus could not directly be detected by our assay. (B) The extension-time trajectory demonstrates reversible partial closing of syntaxin at a constant mean force of 12.6 pN. (C–D) Extension-time trajectories at two constant trap separations or mean forces showing reversible folding and unfolding of the template complex. Throughout the figures, all FECs and time-dependent trajectories were mean-filtered with a time window of 10 ms, except for the extension-time trajectories with syntaxin opening-partial closing transitions, which were filtered with a time window of 3 ms.
Figure 2—figure supplement 3
Extension-time trajectories at two constant mean forces showing the opening-closing transition of the partially closed syntaxin molecule.
https://doi.org/10.7554/eLife.41771.006
Figure 2—figure supplement 4
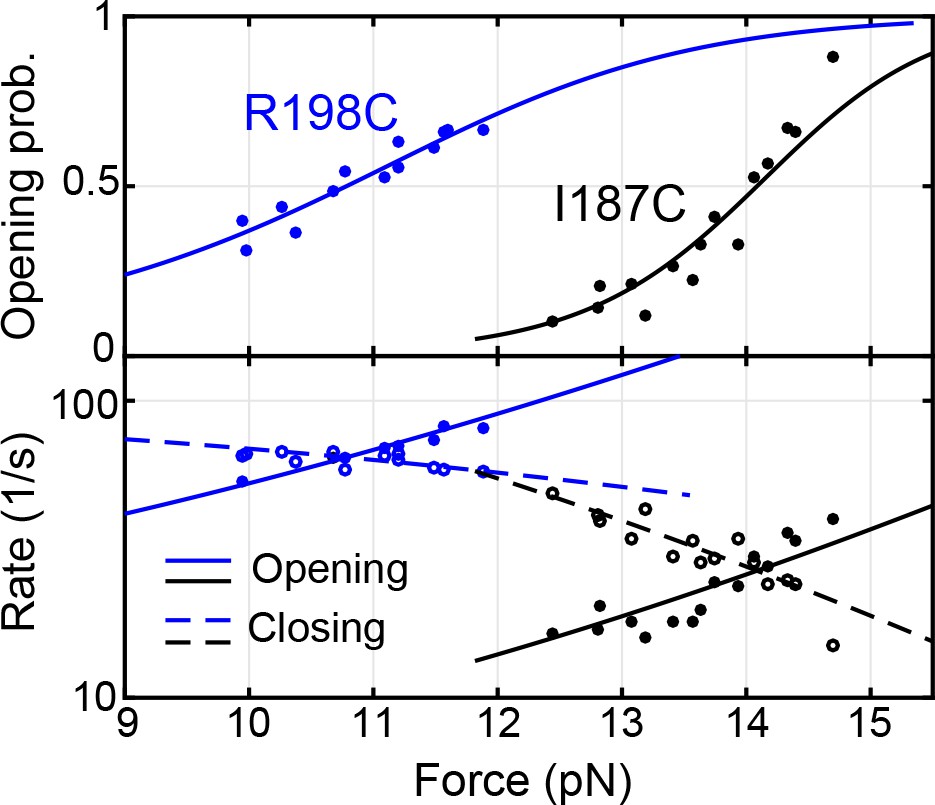
Force-dependent syntaxin opening probabilities (top panel) and opening and closing rates (bottom panel) obtained by pulling syntaxin from the two N-terminal sites, R198C and I187C (Figure 2—figure supplement 1).
Curves are best model fits to derive the energies and kinetics at zero force associated with the transitions, with solid curves for unfolding and dashed curves for folding. The unfolding energies of the closed syntaxin (7.2 ± 0.2 kBT) and of the partially closed syntaxin (2.6 ± 0.2 kBT) are much smaller than the dissociation energy between syntaxin and Munc18-1 previously measured based on a two-state binding and unbinding process (~22 kBT) (Burkhardt et al., 2008; Sitarska et al., 2017). Our data reveal an intermediate state for the association and dissociation process, in which syntaxin is open, but Munc18-1 remains bound to syntaxin, likely to the NRD (Ma et al., 2015) (Figure 2D, state 5).
Figure 2—figure supplement 5
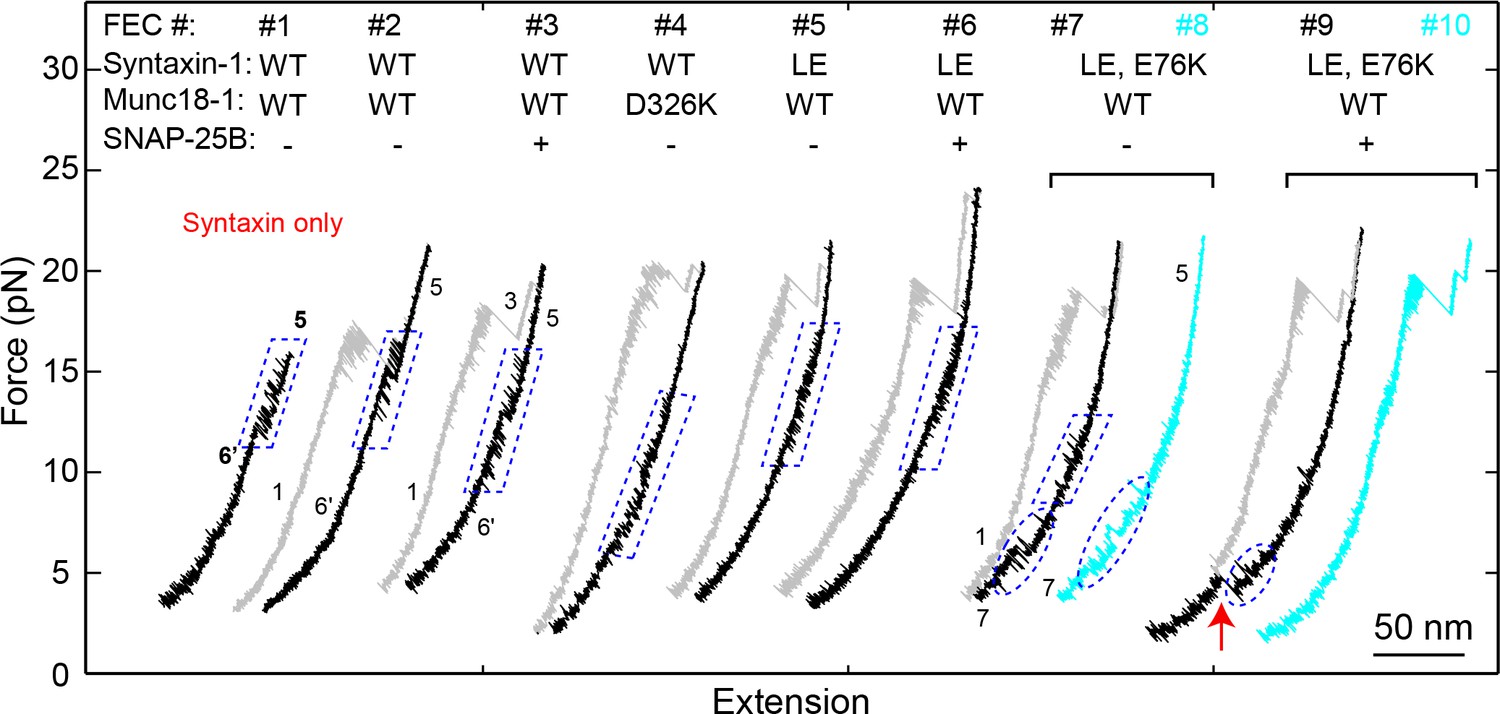
FECs of Qa only (#1) or the Qa-R SNARE conjugate (other FECs) pulled from Site I187C in the presence of 2 μM Munc18-1 without (-) or with (+) 60 nM SNAP-25B.
The wide-type (‘WT’) syntaxin-1 here denotes syntaxin-1A (a.a. 1–265, I187C, C145S; see ‘SNARE protein constructs’), with additional mutations indicated. FECs in each bracket were obtained on the same Qa-R conjugate. Different transitions are marked: blue dashed parallelograms for syntaxin opening-closing transitions, blue dashed ovals for template complex transitions, and the red arrow for SNAP-25B binding and full SNARE assembly. To pull syntaxin alone, we directly crosslinked the DNA handle to syntaxin I187C in the absence of VAMP2. The resultant FEC (#1) revealed the same high-force transition as those obtained by pulling the Qa-R conjugate crosslinked at I187C, indicating that the high-force transition indeed resulted from transition of syntaxin alone (compare to the syntaxin transition in #2–3). The WT syntaxin was fully closed by Munc18-1, which inhibited formation of the template complex (#2–3) in the absence (#2) and presence (#3) of SNAP-25B. Munc18-1 D326 stabilizes a furled loop at the tip of the 3a helical hairpin in the closed syntaxin state (Figure 2B). The mutation D326K helps unfurl the loop (Sitarska et al., 2017), which abolished the partially closed syntaxin and facilitated formation of the template complex when the Qa- and R-SNAREs were crosslinked at Site R198C (Figure 4A; Table 1). At Site I187C, D326K destabilized the closed syntaxin, but was not sufficient to open the closed syntaxin for template complex formation (#4). The LE mutation (L165A/E166A) decreased the extension change associated with the syntaxin transition (compare #5 to #1–3), indicating that the LE mutation destabilized the closed syntaxin conformation (Burkhardt et al., 2008). Nevertheless, neither template complex formation (#5 and #6) nor Munc18-1-chaperoned SNARE assembly (#6) was observed, suggesting that syntaxin with the LE mutation is still largely closed, consistent with recent results (Colbert et al., 2013). Therefore, we made an additional mutation E76K that was expected to further weaken the closed syntaxin conformation (Figure 2B). Indeed, the combined mutation partially opened the syntaxin conformation and promoted formation of the template complex, as seen from the small high force transition (#7) and appearance of the low force transition (#7 and #8), respectively. Correspondingly, Munc18-1-chaperoned SNARE assembly was observed in the presence of SNAP-25B (red arrow) in a manner that depended on the template complex (#9 and #10). Under this condition, the probabilities of detecting the partially closed syntaxin and the template complex were 0.66 and 0.39, respectively, and the probability of detecting SNARE assembly after template complex formation was 0.48.
Figure 2—figure supplement 6
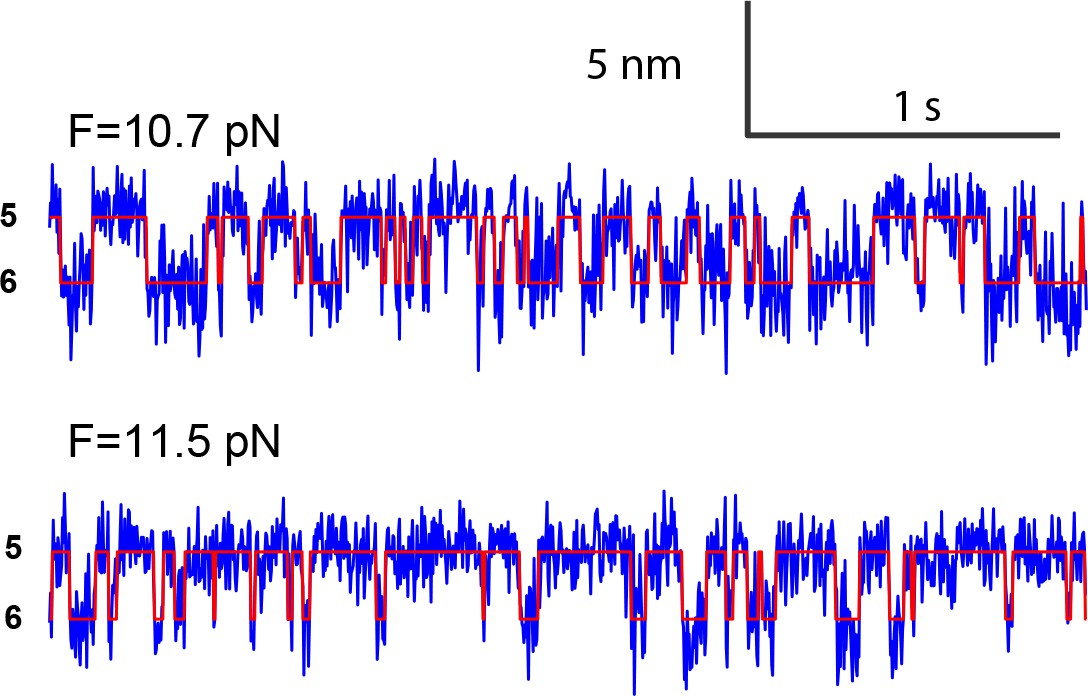
Extension-time trajectories at two constant mean forces showing the opening-closing transition of the syntaxin molecule pulled from the crosslinking site I187C (Figure 2—figure supplement 1).
The red curves are idealized state transitions derived from hidden-Markov modeling. State 6' represents the fully closed syntaxin (Figure 2B).
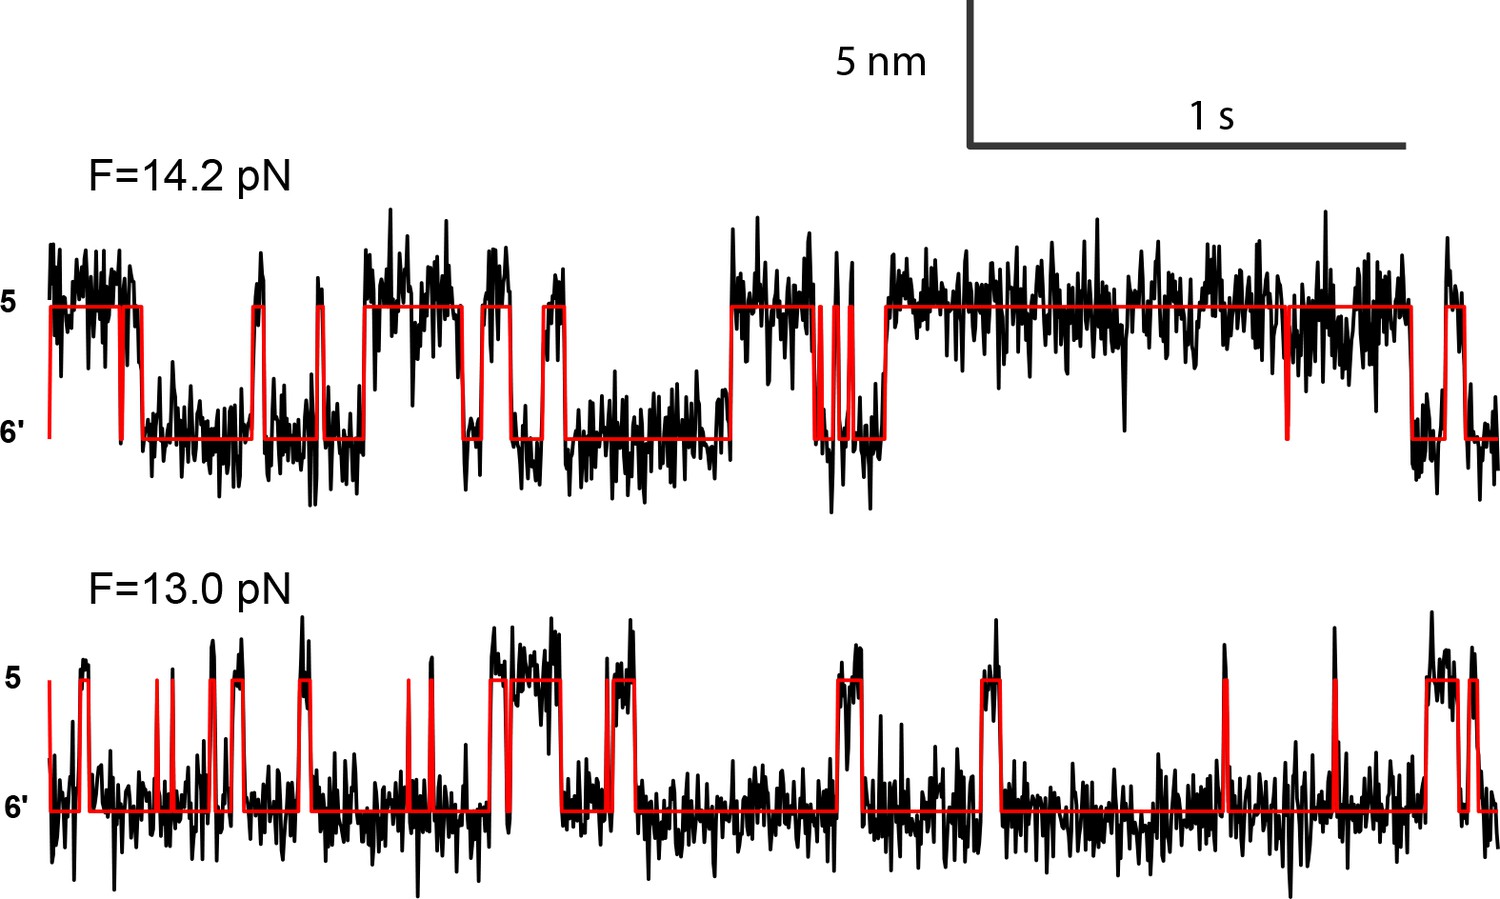
Figure 2—figure supplement 7
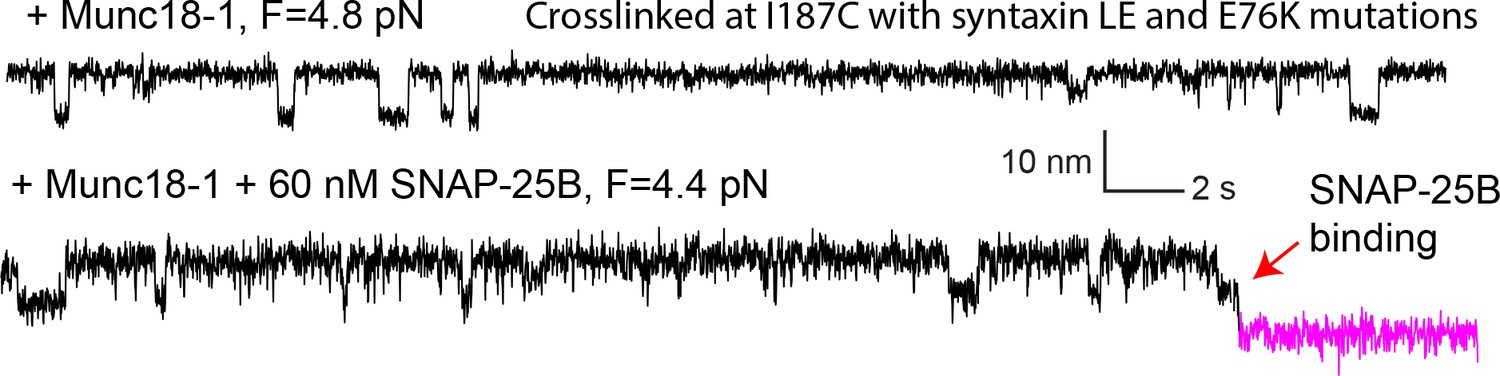
Extension-time trajectories showing conformational transitions of the template complex transition pulled from Site I187C in the absence (top trace) and presence (bottom) of 60 nM SNAP-25B.
The unfolding energy of the template complex crosslinked at I187C is estimated to be 4.8 ± 0.3 kBT, close to the unfolding energy of 5.2 ± 0.1 kBT of the template complex crosslinked at R198C. Furthermore, in the presence of SNAP-25B, the template complex facilitates SNAP-25B binding and SNARE assembly (red arrow).
Figure 3 with 3 supplements

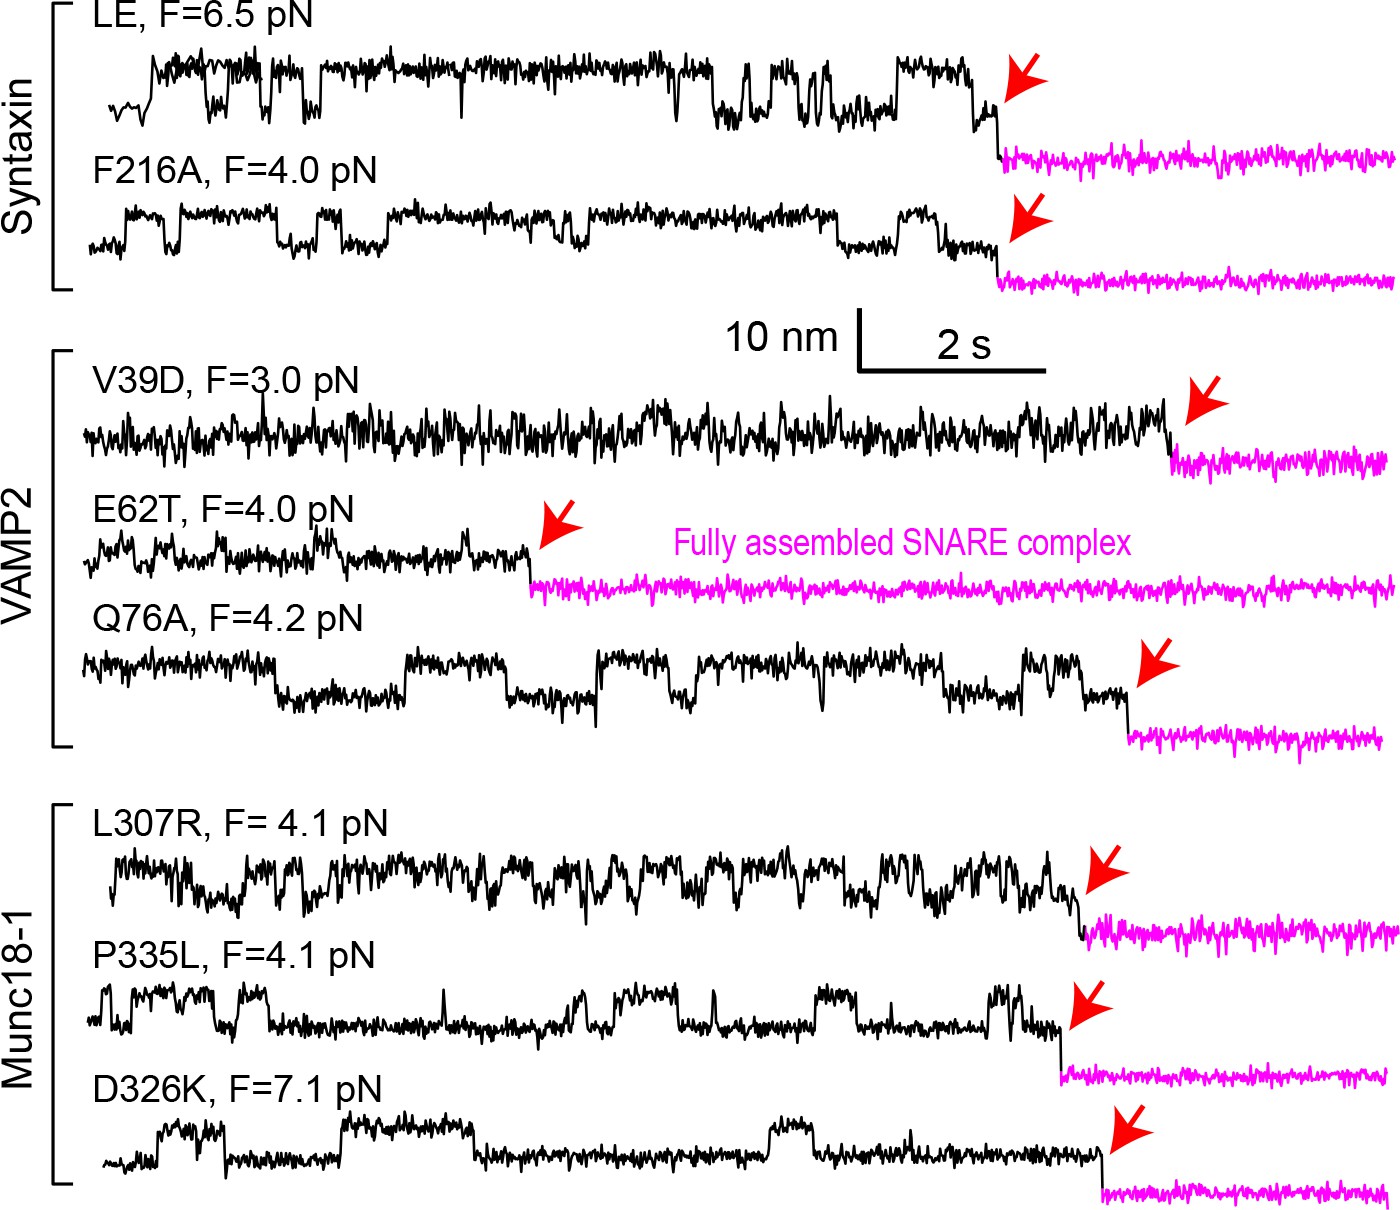
Stability, conformation, and folding kinetics of the template complex.
(A, D, E, I) Extension-time trajectories at constant mean forces with the WT template complex (A) or its variants containing indicated mutations in Munc18-1 (D), VAMP2 (E), or syntaxin (I). The red trace in A shows an exemplary idealized trajectory derived from hidden Markov modeling. Trajectories in A, D, E, and I share the same scale bars. See also Figure 3—figure supplement 1 and Figure 3—source datas 1 and 2 in Dataset 1. (B) Diagram illustrating the transition between the partially closed syntaxin state (state 6 in Figure 2D) and the template complex state (state 7); rates and energies are derived from panel C. (C) Force-dependent unfolding probabilities (top) and transition rates (bottom). Best model fits (solid and dashed curves) reveal the stability and folding and unfolding rates of the template complex at zero force (Figure 4, Table 1, and Figure 3—source data 3 in Dataset 1). (F) Structural model of VAMP2 F77 anchored in the F-pocket in Munc18-1 composed of L247 and T248, which is covered by Y473. The model was derived by superimposing the structures of Munc18-1:syntaxin (Figure 2B; 3C98) and Vps33:Nyv1 (5BV0). (G) Sequence alignment showing F-pocket sequence conservation among SM proteins. (H) Extension-time trajectory of the WT template complex at 5.7 pN. The Qa-R SNAREs were crosslinked between syntaxin L205C and VAMP2 Q36C (Figure 2A, open arrowhead). See also Figure 2—figure supplement 1 and Figure 3—source data 2 in Dataset 1.
-
Figure 3—source data 1
MATLAB figure corresponding to Figure 3A with an additional trace at force F = 5.0 pN.
- https://doi.org/10.7554/eLife.41771.019
-
Figure 3—source data 2
MATLAB figure containing expanded traces shown in Figure 3D,E,I,H.
- https://doi.org/10.7554/eLife.41771.020
-
Figure 3—source data 3
MATLAB figure for Figure 3C.
- https://doi.org/10.7554/eLife.41771.021
Figure 3—figure supplement 1

FECs obtained in the presence of 2 µM Munc18-1.
Dashed blue ovals mark template complex transitions. Note that the partially closed syntaxin state was abrogated by modifications that are known to destabilize the closed syntaxin, including syntaxin ΔNRD (Burkhardt et al., 2008), the LE mutation (Dulubova et al., 1999; Ma et al., 2011), and Munc18-1 Δ324–339, P335L, and D326K (Munch et al., 2016; Parisotto et al., 2014; Sitarska et al., 2017) (Table 1). For syntaxin LE mutation and I230G/D231G/R232G and Munc18-1 P335A and D326K, template complexes generally formed directly from the open syntaxin (Table 1).
Figure 3—figure supplement 2
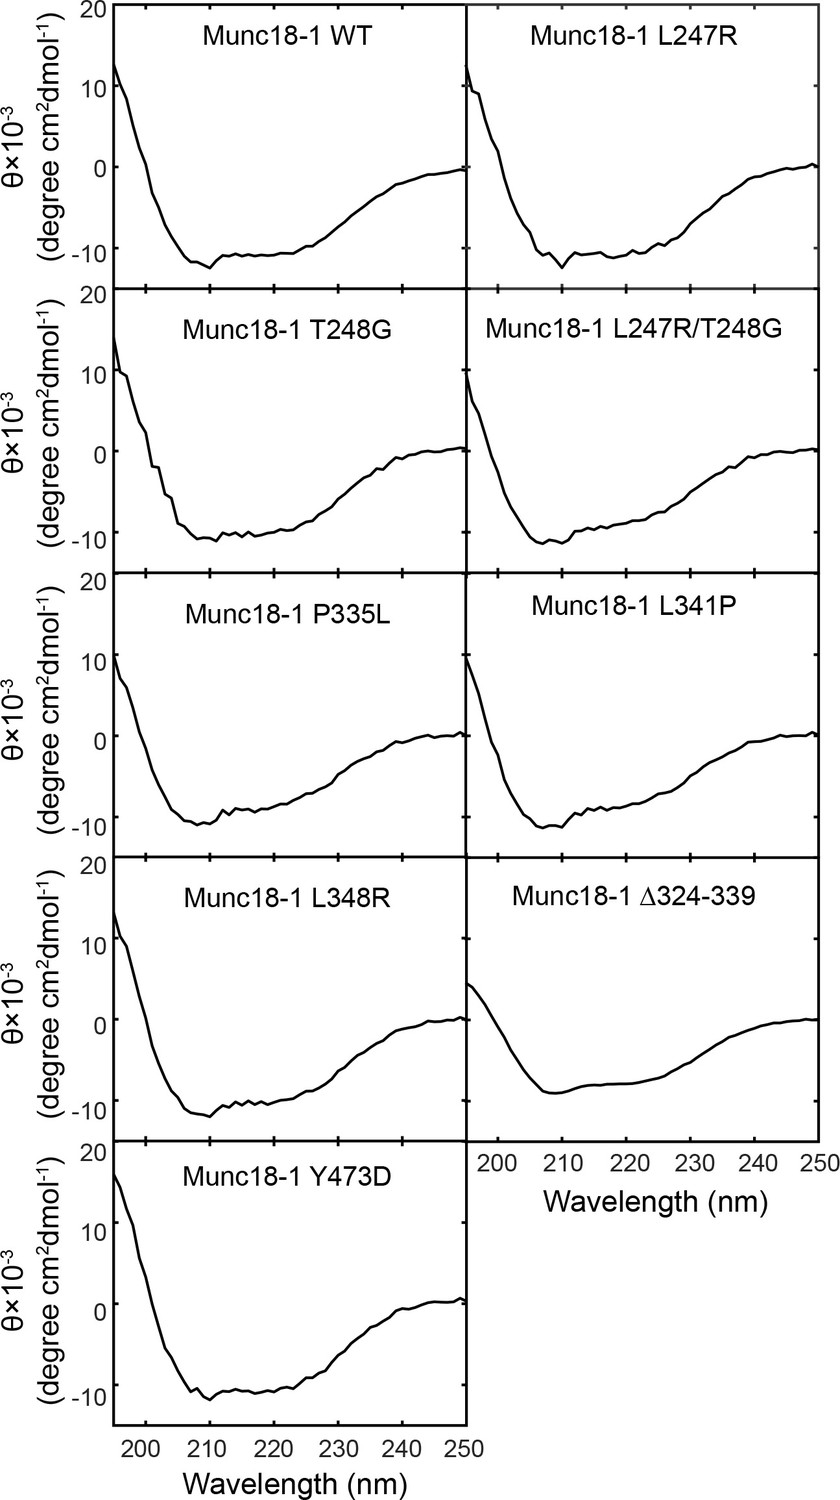
Circular Dichroism (CD) spectra show that the mutations tested in our experiments do not significantly alter Munc18-1 folding.
The CD spectra of Munc18-1 mutants that abolished or weakened the template complex are shown, including Munc18-1 F-pocket mutations L247R, T248G, L247A/T248G, disease-related mutations L341P and P335L, phosphomimetic mutation Y473D, and L348R (Parisotto et al., 2014). All the mutant proteins displayed CD spectra closely resembling that of wild-type Munc18-1. In addition, no aggregation at concentrations below 5 mg/ml was noted during the purification of these mutant proteins. These observations suggest that the overall folding of the Munc18-1 proteins are not altered by the mutations. Our results do not however rule out the possibility that some mutations may destabilize the folded protein.
Figure 3—figure supplement 3
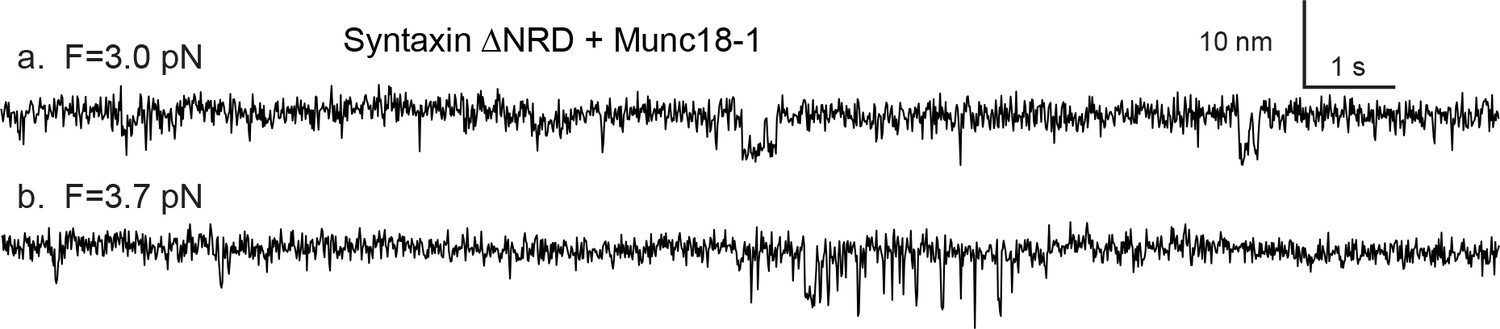
Snapshots of the extension-time trajectories at constant mean forces showing sporadic folding of the template complex in the absence of syntaxin NRD.
https://doi.org/10.7554/eLife.41771.018
Figure 4
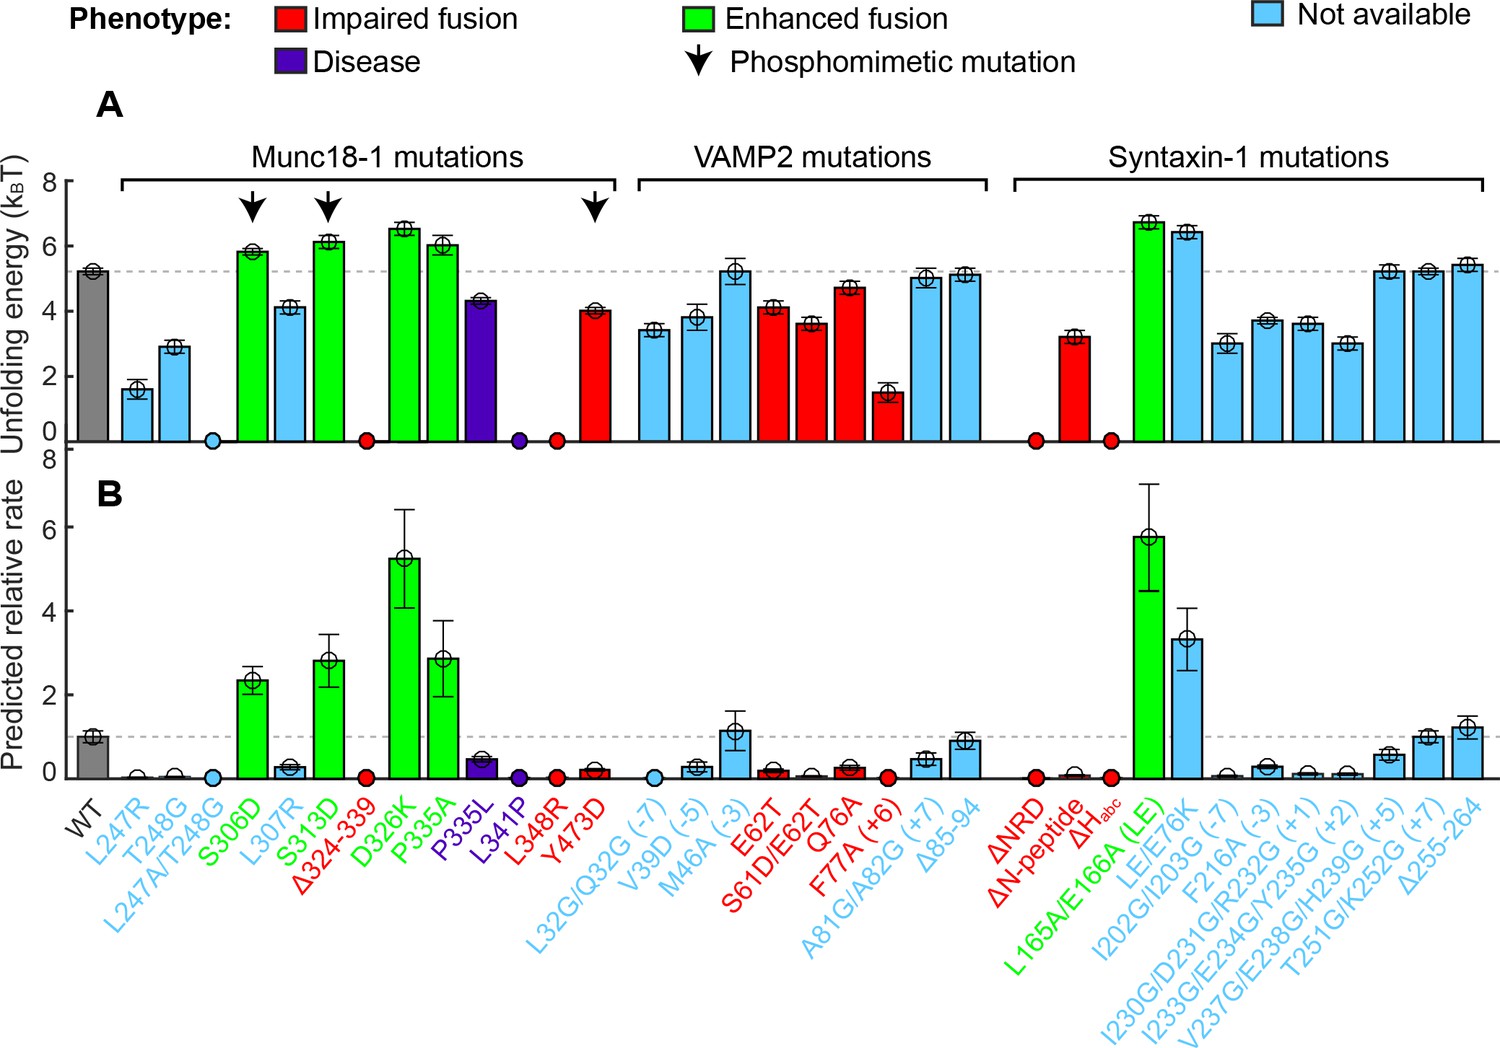
Stability of the template complex correlates with SNARE-mediated membrane fusion and neurotransmitter release.
(A) Unfolding energy of the WT and mutant template complexes; see also Table 1. Unfolding energy that is less than our detection limit (1.5 kBT) is plotted as zero. The unfolding energy is derived from the work required to reversibly unfold the template complex (Rebane et al., 2016). The work is measured as the equilibrium force multiplied by the extension change associated with the template complex transition; see also Figure 3C and Figure 3—figure supplement 1. Numbers in parentheses after SNARE mutant names indicate the layer numbers associated with the corresponding mutations. Error bars indicate standard errors of the mean. See also Figure 4—source data 1. (B) Relative rate of SNARE assembly and membrane fusion calculated using Equation 1, derived under the assumption that the rate is determined by the stability of the template complex.
-
Figure 4—source data 1
Data summary table for the results shown in Figure 4.
- https://doi.org/10.7554/eLife.41771.023
Figure 5
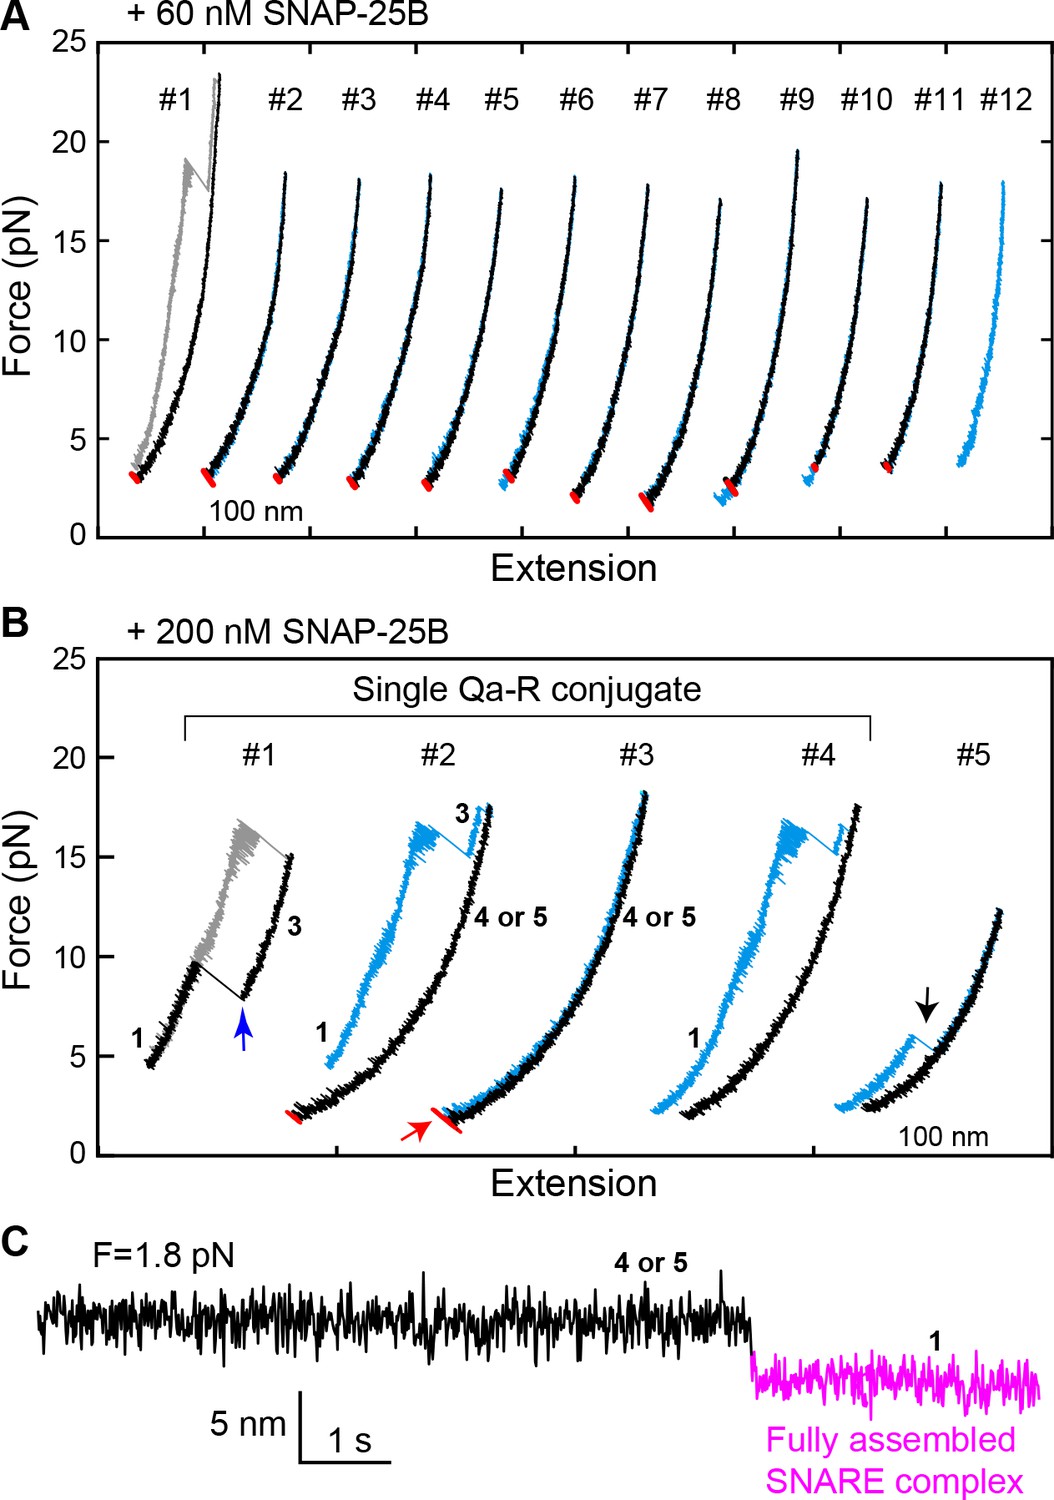
Spontaneous SNARE assembly in the absence of Munc18-1 is inefficient.
(A) Representative FECs obtained by consecutively pulling and relaxing a single Qa-R SNARE conjugate in the presence of 60 nM SNAP-25B (Figure 5—source data 1). No SNARE assembly is observed. (B) Representative FECs obtained in the presence of 200 nM SNAP-25B showing spontaneous SNARE assembly (#1–4, Figure 5—source data 2) and misassembly (#5). FECs #1–4 are from a single Qa-R SNARE conjugate. In FEC #1, the SNARE complex was relaxed just after the t- and v-SNAREs were unzipped to observe t-v zippering at low force (blue arrow). The black arrow marks disassembly of the misfolded SNARE complex. Throughout figures, red arrows indicate SNARE reassembly. (C) Extension-time trajectory exhibiting cooperative de novo SNARE assembly at a constant mean force (Figure 5—source data 3). Shown here is the spontaneous SNARE assembly observed in panel B marked by the red arrow. Throughout figures, the fully assembled SNARE state (state 1 or 8) is shown in magenta.
-
Figure 5—source data 1
MATLAB figure corresponding to Figure 5A.
- https://doi.org/10.7554/eLife.41771.025
-
Figure 5—source data 2
MATLAB figure corresponding to Figure 5B (FEC#1–4).
- https://doi.org/10.7554/eLife.41771.026
-
Figure 5—source data 3
MATLAB figure corresponding to Figure 5C.
- https://doi.org/10.7554/eLife.41771.027
Figure 6
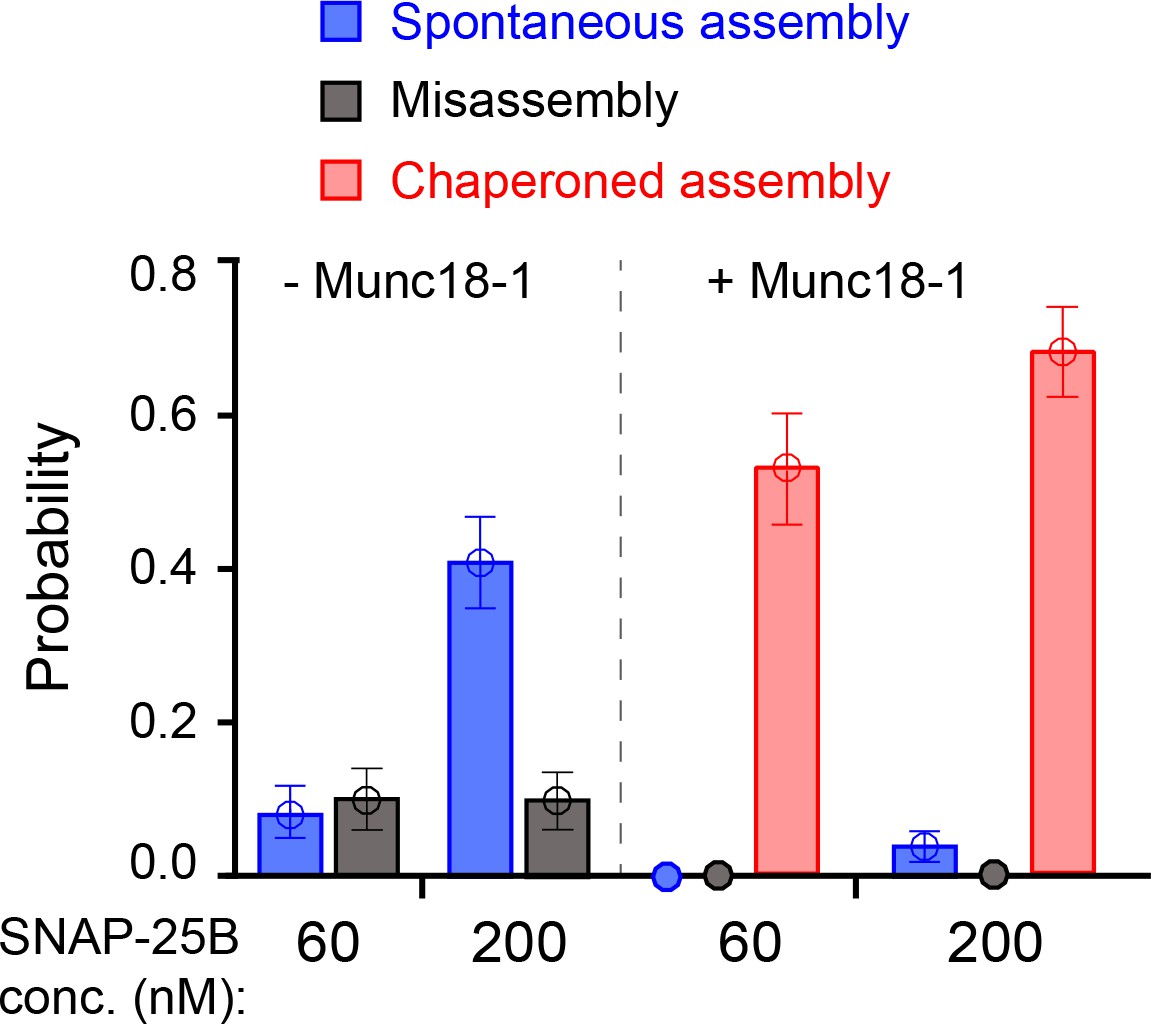
Comparison of SNARE assembly in the absence and presence of Munc18-1.
Bars indicate probabilities of Munc18-1-independent or spontaneous SNARE assembly (blue), Munc18-1-chaperoned SNARE assembly (red), and SNARE misassembly (black). See also Figure 6—source data 1.
-
Figure 6—source data 1
Data summary table for the results shown in Figure 6.
Dataset 1. This dataset contains 18 MATLAB figures corresponding to Figures 2–10, as are listed below. Each plot or curve in a MATLAB figure has its associated data embedded. The data values for all data points in a plot can be obtained using MATLAB command get(plot_handle,’xdata’) or get(plot_handle,’ydata’), where plot_handle is a unique identifier of the plot.
- https://doi.org/10.7554/eLife.41771.029
Figure 7 with 2 supplements
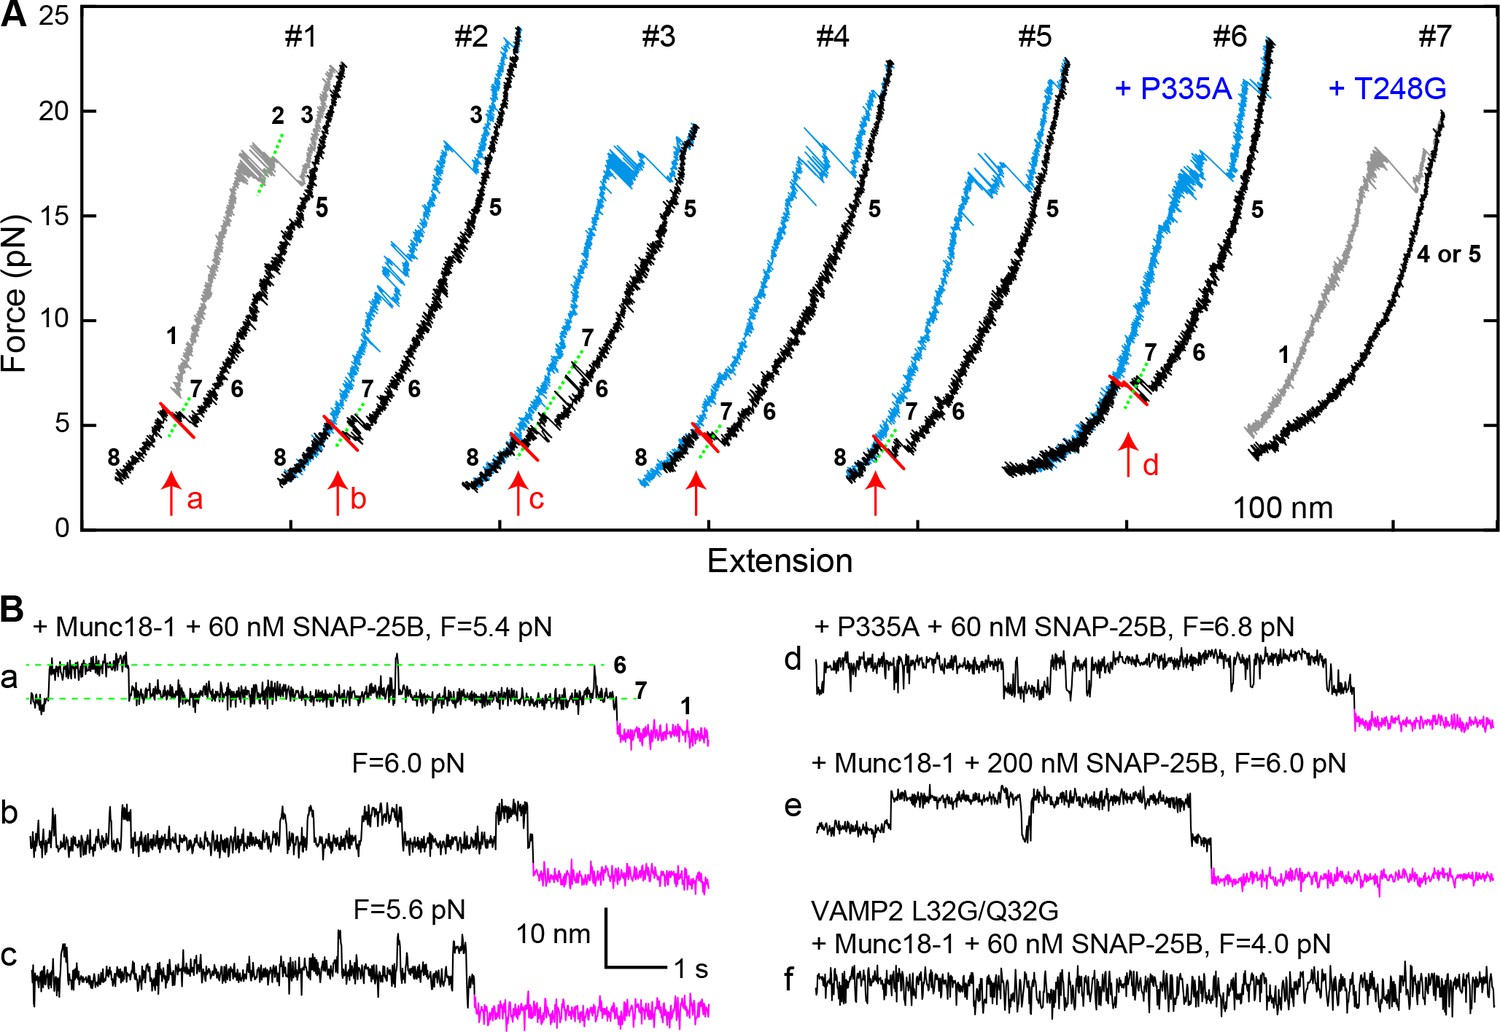
Template complex facilitates SNARE assembly.
(A) Representative FECs obtained in the presence of 60 nM SNAP-25B and 2 µM WT Munc18-1 (#1–5 ) or Munc18-1 mutants P335A (#6) or T248G (#7). FECs #1–5 represent consecutive rounds of manipulation of a single Qa-R SNARE conjugate. See also Figure 7—figure supplement 1 and Figure 7—source data 1. (B) Extension-time trajectories at the indicated constant mean forces showing SNARE assembly. Traces a-d were extracted from FEC regions marked with correspondingly labeled red arrows in panel A. Trace f shows rapid template complex transitions without SNAP-25B binding. See also Figure 7—figure supplement 2 and Figure 7—source data 2.
-
Figure 7—source data 1
MATLAB figure corresponding to Figure 7A (FECs #1–5).
- https://doi.org/10.7554/eLife.41771.033
-
Figure 7—source data 2
MATLAB figure corresponding to Figure 7B.
- https://doi.org/10.7554/eLife.41771.034
Figure 7—figure supplement 1

FECs obtained in the presence of 2 µM Munc18-1 and 60 nM SNAP-25B in the solution.
Red arrows mark events of SNAP-25B binding and SNARE assembly. Note that syntaxin +2 layer mutation I233G/E234G/Y235G significantly weakens CTD zippering.
Figure 7—figure supplement 2
Extension-time trajectories at constant mean forces.
The trajectories exhibit reversible folding and unfolding transitions of the mutant template complexes and irreversible SNAP-25 binding (indicated by red arrows).
Figure 8
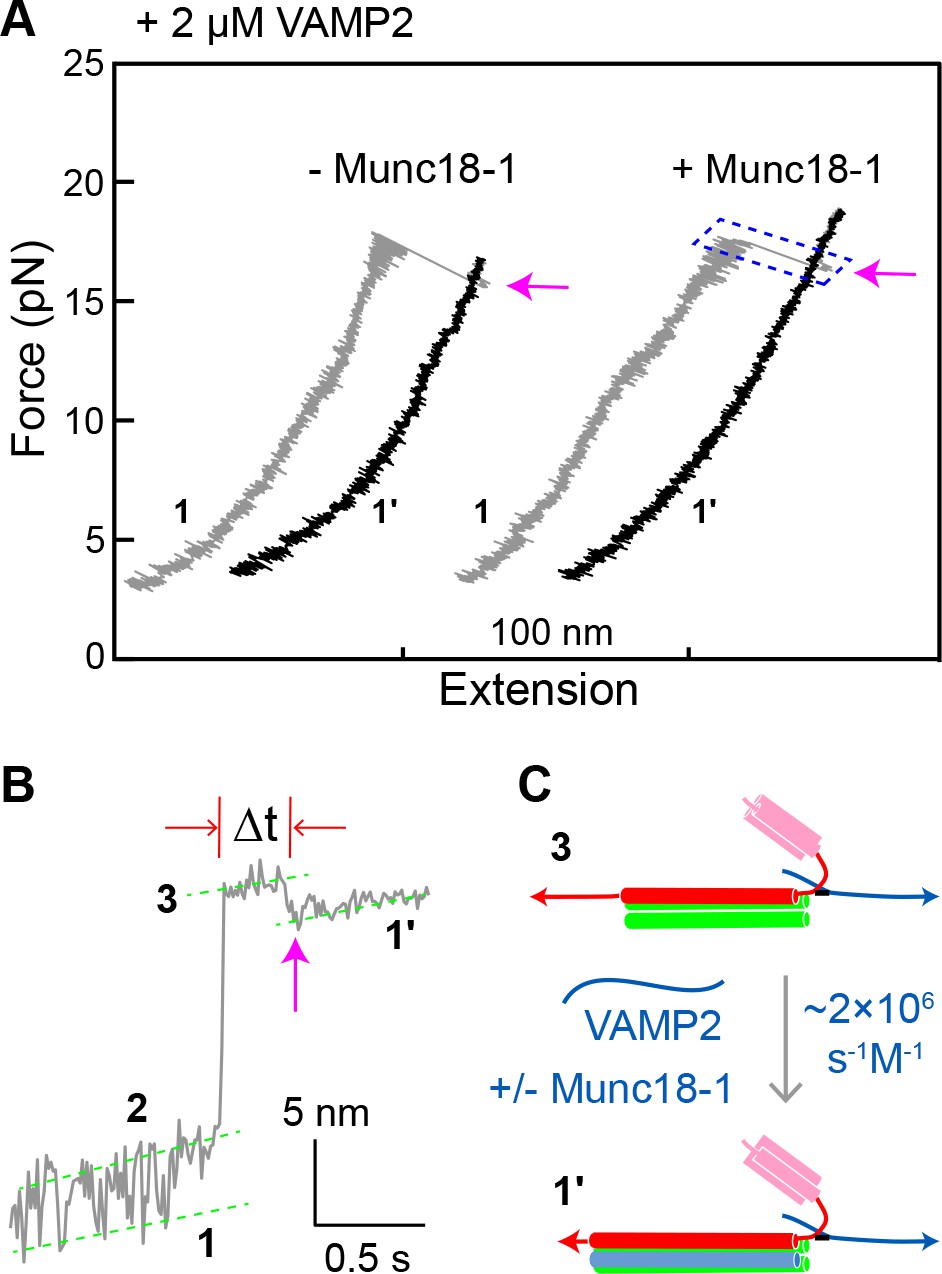
Munc18-1 does not significantly accelerate zippering between t- and v-SNAREs.
(A) FECs obtained by pulling single WT SNARE complexes in 2 µM soluble VAMP2 in the absence or presence of 2 µM Munc18-1. Magenta arrows mark binding of the VAMP2 molecules in the solution to the t-SNARE complexes generated by unzipping the ternary SNARE complex (see panel C). See also Figure 8—source data 1. (B) Close-up view of an extension-time trajectory displaying VAMP2 binding in trans. The trajectory corresponds to the boxed pulling region in A. As observed previously (Ma et al., 2015; Zhang et al., 2016b), VAMP2 binding (indicated by the magenta arrow) induced folding of the disordered C-terminus of the t-SNARE complex, decreasing its extension by 2.3 ± 0.1 nm and generating state 1′ (see panel C). It took an average time (Δt) of ~0.3 s for the free VAMP2 in the solution to bind the t-SNARE complex. Note that the SNARE complexes in state 1′ and state 1 (Figure 2D) are pulled from different sites. See also Figure 8—source data 2. (C) Diagram illustrating VAMP2 induced t-SNARE folding and extension shortening.
-
Figure 8—source data 1
MATLAB figure corresponding to Figure 8A.
- https://doi.org/10.7554/eLife.41771.036
-
Figure 8—source data 2
MATLAB figure corresponding to Figure 8B.
- https://doi.org/10.7554/eLife.41771.037
Figure 9
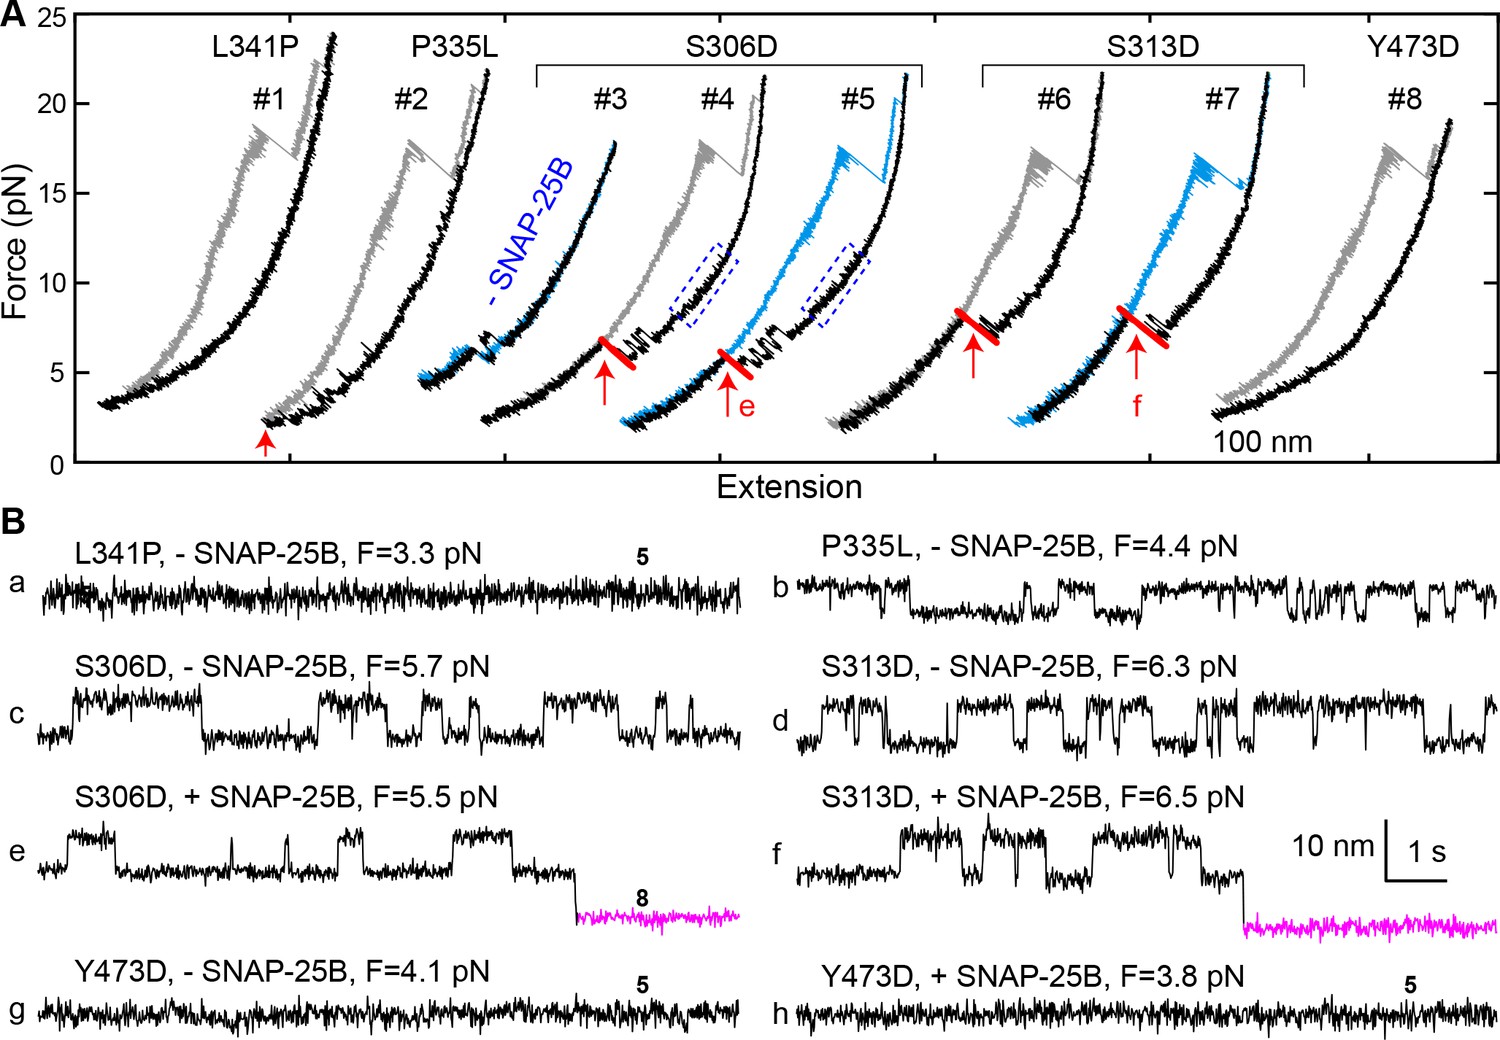
Munc18-1 phosphomimetic and disease mutations altered chaperoned SNARE assembly.
(A) FECs for Munc18-1 mutations with 0 nM (#3) or 60 nM (others) SNAP-25B. See also Figure 9—source data 1. (B) Extension-time trajectories at the indicated constant mean forces, some of which (e and f) are extracted from panel A. In panels a, g, and h, no template complex formation is observed. See also Figure 9—source data 2.
-
Figure 9—source data 1
MATLAB figure corresponding to Figure 9A (FECs #3–7).
- https://doi.org/10.7554/eLife.41771.040
-
Figure 9—source data 2
MATLAB figure corresponding to Figure 9B.
- https://doi.org/10.7554/eLife.41771.041
Figure 10 with 3 supplements
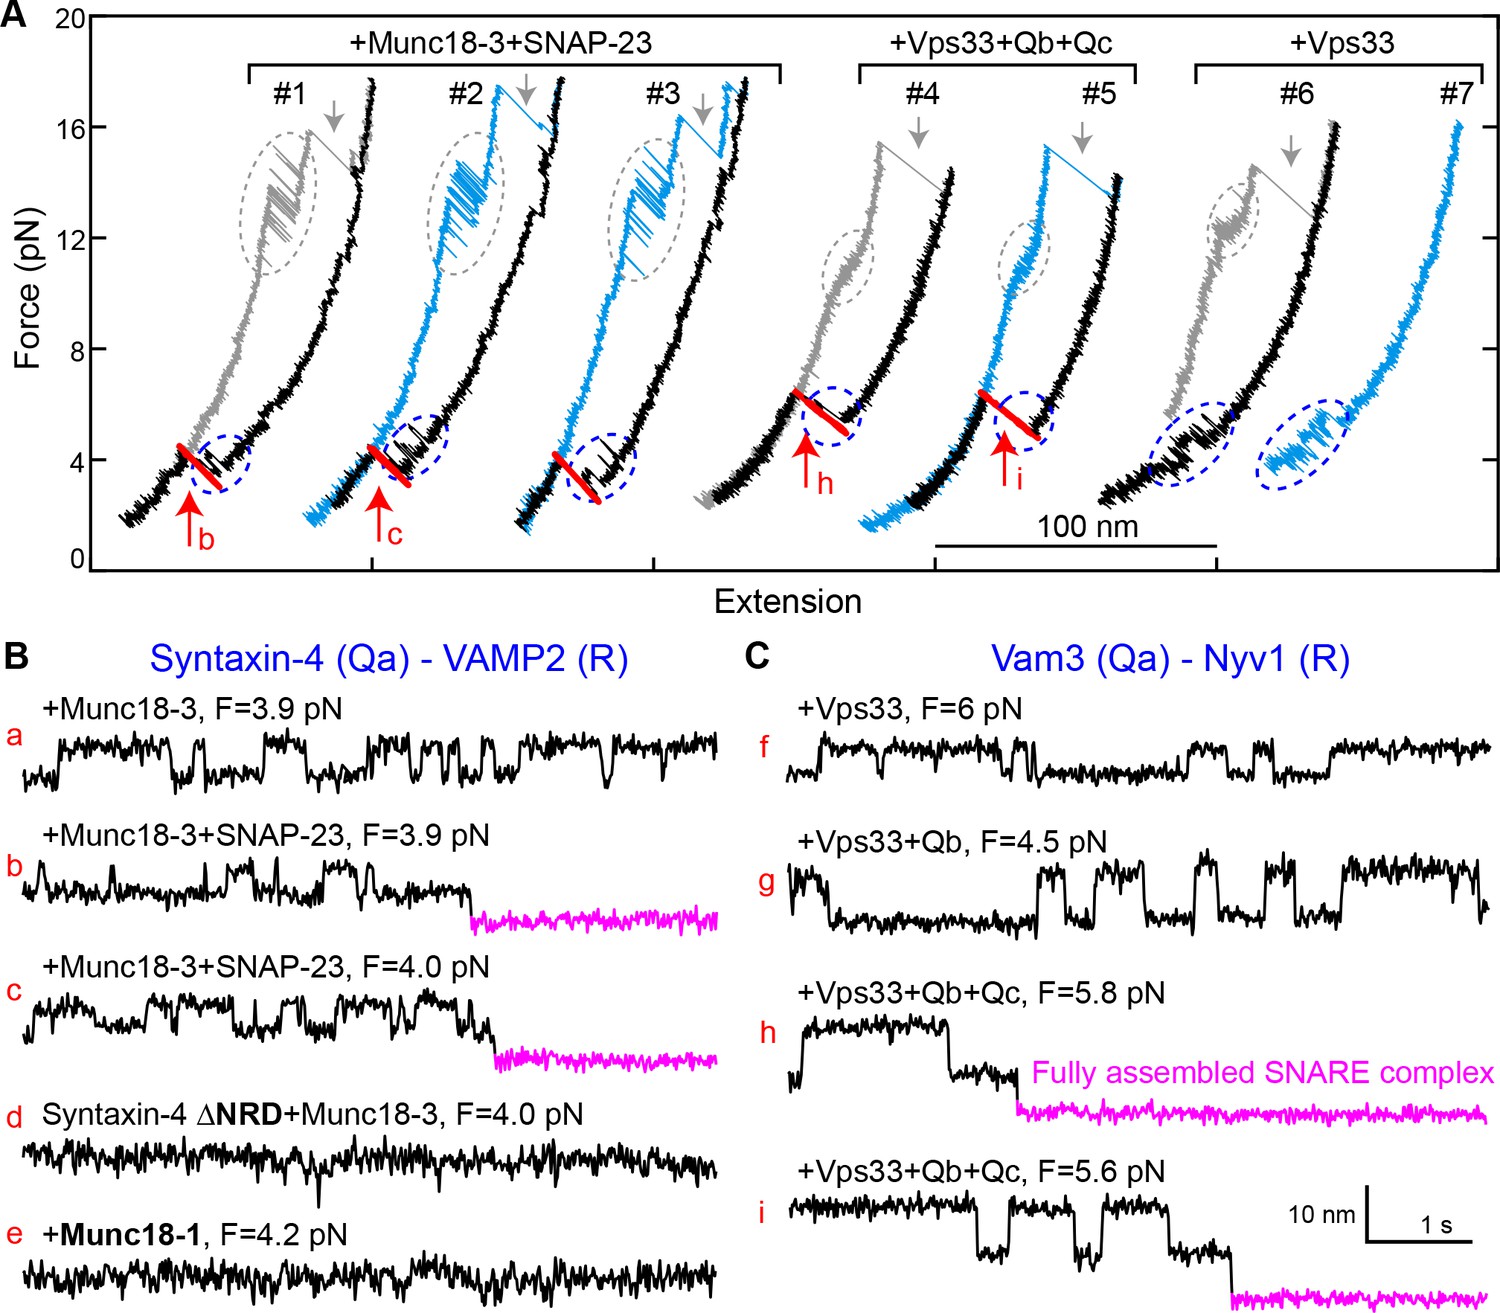
Munc18-3 and Vps33 catalyze SNARE assembly via template complexes.
(A) FECs of the Munc18-3 or Vps33 cognate Qa-R SNARE conjugate in the presence of the indicated protein(s). See also Figure 10—source datas 1 and 2. (B–C) Extension-time trajectories at the indicated constant mean forces, some of which (b, c, h, and i) are extracted from panel A. See also Figure 10—source datas 3 and 4.
-
Figure 10—source data 1
MATLAB figure corresponding to Figure 10A (FECs #1–3).
- https://doi.org/10.7554/eLife.41771.046
-
Figure 10—source data 2
MATLAB figure corresponding to Figure 10A (FECs #4–7).
- https://doi.org/10.7554/eLife.41771.047
-
Figure 10—source data 3
MATLAB figure corresponding to Figure 10B (traces a-e).
- https://doi.org/10.7554/eLife.41771.048
-
Figure 10—source data 4
MATLAB figure corresponding to Figure 10C (traces g-i).
- https://doi.org/10.7554/eLife.41771.049
Figure 10—figure supplement 1
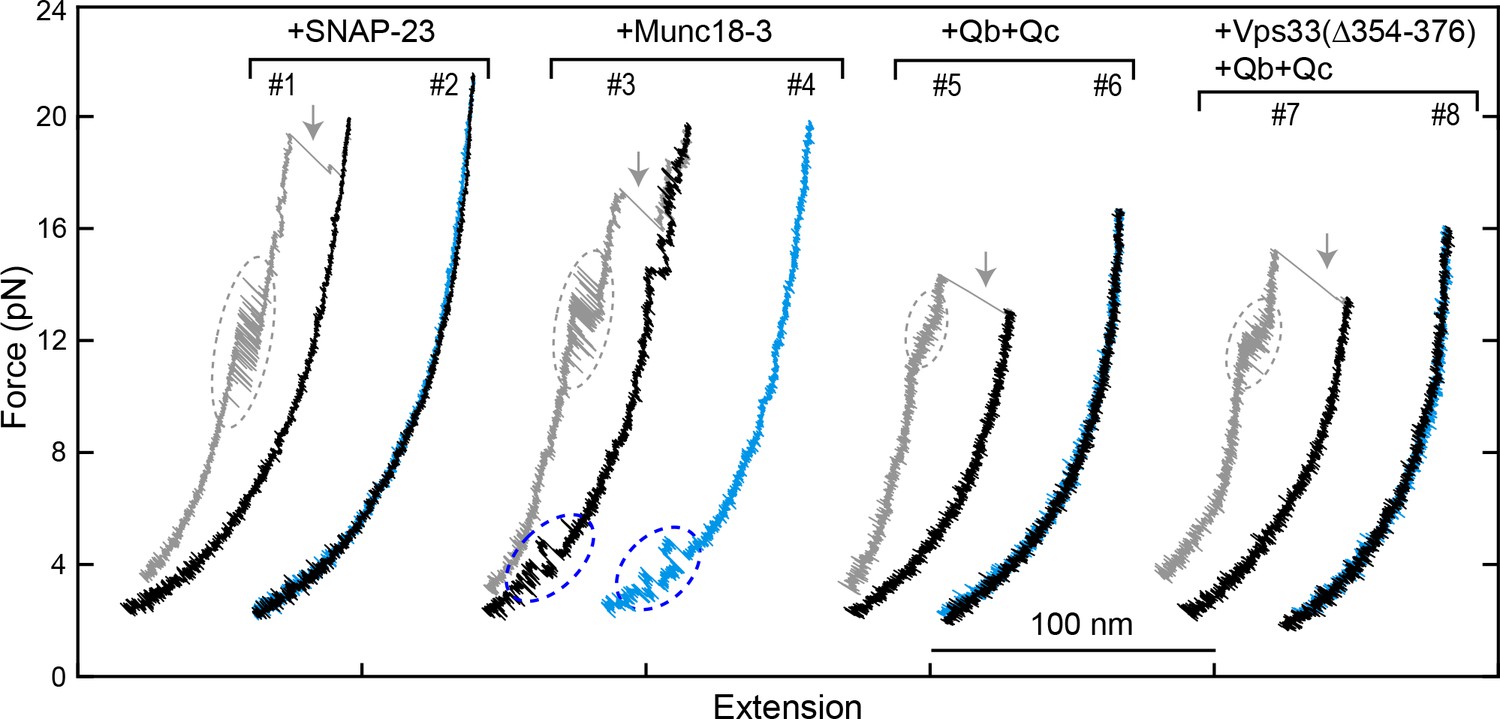
FECs obtained by pulling and relaxing a single syntaxin-4-VAMP2 conjugate (#1–4) or Vam3-Nyv1 conjugate (#5–8) in the presence of the indicated protein or proteins.
SNARE CTD transitions and template complex transitions are marked by gray and blue ovals, respectively. Gray arrows indicate SNARE unzipping. Vps33(Δ354–376) is analogous to Munc18-1 Δ324–339 and is inactive in vivo and in vitro (Baker et al., 2015).
Figure 10—figure supplement 2
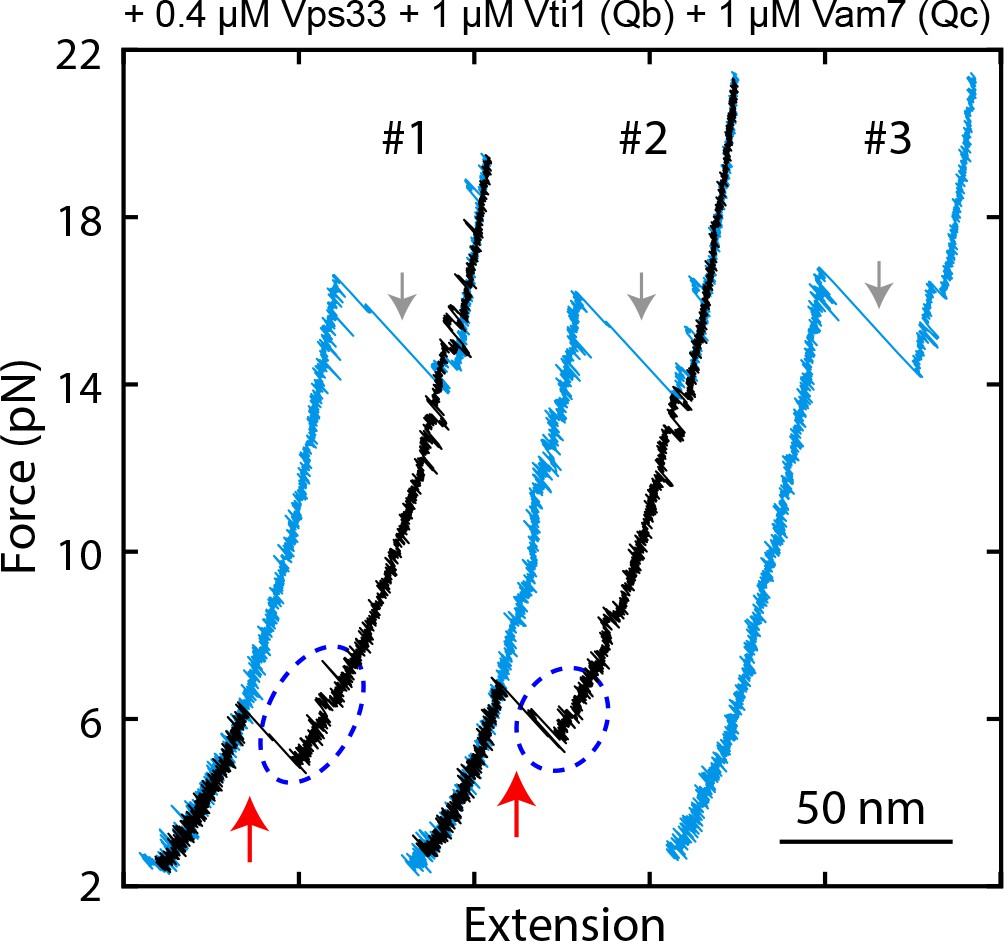
FECs displaying Vps33-catalyzed vacuolar SNARE assembly, marked by red arrows.
Gray arrows indicate SNARE unzipping. Template complex transitions are marked by blue ovals.
Figure 10—figure supplement 3

Probabilities of vacuolar SNARE assembly per relaxation under different conditions.
The insert shows the pulling direction and the region of the Vps33 truncation (yellow).
Videos
Video 1
SNARE complex unfolding and subsequent template complex formation as inferred from single-molecule measurements.
The proposed state transitions associated with FEC #2 in Figure 2C or Figure 2—figure supplement 2 are simulated.
Video 2
Template complex facilitates SNAP-25B binding and SNARE assembly.
The extension at a constant mean force of 6.0 pN corresponding to trace b in Figure 7B and its associated state transition are simulated. For simplicity, only the right bead was simulated to move in response to SNARE conformational changes. In reality, the left bead moved synchronously with the right bead, but in an opposite direction, as shown in Video 1.
Tables
Table 1
Properties of the neuronal template complex.
https://doi.org/10.7554/eLife.41771.014| SNARE or SM | Mutation or truncation | Unfolding energy (kBT) | Equilibrium force* (pN) | Folding rate (s−1) | Unfolding rate (s−1) | Partially closed syntaxin† | Template formation | SNAP-25 binding | |||
|---|---|---|---|---|---|---|---|---|---|---|---|
| Prob. | Prob.‡ | N§ | Prob.¶ | N** | |||||||
| WT | - | 5.2 (0.1) | 5.1 (0.1) | 132 | 0.7 | 0.4 | 0.5 | 346 | 0.7 | 50 | |
| Munc18-1 | L247R | 1.6 (0.3) | 2.3 (0.1) | - | - | 0.3 | 0.3 | 99 | 0.7 | 6 | |
| T248G | 2.9 (0.2) | 3.1 (0.1) | - | - | 0 | 0.3 | 155 | 0.3 | 16 | ||
| L247A/ T248G | <1.5*** | - | - | - | 0 | 0 | 241 | - | - | ||
| S306D¶¶ | 5.8 (0.1) | 5.6 (0.1) | 184 | 0.6 | 0.4 | 0.9 | 123 | 0.9 | 53 | ||
| L307R | 4.1 (0.2) | 4.6 (0.1) | 0.07 | 0.43 | 114 | 0.58 | 19 | ||||
| S313D¶¶ | 6.1 (0.2) | 5.7 (0.1) | 568 | 1.5 | 0.4 | 1 | 162 | 0.8 | 70 | ||
| Δ324– 339††,‡‡ | <1.5*** | - | - | 0 | 0 | 105 | 0 | 0 | |||
| D326K¶¶ | 6.5 (0.2) | 5.7 (0.1) | 420 | 0.6 | 0.03 | 0.9 | 103 | 1 | 27 | ||
| P335A§§ | 6.0 (0.3) | 5.9 (0.1) | 258 | 0.5 | 0.02 | 0.7 | 155 | 0.9 | 11 | ||
| P335L§§ | 4.3 (0.1) | 4.8 (0.1) | 17 | 0.2 | 0.4 | 0.3 | 224 | 0.8 | 36 | ||
| L341P§§ | <1.5*** | - | - | 0.06 | 0.04 | 176 | 0.5 | 4 | |||
| L348R††,‡‡ | <1.5*** | - | - | 0.02 | 0.04 | 222 | 0.7 | 6 | |||
| Y473D‡‡ | 4.0 (0.1) | 4.3 (0.2) | - | - | 0 | 0.1 | 395 | 0.5 | 24 | ||
| VAMP2 | L32G/Q33G | 3.4 (0.2) | 3.9 (0.1) | 310 | 10 | 0.4 | 0.6 | 170 | 0.06 | 33 | |
| V39D | 3.8 (0.4) | 3.9 (0.2) | 90 | 2 | 0.3 | 0.1 | 175 | 0.8 | 13 | ||
| M46A | 5.2 (0.4) | 5.1 (0.2) | 130 | 0.7 | 0.3 | 0.5 | 52 | 0.8 | 13 | ||
| E62T†† | 4.1 (0.2) | 4.8 (0.2) | 107 | 5 | 0.4 | 0.5 | 104 | 0.4 | 23 | ||
| S61D/ E62T†† | 3.6 (0.2) | 4.1 (0.1) | 0.4 | 0.7 | 56 | 0.2 | 12 | ||||
| Q76A†† | 4.7 (0.2) | 4.8 (0.1) | 166 | 2 | 0.4 | 0.6 | 62 | 0.3 | 12 | ||
| F77A‡‡ | 1.5 (0.3) | 2.3 | - | - | 0.5 | 0.1 | 121 | 0.5 | 6 | ||
| A81G/A82G | 5.0 (0.3) | 4.9 (0.2) | 130 | 0.8 | 0.4 | 0.5 | 149 | 0.4 | 42 | ||
| Δ85–94 | 5.1 (0.2) | 5.0 (0.1) | 120 | 0.7 | 0.4 | 0.5 | 87 | 0.7 | 29 | ||
| Syntaxin-1 | ΔNRD††,‡‡ | <1.5*** | - | - | - | 0 | 0.08 | 105 | 0.2 | 12 | |
| ΔN- peptide††,‡‡ | 3.2 (0.2) | 4.6 (0.1) | 42 | 2 | 0.03 | 0.5 | 328 | 0.4 | 46 | ||
| ΔHabc‡‡ | <1.5*** | - | - | - | 0 | 0.06 | 140 | 0.5 | 4 | ||
| L165A/E166A (LE)¶¶ | 6.7 (0.2) | 6.1 (0.1) | 406 | 0.5 | 0.07 | 0.7 | 83 | 0.9 | 26 | ||
| LE/E76K | 6.4 (0.2) | 6.0 (0.2) | 123 | 0.2 | 0.07 | 0.9 | 81 | 0.7 | 30 | ||
| I202G/I203G | 3.0 (0.3) | 3.8 (0.1) | 240 | 12 | 0.4 | 0.5 | 177 | 0.4 | 33 | ||
| F216A | 3.7 (0.1) | 5.1 (0.1) | 82 | 2 | 0 | 0.6 | 155 | 0.9 | 32 | ||
| I230G/D231G/ R232G††† | 3.6 (0.2) | 4.3 (0.1) | - | - | 0 | 0.5 | 111 | 0.4 | 7 | ||
| I233G/E234G/ Y235G††† | 3.0 (0.2) | 4.1 (0.1) | - | - | 0 | 0.6 | 122 | 0.7 | 30 | ||
| V237G/E238G/ H239G | 5.2 (0.2) | 4.9 (0.1) | 124 | 0.7 | 0.01 | 0.3 | 182 | 0.4 | 14 | ||
| T251G/K252G | 5.2 (0.1) | 4.9 (0.1) | 126 | 0.7 | 0.5 | 0.8 | 197 | 0.7 | 47 | ||
| Δ255–264 | 5.4 (0.2) | 5.1 (0.1) | 140 | 0.6 | 0.5 | 0.5 | 134 | 0.7 | 29 | ||
| Syntaxin-1 | L165A/E166A | 6.6 (0.2) | 6.2 (0.1) | 72 | 0.1 | 0.2 | 0.9 | 85 | 0.2 | 11 | |
| Munc18-1 | D326K¶¶ | ||||||||||
-
* Mean of two average forces for the unfolded and folded states when the two states are equally populated (Rebane et al., 2016). The equilibrium force of the template complex generally correlates with its unfolding energy. The number in parentheses is the standard error of the mean.
† Detected as the syntaxin- and Munc18-1-dependent transition in the force range of 10–15 pN.
-
‡ Probability per relaxation or pulling measured in the absence of SNAP-25B.
§ Total number of pulling or relaxation FECs acquired, in which transitions of the template complex or syntaxin are scored, including their average equilibrium forces and extension changes.
-
¶ Probability of SNAP-25B binding and SNARE assembly per relaxation upon formation of the template complex.
** Total number of relaxation FECs containing the template complex transition.
-
†† Mutation that reduces membrane fusion in vitro (Parisotto et al., 2014; Shen et al., 2010; Shen et al., 2007).
‡‡ Mutation that impairs exocytosis or neurotransmitter release in vivo (Meijer et al., 2018; Munch et al., 2016; Walter et al., 2010).
-
§§ Mutation associated with epilepsy (Stamberger et al., 2016).
¶¶ Mutation that enhances membrane fusion in vitro or neurotransmitter release in the cell (Genc et al., 2014; Gerber et al., 2008; Lai et al., 2017; Munch et al., 2016; Parisotto et al., 2014; Richmond et al., 2001).
-
*** Unfolding energy below the detection limit of our method, estimated to be 1.5 kBT, or not available due to no, infrequent, or heterogeneous template complex transition.
††† In the observed template complex transition, the template complex frequently dwelled in the unfolded state for an unusually long time (Figure 3—figure supplement 1). Thus, the transition is no longer two-state.
Key resources table
| Reagent type (species) or resource | Designation | Source or reference | Identifiers | Additional information |
|---|---|---|---|---|
| Strain, strain background (species) | BL21 Gold (DE3) competent cells | Agilent echnologies | Cat#230132 | |
| Commercial assay or kit | BirA-500: BirA biotin-protein ligase standard reaction kit | Avidity | Cat#BirA500 | |
| Chemical compound, drug | dNTP mix (10 mM) | Invitrogen | Cat#18427013 | |
| Chemical compound, drug | 2,2'-dithiodipyridine disulfide (DTDP) | Sigma-Aldrich | CAS#2127-03-9 | |
| Chemical compound, drug | Protease inhibitor cocktail tablet, EDTA free | Roche | Cat#05892791001 | |
| Peptide, recombinant protein | Catalase from bovine liver | Sigma-Aldrich | CAS#9001-05-2 | |
| Peptide, recombinant protein | Glucose Oxidase from Aspergillus niger | Sigma-Aldrich | CAS#9001-37-0 | |
| Software, algorithm | LabVIEW VIs | (Gao et al., 2012) | instrument control, data acquisition, and data analysis | |
| Software, algorithm | MATLAB scripts | (Gao et al., 2012) (Rebane et al., 2016) | data analysis | |
| Software, algorithm | Geneious | Geneious | DNA primer design | |
| Software, algorithm | GraphPad Prism7 | GraphPad Software | ||
| Other | Micro Bio- spin six columns | Bio-RAD | Cat#732–6221 | |
| Other | Ni Sepharose 6 Fast Flow | GE healthcare Lifesciences | Cat#17531801 | |
| Other | Anti-digoxigenin antibody coated polystyrene particles | Spherotech | Cat#DIGP-20–2 | 2.1 µm, called DIG beads |
| Other | Streptavidin-coated polystyrene particles | Spherotech | Cat#SVP-15–5 | 1.8 µm |
| Other | Customized glass tubing: bead dispenser tubes with 100 µm outer diameter (OD) and 25 µm inner diameter (ID) | King Precision Glass, Inc | ||
| Other | Polyethylene tubing PE50 | Becton Dickinson | Cat# 22–270835 | |
| Other | Dual optical trap setup | (Gao et al., 2012) |
Additional files
-
Transparent reporting form
- https://doi.org/10.7554/eLife.41771.050
Download links
A two-part list of links to download the article, or parts of the article, in various formats.
Downloads (link to download the article as PDF)
Open citations (links to open the citations from this article in various online reference manager services)
Cite this article (links to download the citations from this article in formats compatible with various reference manager tools)
Munc18-1 catalyzes neuronal SNARE assembly by templating SNARE association
eLife 7:e41771.
https://doi.org/10.7554/eLife.41771


