HIV-1 nuclear import in macrophages is regulated by CPSF6-capsid interactions at the nuclear pore complex
- University of Heidelberg, Germany
- German Center for Infection Research, Germany
Figures
Figure 1 with 3 supplements
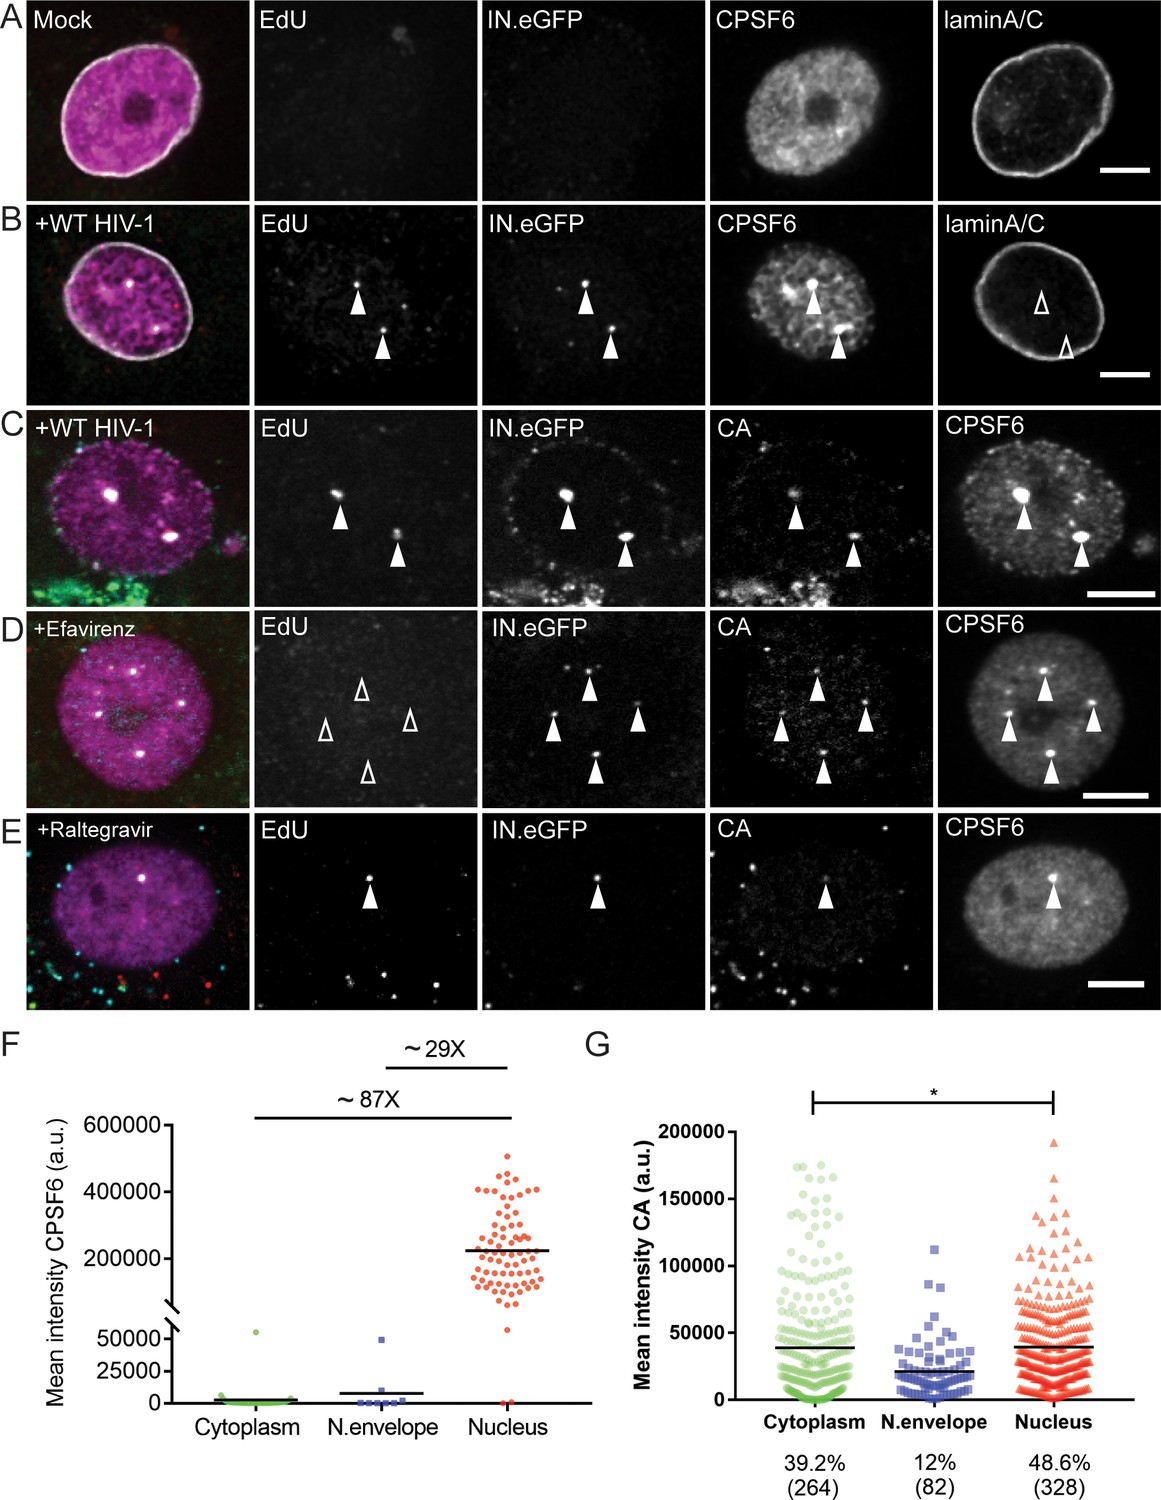
CPSF6 is enriched on nuclear HIV-1 complexes in infected macrophages.
MDM were mock-infected (A) or infected with HIV-1 NL4-34059 (IN.eGFP) at an MOI of 14.5 (B–G) in the presence of 10 µM EdU (A–G), and 5 µM Efavirenz (D) or 5 µM Ral (Raltegravir) (E) for 48 hr, click-labeled and immunostained with anti-CPSF6 antibody (magenta). Z-stacks were acquired by spinning disk confocal microscopy (SDCM). RTC/PIC were identified via co-localization of IN.eGFP (green) and EdU (red) signals. Images show representative z-sections of the nucleus of infected cells. Solid arrowheads indicate nuclear complexes. Open arrowheads indicate lack of co-localization for the respective stain. Scale bars represent 5 µm. (A, B) Distribution of CPSF6 in the nucleus of a mock-infected or infected cell. Immunostaining against lamin A/C was performed to visualize the nuclear envelope. (C–E) As in A,B, but immunostaining against CA (cyan) was performed instead of lamin staining. (F) Distribution and mean intensities of CPSF6 signals co-localizing with individual RTC/PIC in the cytoplasm, close to the nuclear envelope and inside the nucleus; each dot represents one RTC/PIC. The graph summarizes data from two donors from two independent experiments. 62 cells were analyzed in total. (G) Distribution and mean intensities of CA signals co-localizing with individual EdU-positive RTC/PIC. Numbers of total RTC/PIC detected are given in parentheses. The graph summarizes data from four donors from three independent experiments. 92 cells were analyzed in total. Statistical significance was assessed with two-tailed non-paired Mann-Whitney test; *p=0.013.
-
Figure 1—source data 1
Mean CPSF6 and CA signal intensities of individual HIV-1 EdU positive subviral complexes at different subcellular localizations.
Data corresponds to Figure 1F and G.
- https://doi.org/10.7554/eLife.41800.007
Figure 1—figure supplement 1

Effects of cytoplasmic CPSF6 on HIV-1 reverse transcription.
(A) Association of CPSF6 with cytoplasmic RTC/PIC in HeLa P4-derived TNPO3 K/D cells. Cells were infected with HIV-1NL4-3 (IN.eGFP) at an MOI of 25 in the presence of 10 µM EdU for 4.5 hr, fixed, click-labeled and immunostained with anti-CPSF6 (cyan) and anti-laminA/C (white) antibodies. A z-section of a representative infected cell is shown. The arrowhead indicates a cytoplasmic RTC/PIC enlarged (i) on the right side. An additional enlargement from another region of the same cell (ii) is also shown. IN.eGFP and EdU signals in the merged panel are displayed in green and red, respectively. Scale bar represents 5 µm. (B) Comparison of EdU signal intensities of single CPSF6 negative (neg) or positive (pos) cytoplasmic RTC/PIC in infected TNPO3-K/D cells. Statistical significance was assessed by a two-tailed unpaired Mann Whitney test; **p<0.01. a.u.: arbitrary units. (C) MDM were transduced with AAV expressing shRNAs targeting CPSF6 (K/D) or non-targeted shRNA (NS) as described in Materials and Methods. Subsequently, cells were infected with HIV-1 NL4-3 4059-WT (IN.eGFP). At 48 h p.i., cells were fixed, click-labeled and immunostained. The graph shows the number of RTC/PIC detected per cell under the indicated conditions.
Figure 1—figure supplement 2
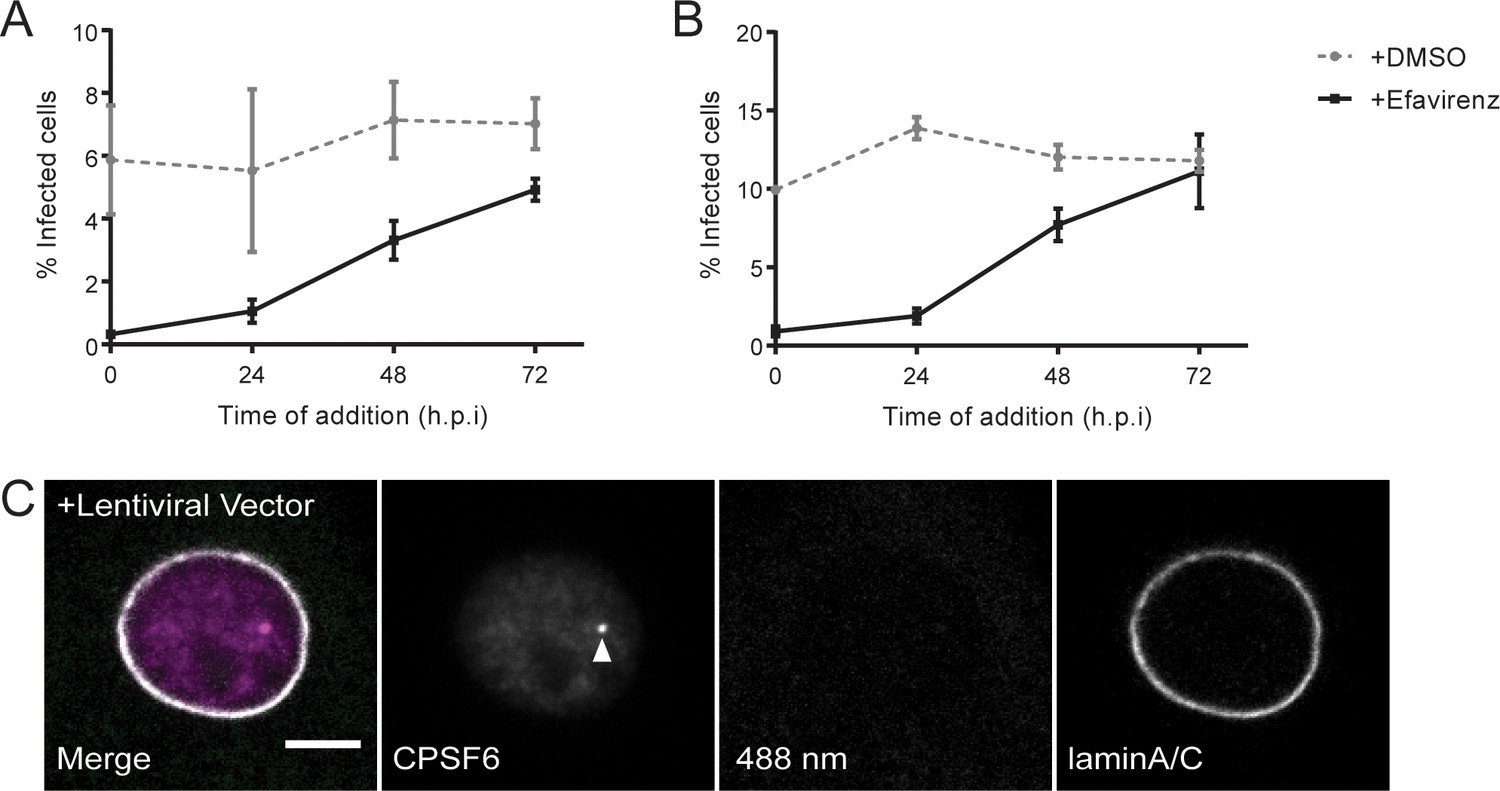
Replication kinetics of HIV-1 in primary macrophages and induction of CPSF6 enrichment by lentiviral transduction.
(A, B) MDM from two donors in two independent experiments were infected with 15 ng CA (MOI 3.5) of HIV-1 NL4-3 4059-WT. To prevent secondary infection, 5 µM Maraviroc was added to the medium at 24 h p.i.. 5 µM Efavirenz (solid lines) or DMSO (dashed lines) was added at the time of infection (0 h p.i.) or at the indicated time points. The proportion of infected cells was determined at day 6 p.i. by immunostaining using antiserum against CA. Infections were performed in triplicates per condition in each experiment. Error bars represent SEM of the technical replicates. (C) MDM, from two different donors than the ones from (A) and (B), were transduced with lentiviral vectors expressing a non-targeted shRNA (NS control) or shRNAs against CPSF6, as described in Materials and Methods. At 7d post transduction cells were fixed and immunostained with anti-CPSF6 (magenta) antibody. The nuclear envelope was visualized by immunostaining with anti-laminA/C antibody (white). The solid arrow indicates CPSF6 enrichment in the nucleus observed after lentiviral transduction.
Figure 1—figure supplement 3
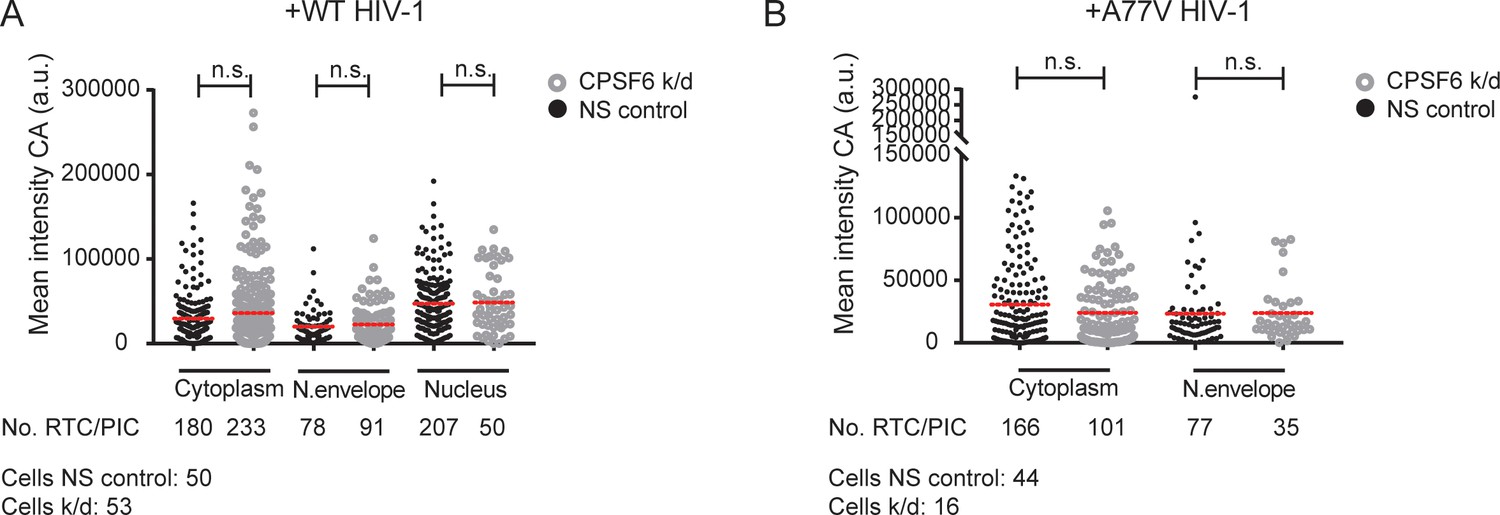
Effect of CPSF6 knockdown on CA signals.
MDM were transduced with AAVs as described in Materials and Methods. Subsequently, cells were infected with 100 ng CA (MOI 14.5) of HIV-1 NL4-3 WT (IN.eGFP) (A) or A77V (IN.eGFP) (B) in the presence of 10 µM EdU. 48 hr later, cells were fixed and stained with anti-CA and anti-laminA/C antibodies. The plots show the mean intensities of CA signals co-localizing with individual RTC/PIC at the indicated subcellular localization in cells displaying normal (NS control, black dots) or low (K/D, gray dots) CPSF6 levels. Red lines represent the mean of each data set. Data displayed were combined from two independent experiments using from MDM from different donors. Statistical significance was assessed by a two-tailed unpaired Mann Whitney test; n.s.: not significant. a.u.: arbitrary units.
-
Figure 1—figure supplement 3—source data 1
Data includes mean CA signals of individual WT and A77V HIV-1 subviral complexes at different subcellular localization after CPSF6 knock-down.
- https://doi.org/10.7554/eLife.41800.008
Figure 2 with 2 supplements
Characterization of the composition of nuclear HIV-1 replication complexes.
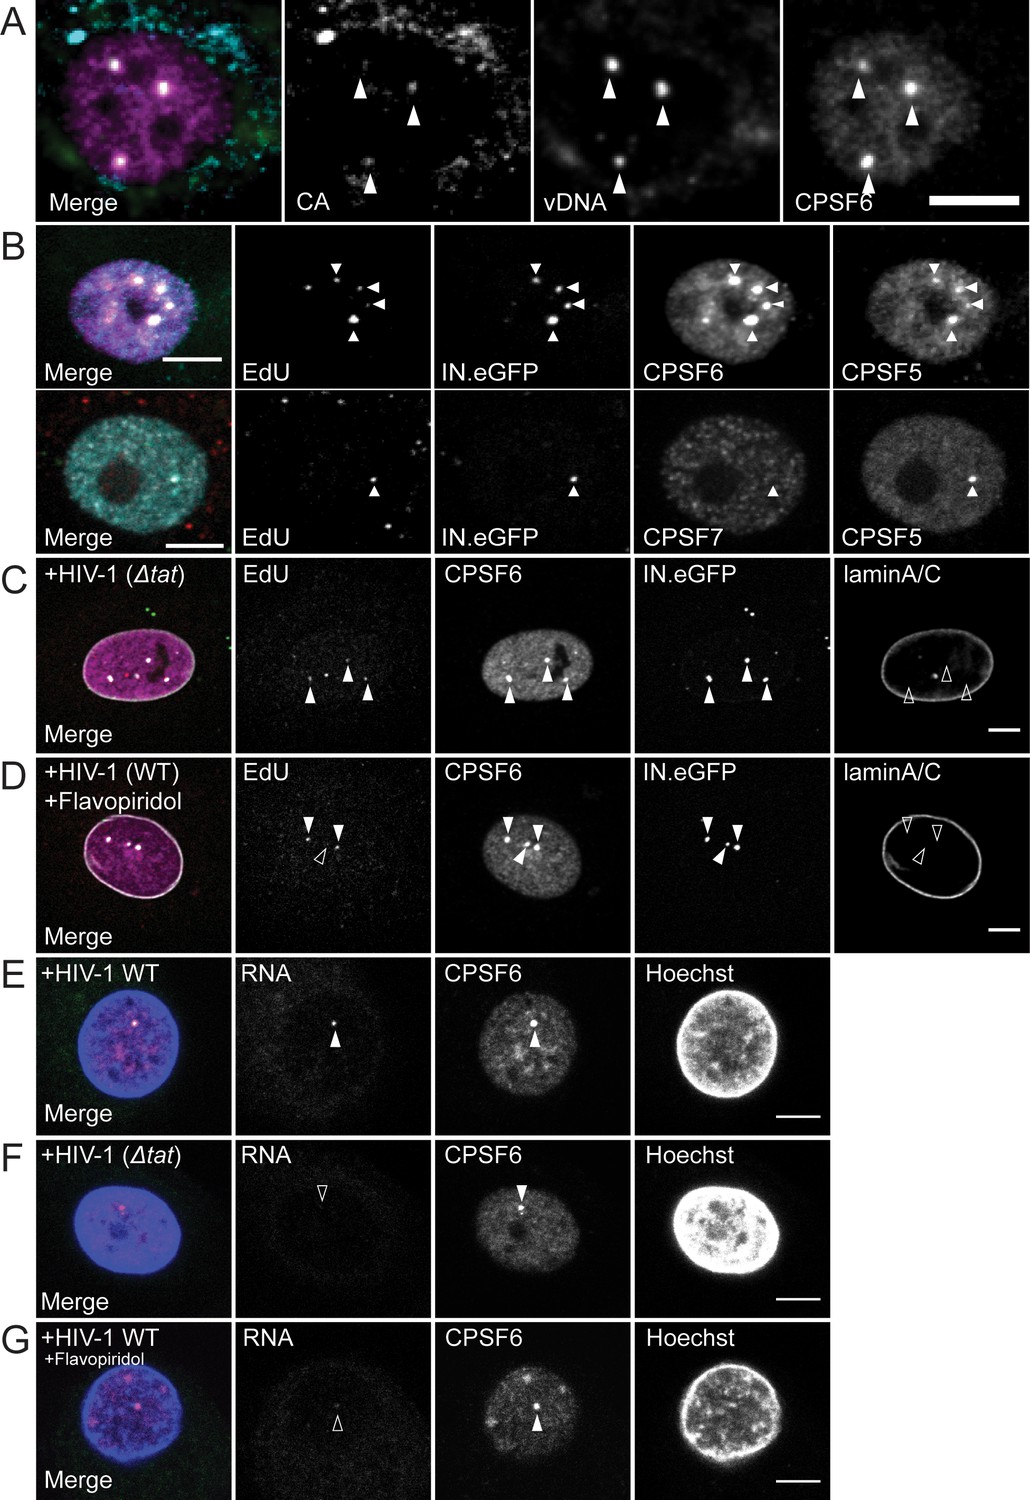
(A) MDM from three donors were infected with HIV-1 NL4-34059 at an MOI of 8 for 72 hr. Viral DNA (green) was detected by FISH as described in Materials and Methods. CPSF6 (magenta) and CA (cyan) were detected by immunostaining and images were recorded by SDCM. The maximum projection of three focal planes acquired with an axial spacing of 0.2 µm is shown. Arrowheads indicate nuclear complexes. (B) MDM from three donors were infected with 100ng p24 (MOI 14.5) HIV-1 NL4-34059 (IN.eGFP) for 48 hr, fixed and click-labeled as in Figure 1. CPSF5 (cyan) and CPSF6 (magenta) (top panel) or CPSF7 (white) and CPSF5 (cyan) (bottom panel) were detected by immunostaining. Images show a section through the nuclei of infected cells. Arrowheads indicate nuclear complexes. 112 cells were analyzed in total. (C,D) MDM from two donors in two independent experiments were infected with 100ng p24 (MOI 14.5) HIV-1 NL4-3ΔTat4059 (IN.eGFP) (C) or HIV-1 NL4-34059 (IN.eGFP) (D). At 96 h p.i., a final concentration of 5 µM Flavopiridol (D) was added to the medium and infection was continued for 12 hr. Cells were fixed, click-labeled and CPSF6 (magenta) and laminA/C (white) were detected by immunostaining. Images show a section through the nucleus of representative infected cells. Arrowheads indicate nuclear complexes. 22 cells were analyzed in (C) and 37 cells in (D). (E,F) MDM from three donors, in two independent experiments, were infected at an MOI of 8 with HIV-1 NL4-34059 (E) or HIV-1 NL4-3ΔTat4059 (F). At 108 h p.i. cells were fixed. CPSF6 (magenta) was detected by immunostaining and nucleus (blue) with Hoechst. Viral RNA (green) was detected by RNA FISH as explained in Materials and Methods. Arrowhead indicates nuclear complexes. 42 cells were analyzed in total in (E) and 49 cells in (F). (G) MDM from the same donors as in (E,F) were infected with HIV-1 NL4-34059 using the same conditions. At 96 h p.i. 5 µM Flavopiridol was added to the medium for 12 hr. Viral RNA (green) was detected by RNA FISH. CPSF6 (magenta) was detected by immunostaining and nucleus (blue) with Hoechst. Arrowheads indicate nuclear CPSF6 enrichments. 36 cells were analyzed in total. Scale bars in A-G: 5 µm.
Figure 2—figure supplement 1
Inhibition of HIV-1 transcription and LEDGF localization.
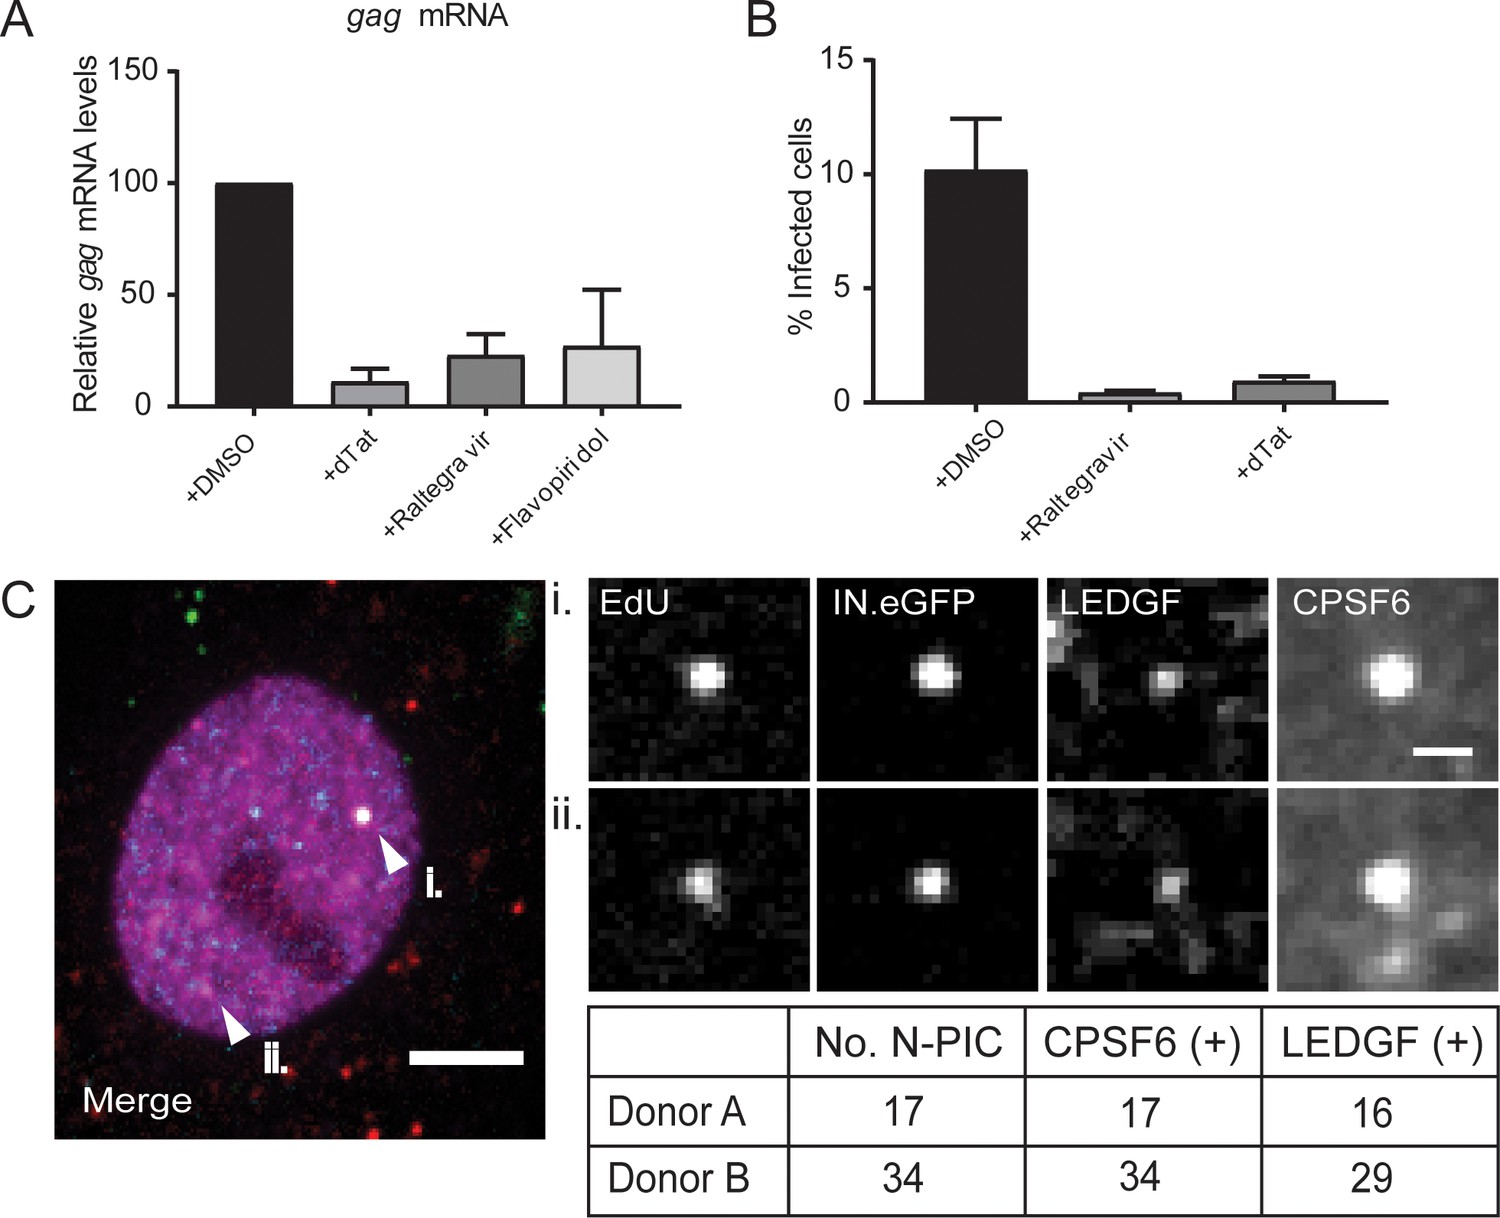
MDM from two donors were infected with HIV-1 NL4-34059 or HIV-1 NL4-3ΔTat4059 as described in Materials and Methods and Figure 2, in the presence or absence of Raltegravir. At 96 h p.i., DMSO or 5 µM Flavopiridol was added to the medium and infection was continued for 12 additional hours. (A) RNA was extracted and HIV-1 gag transcripts were quantitated by qRT-PCR as described in Materials and Methods. The graph shows the mRNA levels of gag upon Flavopiridol treatment relative to the DMSO control. Error bars represent SD of technical replicates. (B) At 6d p.i., cells were fixed and immunostained with anti-CA antiserum to determine the proportion of infected cells. Error bars represent SEM of biological replicates. (C) Co-localization of LEDGF with CPSF6 on a nuclear PIC. MDM were infected for 48 hr as above, fixed and click-labeled. LEDGF (p52 and p75; white) and CPSF6 (magenta) were detected by immunostaining. Green, IN.eGFP; red, EdU. Arrowheads indicate nuclear complexes displayed in the enlargements on the right (i, ii; note that the structure in (ii) is in a different focal plane and not clearly visible in the overview). The table shows the total number of CPSF6- or LEDGF-positive nuclear complexes detected in samples from two donors. Scale bars: 5 µm (overview), 1 µm (enlargements).
Figure 2—figure supplement 2
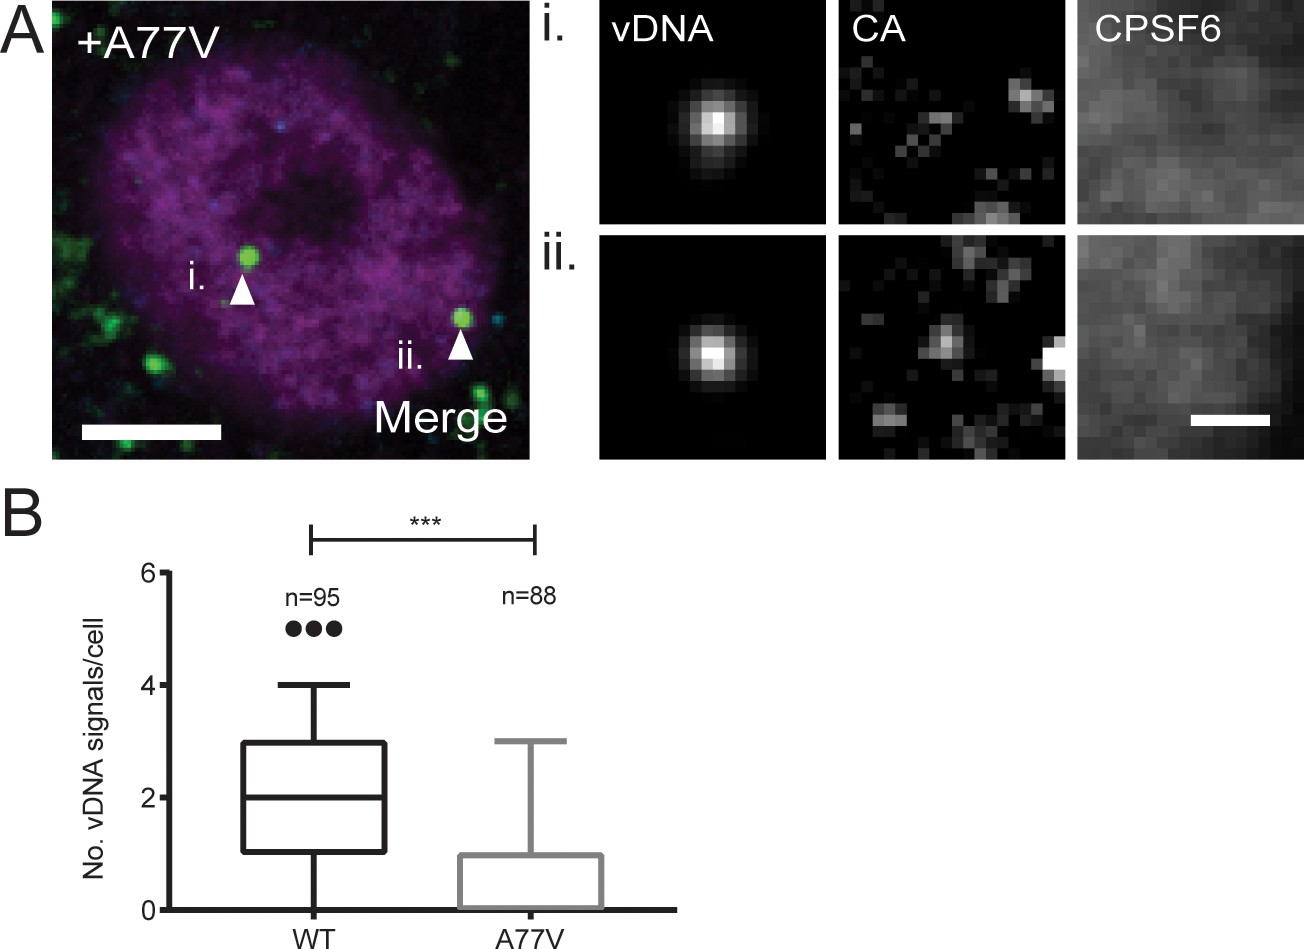
FISH analysis of cells infected with a CPSF6-binding defective HIV-1 variant.
(A) MDM from three donors were infected with the A77V variant for 72 hr. Cells were fixed and immunostained using anti-CPSF6 (magenta) and anti-CA (cyan) antibodies. viral DNA (green) was detected by FISH as described in Materials and Methods. Arrows indicate nuclear viral DNA signals shown enlarged at the right. Please note that the harsh treatment of the immuno-FISH procedure compromised the quality of CA signals. Image shows a representative cell. Scale bar: 5 µm (overview) or 1 µm (enlargement). (B) Numbers of nuclear viral DNA signals per cell in cells infected with WT HIV-1 or the A77V variant at 72 h p.i. The graph shows data from three independent experiments. Whiskers represent minimum and maximum. Statistical difference was assessed with a two-tailed non-paired Mann Whitney test; ***p<0.0001.
Figure 3 with 2 supplements
Effect of CPSF6 depletion on HIV-1 infection in primary macrophages.
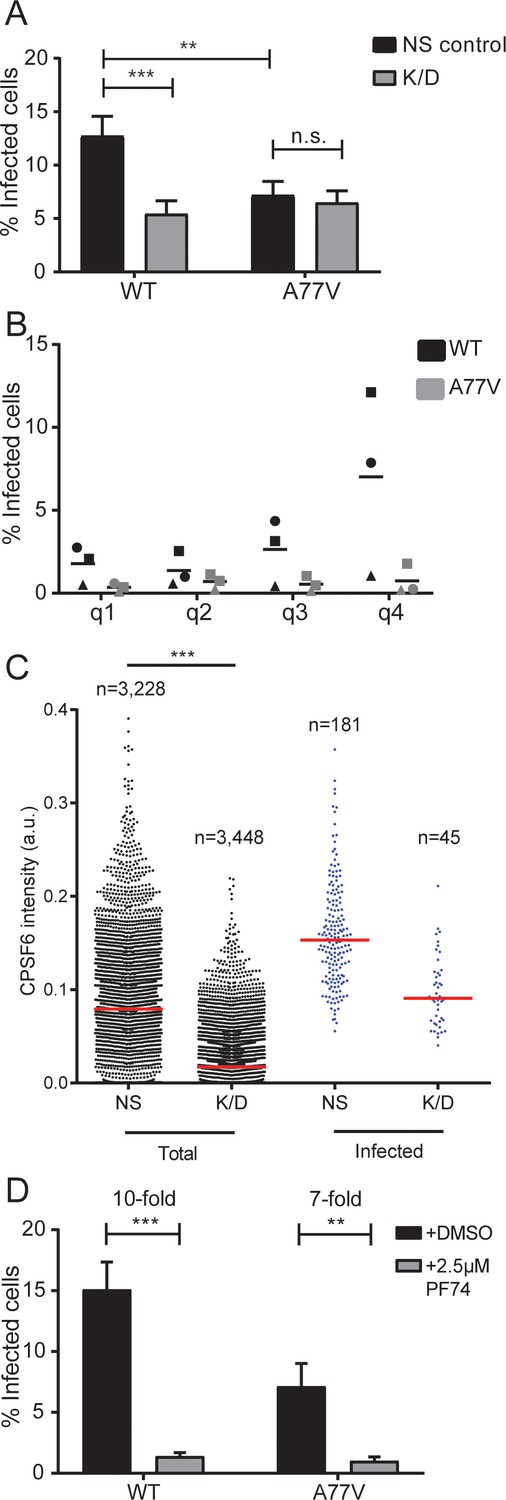
(A) MDM from six donors in three independent experiments were transduced with either lentiviral vectors or AAV expressing a non-targeted shRNA (NS control) or shRNAs against CPSF6 (K/D) as described in Materials and Methods. Twelve days after initial transduction, cells were infected with 15 ng CA (MOI 3.5) of HIV-1 NL4-3 WT or A77V. To prevent secondary infection, 5 µM Maraviroc was added to the medium at 24 h p.i. The proportion of infected cells was determined by immunostaining using antiserum against CA at 6d p.i. Three independent experiments each, using cells from different donors, were conducted for lentivirally and AAV transduced cells, and infections were performed in triplicate per condition in each experiment. The graph shows mean values and SEM for the proportion of infected cells from all data sets. Statistical significance was assessed with two-tailed non-paired Mann-Whitney test; **p=0.0008, ***p<0.0001, n.s.: not significant, a.u.: arbitrary unit. Please refer to Figure 3—figure supplement 1 for data sets from individual experiments. (B) Correlation between CPSF6 levels and infectivity. MDM were transduced with AAV and infected as in (A). CPSF6 signal intensities from individual infected and non-infected cells were quantified as described in Materials and Methods. CPSF6 intensities per cell from six randomly selected wells were used to separate the population into quartiles (q1 <62. q2 <95. q3 <117. q4 <353 a.u.) and the proportion of infected cells was determined for each quartile. Symbols represent mean values calculated for samples from three individual donors; lines indicate the mean value from each data set. For each condition,>10,000 cells were analyzed, per donor. (C) MDM were transduced with lentiviral vectors and infected with HIV-1 NL4-3 4059-WT, as described in (A). CPSF6 signal intensities from individual infected and non-infected cells were quantified as described in Materials and Methods. The graph shows CPSF6 intensity values from n individual NS or K/D cells for the total (left) and infected (right) cell population. Median values are indicated by red lines. Statistical significance was assessed with two-tailed non-paired Mann-Whitney test; ***: p<0.0001. a.u.: arbitrary unit. (D) MDM were infected with HIV-1 NL4-3 WT or A77V, as described above, in the presence of 2.5 µM PF74. At 24 h p.i. 5 µM Maraviroc was added to the medium. Cells were fixed 6d p.i. and the proportion of infected cells was determined by immunostaining using antiserum against CA. Two independent experiments, using cells from four donors, were performed. Infections were performed in triplicate per condition in each experiment. The graph shows mean values and SEM for the proportion of infected cells from all data sets. Statistical significance was assessed with two-tailed non-paired Mann-Whitney test; **p=0.0013, ***p<0.0001, n.s.: not significant.
-
Figure 3—source data 1
Effect of CPSF6 depletion on HIV-1 infectivity in primary macrophages.
Data corresponds to raw infectivity data of macrophages infected with WT or A77V HIV-1 after CPSF6 knock-down (Figure 3A), percentage of infected cells in populations separated by quartiles (Figure 3B), and to mean CPSF6 signal intensities of infected and non-infected cells under non-silencing (NS control) or knock-down conditions (k/d) (Figure 3C). Raw infectivity data of cells infected in the presence of 2.5 µM PF74 is also included in the file.
- https://doi.org/10.7554/eLife.41800.015
Figure 3—figure supplement 1

Knockdown efficiency and HIV-1 infectivity in primary macrophages from different donors.
MDM were transduced with lentiviral (+LV; Donors 1–3) or AAV vectors (+AAV; Donors 4–6) and subsequently infected with HIV-1 NL4-3 4059-WT or HIV-1 NL4-3 4059-A77V as in Figure 3. (A) Cells were fixed and stained with anti-CPSF6 antibody and Hoechst stain. Box plots show the distribution of CPSF6 signal intensities from n cells subjected to non-silencing (black) or knock-down (gray) conditions. Whiskers represent minimum and maximum values. Statistical significance was assessed by two-tailed unpaired Mann Whitney test; ***p<0.0001. (B) At 6d p.i., cells were fixed and proportions of infected cells were determined as described in Figure 3. The graph shows mean values of infectivity and SEM from all the donors.
-
Figure 3—figure supplement 1—source data 1
Mean CPSF6 signal intensities of individual cells from multiple donors after CPSF6 knock-down.
- https://doi.org/10.7554/eLife.41800.016
Figure 3—figure supplement 2
Relative infectivity of the N74D CA variant.
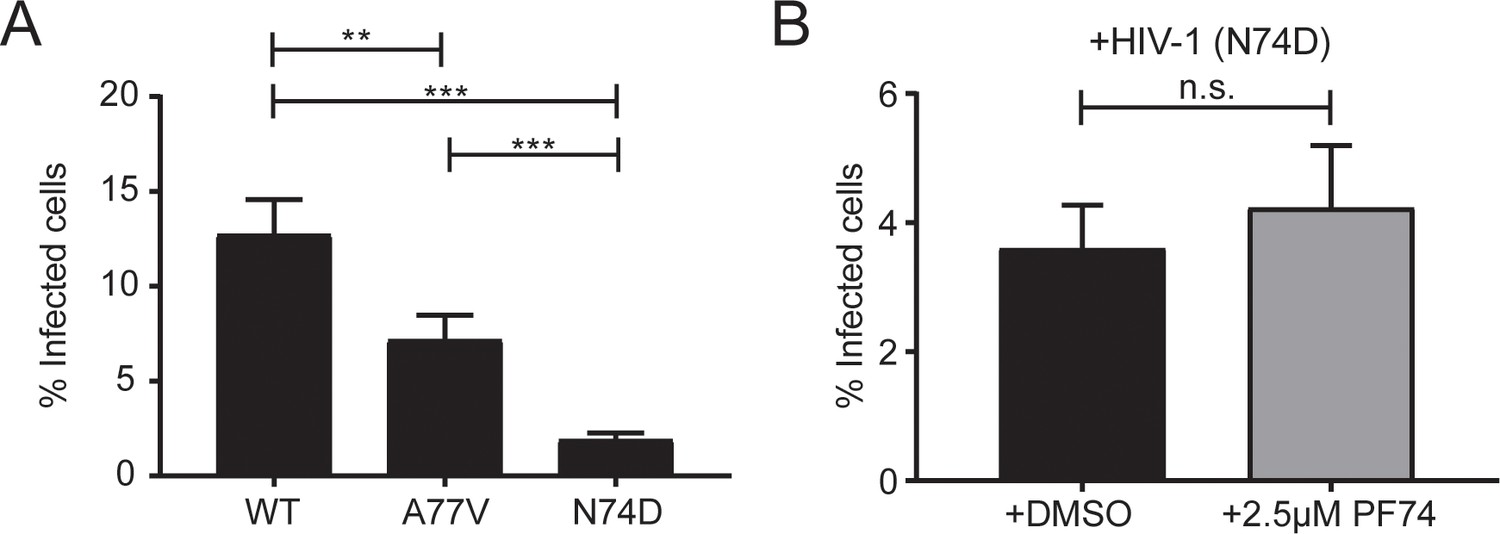
MDM from the same donors as in Figure 3 were infected with HIV-1 NL4-3 4059-N74D as described in Materials and Methods. (A) At 6d p.i., cells were fixed and proportions of infected cells were determined as described in Figure 3. Statistical significance was assessed by two-tailed unpaired Mann Whitney test; **p=0.0008, ***p<0.0001. (B) Cells from four donors were infected with HIV-1 NL4-3 4059-N74D in the presence of DMSO or 2.5 µM PF74 as described in Figure 3. At 6d p.i., cells were fixed and proportions of infected cells were determined as in (A). Statistical significance was assessed by two-tailed unpaired Mann Whitney test; n.s.: not significant.
-
Figure 3—figure supplement 2—source data 2
Raw infectivity data of primary macrophages from multiple donors infected with N74D HIV-1.
- https://doi.org/10.7554/eLife.41800.017
Figure 4 with 1 supplement
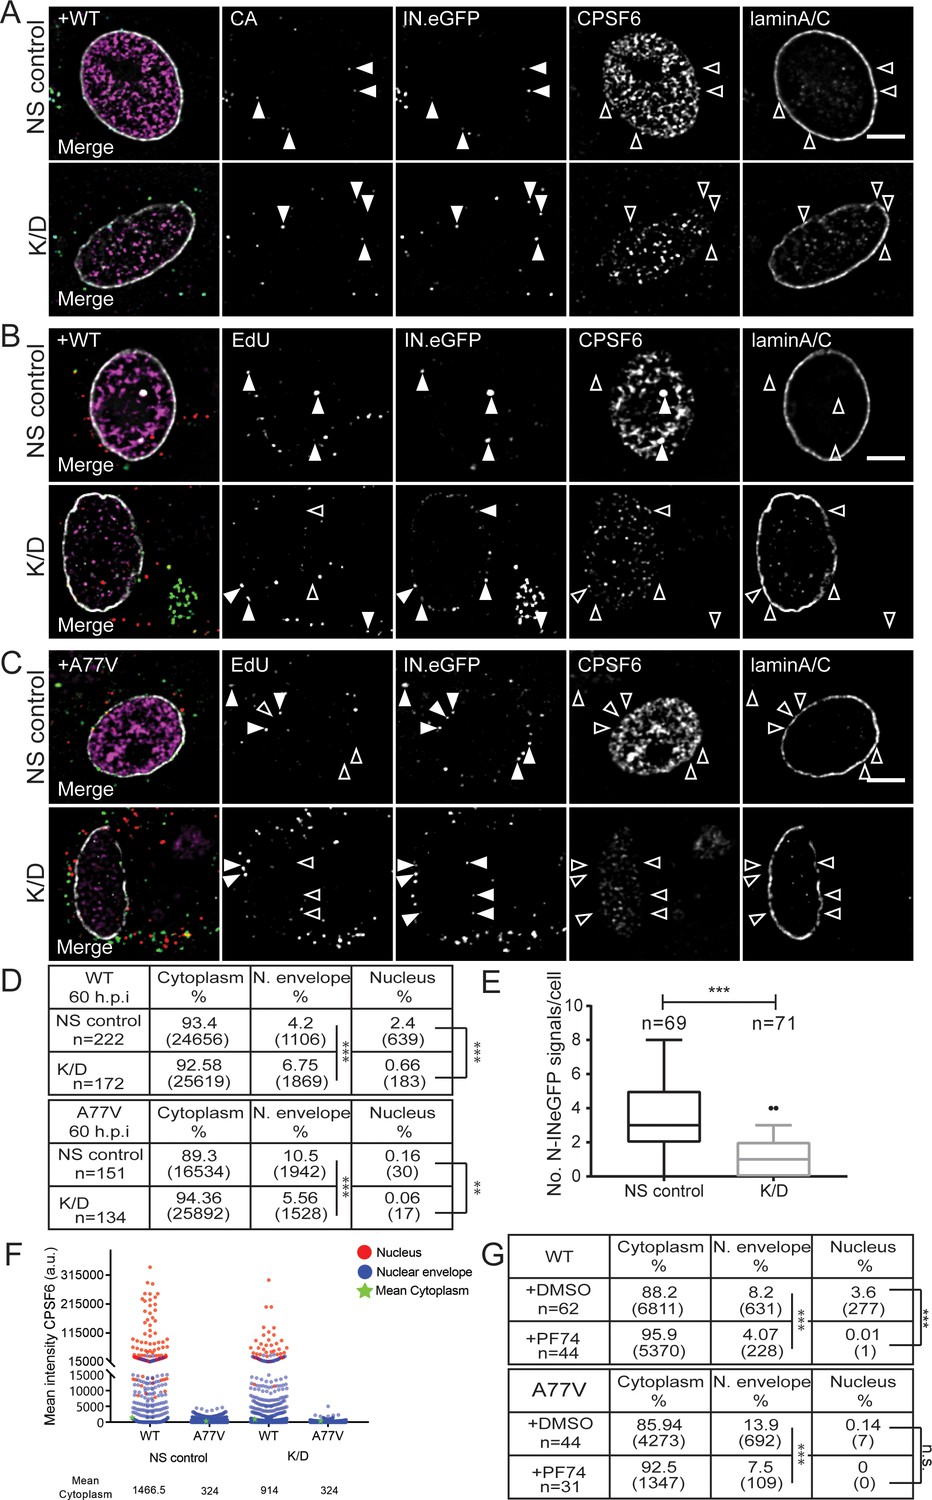
Effect of CPSF6 knock-down on nuclear entry.
MDM were transduced with AAVs as described in Materials and Methods. Subsequently, cells were infected with 100 ng CA (MOI 14.5) of HIV-1 NL4-3 WT (IN.eGFP) (A, B) or A77V (IN.eGFP) (C) in the presence of 10 µM EdU. (A) At 24 h p.i., cells were fixed, and immunostained for CA (cyan), CPSF6 (magenta) and laminA/C (white). Filled arrowheads indicate IN.eGFP signals co-localizing with CA in cells displaying WT (NS control) or low (K/D) CPSF6 signal intensity. Open arrowheads indicate no co-localization for the respective marker. See Figure 4—figure supplement 1 for corresponding data obtained with HIV-1NL4-3 A77V. (B, C) At 60 h p.i., cells were fixed, click-labeled and immunostained against CPSF6 (magenta) and laminA/C (white). Solid arrowheads indicate IN.eGFP positive objects co-localizing with EdU in infected cells displaying WT (NS control) or low (K/D) CPSF6 signal intensity. Open arrowheads indicate lack of co-localization for the respective marker. Images in A-C show representative z-sections through the nuclear region of infected cells. IN.eGFP and EdU signals in the merged panels are represented in green and red, respectively. (D) Analysis of individual objects detected in cells from four donors at 60 h p.i. Tables summarize the subcellular distribution of IN.eGFP positive objects in n cells from four donors in three independent experiments, infected with HIV-1 NL4-3 WT (IN.eGFP) or the A77V variant (IN.eGFP) at 60 h p.i. with or without knock-down of CPSF6. Numbers of detected objects are given in parentheses. Proportions of nuclear or close to the nuclear envelope IN.eGFP objects with and without CPSF6 knock-down were compared using a two-tailed Z-test (α = 0.05); **: p=0.0002. ***: p<0.0001. (E) Numbers of nuclear IN.eGFP positive objects per cell in WT HIV-1 infected cells displaying normal (NS control) or low (K/D) CPSF6 signal intensity. Whiskers represent 5 and 95 percentile. Statistical significance was assessed with two-tailed non-paired Mann Whitney test; ***: p<0.0001. (F) Mean intensities of CPSF6 signals co-localizing with individual IN.eGFP positive objects at the indicated subcellular localization in cells infected with HIV-1 NL4-3 WT (IN.eGFP) or the A77V variant (IN.eGFP) and displaying normal (NS control) or low (K/D) CPSF6 signal intensity (related to panel D). (G) Analysis of individual objects detected in cells from two donors at 60 h p.i. Tables summarize the subcellular distribution of IN.eGFP positive objects in n cells from two donors infected with HIV-1 NL4-3 WT (IN.eGFP) or A77V (IN.eGFP) at 60 h p.i. in the presence of DMSO or 2.5 µM PF74. Numbers of detected objects are given in parentheses. Proportions of IN.eGFP objects in the absence or presence of PF74 located in the nucleus or close to the nuclear envelope were compared using a two-tailed Z-test (α = 0.05); ***p<0.0001, n.s.: not significant. See Figure 4—figure supplement 1 for corresponding imaging data.
-
Figure 4—source data 1
Effect of CPSF6 knock-down on nuclear entry.
Data corresponds to number of nuclear IN.eGFP signals per cell after CPSF6 depletion in primary macrophages (Figure 4E) and mean CPSF6 signal intensities of individual WT and A77V HIV-1 subviral complexes at 60 h p.i. at different subcellular localizations in cells under non-silencing or CPSF6 knock-down conditions (Figure 4F).
- https://doi.org/10.7554/eLife.41800.020
Figure 4—figure supplement 1

Effect of CPSF6 knockdown on trafficking of RTC/PIC to the nuclear envelope and effect of addition of PF74 on nuclear entry.
MDM were transduced with AAV as described in Materials and Methods. (A) Cells were infected with 100 ng CA (MOI 14.5) HIV-1 NL4-3 4059-A77V (IN.eGFP) in the presence of 10 µM EdU. At 24 h p.i., cells were fixed and immunostained with anti-CPSF6 (magenta), anti-CA (cyan) and anti-laminA/C (white) antibodies. Solid arrowheads indicate IN.eGFP signals co-localizing with CA signals in cells displaying wt (NS control) or low (K/D) CPSF6 signal intensity. Open arrowheads serve as a spatial reference. Images show representative z-sections through the nuclear region of infected cells. IN.eGFP signals in the merged panels are represented in green. Scale bars: 5 µm. (B) Tables on the left summarize the distribution of IN.eGFP positive objects detected at 24 h.p.i. in n cells from two donors infected with HIV-1 NL4-3 4059-WT (IN.eGFP) or HIV-1 NL4-3 4059-A77V (IN.eGFP) under non-silencing or knock-down conditions. Proportions of IN.eGFP objects localized in the nucleus were determined based on micrographs and data were analyzed using a two-tailed Z-test (α = 0.05); ***p<0.0001. (C) Mean intensities of CPSF6 signals associated with single IN.eGFP positive objects, detected at the indicated subcellular localization in the data from the tables in (B). (D, E) MDM from two donors in two independent experiments were infected with HIV-1 NL4-3 4059-WT (IN.eGFP) (D) or HIV-1 NL4-3 4059-A77V (IN.eGFP)(E) in the presence of 2.5 µM PF74 and 10 µM EdU as described in Figure 4. At 60 h p.i., cells were fixed, click-labeled and immunostained with anti-CA antiserum (cyan) and anti-laminA/C (white) antibody. IN.eGFP and EdU signals in the merged panels are represented in green and red, respectively. Arrows in (D) indicate HIV-1 RTC/PIC. Open arrows serve as a spatial reference. Box in (E) marks a large number of EdU negative VLP in the cytoplasmic area, a predominant phenotype observed under the given conditions. See main Figure 4G for quantification. Scale bars: 5 µm.
-
Figure 4—figure supplement 1—source data 1
Mean CPSF6 signal intensities of individual WT and A77V HIV-1 subviral complexes after 24 h p.i. at different subcellular localizations in cells under non-silencing or CPSF6 knock-down conditions (Figure 4—figure supplement 1).
- https://doi.org/10.7554/eLife.41800.021
Figure 5
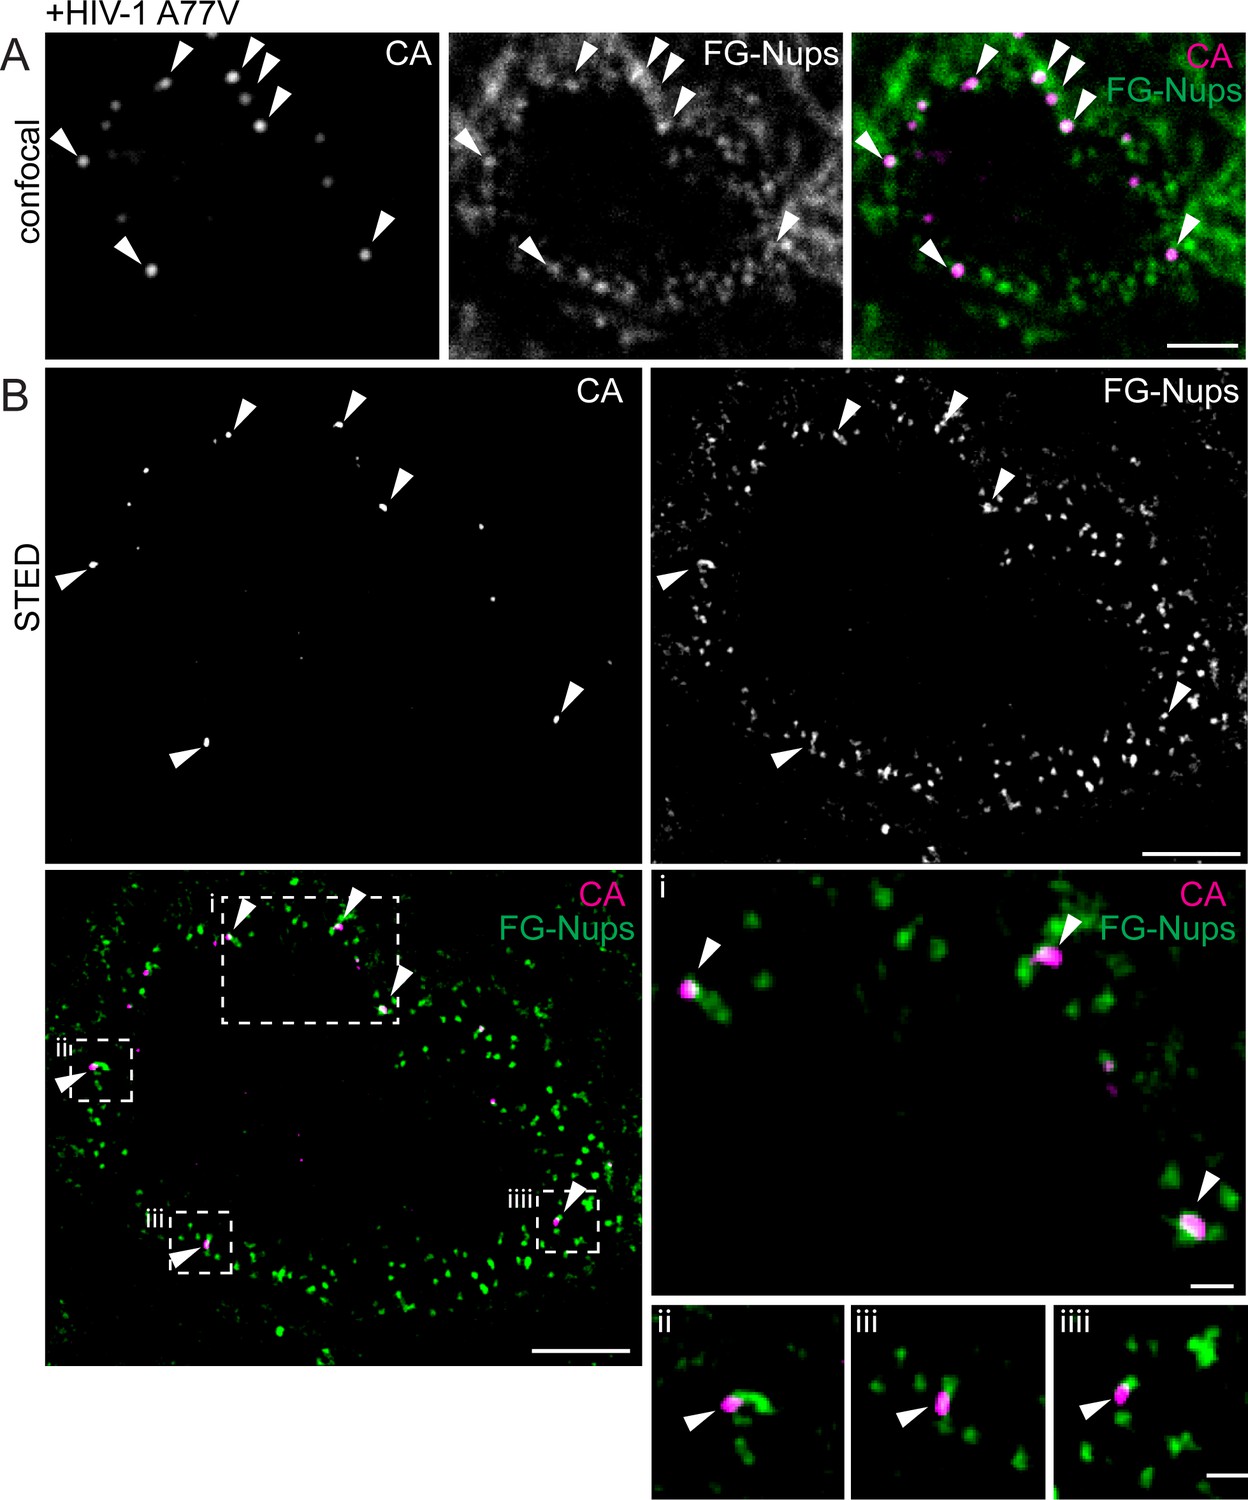
Visualization of RTC/PIC of A77V HIV-1 at the NPC using STED nanoscopy.
MDM from two donors were infected with 100 ng CA (MOI 14.5) of HIV-1 NL4-3 A77V (IN.eGFP) for 60 hr, fixed and immunostained using antibodies against CA (magenta) and NPC proteins (FG repeats; green). (A) Confocal images of the nucleus of a representative infected cell. (B) STED images of the same infected cell. Enlargements of the four boxed regions are shown to the right of the overlay image. Arrows indicate CA positive objects co-localizing with NPC proteins. Scale bars: 2 µm (confocal images), 500 nm (STED images).
Figure 6

HIV-1 subviral complexes arrested at the NPC analyzed by STED nanoscopy.
MDM were transduced with AAVs expressing shRNAs targeting CPSF6 (A, B) or non-targeted shRNA (C, D) as described in Materials and Methods. Subsequently, cells were infected with 100 ng CA (MOI 14.5) of HIV-1 NL4-3 WT (IN.eGFP) (A, B) or HIV-1 NL4-3 A77V (IN.eGFP) (C, D). At 60 h p.i., cells were fixed and immunostained against CA (magenta) and Nup153 (green). (A, C) Confocal images of the nucleus of a representative infected cell (upper panels) and super resolved images of boxed regions (lower panels). Super resolved images are shown as an overlay on the right (magenta – CA, green – Nup153). Boxed region in the overlayed images (dashed line) are shown as an enlargement. Arrows indicate CA positive objects partially co-localizing with Nup153. Scale bars: 2 µm (confocal images), 500 nm (STED images) (B, D) Averaged line profiles from (A) or (C) of selected CA positive objects (n = 30, from two independent experiments). Error bars represent SD.
Figure 7
Association of CPSF6 and Nup153 analyzed by STED nanoscopy.
MDM were transduced with AAV expressing shRNAs targeting CPSF6 (B, C) or non-targeted shRNA (A) as described in Materials and Methods. Subsequently, cells were infected with 100 ng CA (MOI 14.5) of HIV-1 NL4-3 WT (IN.eGFP) (A, C) or HIV-1 NL4-3 A77V (IN.eGFP) (B). At 60 h p.i., cells were fixed and immunostained against CPSF6 (magenta) and Nup153 (green). (A–C) Confocal images of the nucleus of a representative infected cell (upper panels) and super resolved images of boxed regions (lower panels). Super resolved images are also shown as an overlay on the right (magenta – CPSF6, green – Nup153, yellow – IN.eGFP (diffraction-limited)). Boxed region in the merged image (dashed line) is shown as an enlargement above the merge. Scale bars: 2 µm (confocal images). 500 nm (STED images). Arrowheads indicate IN.eGFP positive objects at the nuclear membrane. (D) Averaged line profile from (C) of selected IN.eGFP positive objects (n = 30, from two independent experiments). Error bars represent SD.
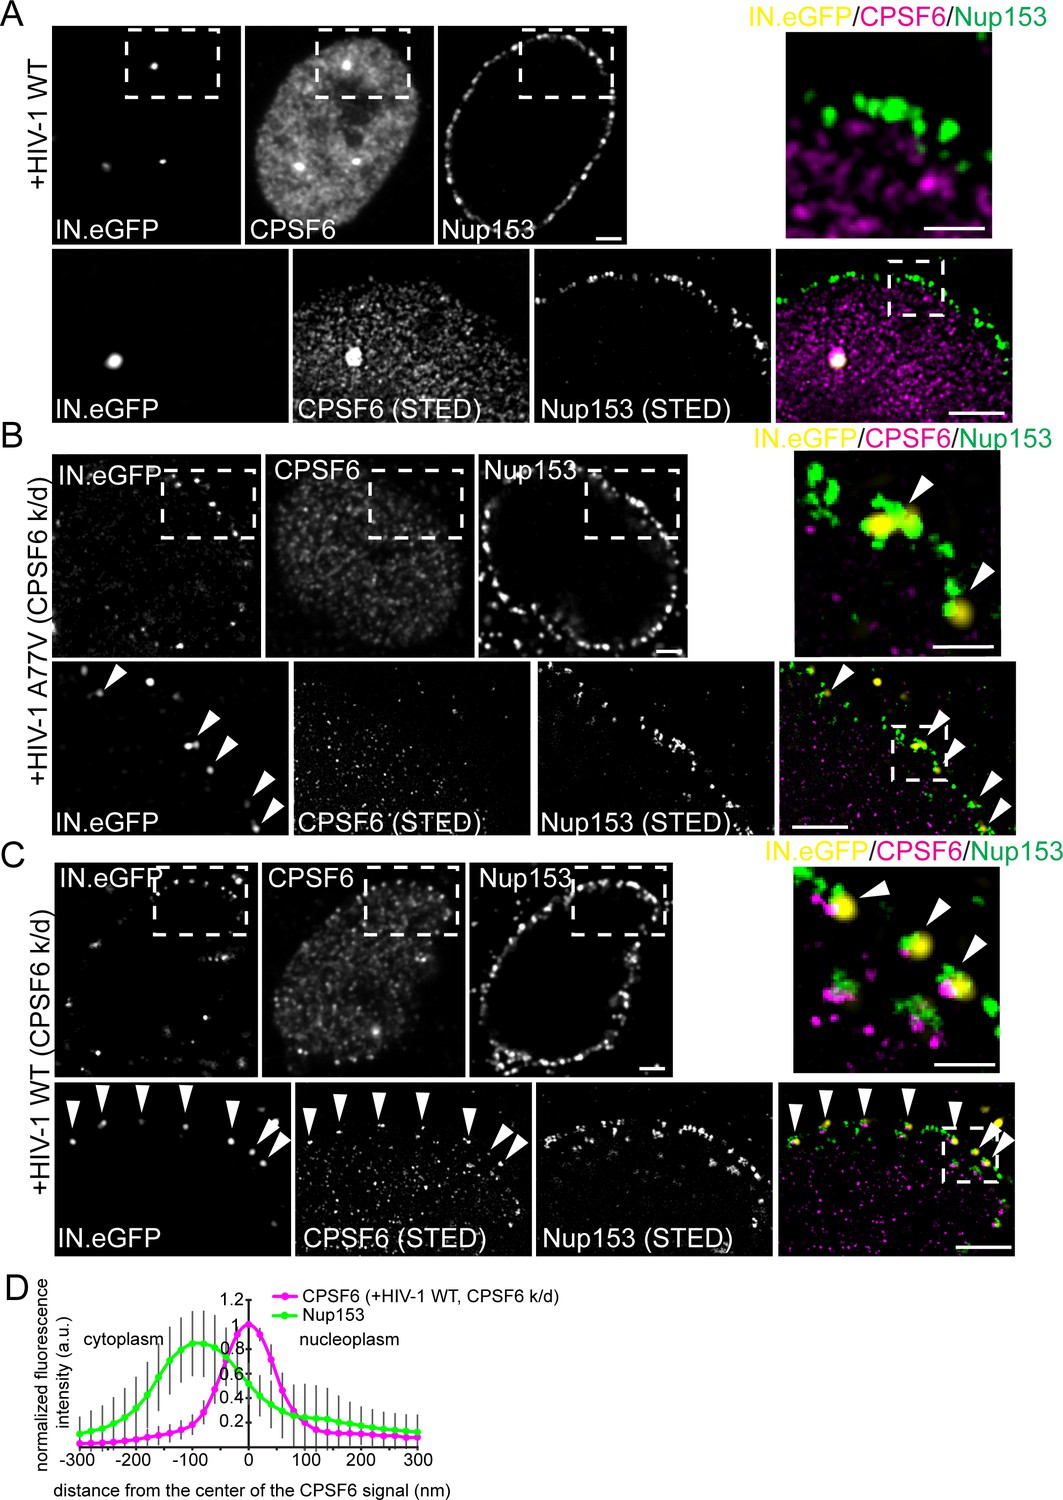
Figure 8
Model for the interaction of Nup153 and CPSF6 with the incoming HIV-1 capsid at the NPC of primary macrophages.
HIV-1 subviral complexes (depicted as a cone) at the NPC interact with Nup153 (represented as blue dots) at the nuclear basket via a capsid-derived structure. CPSF6 (represented as green dots) competitively binds to CA multimers of this structure displacing Nup153 and ultimately releasing the subviral complex from the NPC.
Author response image 1
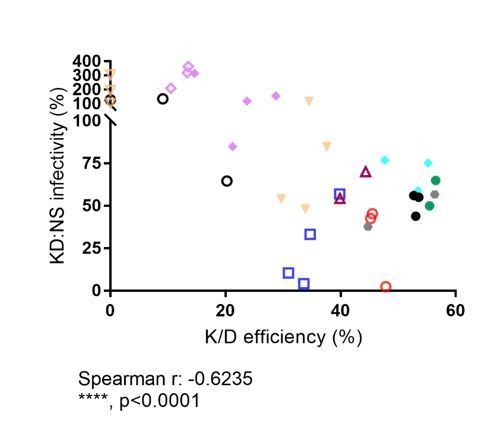
Relative infectivity in CPSF6 knock-down cells normalized to infectivity in non-silencing control cells vs. bulk CPSF6 knock-down efficiency determined for the respective sample.
Different symbols represent different donors. Open symbols: LV-mediated knockdown; filled symbols, AAV vector mediated knockdown.
Videos
Video 1
Related to Figure 6.
3D super resolution imaging and co-localization analysis of MDM infected with HIV-1 NL4-3 4059-A77V (IN.eGFP). The video shows a 3D reconstruction of the entire nucleus of an MDM infected with HIV-1 NL4-3 4059-A77V (IN.eGFP) at an MOI of 14.5 for 60 hr. For co-localization analysis both Nup153 and CA signals were modeled as ellipsoids with Z axis = 1.5*X,Y axis. Green – Nup153; magenta – CA; red, CA/Nup153 co-localizing structures.
Tables
Key resources table
| Reagent type (species) or resource | Designation | Source or reference | Identifiers | Additional information |
|---|---|---|---|---|
| Antibody | Alexa fluor conjugated secondary antibodies | Thermo Fisher Scientific | IF (1:1000) | |
| Antibody | Goat anti-mouse IgG Abberior STAR RED | Sigma-Aldrich; Cat# 52283 | IF (1:200) | |
| Antibody | Goat anti-rabbit IgG Atto 594 | Sigma-Aldrich; Cat# 77671 | IF (1:200) | |
| Antibody | Goat polyclonal HRP anti-rabbit IgG | Jackson ImmunoResearch Labs; Cat# 111-035-144 | RRID:AB_2307391 | ELISA (1:2000) |
| Antibody | Mouse monoclonal anti-hCPSF5 | Sigma-Aldrich; Cat# SAB1404890 | RRID:AB_10739397 | IF(1:100) |
| Antibody | Mouse monoclonal anti-hFG repeats (Nuclear Pore Complex) | Abcam; Cat# ab24609 | RRID:AB_448181 | IF(1:300) |
| Antibody | Mouse monoclonal anti-hLamin A/C | Santa Cruz Biotechnology; Cat# sc-7292 | RRID:AB_627875 | IF (1:100) |
| Antibody | Mouse monoclonal anti-hLEDGF | BD Biosciences; Cat# 611714 | RRID:AB_399192 | IF(1:100) |
| Antibody | Mouse monoclonal anti-hNup153 | Abcam; Cat# ab24700 | RRID:AB_2154467 | IF (1:250) |
| Antibody | Rabbit polyclonal anti-hCPSF6 | Atlas Antibodies; Cat# HPA039973 | RRID:AB_10795242 | IF(1:250) |
| Antibody | Rabbit polyclonal anti-hCPSF7 | Atlas Antibodies Cat# HPA041094 | RRID:AB_10794187 | IF(1:200) |
| Antibody | Rabbit polyclonal anti-HIV-1 CA | In-house | IF(1:1000) | |
| Antibody | Sheep polyclonal anti-HIV-1 CA | In-house | IF (1:1200) | |
| Cell line (H. sapiens) | HeLaP4 TNPO3-KD | Z Debyser (University of Leuven, Belgium); Thys et al. (2011) | ||
| Cell line (H. sapiens) | TZM-bI indicator cells | Wei et al. (2002) | RRID: CVCL_B478 | |
| Cell line (Homo sapiens) | Human embryonic kidney 293 T cells (HEK293T) | Pear et al. (1993) | RRID: CVCL_0063 | |
| Chemical compound, drug | Efavirenz (EFV) | AIDS Research and Reference Reagent Program, Division AIDS, NIAID | ||
| Chemical compound, drug | Flavopiridol | Sigma-Aldrich; Cat#F3055 | ||
| Chemical compound, drug | iQ Supermix | BioRad; Cat#1708860 | ||
| Chemical compound, drug | Maraviroc (MVC) | Sigma-Aldrich; Cat#PZ0002 | ||
| Chemical compound, drug | PF-3450074 (PF74) | Sigma-Aldrich; Cat#SML0835 | ||
| Chemical compound, drug | Raltegravir (RAL) | AIDS Research and Reference Reagent Program, Division AIDS, NIAID | ||
| Commercial assay or kit | Click-iT EdU Alexa Fluor 647 Imaging kit | Thermo Fisher Scientific; Cat#C10340 | ||
| Commercial assay or kit | DIG-Nick translation mix | Roche; Cat#11745816910 | ||
| Commercial assay or kit | InviTrap Spin Universal RNA Mini kit | Stratec; Cat#1060100300 | ||
| Commercial assay or kit | SuperScript III Reverse transcriptase kit | Thermo Fisher Scientific; Cat#18080093 | ||
| Commercial assay or kit | TSA Plus system | Perkin Elmer; Cat#NEL749A001KT | ||
| Recombinant DNA reagent | AAV helper plasmid | D Grimm (University of Heidelberg, Germany) | AAV helper plasmid expressing rep and cap genes for transducing MDM | |
| Recombinant DNA reagent | CPSF6 triple shRNA | This study | Plasmid expressing three shRNAs targeting CPSF6. For packaging into AAV vector. | |
| Recombinant DNA reagent | NS control AAV | K Boerner (University of Heidelberg, Germany); Börner et al. (2010) | Plasmid expressing non-targeted shRNA. For packaging into AAV vector. | |
| Recombinant DNA reagent | pEnv-4059 | R Swanstrom (University of North Carolina, USA); Schnell et al. (2011) | Plasmid expressing an R5-tropic HIV-1 Env | |
| Recombinant DNA reagent | pHIVSIREN | G Towers (University College London, UK); Rasaiyaah et al. (2013) | Plasmids expressing shRNAs targeting CPSF6 or non-targeting shRNA | |
| Recombinant DNA reagent | pMD2.G | D Trono (EPFL, Lausanne, Switzerland) | RRID: Addgene_12259 | Plasmid expressing VSV-G |
| Recombinant DNA reagent | pNL4-3 | Adachi et al. (1986) | HIV-1 proviral plasmid | |
| Recombinant DNA reagent | pNL4-3ΔEnv | B Müller (University of Heidelberg, Germany) | HIV-1 proviral plasmid | |
| Recombinant DNA reagent | pNL4-3ΔEnv N74D/A77V | This study | HIV-1 proviral plasmid | |
| Recombinant DNA reagent | pNLC4-3ΔTat | T Müller (University of Heidelberg, Germany) | HIV-1 proviral plasmid | |
| Recombinant DNA reagent | psPAX2 | D Trono (EPFL, Lausanne, Switzerland) | RRID: Addgene_35002 | Lentiviral packaging vector |
| Recombinant DNA reagent | pVAE2AE4-5 | D Grimm (University of Heidelberg, Germany); Matsushita et al. (1998) | Adenoviral helper plasmid | |
| Recombinant DNA reagent | pVpr.IN.eGFP | A Cereseto (CIBIO, Mattareo, Italy); Albanese et al. (2008) | Plasmid expressing Vpr.IN.eGFP fusion | |
| Software, algorithm | Autoquant X3 | Media Cybernetics | RRID:SCR_002465 | |
| Software, algorithm | GraphPad Prism | GraphPad | RRID:SCR_002798 | |
| Software, algorithm | Image J | Image J | RRID:SCR_003070 | |
| Software, algorithm | Imaris 8.1 | BitPlane AG | RRID:SCR_007370 | |
| Software, algorithm | Imspector | Abberior Instruments | RRID:SCR_015249 | |
| Software, algorithm | KNIME | Konstanz Information Miner | RRID:SCR_006164 | |
| Software, algorithm | Volocity | Perkin Elmer | RRID:SCR_002668 |
Additional files
-
Source data 1
Correlation analysis.
Correlation between CPSF6 knock-down efficiency and HIV-1 infectivity. Spearman correlation of CPSF6 knock-down efficiency and K/D:NS infectivity ratio from multiple donors.
- https://doi.org/10.7554/eLife.41800.027
-
Transparent reporting form
- https://doi.org/10.7554/eLife.41800.028
Download links
A two-part list of links to download the article, or parts of the article, in various formats.
Downloads (link to download the article as PDF)
Open citations (links to open the citations from this article in various online reference manager services)
Cite this article (links to download the citations from this article in formats compatible with various reference manager tools)
HIV-1 nuclear import in macrophages is regulated by CPSF6-capsid interactions at the nuclear pore complex
eLife 8:e41800.
https://doi.org/10.7554/eLife.41800


