ATP-induced asymmetric pre-protein folding as a driver of protein translocation through the Sec machinery
- University of Bristol, United Kingdom
- King's College London, United Kingdom
- University of St Andrews, United Kingdom
- Imperial College London, United Kingdom
- University of South Bohemia in Ceske Budejovice, Czech Republic
Figures
Figure 1 with 1 supplement
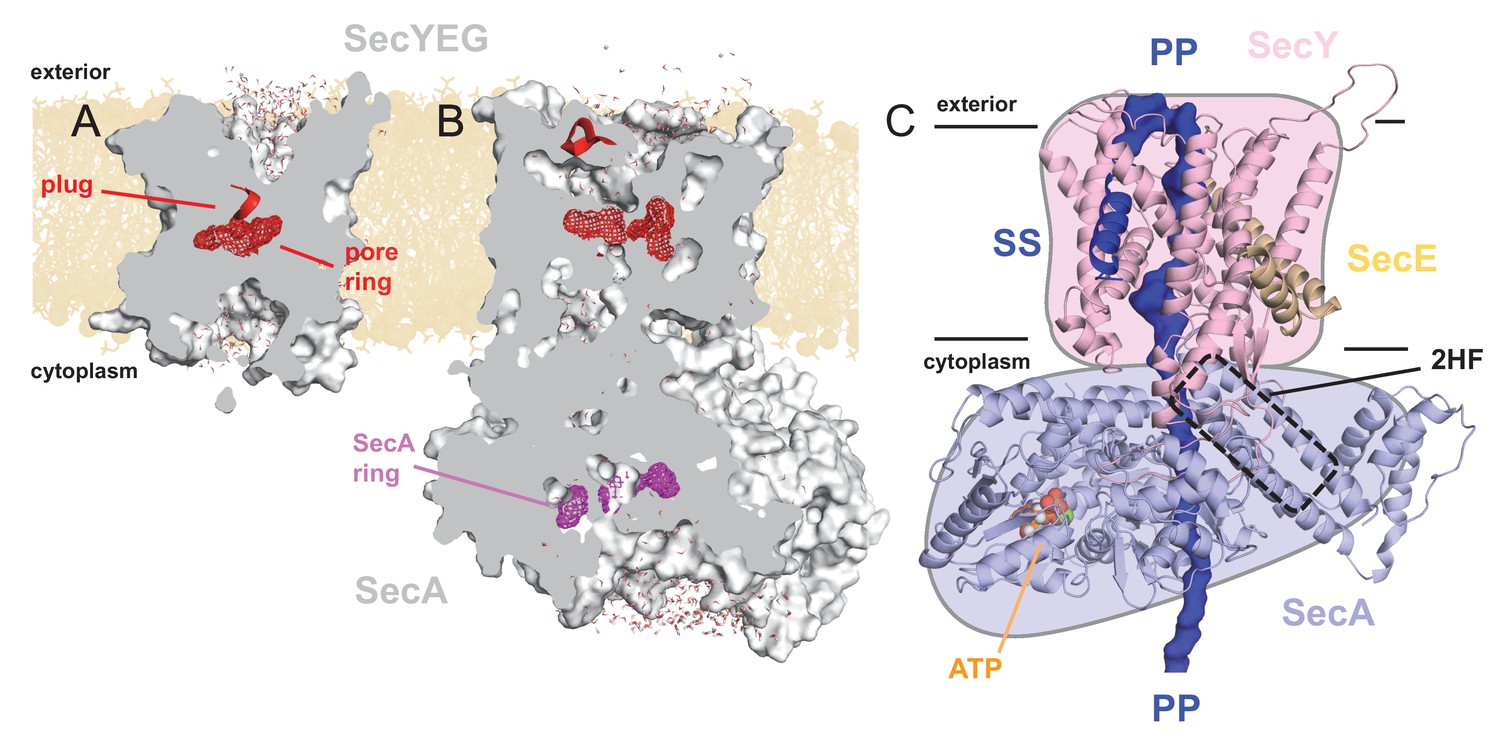
Structures of SecYEG and SecA.
Interior views of (A) SecYEβ (PDB 1RHZ; Van den Berg et al., 2004) and (B) SecYEG-SecA (PDB 3DIN; Zimmer et al., 2008) showing the cavities through the channel, with the protein in grey surface, the pre-protein pore constrictions in red (SecY) or purple (SecA) mesh, and the SecY plug in red helix. The image was produced by embedding the crystal structures in a POPC membrane, solvating with explicit waters and allowing the non-heavy atoms to relax through restrained molecular dynamics (MD) over 4 ps. Degree of solvation and water density in the channel to be considered for illustrative purposes only. (C) Cartoon representation of SecA-SecYEG with an engaged pre-protein, modelled from PDB 5EUL (Li et al., 2016). SecY is shown in light pink, SecE orange, and SecA light-blue, with the 2HF highlighted. The unfolded pre-protein is shown in dark blue surface, labelled ‘PP’, and the signal sequence as blue cartoon (‘SS’). The ATP analogue is coloured as orange (phosphate), blue (nitrogen) and red (oxygen) spheres. The approximate position of the membrane is marked. The cartoon is overlaid on a coloured schematic, used throughout the manuscript.
Figure 1—figure supplement 1
Details on remodelling of the SecA-SecYE-PP complex.
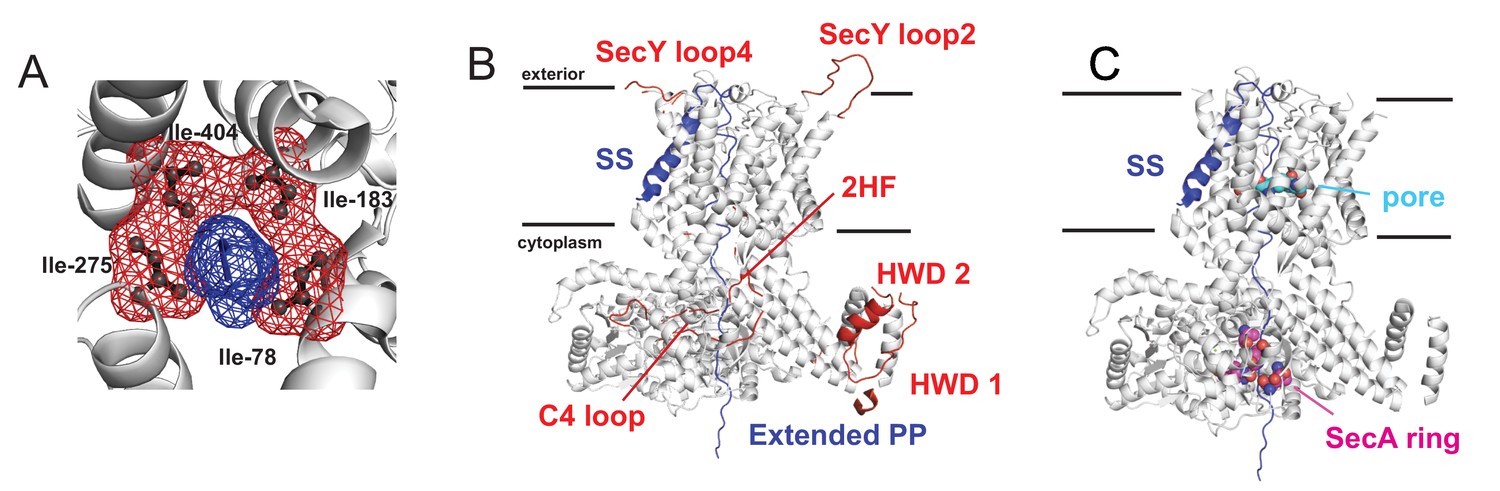
(A) Showing how the pre-protein sits in the pore in the original crystal coordinates (Li et al., 2016), with SecY shown as white cartoon, the four pore ring residues (Ile-78, Ile-183, Ile-275 and Ile-404) shown as black sticks and red mesh, and a small section of the pre-protein shown in blue. (B) In white cartoon are the coordinates for SecA and SecYE kept from the original crystal structure (Li et al., 2016). Selected loops which were modelled here are shown as red cartoon and labelled as per Table 1. The modelled pre-protein is shown in blue: the signal sequence and section through SecY are from the crystal coordinates (Li et al., 2016); the section through SecA is labelled ‘Extended PP’. (C) Showing the known pre-protein interactions sites within SecA and SecYE. The SecY pore is shown as light blue spheres, and some of the key SecA pre-protein crosslinking sites in SecA as purple spheres (Bauer and Rapoport, 2009).
Figure 2 with 4 supplements
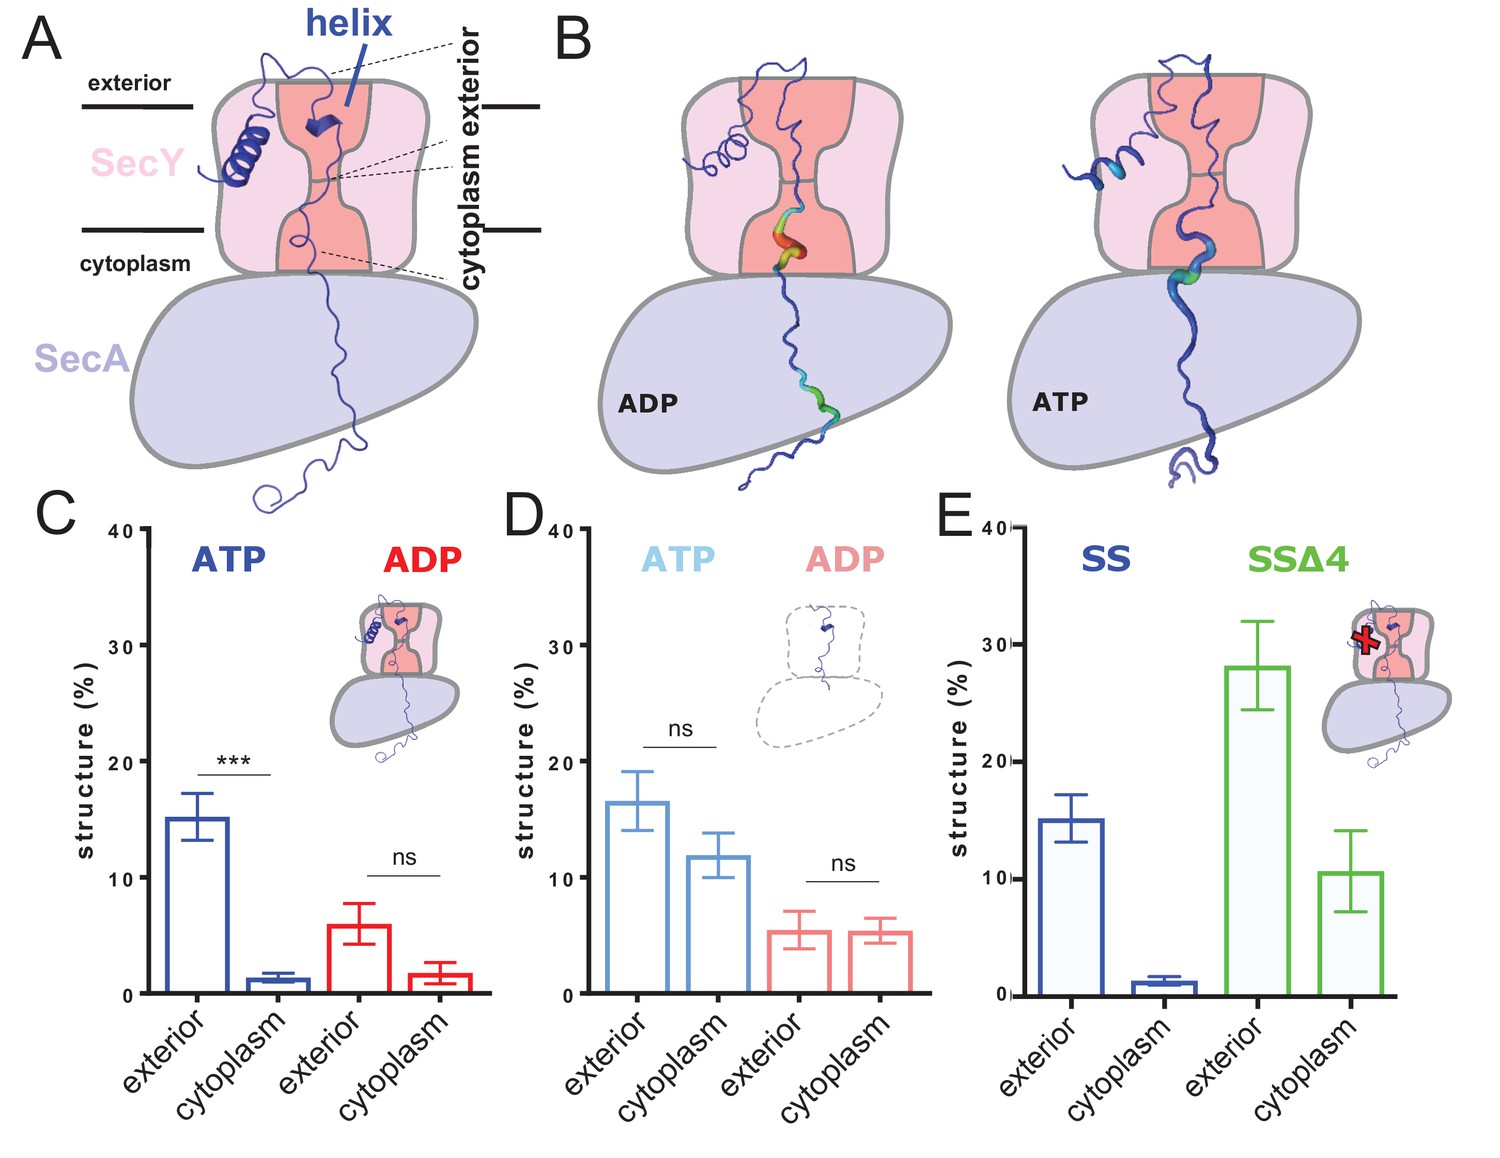
ATP-dependent asymmetric folding of pre-protein in the Sec translocon.
(A) A 1 µs MD snapshot of the pre-protein from the SecA-SecYE-PP complex with ATP bound, overlaid on the SecA-SecY schematic from Figure 1C. A region of α-helix, as computed by the dictionary of secondary structure of proteins (DSSP) and confirmed visually, is visible in the exterior cavity. The approximate position of the membrane is shown, and each nine residue stretch of pre-protein used for folding analyses, respectively in the exterior and cytoplasmic cavities, are indicated by dashed lines. (B) Deformation analysis of the pre-protein within SecA-SecYEG. SecA-SecY is shown as a schematic, and the pre-protein is shown as tube, color-coded and sized according to its deformation energy (low deformation blue and thin; high deformation red and wide). Analysis reveals three major sites with high deformation energy; at the beginning of the signal sequence, in the SecY cytoplasmic cavity, and in the SecA ring. The former is more pronounced in the ATP state, the latter two in the ADP-bound state (see Figure 2—figure supplement 4A). (C) The degree of pre-protein folding in the exterior and cytoplasmic cavities of SecY in the ADP and ATP states. Shown are the combined datasets for the mirrored and tandem substrates (see Materials and methods for details), in either a simple or more complex bilayer supplemented with negative phospholipids (PG and cardiolipin). Data are collected from the ATP (blue) or ADP (red) bound states. There is a marked difference in degree of asymmetry in the ATP data, but not the ADP (p<0.0001 and p=0.0690 respectively, from two tailed t-tests). Error bars are s.e.m. The breakdown of data between uniform bilayers and those supplemented with negative phospholipids can be seen in Figure 2—figure supplement 4E. (D) As panel C, but showing the degree of folding in bulk water; that is, not in the presence of translocon. These analyses used the same pre-protein starting coodinates as panel C. In both the ATP (light blue) and ADP (pink) data, there is no significant difference between the cytoplasmic and exterior regions of pre-protein. Reported p values are 0.15 and 0.98. Error bars are s.e.m. (E) Comparison of folding data set with the wild-type signal sequence (blue; as per panel C) and a defective signal sequence (SSΔ4; green). The introduction of a defective signal sequence significantly increases the degree of pre-protein secondary structure in both the cytoplasmic and exterior cavities (p=0.021 and p=0.002). The breakdown of data can be seen in Figure 2—figure supplement 4B.
Figure 2—figure supplement 1
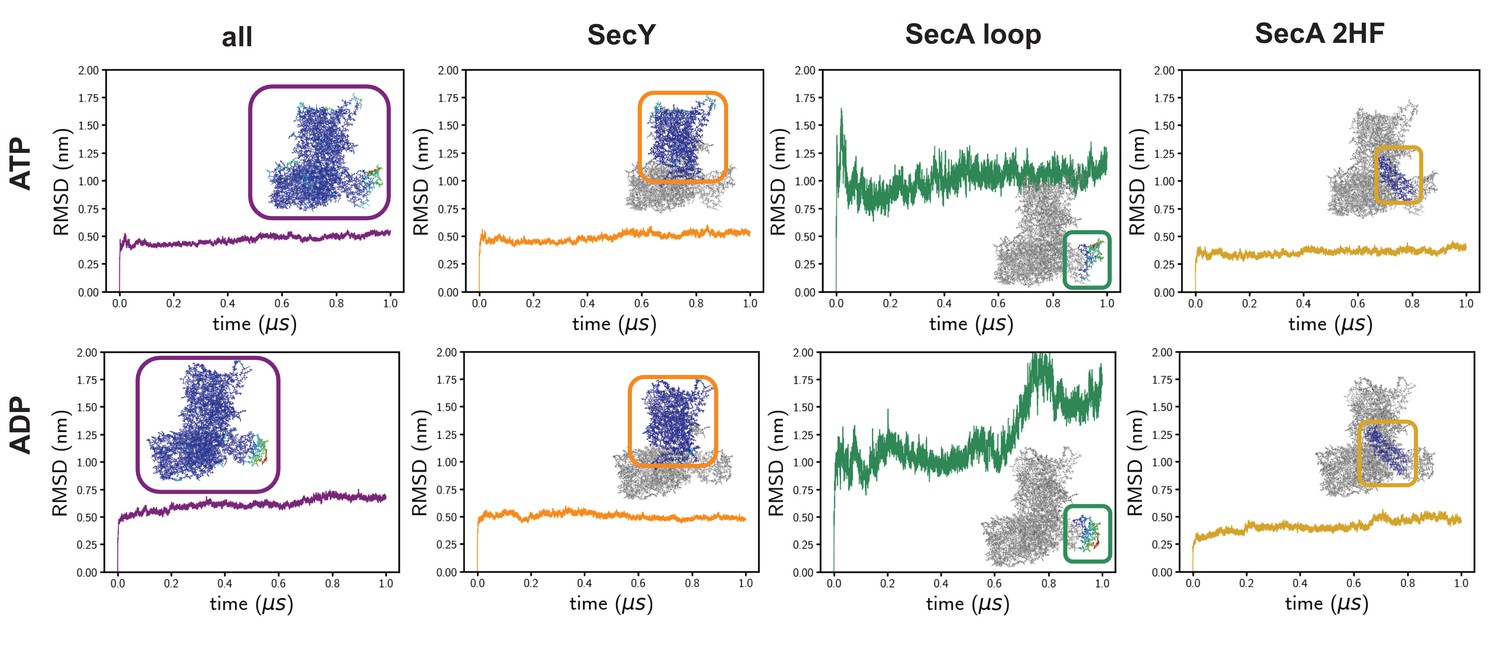
Time-evolving root-mean-squared displacements (RMSD) from the input coordinates.
On the left is the RMSD of all of the Cα atoms, which is the standard RMSD analysis. In these simulations, the RMSD is reasonably high, presumably as a result of the high degree of structural remodelling required. Root-mean-squared-fluctuation analyses reveal a very high degree of fluctuation in a specific SecA loop (green data), which affects the global analysis. The RMSDs of SecY alone – which is the region of interest in this study – are much lower and more stable (orange). The SecA 2HF is also highly stable (gold).
Figure 2—figure supplement 2
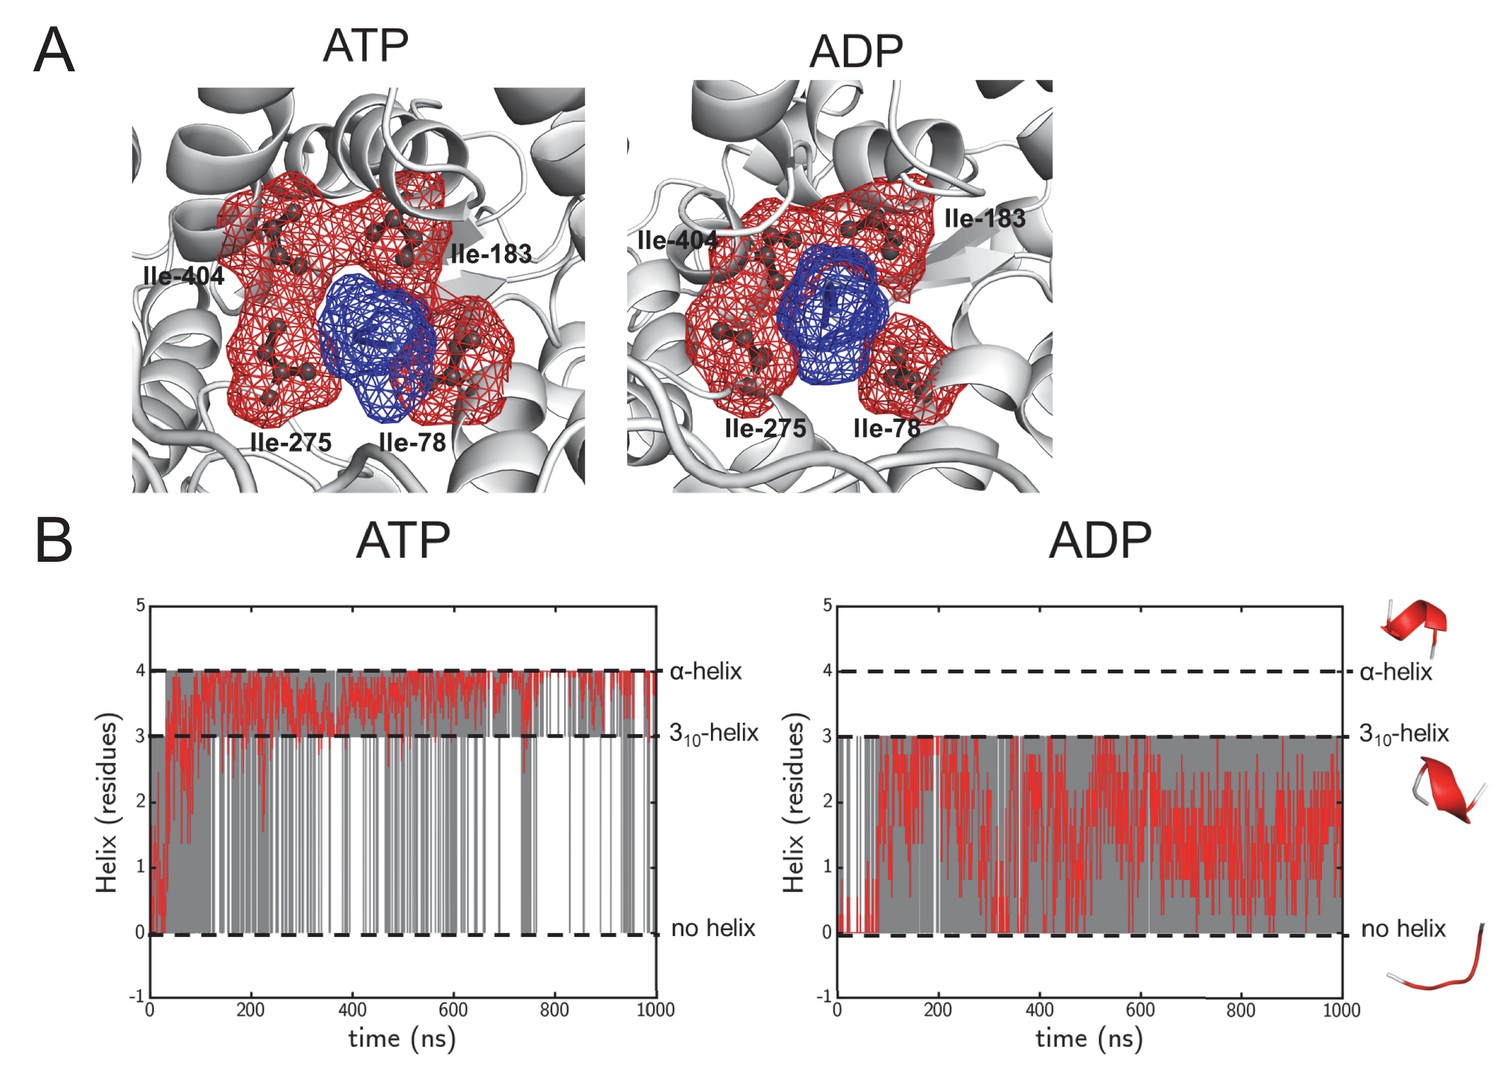
Structural highlights from the simulation data.
(A) As Figure 1—figure supplement 1A, but of the pore ring in the ADP- and ATP-bound simulations, using a 1 μs snap shot as an illustration. The pore remains tightly clasped around the pre-protein, making it a good system to study cross-pore asymmetry. (B) Following helix formation in the pre-protein during equilibrium MD. The raw data is shown in grey, and will either have a value of 0 (no helix), 3 (310-helix) or 4 (α-helix). On the right are examples of each state, taken from the same region of pre-protein in the ATP and ADP simulations. To increase the clarity of the data, a Savitzky-Golay smoothed data line is shown in red. After 100 ns the ATP state largely switches between 310-helix and α-helix, whereas the ADP state samples the no-helix conformation considerably.
Figure 2—figure supplement 3

Pre-protein structural changes in the channel.
(A) Deformation energy plotted as a function of residue index in substrate, starting from N-terminus of signal peptide (ATP state in blue, ADP state in red). The position in relation to the pre-protein is shown in the blue schematic above the graph. Three distinct regions with higher deformation energy are clearly visible and highlighted by ovals; in the signal sequence (‘SS’), the cytoplasmic cavity (‘cyto’) and SecA ring. These data are used for visualisation in Figure 2B. (B) The degree of hydrogen bonded secondary structure in the 18 residue stretch of glycine residues through the SecY channel, as determined using the dihedral-based DSSP analysis. The y-axis shows the number of residues considered secondary structure in each frame of the simulation. Note that the higher degree of secondary structure in the ATP-bound state meant that additional simulation time was required (top). Black circles mark the times that snapshots were taken for further analyses.
Figure 2—figure supplement 4
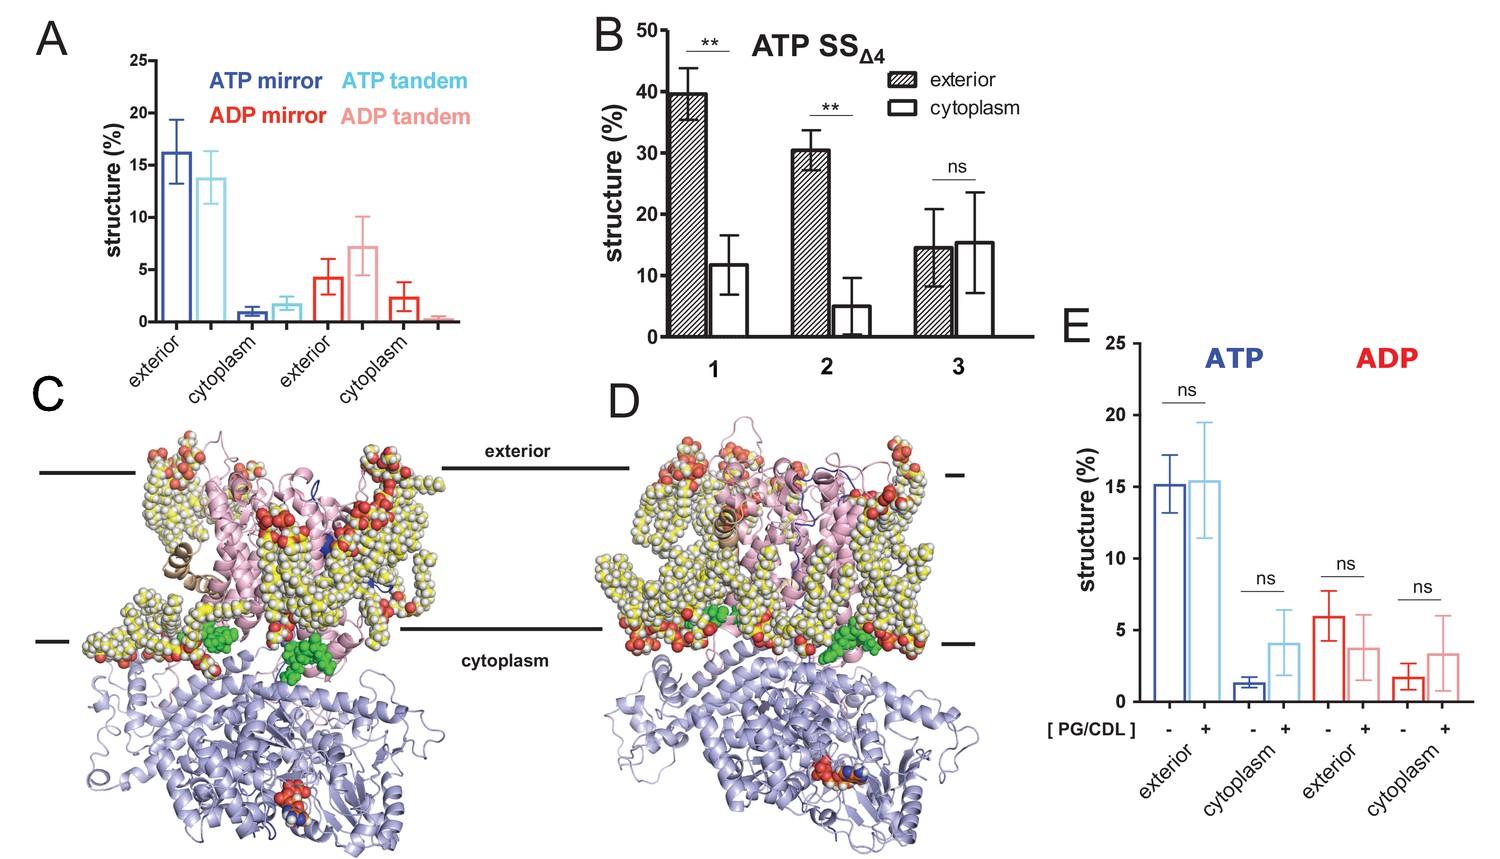
Expanded pre-protein folding data.
(A) Comparison of folding data gathered from the pre-protein in a mirrored (ELERQHTFAAFTHQRELE) or tandem (ELERQHTFAELERQHTFA) arrangement. (B) The degree of pre-protein folding in the exterior and cytoplasmic cavities of SecY, for the simulations of SecA-SecYE-PP with a defective signal sequence (SSΔ4), starting at three different snapshots (1 = 90 ns, 2 = 100 ns, 3 = 110 ns). Error bars are s.e.m, and reported significance is from two-tailed t-tests, where p=0.003 and p=0.002; p=0.938 for run 3. (C) View of SecA-SecYE complex with ATP following coarse-grained simulation and back mapping to an atomistic description. Show in spheres are acidic lipids (i.e. phosphatidylglycerol and cardiolipin) in contact with the complex. The other lipids and solvent have been omitted for clarity. (D) As panel C, but for the ADP-bound complex. (E) Comparison of folding data from systems in a simple (i.e. containing only 1-palmitoyl-2-oleoyl-sn-glycero-3-phosphocholine) membrane (dark blue and red) and a membrane containing acidic lipids (light blue and pink – labelled ‘PG/CDL’). There is no significant impact of lipid composition on pre-protein secondary structure formation; p-values=0.95, 0.06, 0.49 and 0.46 from a two tailed t-test.
Figure 3 with 2 supplements
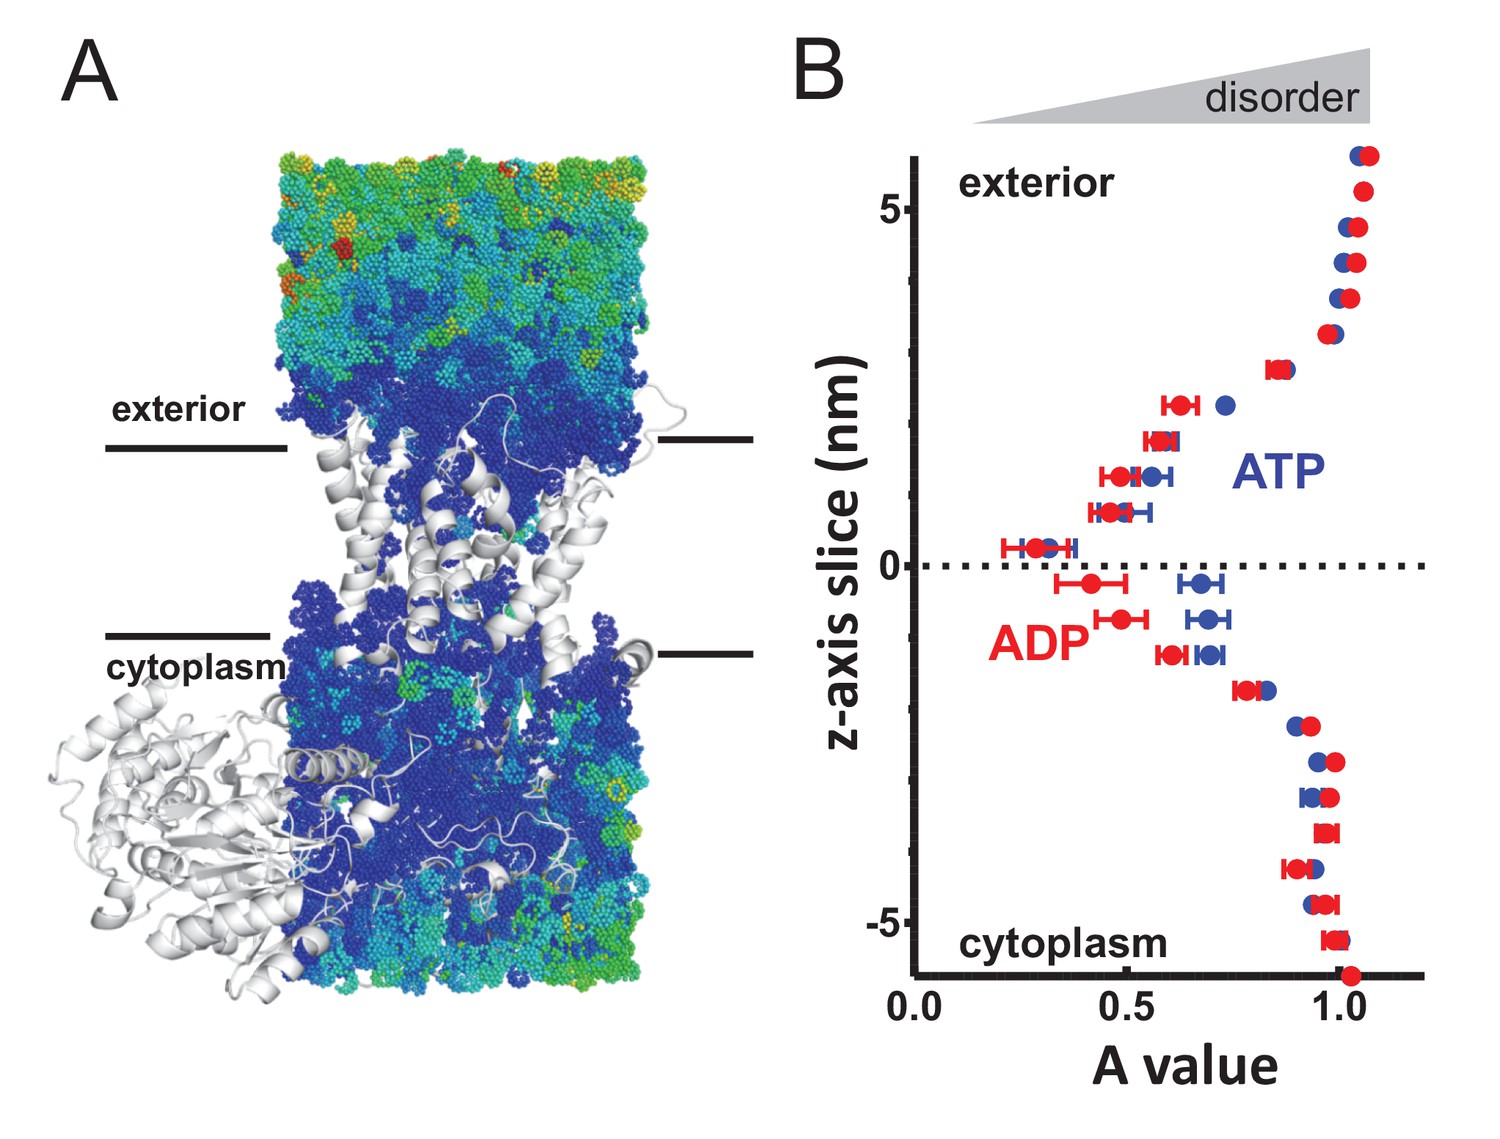
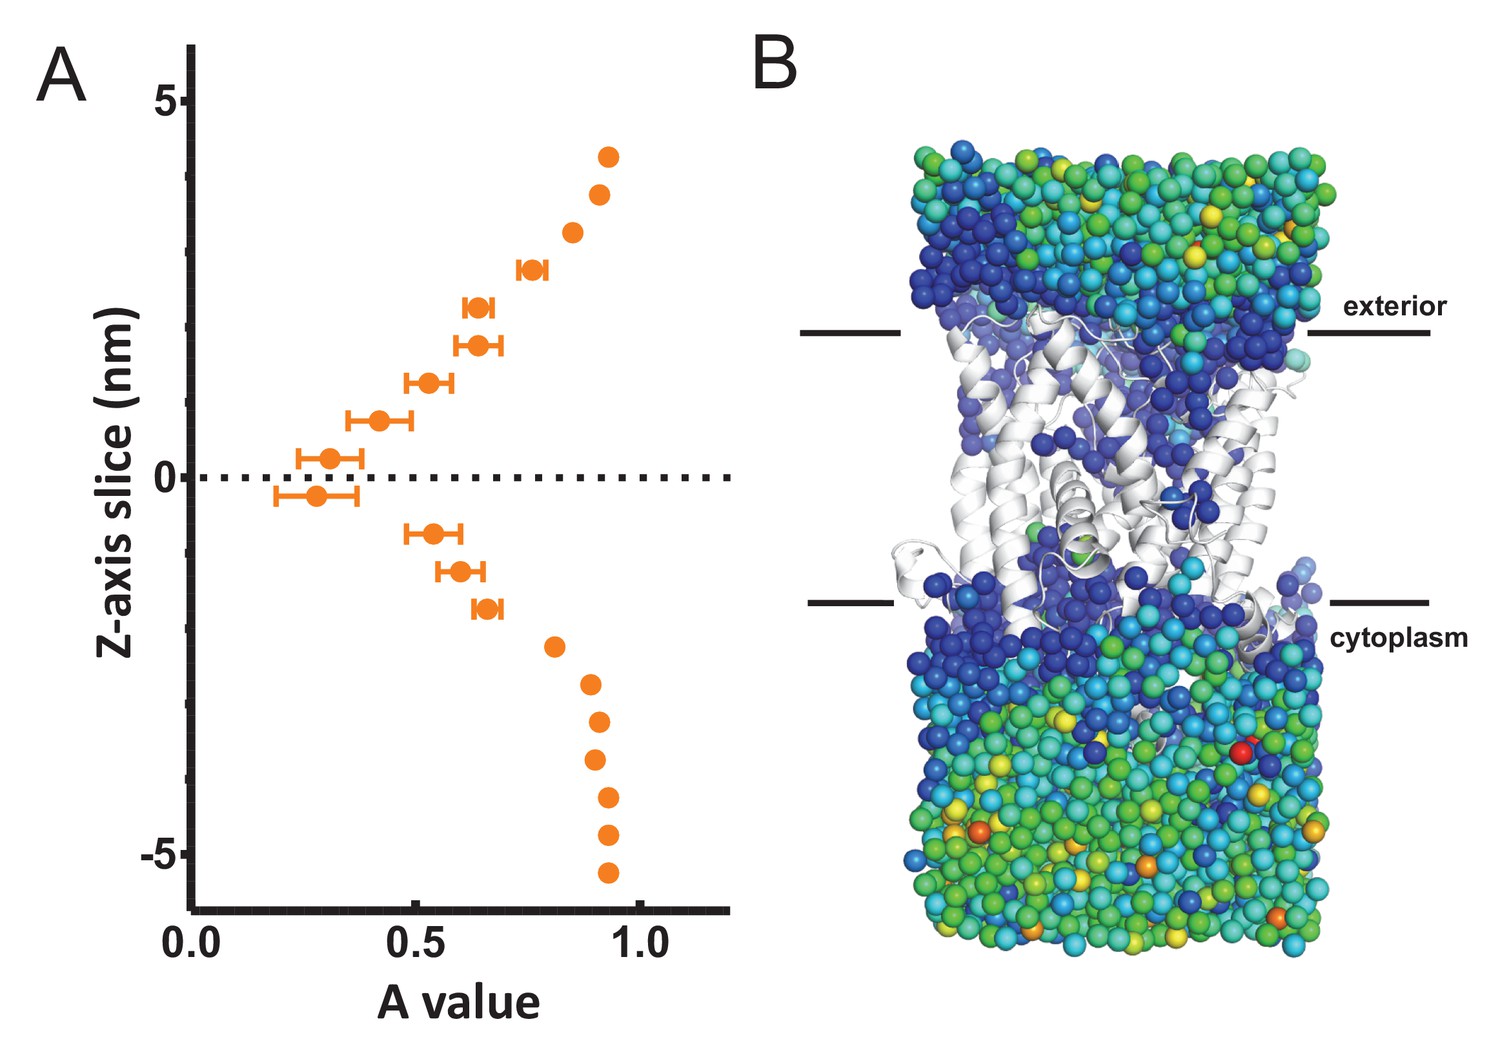
Perturbed water dynamics throughout the Sec translocon.
(A) Cartoon showing the prism of waters analysed for translational dynamics. The waters are shown as coloured dots, coloured according to degree of diffusion, with blue slowest and red highest. Note that whilst the membrane and solvent outside of this prism are missing from this figure, they were present in the simulation. (B) MSD data of the waters along the length of the protein. The average MSD was calculated for each 0.5 nm horizontal slice, the data fitted to a power law equation, and the power value ('A') for each slice was averaged across all 31 simulations. Here, the average for each slice is shown, with s.e.m as error bars. Both the ATP and ADP simulations are perturbed in the centre of SecY, but the waters in the ATP-bound complex are perturbed in an asymmetric manner.
Figure 3—figure supplement 1
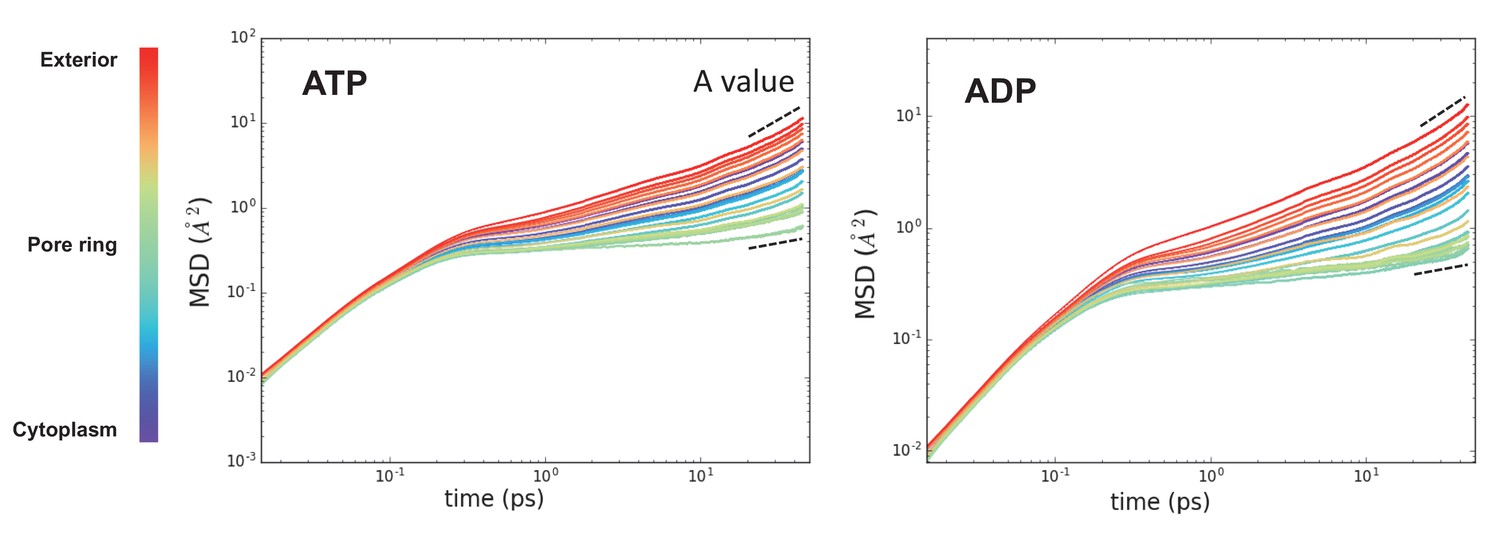
Raw MSD data from Figure 3.
These plots represent the time evolved MSD for the waters in each slice along the protein (coloured from purple to red). After about 10 ps, the data fits a simple power law function – highlighted with a dotted black line. Note that these data are averaged over the 31 time points. The perturbation of water dynamics at the centre of the pore is clearly visible in the green traces.
Figure 3—figure supplement 2
Analysis of waters through SecYEβ.
(A) Average MSD values along the length of the SecYEβ channel in isolation (Serek et al., 2004). Data analysed as per Figure 3B. This data agrees with previously published data (Capponi et al., 2015), and shows no asymmetry across the channel. (B) The raw MSD data for one simulation set (from the 1 µs time point) plotted onto the oxygens for each water molecule. The dark blue waters around SecY represent a lower MSD than the green/yellow waters in the bulk solvent.
Figure 4 with 1 supplement
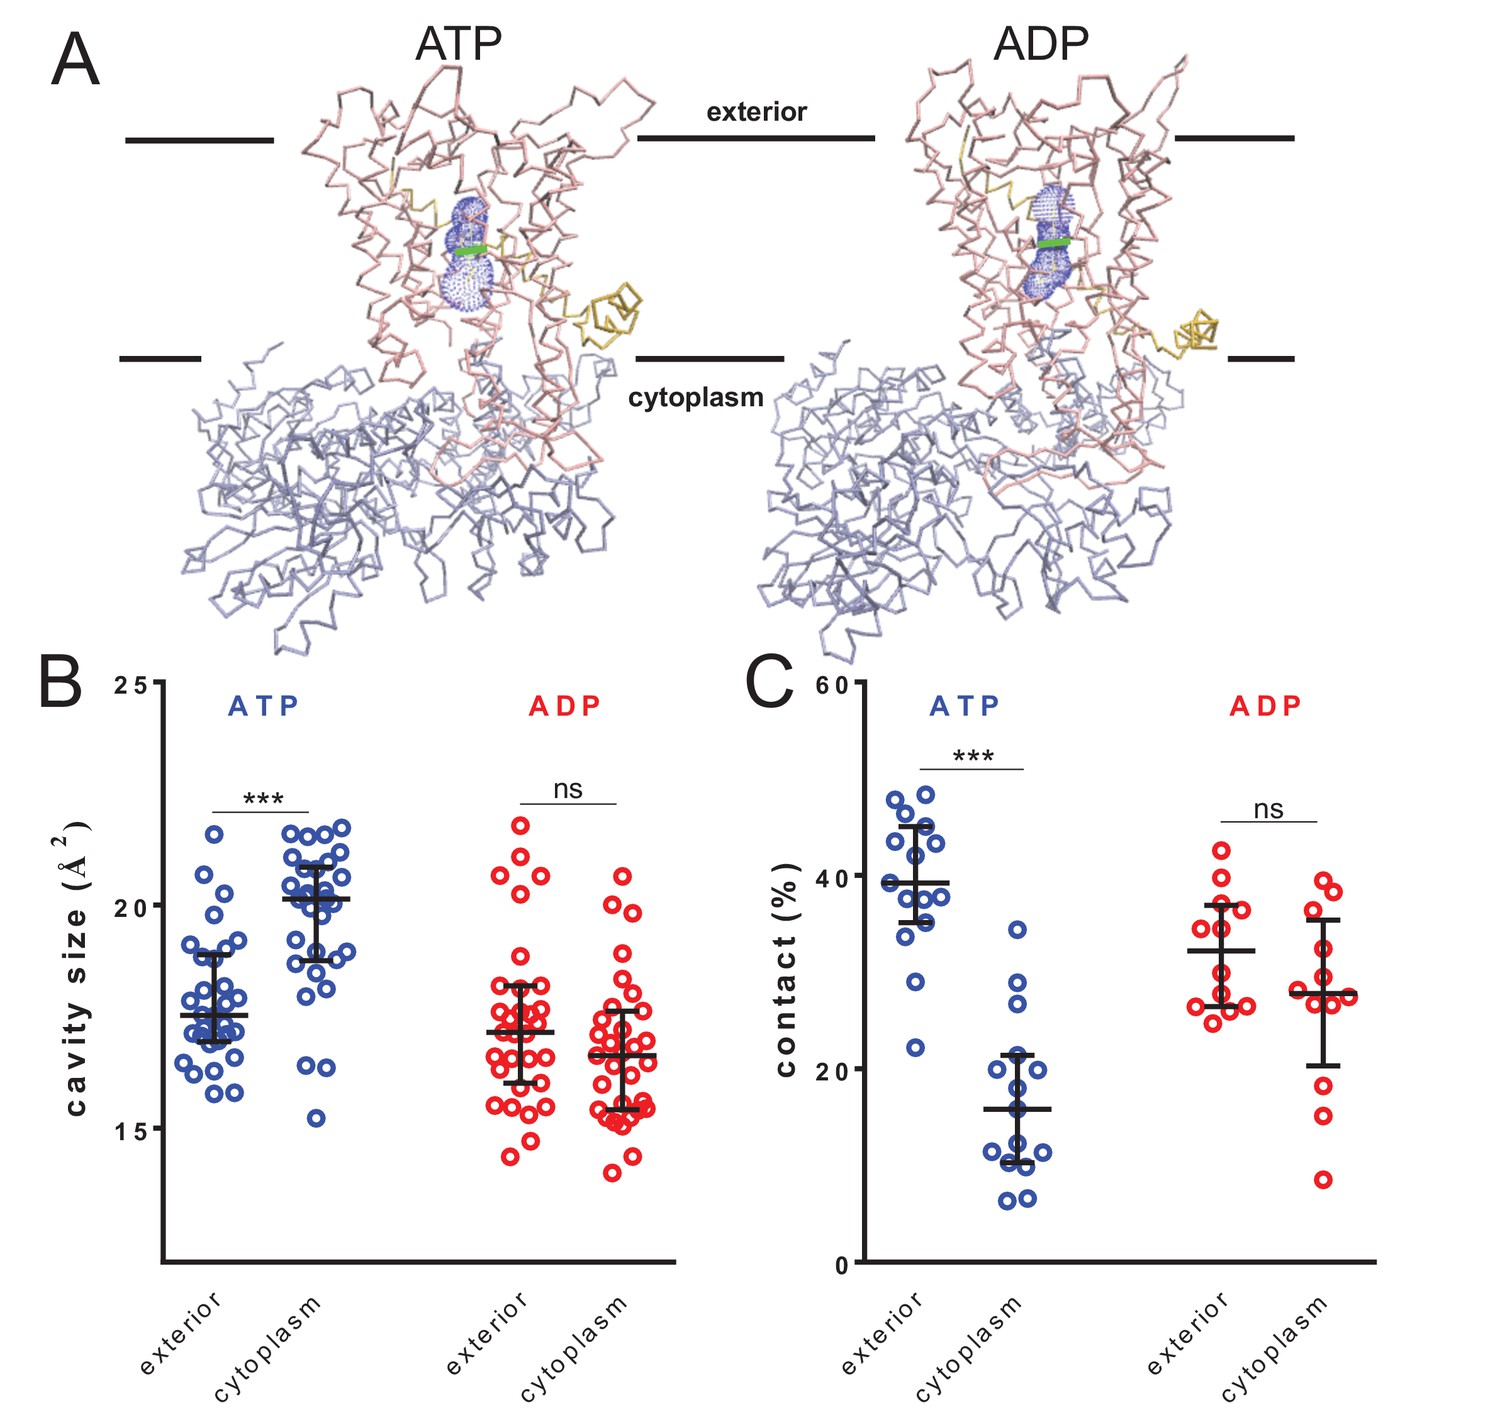
Nucleotide-driven cavity resizing in SecY.
(A) Representative HOLE data used for averaging analysis. The protein backbone is shown as coloured trace and the calculated cavity as blue mesh. The central coordinate from the HOLE program is shown as a green line. (B) Quantified cavity sizes from the ATP and ADP simulation data, plotting the median and interquartile range. The difference between the exterior and cytoplasmic cavities was tested against an unpaired two-tailed t-test, reporting p values of < 0.0001 and 0.1264 for ATP and ADP, respectively. (C) Degree of contact between the pre-protein and SecY channel, defined as inter-residue distances of less than 0.3 nm, averaged over all of the residues. Correlated with a wider cavity, there is significantly less contact in the cytoplasmic cavity in the ATP-bound state (p<0.0001), but not in the ADP-bound stage (p=0.1404).
Figure 4—figure supplement 1
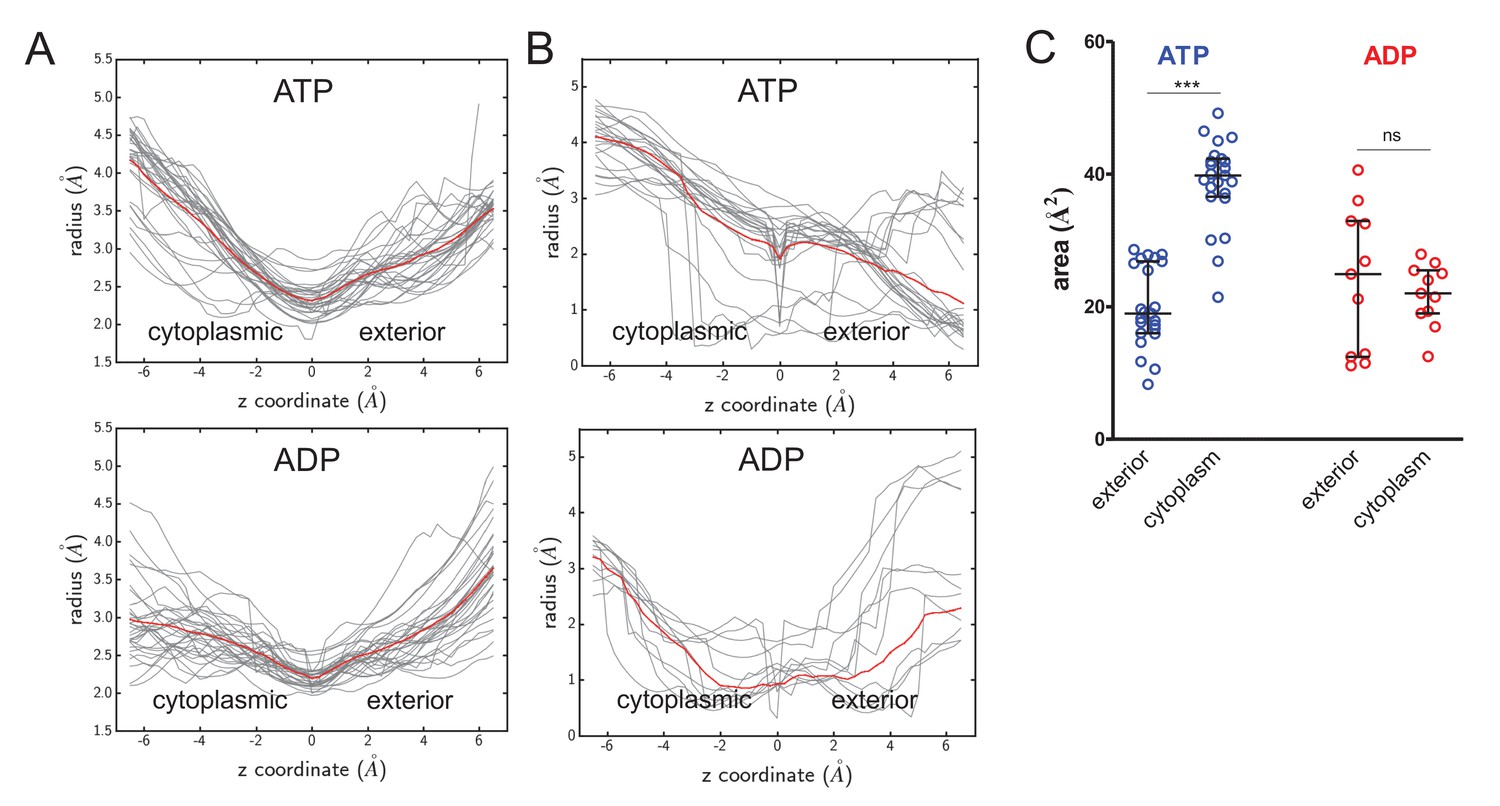
Cavity size analyses.
(A) Quantified cavity sizes (i.e.cavity radius in Å) from the ATP- and ADP-bound SecA-SecYE-PP simulations along the z-axis of the SecY channel. Used for secondary analysis in Figure 4B. All traces are shown in grey, with a running average plotted in red. (B) As panel A, but for simulation data of ATP and ADP bound SecA-SecYEG complexes without pre-protein, where models were built based on PDB 3DIN (Zimmer et al., 2008), and simulated as described previously (Allen et al., 2016). (C) Secondary analysis of the data from panel B. Plotted are the median and interquartile range. The difference between the exterior and cytoplasmic cavities was tested against an unpaired two-tailed t-test, reporting p values of < 0.0001 and 0.5672 for ATP and ADP, respectively.
Figure 5 with 2 supplements
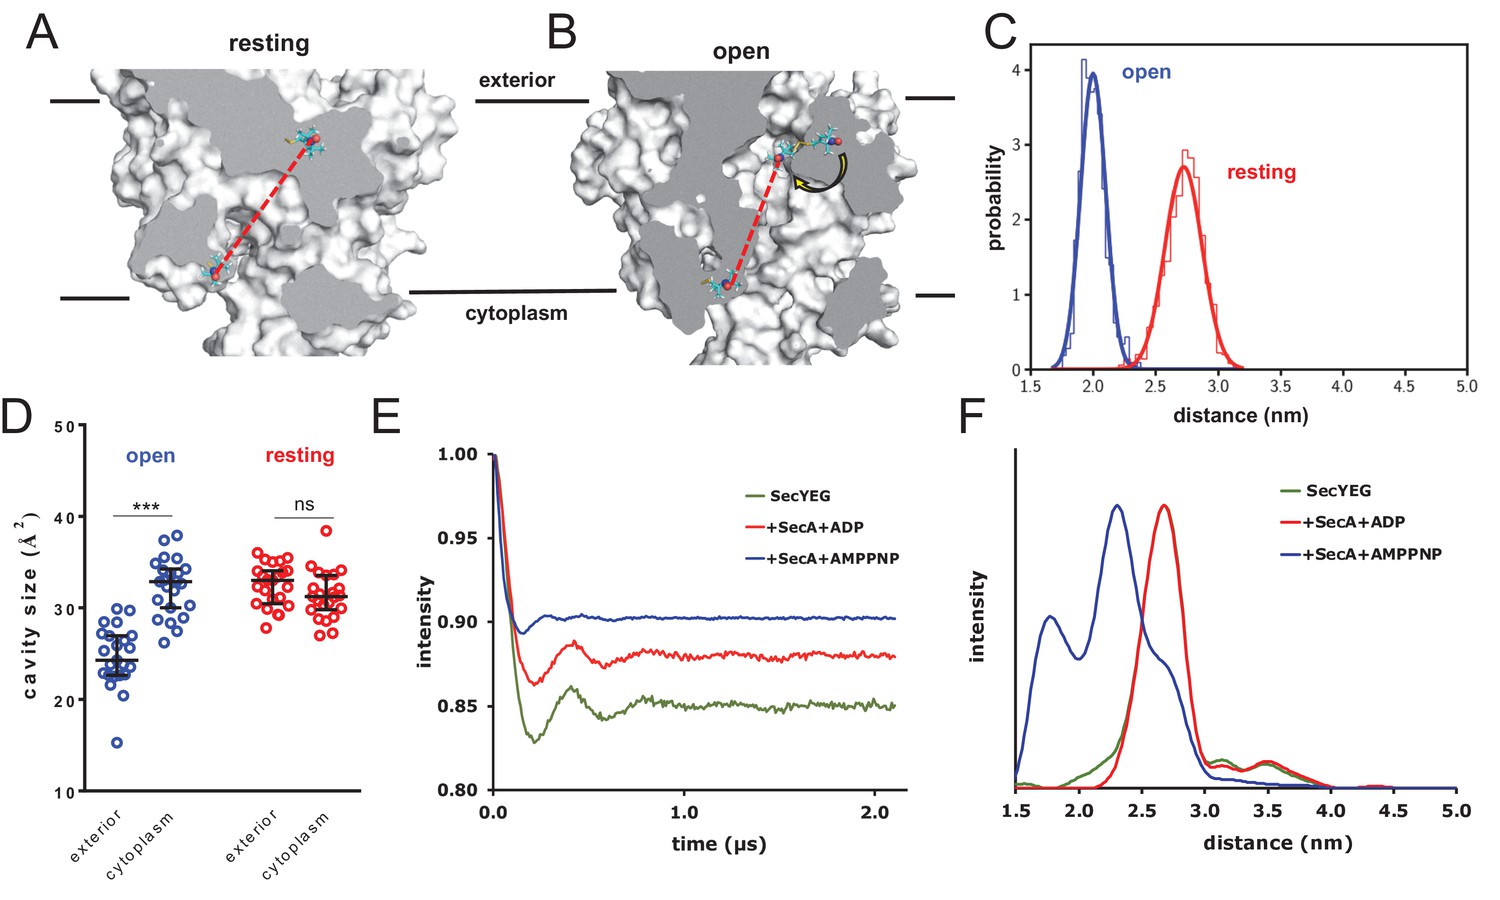
Combined EPR and MD supports nucleotide-driven cavity resizing.
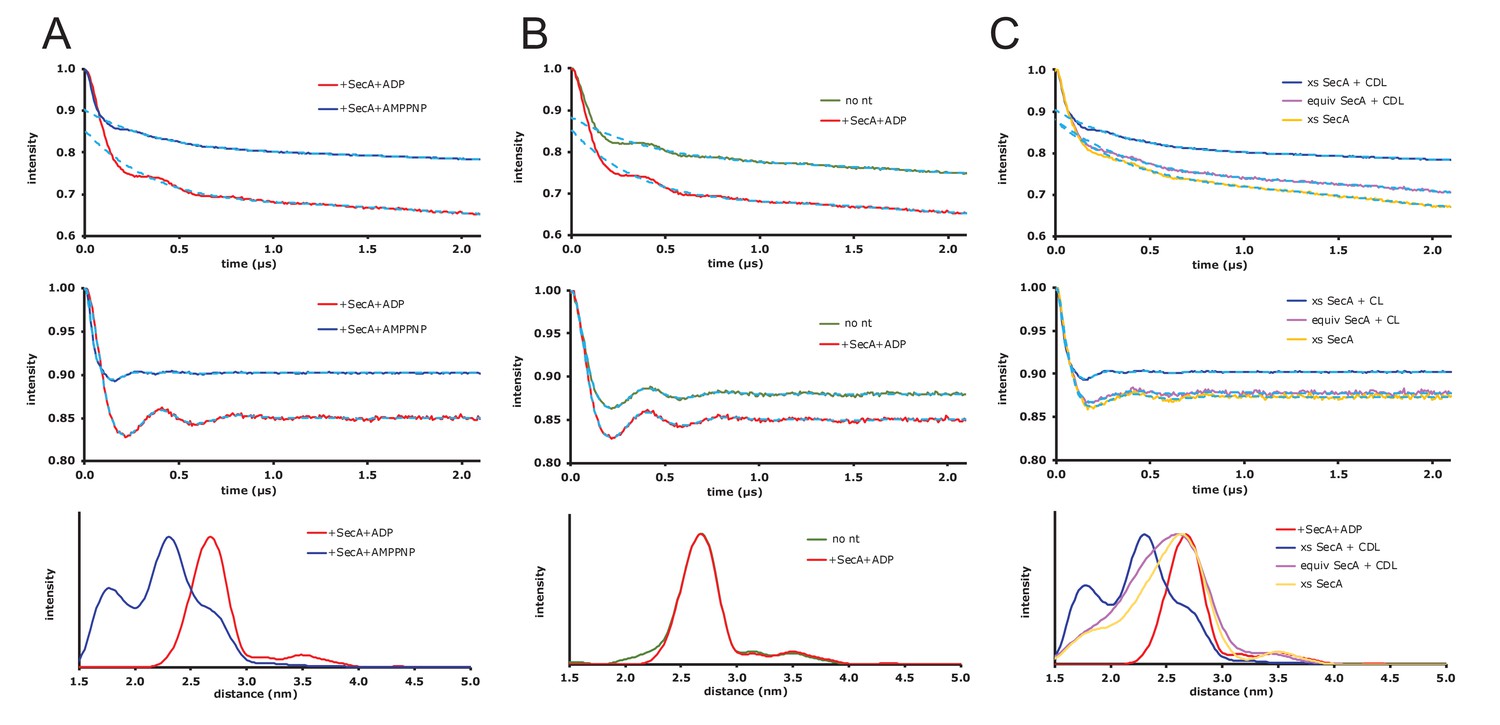
(A) Snapshot from the resting spin-labelled SecYEG simulation, showing the protein as grey surface and slabbed to show the interior of the channel. The spin label carbons are shown as cyan sticks, with the spectroscopically-relevant NO group in blue and red spheres. The disulphide bond to the SecY cysteine residues is shown in yellow. A predicted DEER distance is shown as a red line. (B) As panel A, but of the open channel. Upon channel widening, the MTS is able to flip into the channel (yellow arrow), resulting in a much shorter predicted DEER distance C) Histograms of intra-MTS distance data for the resting MD simulation (red) and the opened simulation (blue), overlaid with a normal distribution. The x-axis has been set as per panel F. (D) HOLE cavity analysis of the open and resting channel with MTS labels attached. The systems based on the open structure exhibit an asymmetry with respect to cavity size (blue data), whereas simulations based on the closed PDB exhibit no asymmetry (red). (E) Background corrected DEER time traces of spin-labelled SecYEG alone (green) and with excess SecA in the presence of either ADP (red) or AMPPNP (blue). The dipolar coupling between the nitroxide spin labels is evident in all three traces as modulations on the intensity of the detected spin-echo. This is almost the same for the spin-labelled SecYEG with SecA/ADP or without. (F) Distance distributions obtained from DeerAnalysis2016 (Jeschke et al., 2006) from the DEER time traces shown in E. The results for spin-labelled SecYEG with SecA and AMPPNP are, on average, at a shorter distance with a broader distribution than the overlapping distance distributions for spin-labelled SecYEG alone or with SecA/ADP. More information on the implementation of DeerAnalysis is given in the Supporting Information.
Figure 5—figure supplement 1

MD data in support of EPR DEER analysis.
(A) Views of parameterised spin-label (MTS; S-(1-oxyl-2,2,5,5-tetramethyl-2,5-dihydro-1H-pyrrol-3-yl)methyl methanethiosulfonate). The molecule is shown as lines and coloured according to atom type, with hydrogens shown as white points. Multiple simulation frames from 100 ns of simulation are overlaid and reveal the geometric stability of the molecule. (B) Snapshot from the resting spin-labelled SecYEG simulation, showing the protein as cartoon, coloured as per Figure 1C. The NO of the spin labels are shown as red and blue spheres, with the surface of the entire spin label shown in light shade. (C) RMSD over time as the systems from panel B are subjected to targeted MD. Here, the alpha carbons are compared to the alpha carbons of SecY from the opened SecA-SecYEG complex (Zimmer et al., 2008). Each dotted black line represents the addition of a stronger restraining force. After 800 ps, the RMSD is stable and very low, and the channel is now in an opened conformation. (D) As panel B, but of the opened channel. Upon channel widening, the MTS is able to flip into the channel, resulting in a much shorter predicted DEER distance.
Figure 5—figure supplement 2
Raw EPR DEER data.
(A) Expansion of the DEER results shown in Figure 5 of the main text where spin-labelled SecYEG does not have additional cardiolipin added. Top panel: DEER time traces for spin-labelled SecYEG with 5 × excess SecA and the non-hydrolysable ATP analogue AMPPNP (blue) or ADP (red). The fitted background functions are overlaid in dash cyan and correspond to a fifth order polynomial fit on the data (using DeerAnalysis2016 [Jeschke et al., 2006]) with a 129 ns zerotime and 800 ns cut from the end of the data. Middle panel: Background corrected DEER time traces with the distance distribution fits from Tikhonov Regularization shown by dash cyan. Bottom panel: Distance distributions from the DEER shown above calculated using the default best fit given by DeerAnalysis2016 with Tikhonov Regularization parameters 38 (blue) and 46 (red). The results are presented in the main text. (B) DEER results for spin-labelled SecYEG with SecA and SecA/ADP and additional cardiolipin. Top panel: DEER time traces for spin-labelled SecYEG with 5 × excess SecA alone (green) or with ADP (red). The fitted background functions are overlaid in dash cyan and correspond to a fifth order polynomial fit on the data with a 129 ns zerotime and 800 ns cut from the end of the data. Middle panel: Background corrected DEER time traces with the distance distribution fits from Tikhonov Regularization shown by dash cyan. Bottom panel: Distance distributions from the DEER shown above calculated in DeerAnalysis2016 with Tikhonov Regularization parameters 49 (green) and 46 (red). Taken with the data from A the results show that, for these spin labelling positions, there is no difference in conformation between SecYEG alone, with SecA or with SecA and ADP. (C) DEER results for spin-labelled SecYEG with excess or equivalent SecA, AMPPNP and with or without additional cardiolipin. Top panel: DEER time traces for spin-labelled SecYEG with 5 × excess SecA with additional cardiolipin (blue) and AMPPNP, equivalent SecA and additional cardiolipin (magenta) with AMPPNP and with 5 × excess SecA and no additional cardiolipin but also AMPPNP (mustard). The fitted background functions are overlaid in dash cyan and correspond to a fifth order polynomial fit on the data with a 129 ns zerotime and 800 ns cut from the end of the data. Middle panel: Background corrected DEER time traces with the distance distribution fits from Tikhonov Regularization shown by dash cyan. Bottom panel: Distance distributions from the DEER shown above calculated in DeerAnalysis2016 with Tikhonov Regularization parameters 38 (blue), 188 (magenta) and 140 (mustard). The distributions are compared to the data spin-labelled SecYEG with excess SecA, additional cardiolipin and ADP shown in A (red). These data show that cardiolipin is essential to the gating and that an equivalent ratio of SecA to SecYEG at the concentrations used is not enough to move the population of SecYEG to predominantly open.
Figure 6 with 1 supplement
HDX data demonstrates ATP-driven cavity changes.
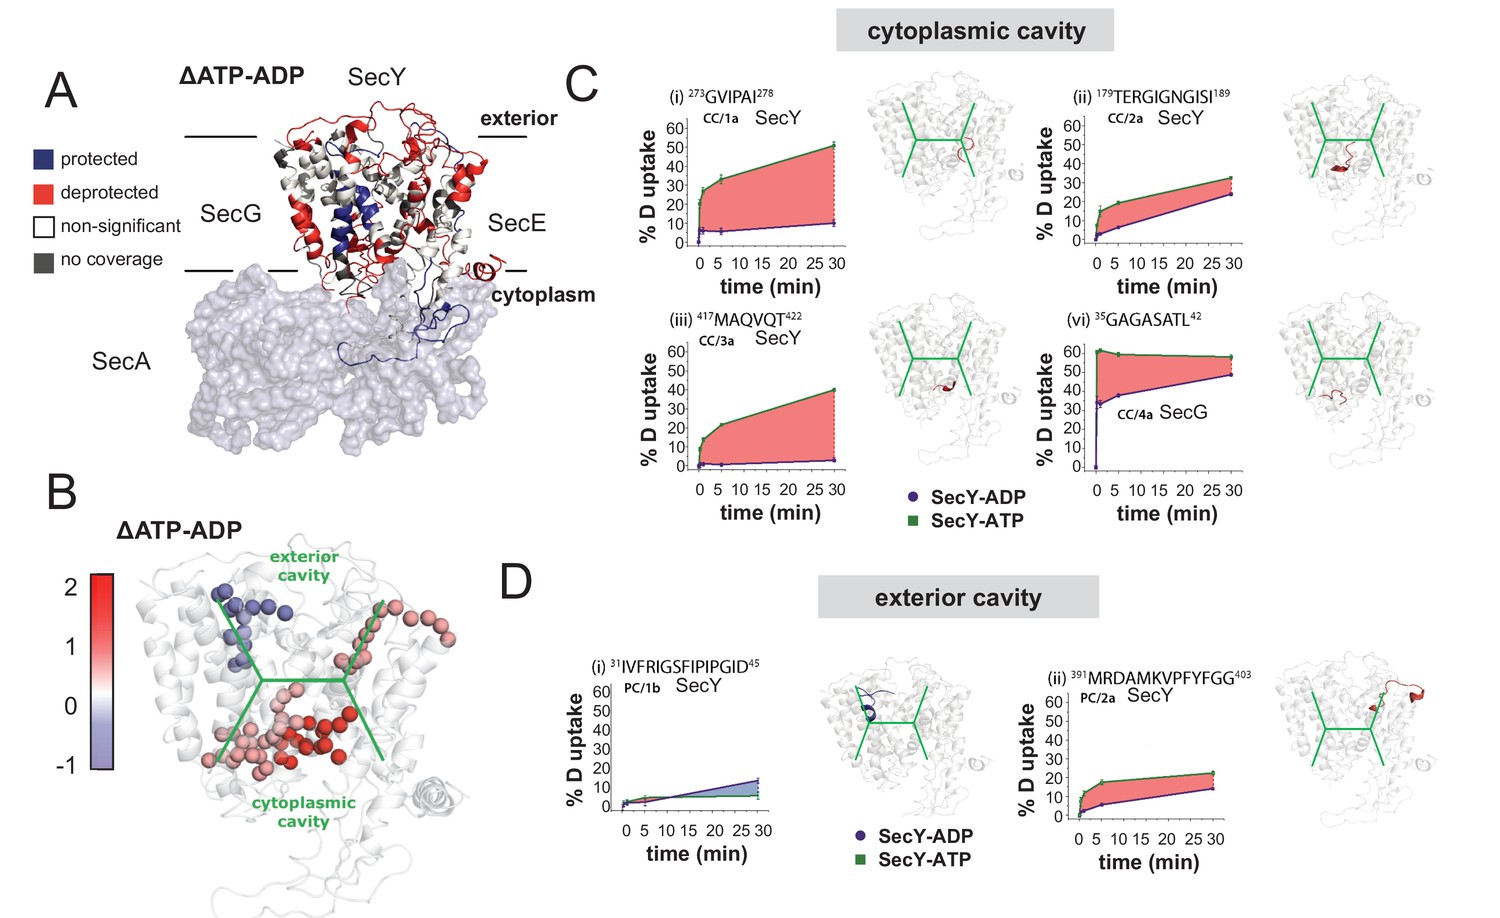
(A) Differences in relative deuterium uptake (ΔHDX) (ΔATP-ADP) of SecYEG after a 30 min exposure to deuterated solvent. A significant change in ΔHDX was determined as >0.9 Da (99% CI). Blue and red coloured regions indicate peptides that become HDX protected or deprotected, respectively. White regions represent peptides where no significant ΔHDX is observed. Regions with no coverage obtained are coloured grey. SecA data have been removed for clarity. HDX data are mapped onto a SecA-SecYEG complex structure (PDB: 3DIN). (B) View of SecYEG from PDB 3DIN (Zimmer et al., 2008). Shown in coloured spheres are backbone nitrogens which are located in the SecY cavities, and which exhibit a significant difference in deuterium exchange between the ATP and ADP states. The colour represents the difference in magnitude (blue = higher exchange in the ADP state, red = higher exchange in the ATP state). The approximate positions of the respective cavities are shown in green. (C–D) Deuterium uptake plots of peptides in the SecYEG cytoplasmic cavity (CC, residues 273–278, 179–189 and 417–422 in SecY, and 35–42 in SecG) and the periplasmic cavity (PC, residues 31–45 and 391–403 in SecY). E. coli residue numbering used throughout. On the right of each panel, the peptides are highlighted on the equivalent position of the SecYEG crystal structure from PDB 3DIN (Zimmer et al., 2008).
Figure 6—figure supplement 1
Full HDX data.
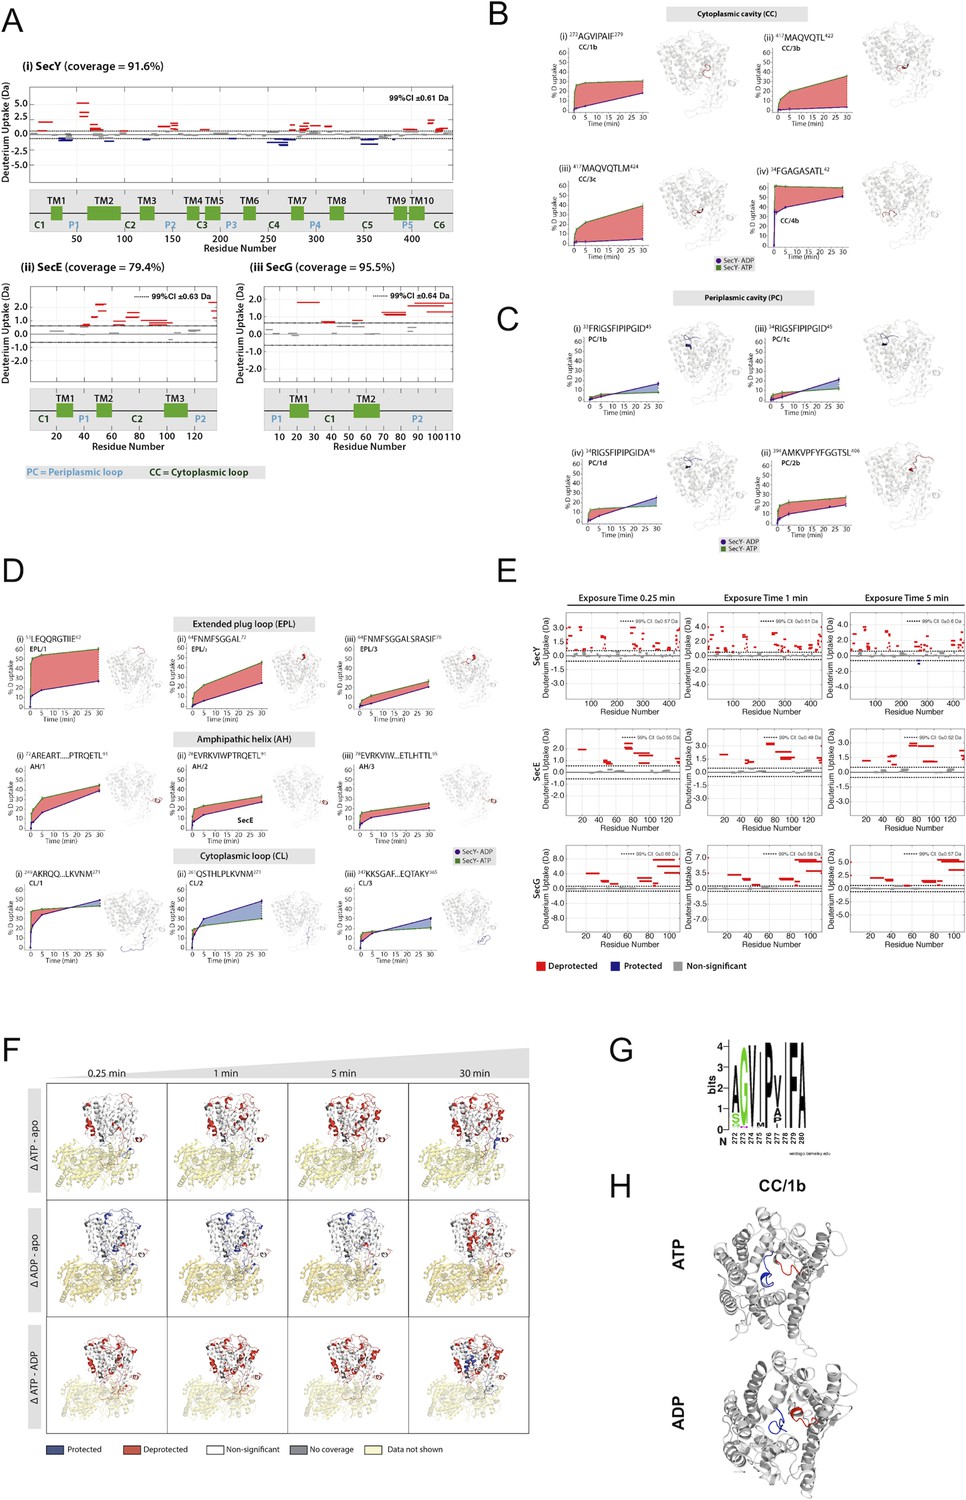
(A) Woods plots showing the differences in relative deuterium uptake (ΔHDX) (ΔATP-ADP) of (i) SecY, (ii) SecE and (iii) SecG after exposure to deuterated solvent for 30 min. The length of the blocks represents the length of the peptide. Blue and red blocks indicate protected or deprotected peptides, respectively. The transmembrane (TM), periplasmic loop ('P') and cytoplasmic loop ('C') regions are annotated. A significant change in ΔHDX was determined as 99% confidence intervals for each protein at any single time point and noted on the top right of the woods plot. (B) ΔHDX difference plots of SecY with ATP (green) and ADP (purple) at 30 min for peptides in the cytoplasmic cavity (CC). Red-shaded areas highlight deprotected regions (ΔATP-ADP). (C) As panel A, but for peptides in the periplasmic cavity (PC). (D) ΔHDX difference plots of SecY with ATP and ADP at 30 min for peptides in the extended plug loop (EPL), amphipathic helix (AH) and cytoplasmic loop (CL). (E) Woods plots of differences in ΔHDX of SecY, SecE and SecG (ΔATP-ADP) after exposure to deuterium oxide for 0.25 min, 1 min and 5 min. (F) Differences in ΔHDX of SecYEG in the presence of ATP (ΔATP-apo), ADP (ΔADP-apo) and (ΔATP-ADP). Blue and red coloured regions indicate protected and deprotected regions, respectively. White regions represent peptides where no significant ΔHDX is observed. Regions with no coverage obtained are coloured yellow. Differential HDX data is mapped onto a SecYEG-SecA complex structure (PDB: 3DIN [Zimmer et al., 2008]). (G) Weblogo of 64 different bacterial SecY sequences showing the highly conserved nature of the CC/1b peptide. (H) Views of SecY from the cytoplasm, following 1 μs of simulation in complex with SecE, SecA and pre-protein (small section shown in blue). The CC/1b region is highlighted in red.
Figure 7
Pre-protein secondary structure prevents transit through SecY.
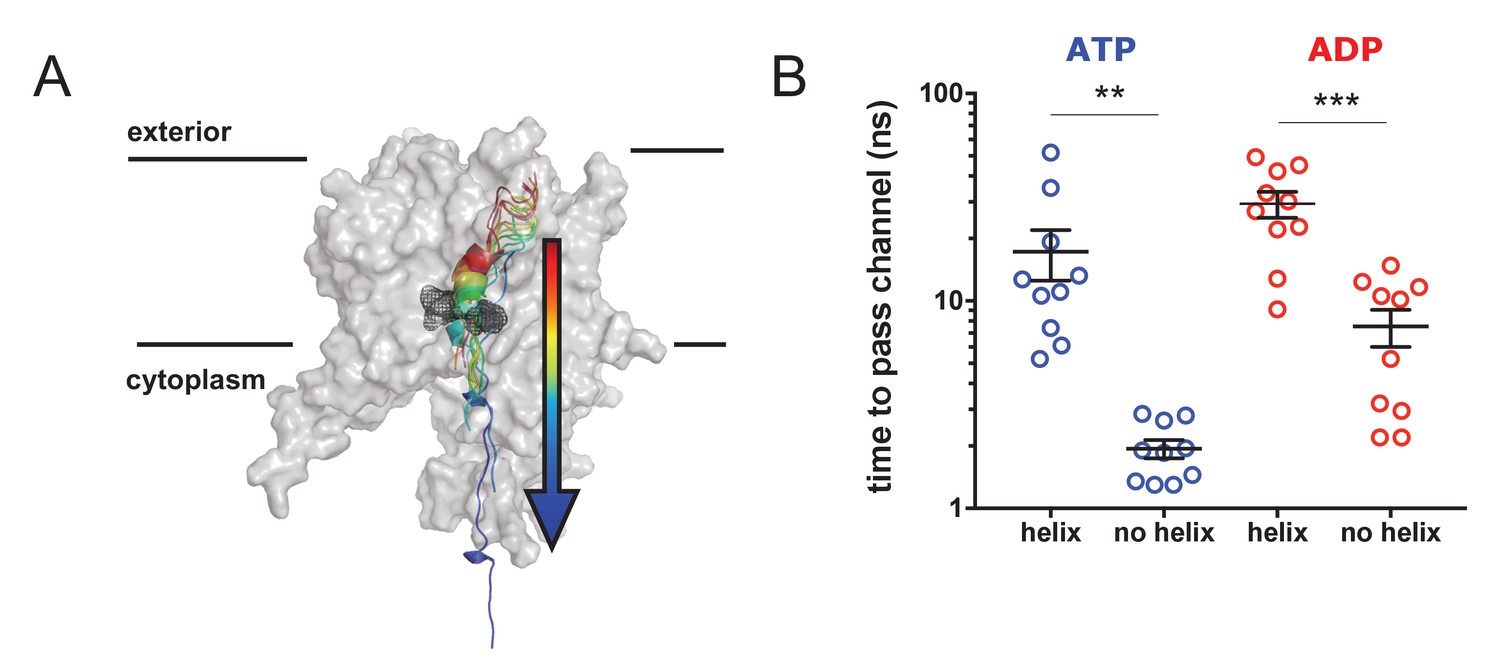
(A) Cartoon illustrating the principle behind the steered MD simulations. From a 1 µs snapshot of ADP- or ATP-bound SecA-SecYE-PP, SecYE and a short region of helix-containing pre-protein were extracted. Two configurations of the pre-protein were established: either the helix was stabilised by a distance restraint between the hydrogen bonded atoms, or the helix was broken by a short steered MD simulation pulling the ends apart. A backward pulling force was then applied to each pre-protein, and the time taken to pass the channel measured (B) Steered MD data. The presence of a helix in the pre-protein strongly restricts passage though the pore, p=0.0045 and p=0.0001 using two-tailed t-tests.
Figure 8
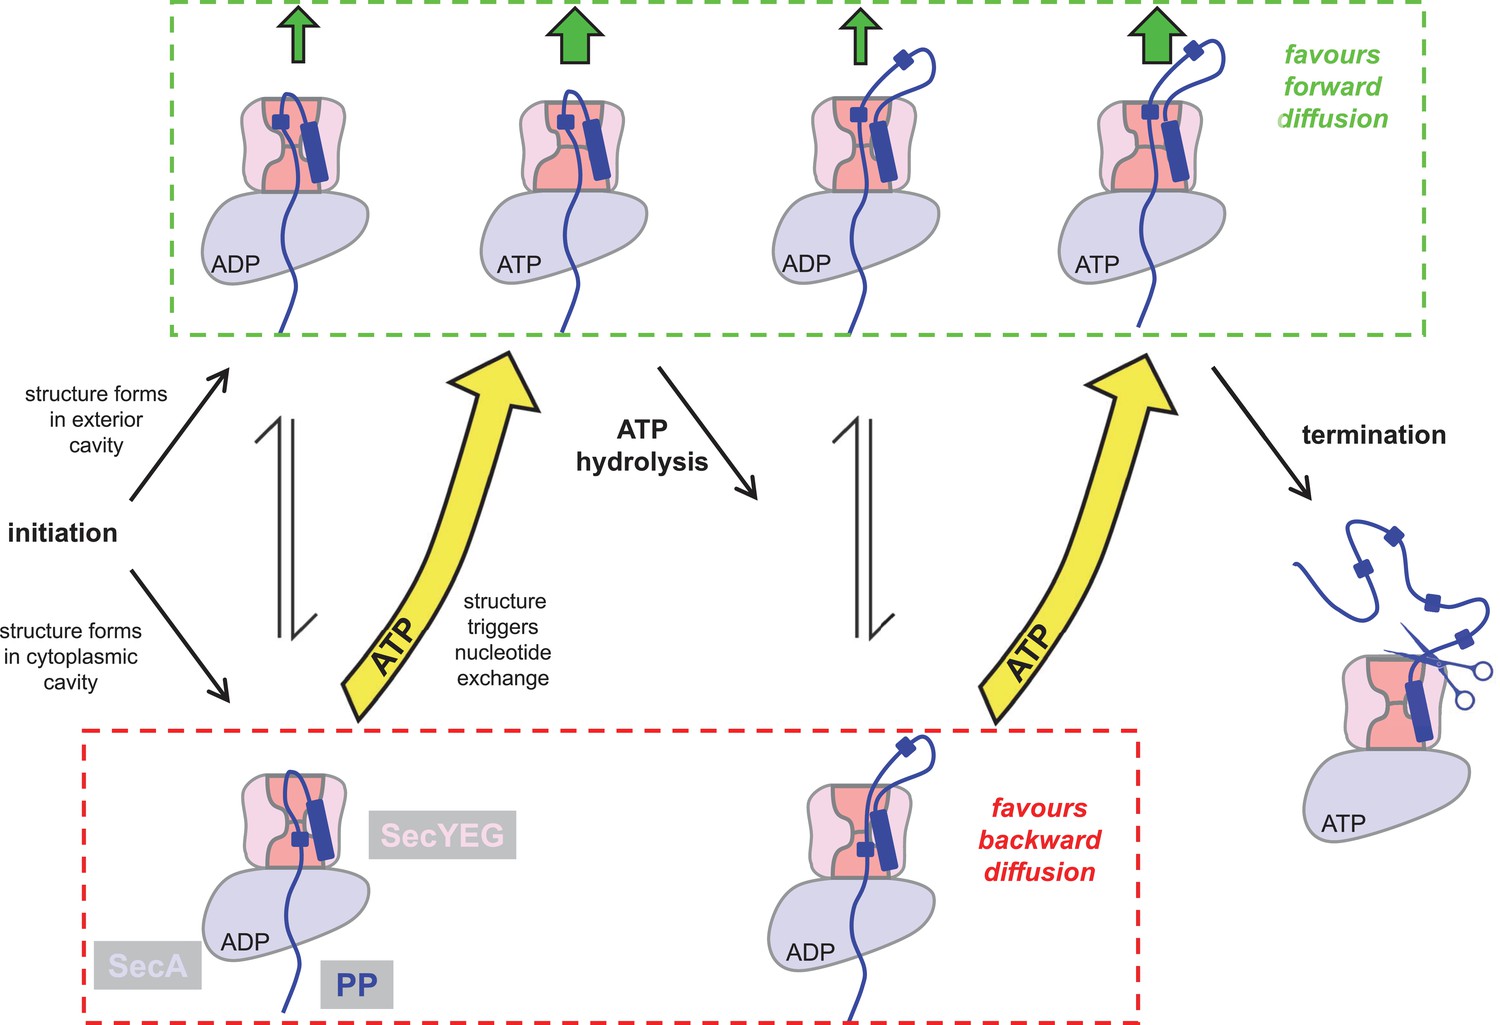
Extended model for pre-protein translocation through SecA-SecYEG.
In this model, SecA is shown in light blue, SecYEG in light pink, the SecY central cavity in dark pink and the pre-protein in dark blue, as per Figure 1. Following initiation (centre left), localised pre-protein secondary structure formation can occur in either the exterior or cytoplasmic cavity, with roughly equal chance between compartments in the ADP state. Structure in the exterior cavity favours forward – productive – diffusion (top left state), because the structured region cannot diffuse backwards. Structure in the cytoplasmic cavity would favour backward – unproductive – diffusion (bottom left state). We previously demonstrated that bulky pre-protein in the cytoplasmic cavity triggers nucleotide exchange (Allen et al., 2016). Here, we demonstrate that ATP induces a strong asymmetry across the channel: secondary structure is much more likely to form in the exterior cavity (upper middle state). Thus, in the ATP-bound state productive forwards diffusion is favoured over backwards. At this point, either translocation proceeds to completion, or ATP hydrolysis resets the complex for successive cycles of ATP hydrolysis and ADP exchange for ATP (right). In this way, ATP is acting to prevent the backward diffusion of pre-protein in the complex, by shifting the equilibrium away from the bottom (unproductive) states (yellow arrows).
Tables
Table 1
Details of remodelling performed on the crystal coordinates (Li et al., 2016).
In the left column is the residue number, as per the input model. In the second column is the residue sequence associated with that region of protein. Next is the name used here to describe this region. Names match the regions shown in Figure 1—figure supplement 1B. The last column briefly outlines how the region was modelled. See the text for more detail.
| Residues | Sequence | Name | Strategy |
|---|---|---|---|
| 246–249 | AEKD | SecA loop1 | Built using Modeller |
| 489–490 | RG | SecA loop2 | Built using Modeller |
| 620–624 | SENL | SecA loop3 | Built using Modeller |
| 643–683 | TPREELPEEWKLDGLVDLINTTYLDEGALEKSDIFGKEPDE | HWD 1 | Built from region in 3DIN |
| 700–705 | EEQFGK | HWD 2 | Built from region in 3DIN |
| 744–790 | Substrate | Removed from SecA, made into new chain and extended through SecA by 30 residues | |
| 738–748 | GGSGG | 2HF | Added new region for end of 2HF, based on 3DIN |
| 792–794 | QTN | SecA loop4 | Built using Modeller |
| 144–145 | GI | SecY loop1 | Built using Modeller |
| 207–213 | QTFGGLN | SecY loop2 | Modelled loop with Modeller based on Uniprot entry: QQFENVGEDLFLR |
| 245–258 | YAKRLEGRNPVGGH | C4 loop | Functionally important loop. Modelling based on 3DIN, including a short linker from Thermotoga maritima RITIQ to maintain 3D geometry. |
| 268–272 | PAGVI | SecY loop3 | Built using Modeller, and sequence shortened to fit space |
| 296–300 | DVTLWI | SecY loop4 | Built using Modeller |
Additional files
Download links
A two-part list of links to download the article, or parts of the article, in various formats.
Downloads (link to download the article as PDF)
Open citations (links to open the citations from this article in various online reference manager services)
Cite this article (links to download the citations from this article in formats compatible with various reference manager tools)
ATP-induced asymmetric pre-protein folding as a driver of protein translocation through the Sec machinery
eLife 8:e41803.
https://doi.org/10.7554/eLife.41803


