Two central pattern generators from the crab, Cancer borealis, respond robustly and differentially to extreme extracellular pH
- Brandeis University, United States
Figures
Figure 1
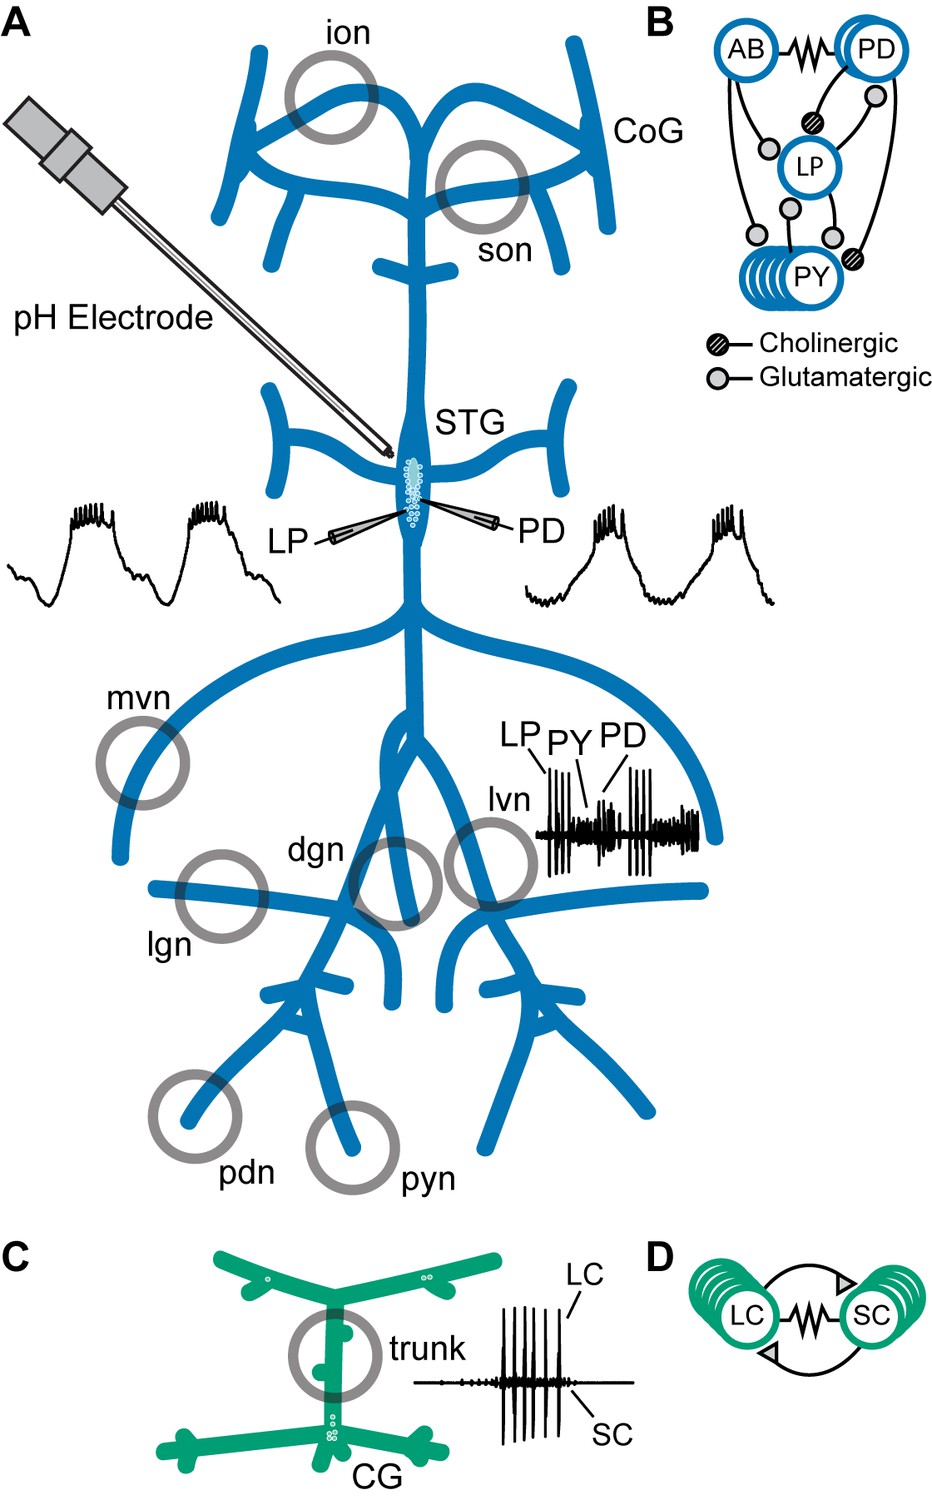
Preparations and circuit diagrams.
(A) Schematic of the stomatogastric nervous system preparation. Extracellular electrodes were placed in vaseline wells (gray circles) drawn around nerves of interest. An example extracellular nerve recording from the lateral ventricular nerve (lvn) shows two cycles of the triphasic pyloric rhythm containing spikes from the Lateral Pyloric (LP), Pyloric (PY), and Pyloric Dilator (PD) neurons. Example intracellular recordings from the LP and PD neurons are displayed. (B) Simplified diagram of the pyloric circuit. Filled circles represent inhibitory chemical synapses; resistor symbol represents electrical coupling. (C) Schematic of the cardiac ganglion preparation. Extracellular electrodes were placed in a well (gray circle) around the trunk of the preparation. An example extracellular recording shows one burst of the Small Cell (SC) and Large Cell (LC) neurons. (D) Diagram of the cardiac circuit. Filled triangles represent excitatory chemical synapses; the resistor symbol represents electrical coupling.
Figure 2
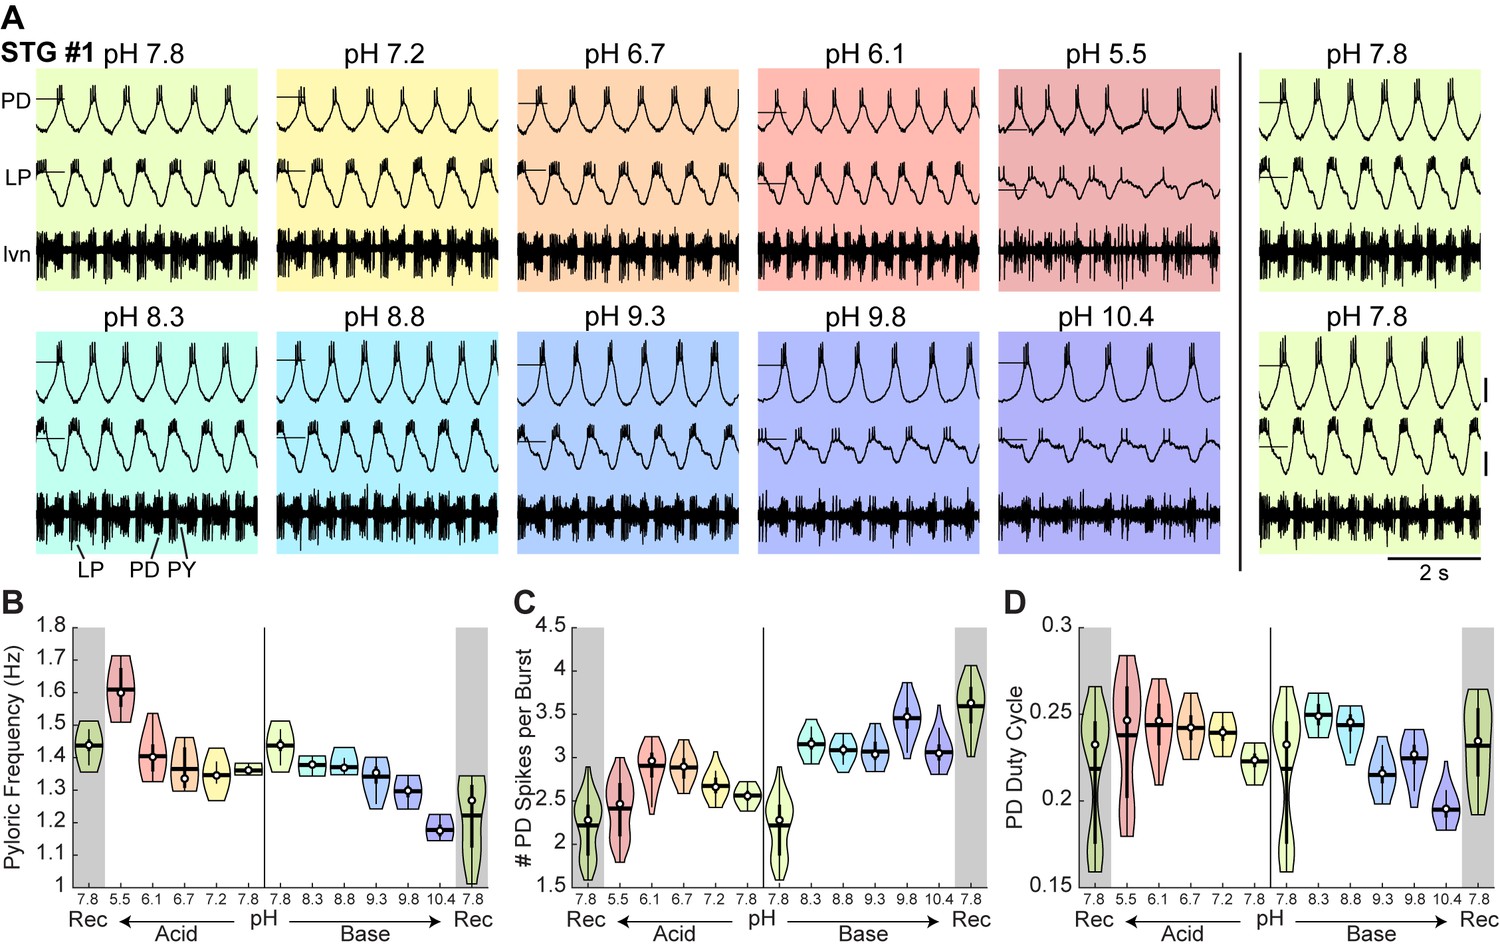
Robust pyloric rhythm activity across pH.
(A) Example recordings from a stomatogastric ganglion experiment with an acid-first protocol. Intracellular recordings of the PD and LP neurons and extracellular recordings of the lvn are shown. Each colored box displays 5 s of recordings taken from the last minute at each pH step. The experiment can be read left to right then top to bottom in chronological order. Horizontal lines indicate a reference membrane potential of −40 mV; vertical lines indicate a scale of 10 mV. (B) Pyloric frequency, (C) number of PD spikes per burst, and (D) PD duty cycle were calculated for the last 8 min of each pH step. Violin plots show the KDE distribution, mean, median, IQR, and 95% CI for each measure across pH conditions. Recoveries from acid and base are displayed in the shaded gray regions on the far ends of each plot.
-
Figure 2—source data 1
Numerical data represented in panel B, C, and D of Figure 2.
- https://doi.org/10.7554/eLife.41877.004
Figure 3 with 2 supplements
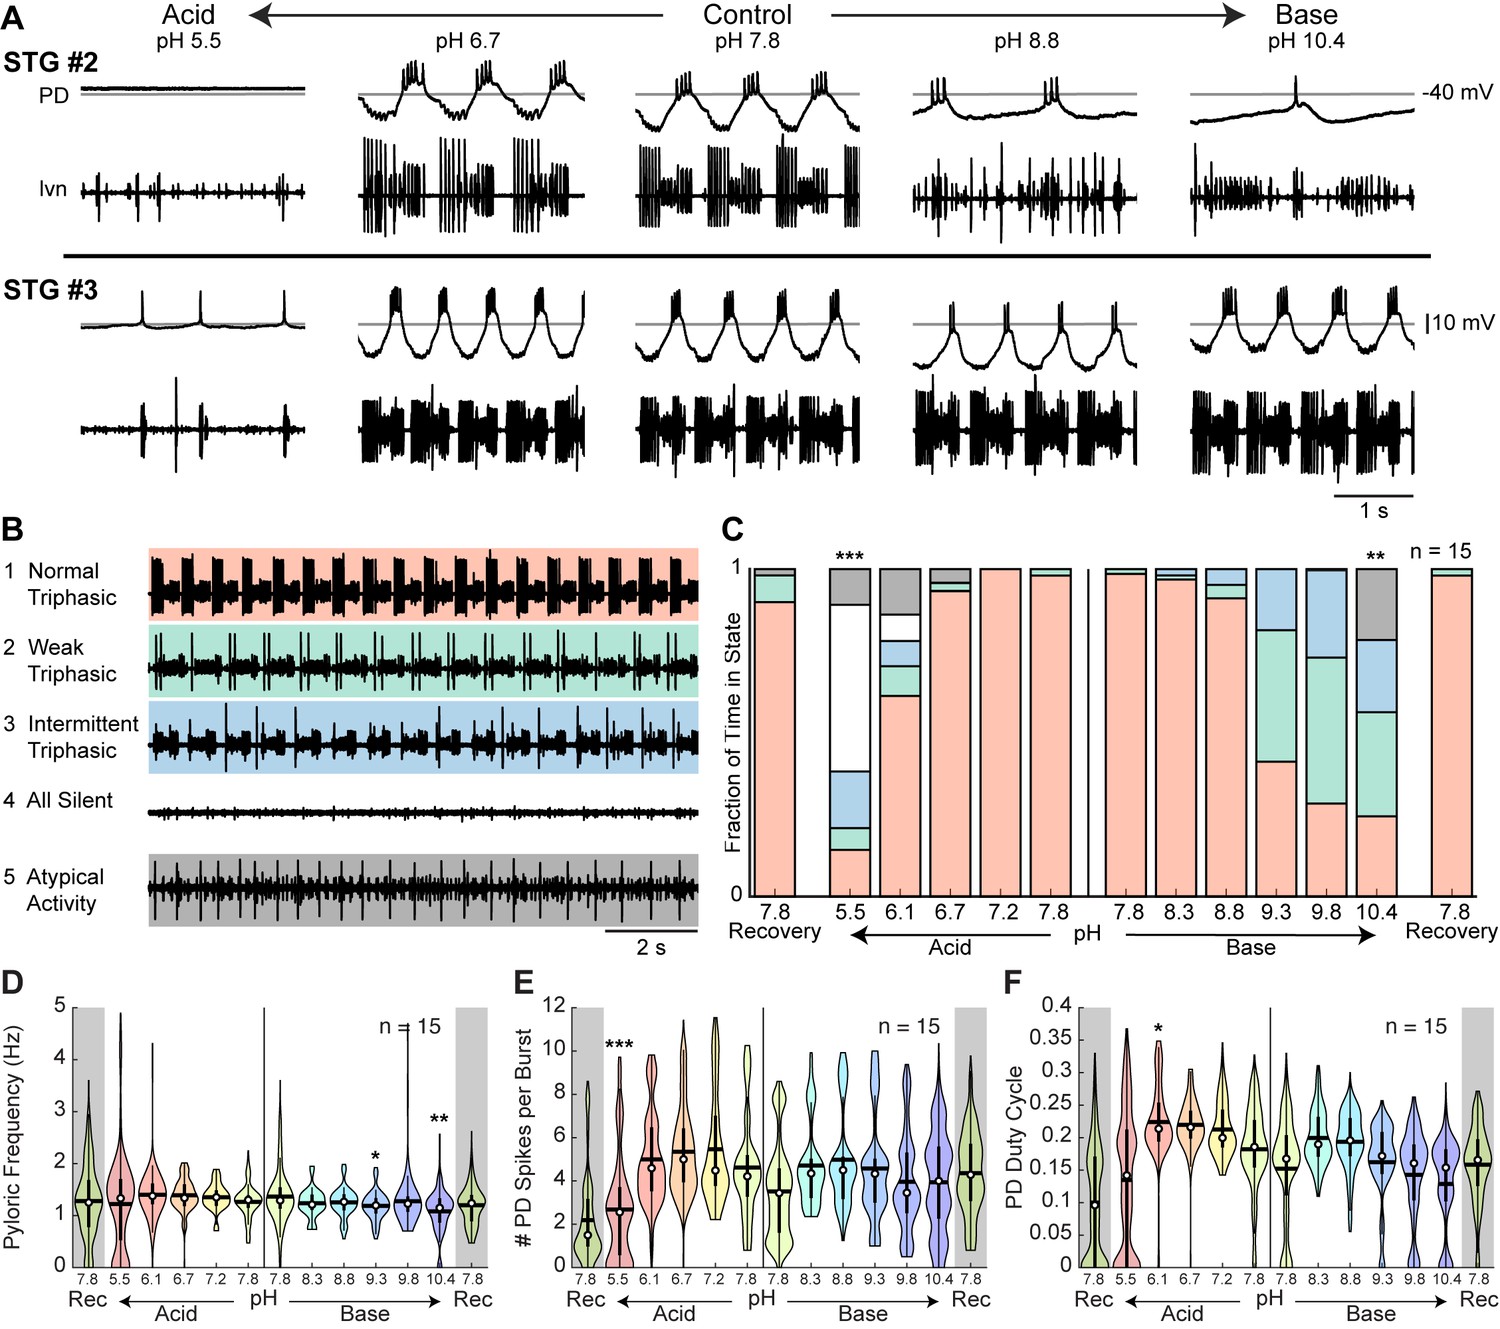
Variability of pyloric rhythm activity at extreme pH.
(A) Two additional stomatogastric ganglion experiments displaying 3 s of intracellular PD and extracellular lvn recordings. Horizontal lines indicate a reference membrane potential of −40 mV; vertical line indicates a scale of 10 mV. (B) Five states were defined to characterize pyloric rhythm activity. Examples of activity for each state are given. (C) Stacked bars give the mean fraction of time that all 15 preparations spent in each state. (D) Pyloric rhythm frequency, (E) number of PD spikes per burst, and (F) PD duty cycle were calculated and pooled across all STG preparations for each pH step. Violin plots show the KDE distribution, mean, median, IQR, and 95% CI for each measure across pH conditions. Recoveries from acid and base are displayed in the shaded gray regions on the far ends of each plot. Asterisks denote statistical significance revealed by paired samples t-tests with Bonferroni correction (*p<0.05; **p<0.01; ***p<0.001).
-
Figure 3—source data 1
Numerical data represented in panel C, D, E, and F of Figure 3 and and panel A, B, and C of Figure 3—figure supplement 2.
- https://doi.org/10.7554/eLife.41877.008
Figure 3—figure supplement 1
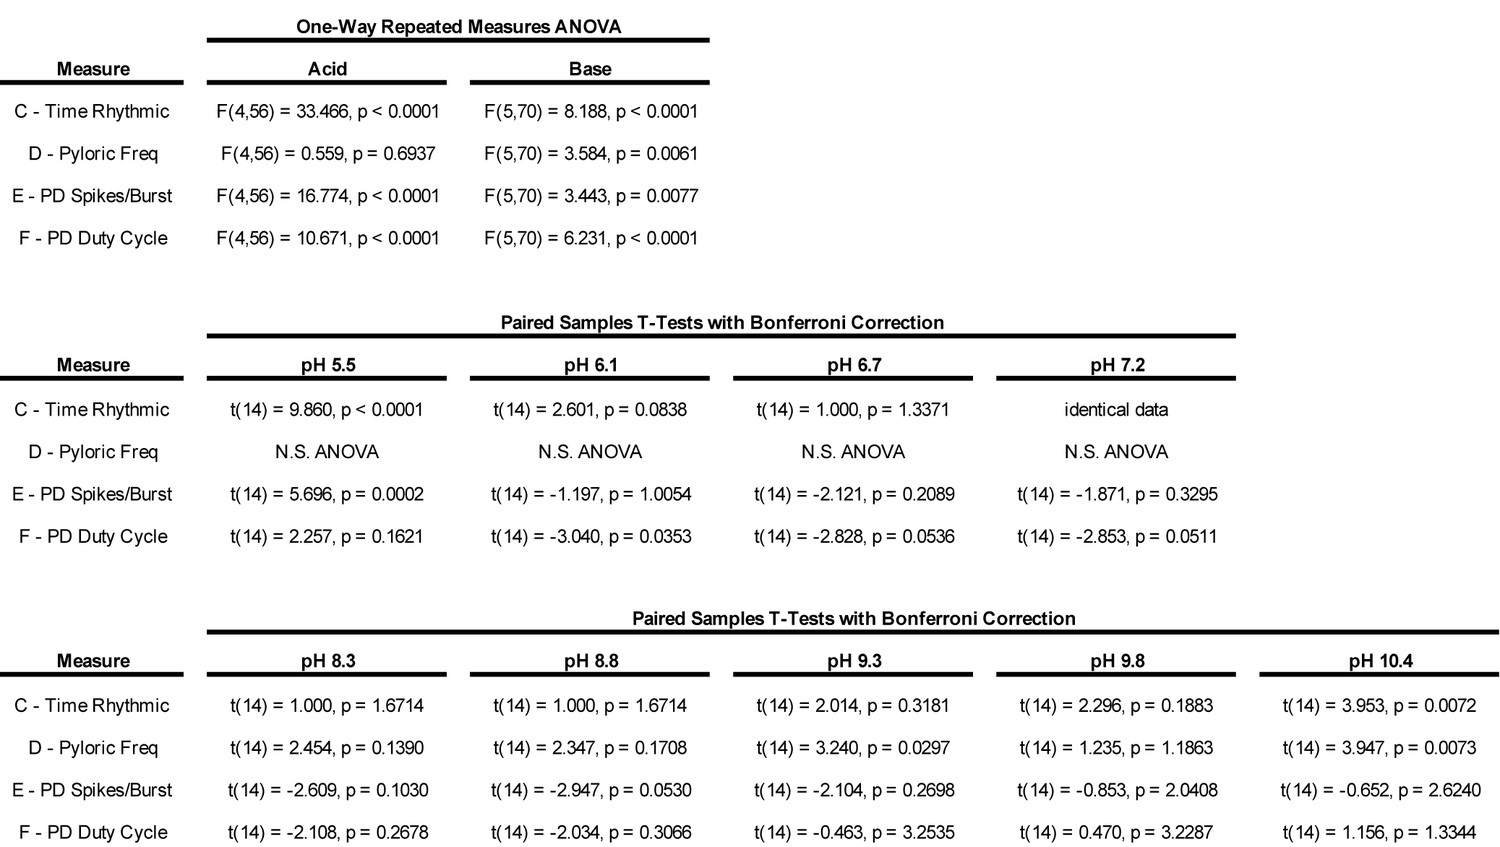
Statistical analysis of the effects of pH on the pyloric rhythm.
The main effects of acid and base protocols on four measures of the activity of the pyloric rhythm were assessed. Univariate Type III Repeated-Measures Analysis of Variance (ANOVA) tests were performed separately for both acid and base step protocols. Post-hoc paired samples t-tests with Bonferroni correction were performed for each pH step against its respective control, the pH 7.8 condition immediately prior to the step protocol. T-statistics are not reported for non-significant ANOVAs.
Figure 3—figure supplement 2
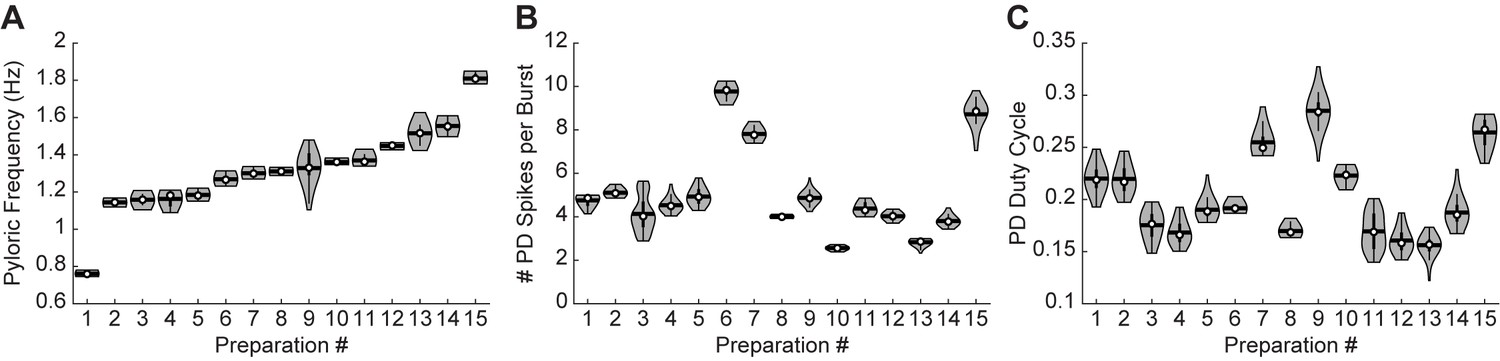
Variability of pyloric rhythm activity at control pH.
(A) Pyloric rhythm frequency, (B) number of PD spikes per burst, and (C) PD duty cycle were calculated for each CG preparation for the last 8 min in control pH 7.8. Violin plots show the KDE distribution, mean, median, IQR, and 95% CI for each measure across preparations. Preparations are consistent across plots and sorted in order of increasing frequency.
Figure 4 with 1 supplement
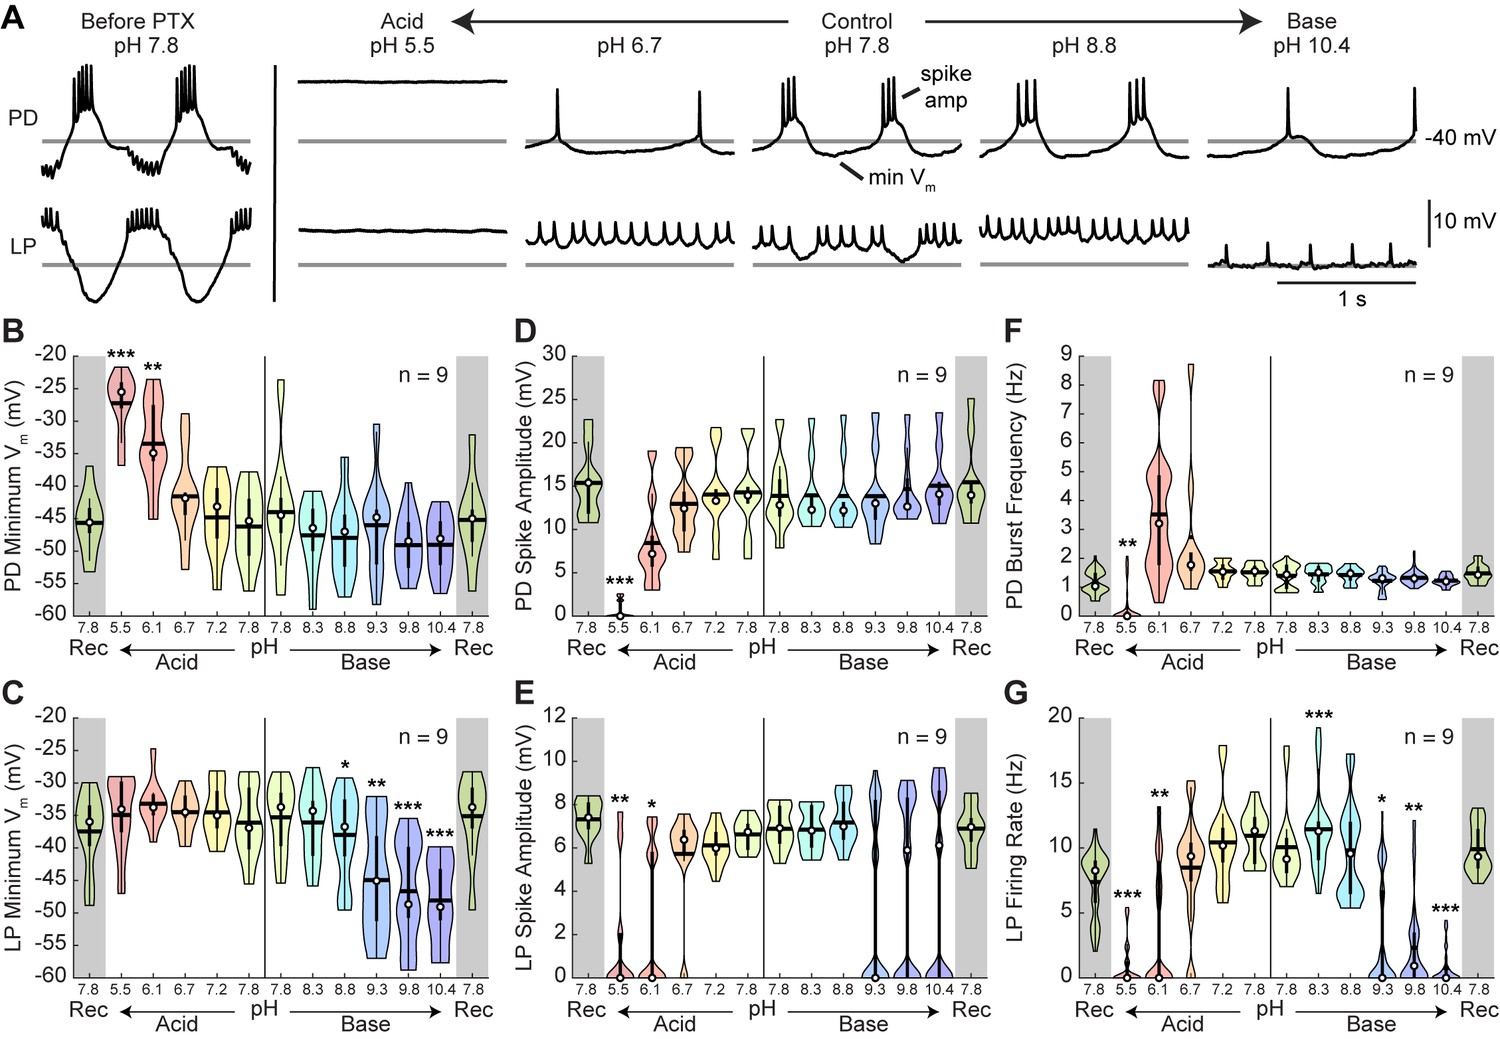
Intracellular characteristics of semi-isolated pyloric neurons, PD and LP.
Several characteristics of the PD and LP neurons in the presence of picrotoxin (PTX) were measured for the last minute of each pH condition. (A) Example intracellular recordings of PD and LP neurons prior to PTX application and in the presence of PTX across pH conditions. Horizontal lines indicate a reference membrane potential of −40 mV; the vertical line indicates a scale of 10 mV. (B,C) Minimum membrane potential and (D,E) spike amplitude are plotted for LP and PD as a function of pH. (F) PD burst frequency and (G) LP firing rate are also plotted at each pH. Violin plots show the KDE distribution, mean, median, IQR, and 95% CI for each measure across pH conditions. Recoveries from acid and base are displayed in the shaded gray regions on the far ends of each plot. Asterisks denote statistical significance revealed by paired samples t-tests with Bonferroni correction (*p<0.05; **p<0.01; ***p<0.001).
-
Figure 4—source data 1
Numerical data represented in panel B, C, D, E, F, and G of Figure 4.
- https://doi.org/10.7554/eLife.41877.011
Figure 4—figure supplement 1
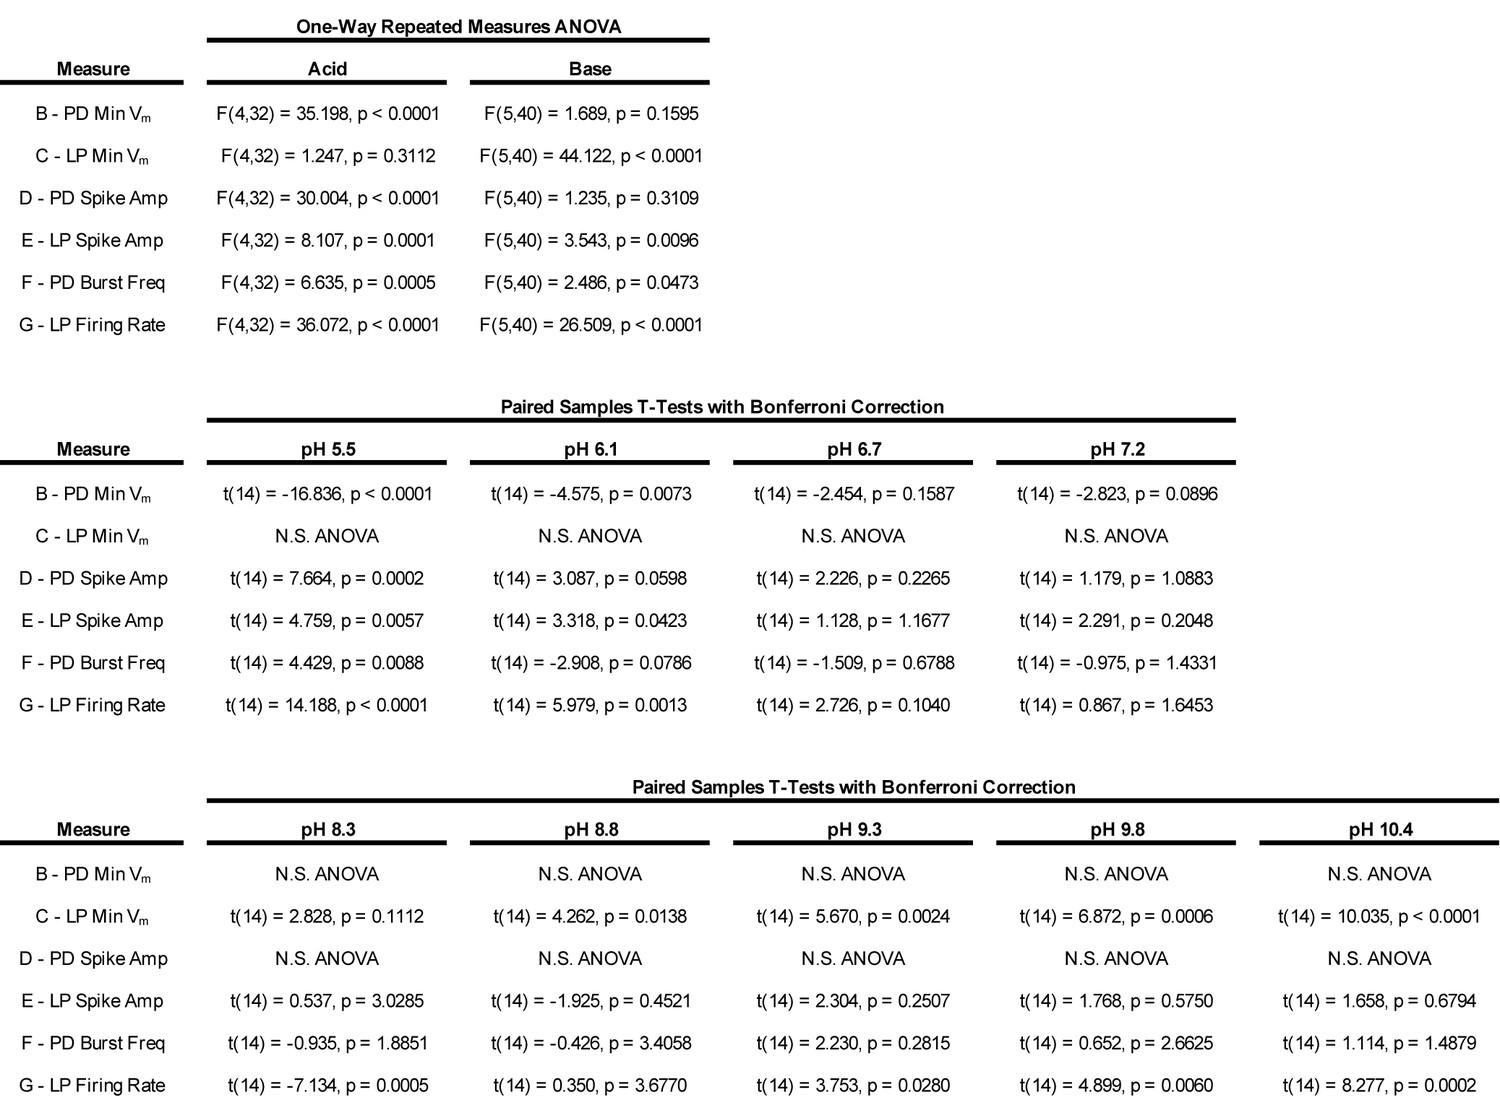
Statistical analysis of the effects of pH on semi-isolated PD and LP neurons.
The main effects of acid and base protocols on six measures of the activity of semi-isolated LP and PD neurons were assessed. Univariate Type III Repeated-Measures Analysis of Variance (ANOVA) tests were performed separately for both acid and base step protocols. Post-hoc paired samples t-tests with Bonferroni correction were performed for each pH step against its respective control, the pH 7.8 condition immediately prior to the step protocol. T-statistics are not reported for non-significant ANOVAs.
Figure 5
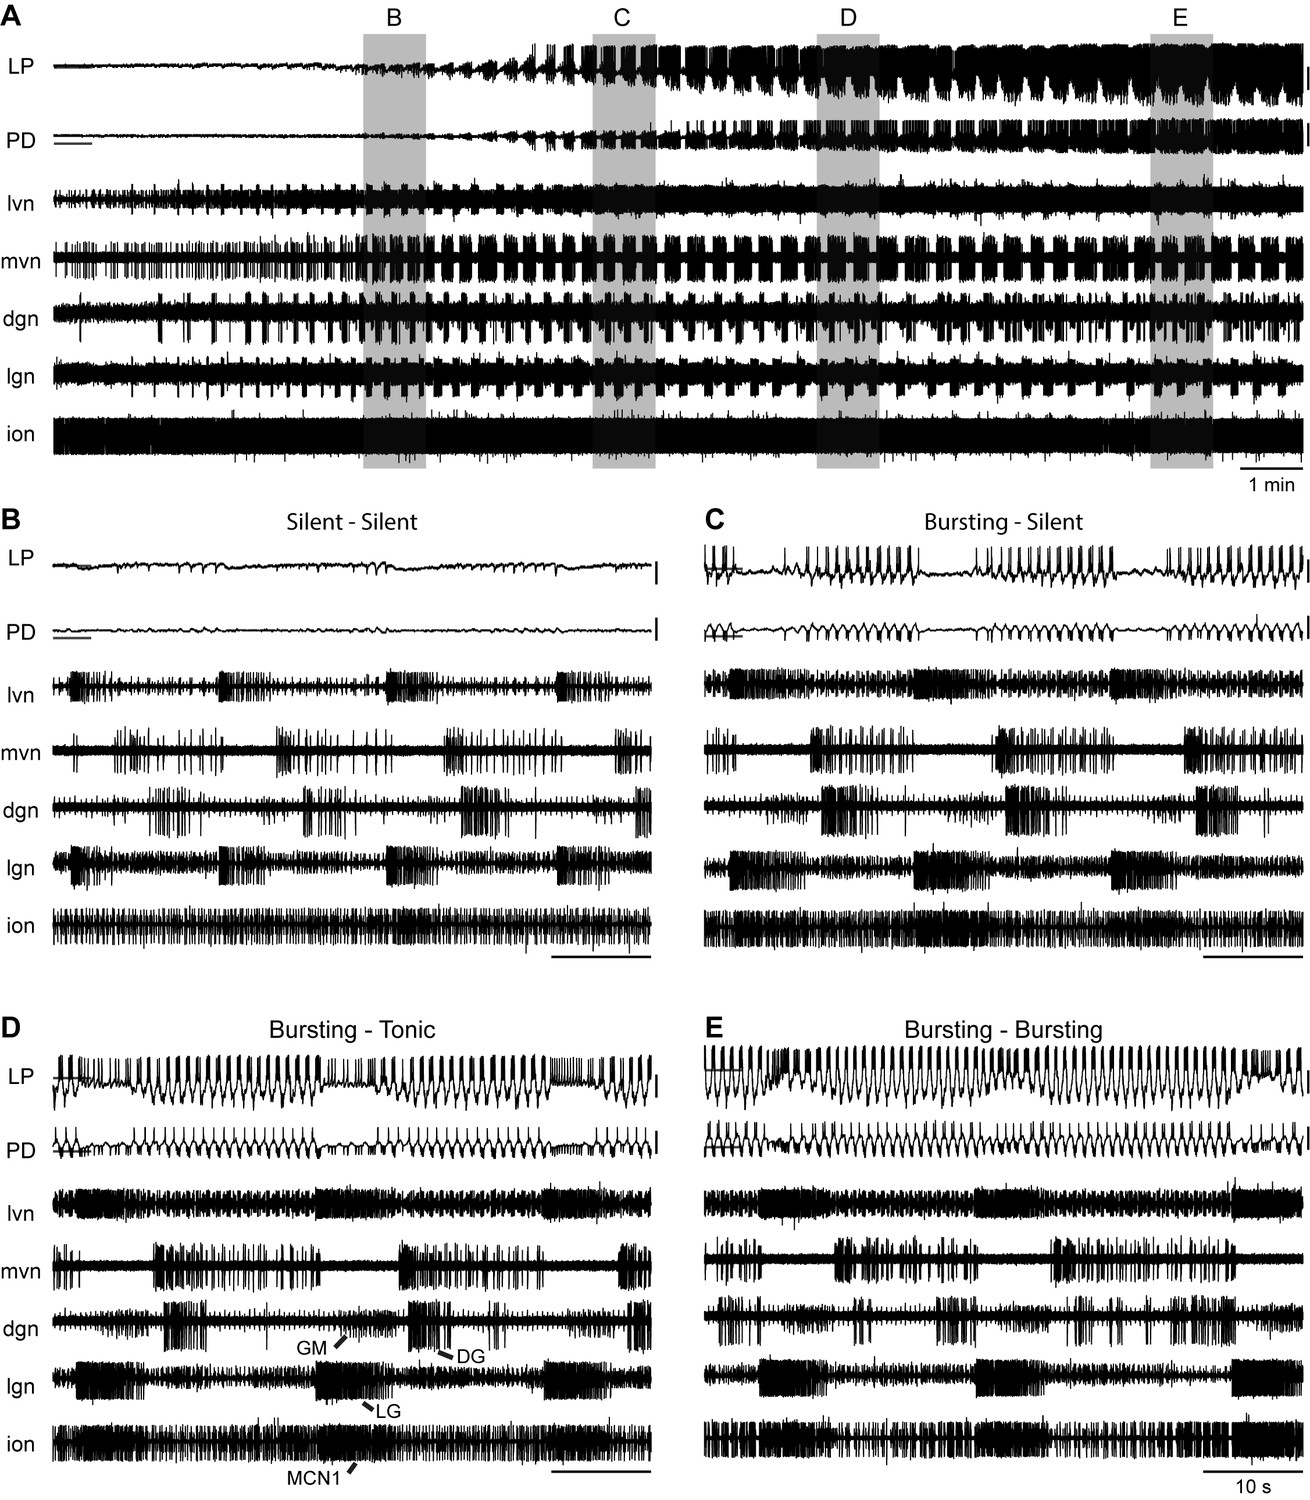
Rhythmic gastric-like activity upon recovery from extreme acid.
(A) 20 min of recording are shown from an example experiment where the ganglion had become silent at pH 5.5 and began recovering rhythmic activity in control pH 7.8 saline. Intracellular recordings from LP and PD neurons and extracellular recordings from five nerves – lvn, mvn, dgn, lgn, and ion – are displayed. Horizontal lines indicate a reference membrane potential of −40 mV; vertical lines indicate a scale of 10 mV. Gray boxes correspond to the one-minute snapshots enlarged in subsequent panels respective to time. (B–E) Titles describe the pyloric neuron activity during and between LG bursts.
Figure 6
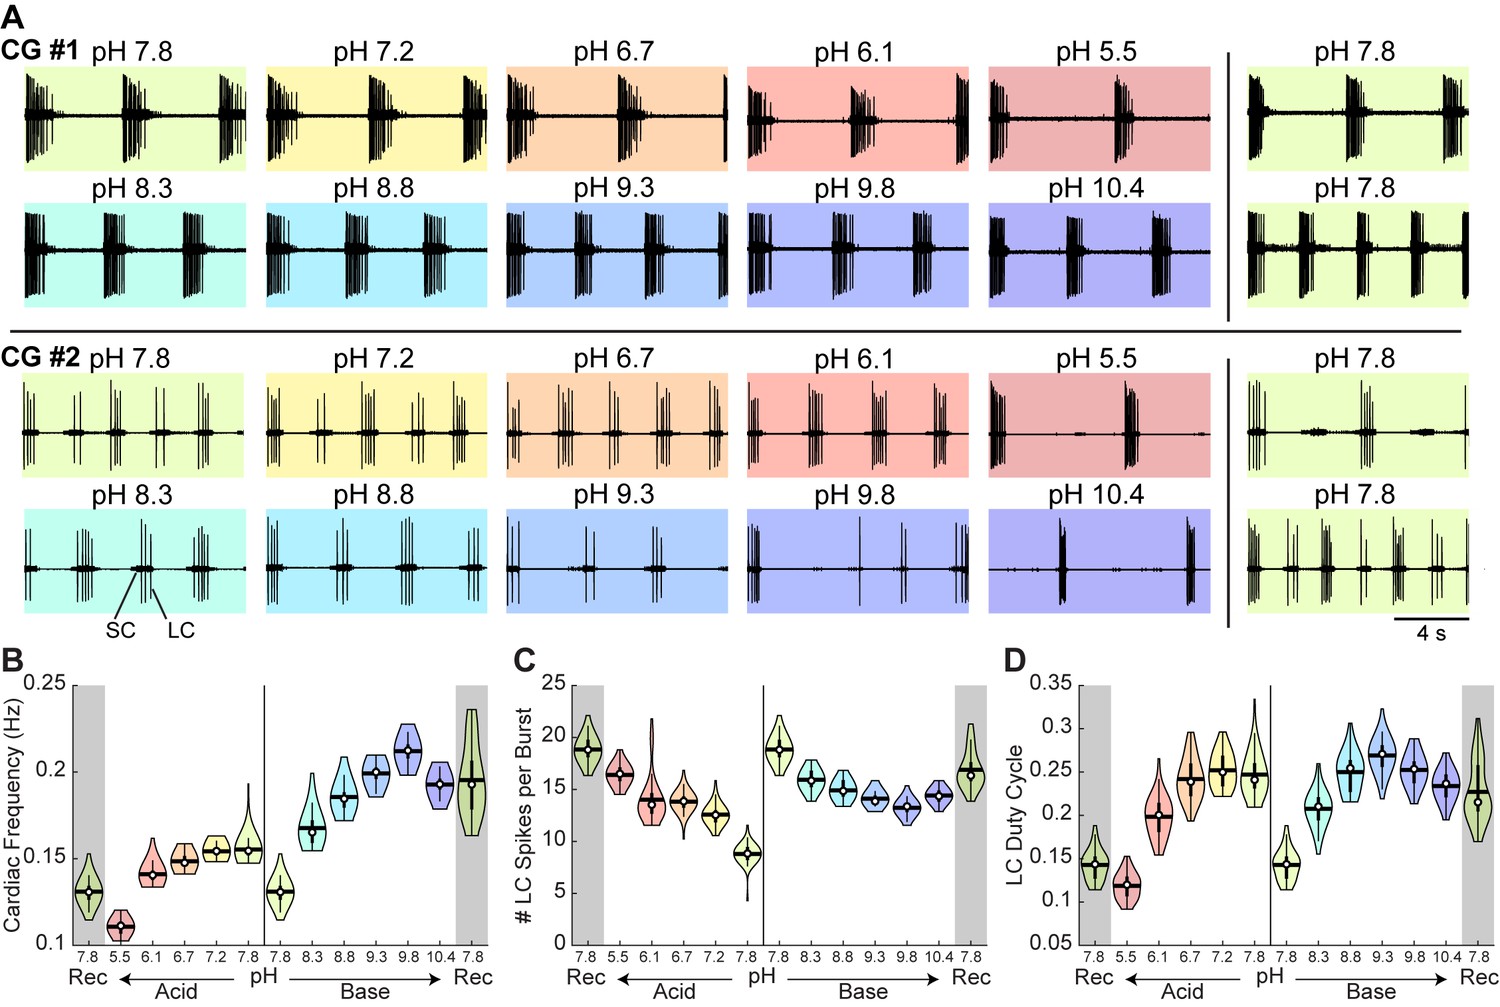
Robust and variable cardiac rhythm activity across pH.
(A) Two example cardiac ganglion experiments with an acid-first protocol. Each colored box displays 12 s of extracellular recordings of the trunk taken from the last minute of each pH condition. Small Cell (SC) and Large Cell (LC) activity is visible. Each experiment can be read left to right then top to bottom in chronological order. (B) Cardiac frequency, (C) number of LC spikes per burst, and (D) LC duty cycle were calculated for CG #1 for each pH step. Violin plots show the KDE distribution, mean, median, IQR, and 95% CI for each measure across pH conditions. Recoveries from acid and base are displayed in the shaded gray regions on the far ends of each plot.
-
Figure 6—source data 1
Numerical data represented in panel B, C, and D of Figure 6.
- https://doi.org/10.7554/eLife.41877.014
Figure 7 with 2 supplements
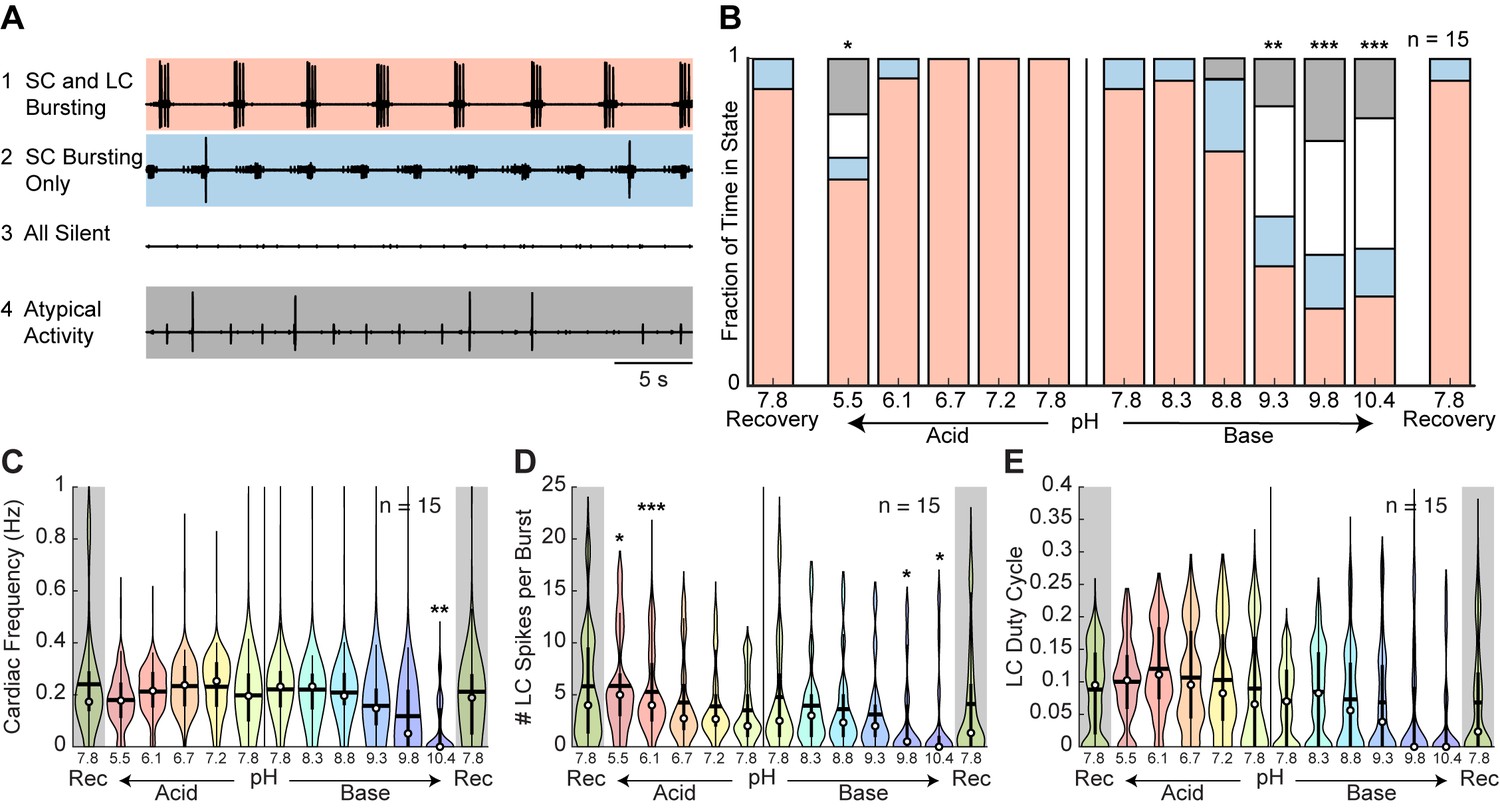
Characteristics of cardiac rhythm activity across pH.
(A) Four states were defined to characterize cardiac rhythm activity. Examples of activity for each state are given. (B) Stacked bars give the mean fraction of time that all 15 preparations spent in each state for each pH step. (C) Cardiac rhythm frequency, (D) number of LC spikes per burst, and (E) LC duty cycle were calculated and pooled across all CG preparations for each pH step. Violin plots show the KDE distribution, mean, median, IQR, and 95% CI for each measure across pH conditions. Recoveries from acid and base are displayed in the shaded gray regions on the far ends of each plot. Asterisks denote statistical significance revealed by paired samples t-tests with Bonferroni correction (*p<0.05; **p<0.01; ***p<0.001).
-
Figure 7—source data 1
Numerical data represented in panel B, C, D, and E of Figure 7 and panel A, B, and C of Figure 7—figure supplement 2.
- https://doi.org/10.7554/eLife.41877.018
Figure 7—figure supplement 1
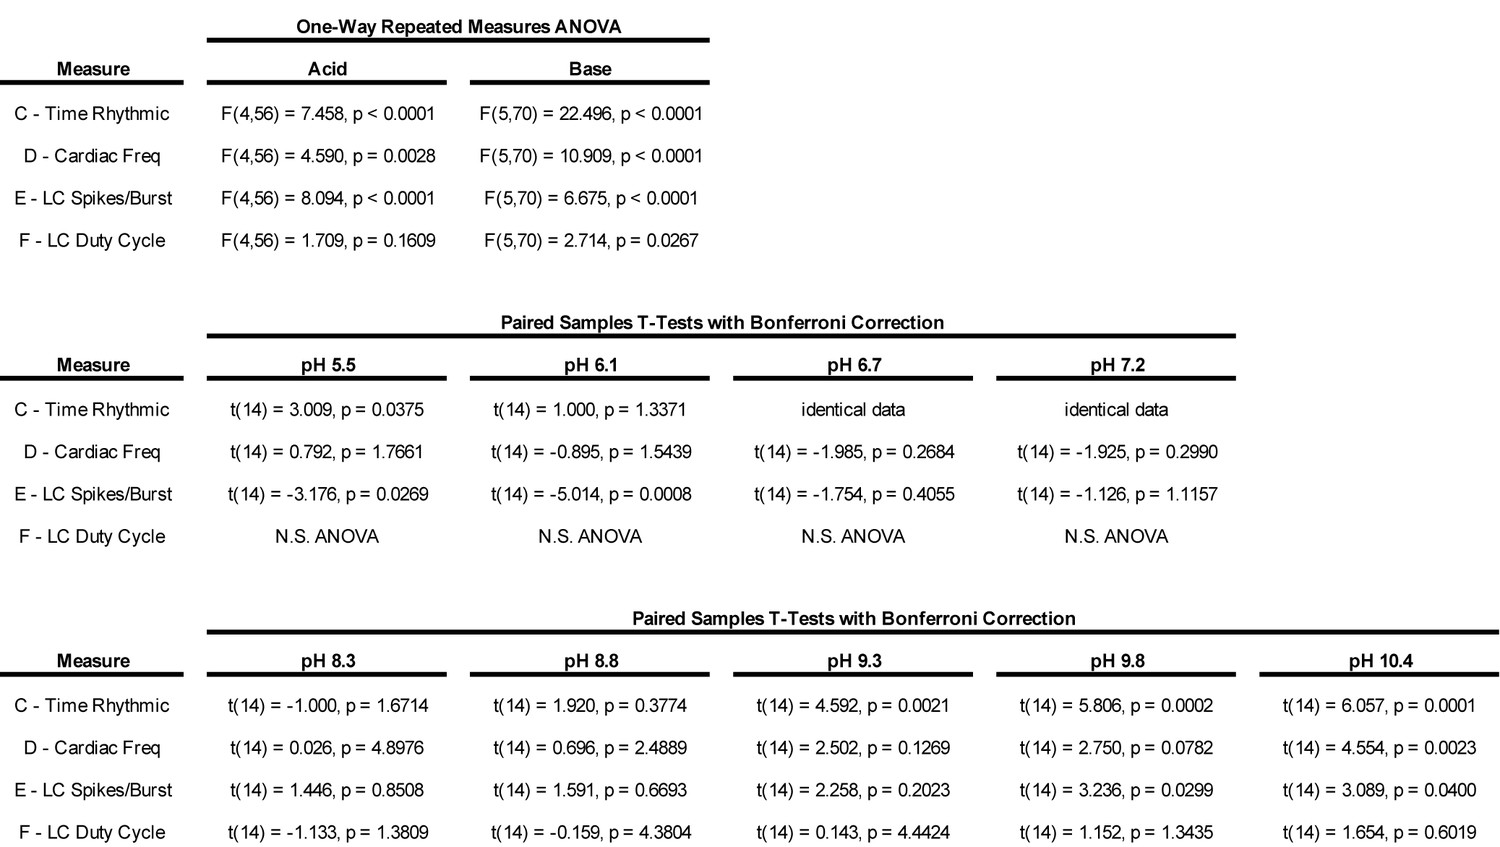
Statistical analysis of the effects of pH on the cardiac rhythm.
The main effects of acid and base protocols on four measures of the activity of the cardiac rhythm were assessed. Univariate Type III Repeated-Measures Analysis of Variance (ANOVA) tests were performed separately for both acid and base step protocols. Post-hoc paired samples t-tests with Bonferroni correction were performed for each pH step against its respective control, the pH 7.8 condition immediately prior to the step protocol. T-statistics are not reported for non-significant ANOVAs and identical data sets.
Figure 7—figure supplement 2
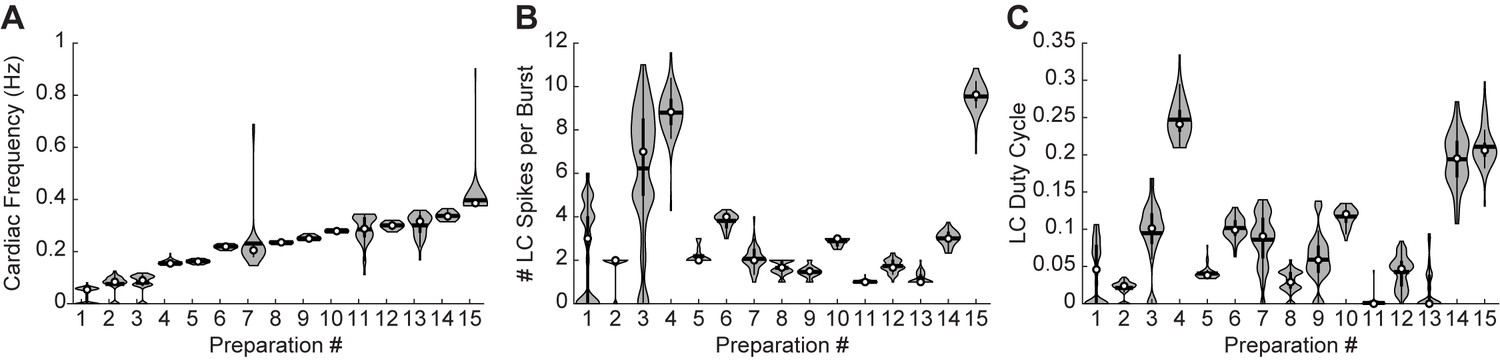
Variability of cardiac rhythm activity at control pH.
(A) Cardiac rhythm frequency, (B) number of LC spikes per burst, and (C) LC duty cycle were calculated for each CG preparation for the last 8 min in control pH 7.8. Violin plots show the KDE distribution, mean, median, IQR, and 95% CI for each measure across preparations. Preparations are consistent across plots and sorted in order of increasing frequency.
Figure 8 with 1 supplement
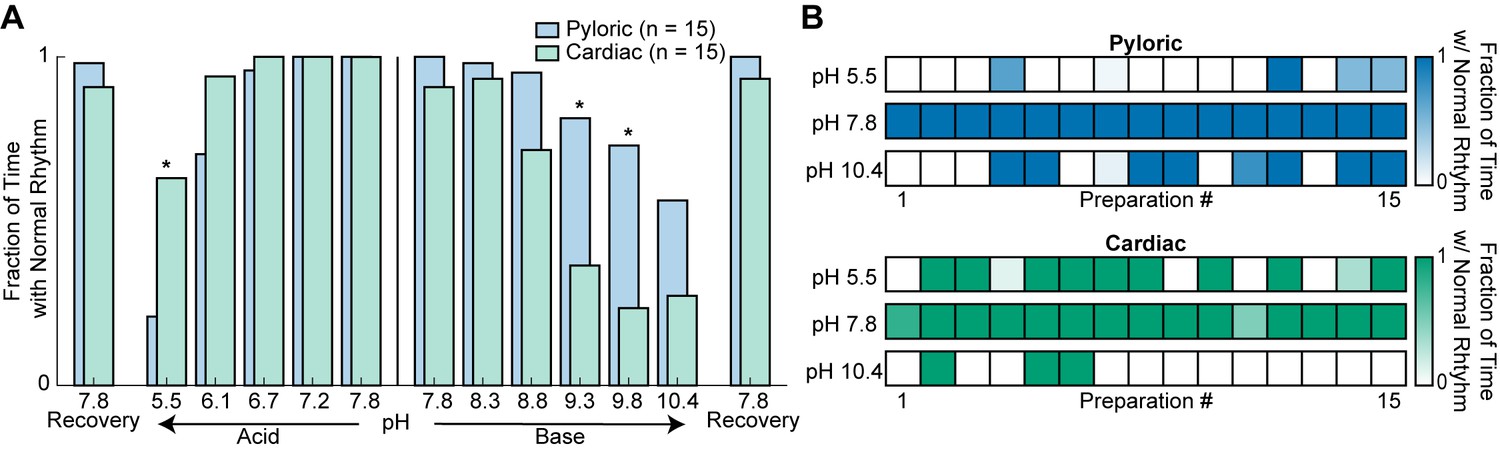
Rhythmicity of the cardiac and pyloric rhythms compared across pH.
(A) Mean fraction of time that both the pyloric (blue) and cardiac (green) rhythms displayed normal activity is plotted as a function of pH. Differences between the activity of the two rhythms were analyzed by independent samples t-tests at each pH. Recovery from acid and base are displayed on the far ends of the plot. Asterisks denote statistical significance with Bonferroni correction (*p<0.05; **p<0.01; ***p<0.001). (B) Rhythmicity of individual animal preparations is plotted for extreme acid (pH 5.5), control (pH 7.8) and extreme base (pH 10.4) saline conditions. Each column of boxes represents a single preparation, with position across conditions remaining constant. The saturation of each box represents the mean fraction of time with a normal rhythm as indicated by the color bars on the right.
-
Figure 8—source data 1
Numerical data represented in panel A and B of Figure 8.
- https://doi.org/10.7554/eLife.41877.021
Figure 8—figure supplement 1
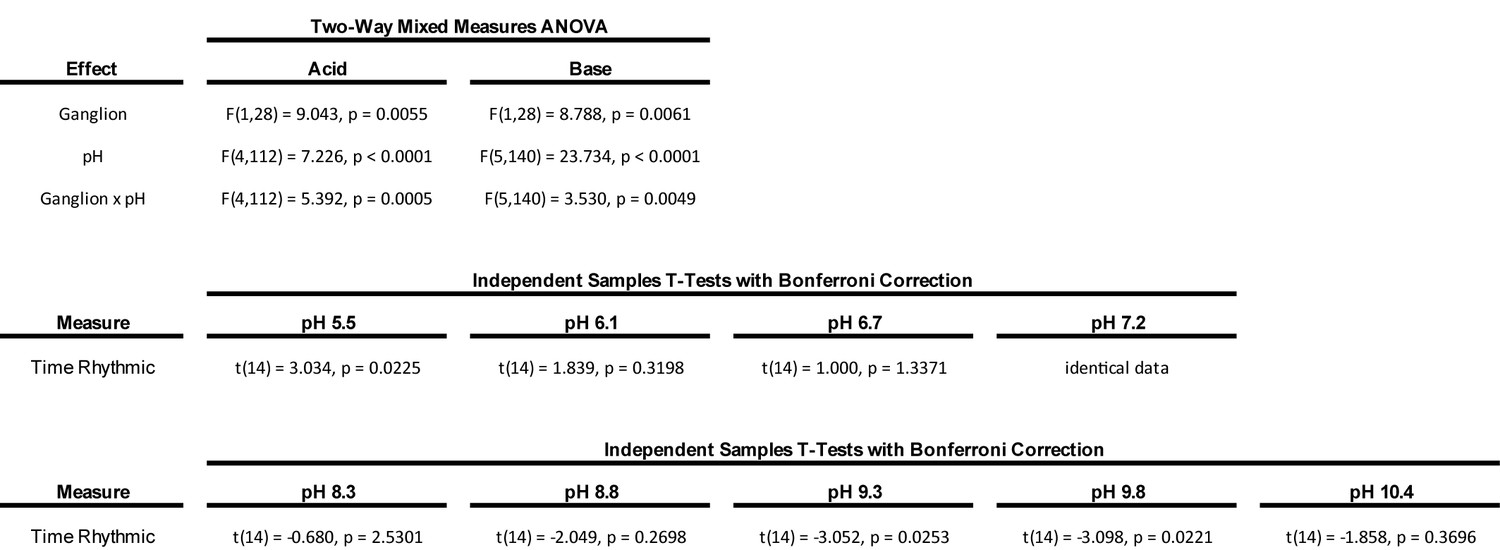
Statistical analysis of the differential effects of pH on the pyloric and cardiac rhythms.
The main effects of ganglion and pH and their interaction during both acid and base protocols on the fraction of time rhythmic of both the pyloric and cardiac rhythms were assessed. Multivariate Type III Mixed-Measures Analysis of Variance (ANOVA) tests were performed separately for acid and base step protocols. Post-hoc independent samples t-tests with Bonferroni correction were performed to compare rhythmicity of stomatogastric and cardiac preparations at each pH step. T-statistics are not reported for identical data sets.
Additional files
-
Transparent reporting form
- https://doi.org/10.7554/eLife.41877.022
Download links
A two-part list of links to download the article, or parts of the article, in various formats.
Downloads (link to download the article as PDF)
Open citations (links to open the citations from this article in various online reference manager services)
Cite this article (links to download the citations from this article in formats compatible with various reference manager tools)
Two central pattern generators from the crab, Cancer borealis, respond robustly and differentially to extreme extracellular pH
eLife 7:e41877.
https://doi.org/10.7554/eLife.41877


