GREB1 amplifies androgen receptor output in human prostate cancer and contributes to antiandrogen resistance
- Memorial Sloan Kettering Cancer Center, United States
- Albert Einstein College of Medicine, United States
- Howard Hughes Medical Institute, United States
Figures
Figure 1 with 4 supplements
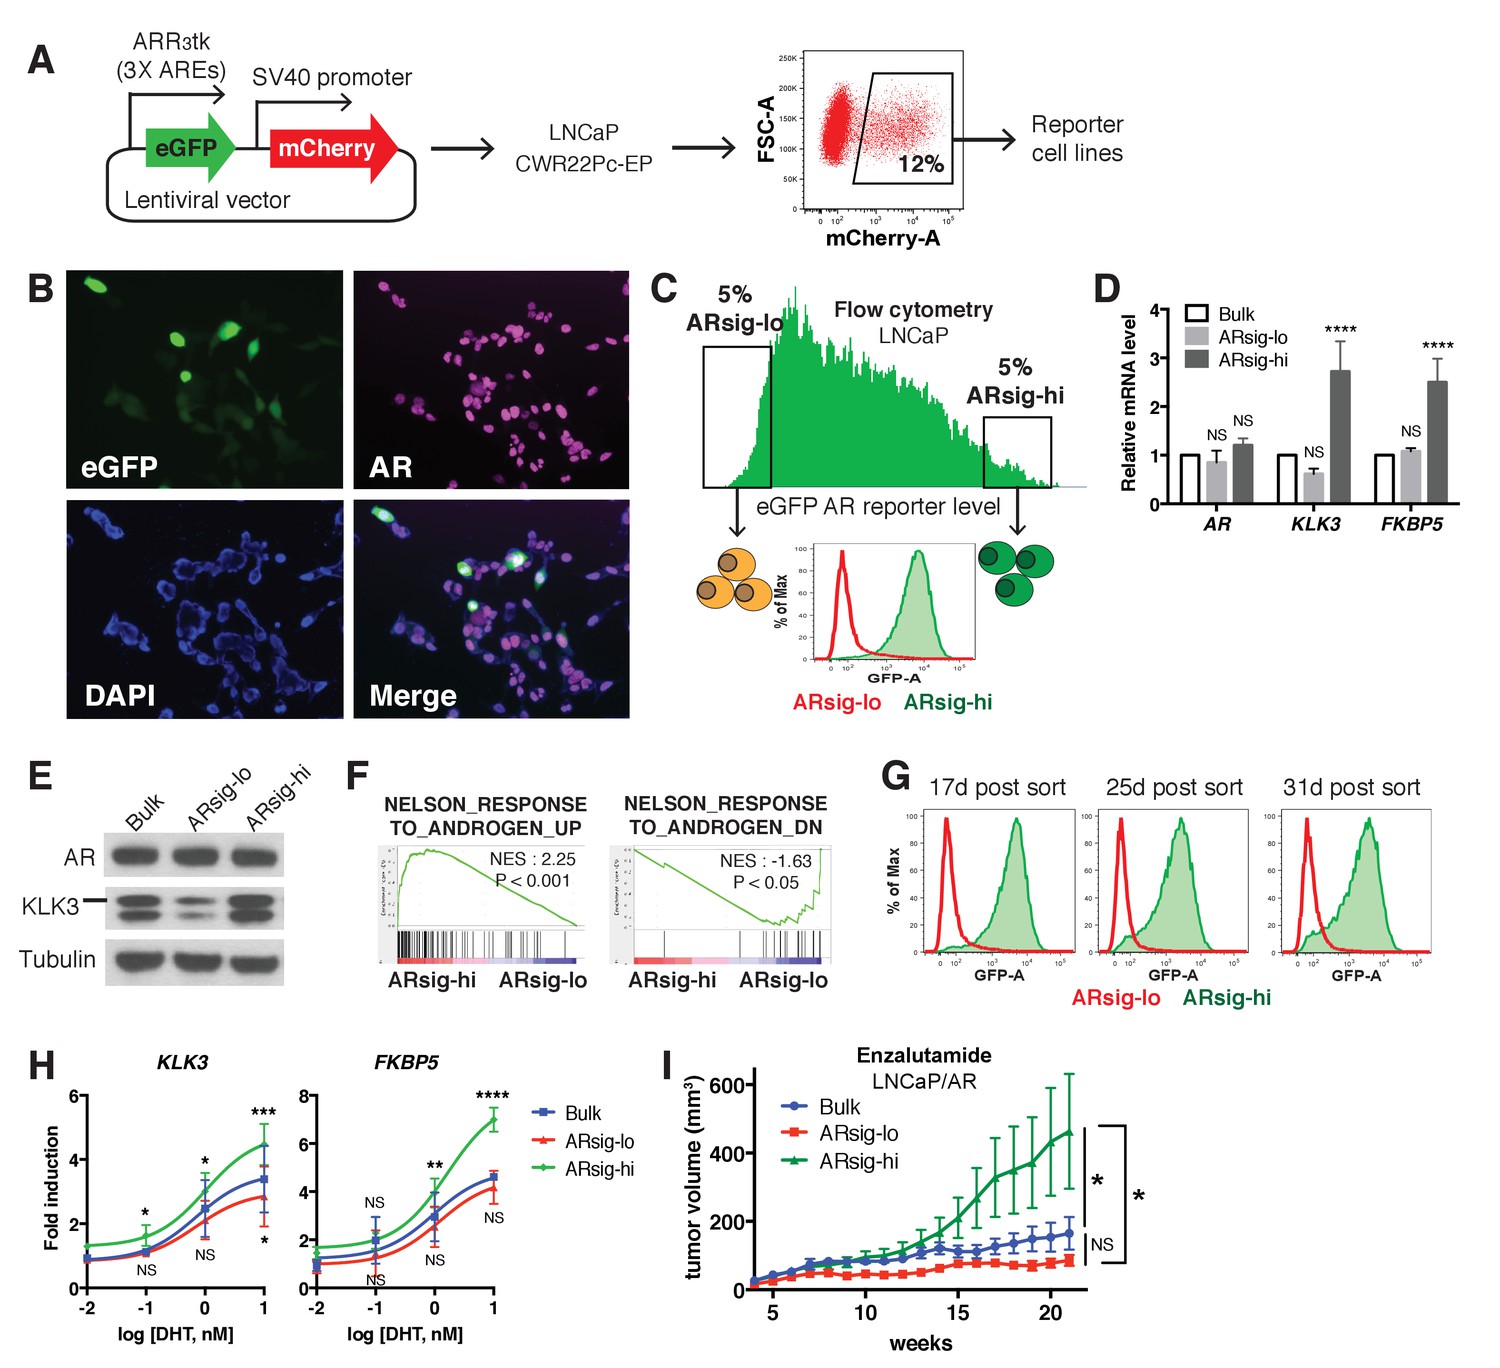
Characterization of prostate cancer cells with low vs. high AR output.
(A) The LNCaP and CWR22Pc-EP reporter cell lines were generated by lentiviral infection with the eGFP AR reporter construct (details can be found in Materials and methods). Cells with stable integration of the construct were positively sorted by mCherry expression using flow cytometry. (B) LNCaP cells infected with the AR reporter display variable expression levels of eGFP (green) and AR (magenta). Nuclei were labeled with DAPI (blue). (C) LNCaP cells with low (ARsig-lo) or high (ARsig-hi) AR activities were sorted using flow cytometry based on eGFP AR-reporter expression. (D–E) LNCaP ARsig-hi cells have higher AR output while having the same level of AR. The q-PCR data (D) is presented as mean fold change ±SD relative to the bulk population. NS = not significant, ****p<0.0001, one-way ANOVA compared to the bulk population. (F) Gene set enrichment analysis (GSEA) shows that the gene sets up- and down-regulated by androgen are enriched in LNCaP ARsig-hi and ARsig-lo cells, respectively. (G) LNCaP ARsig-lo and ARsig-hi cells maintain their AR activity levels over time. (H) LNCaP ARsig-hi cells showed enhanced upregulation of AR target genes in response to DHT treatment. The q-PCR data is presented as mean fold change ±SD relative to the DMSO control. NS = not significant, *p<0.05, **p<0.01, ***p<0.001, ****p<0.0001, one-way ANOVA compared to the bulk population. (I) LNCaP/AR xenografts derived from ARsig-hi cells become resistant to enzalutamide faster than other populations. The bulk, sorted ARsig-lo and ARsig-hi cells were injected into physically castrated mice and the mice were treated with enzalutamide immediately after injection. Data is presented as mean ±SEM (N = 10). NS = not significant, *p<0.05, one-way ANOVA.
-
Figure 1—source data 1
GSEA Results (ARsig-lo vs. ARsig-hi).
- https://doi.org/10.7554/eLife.41913.008
Figure 1—figure supplement 1
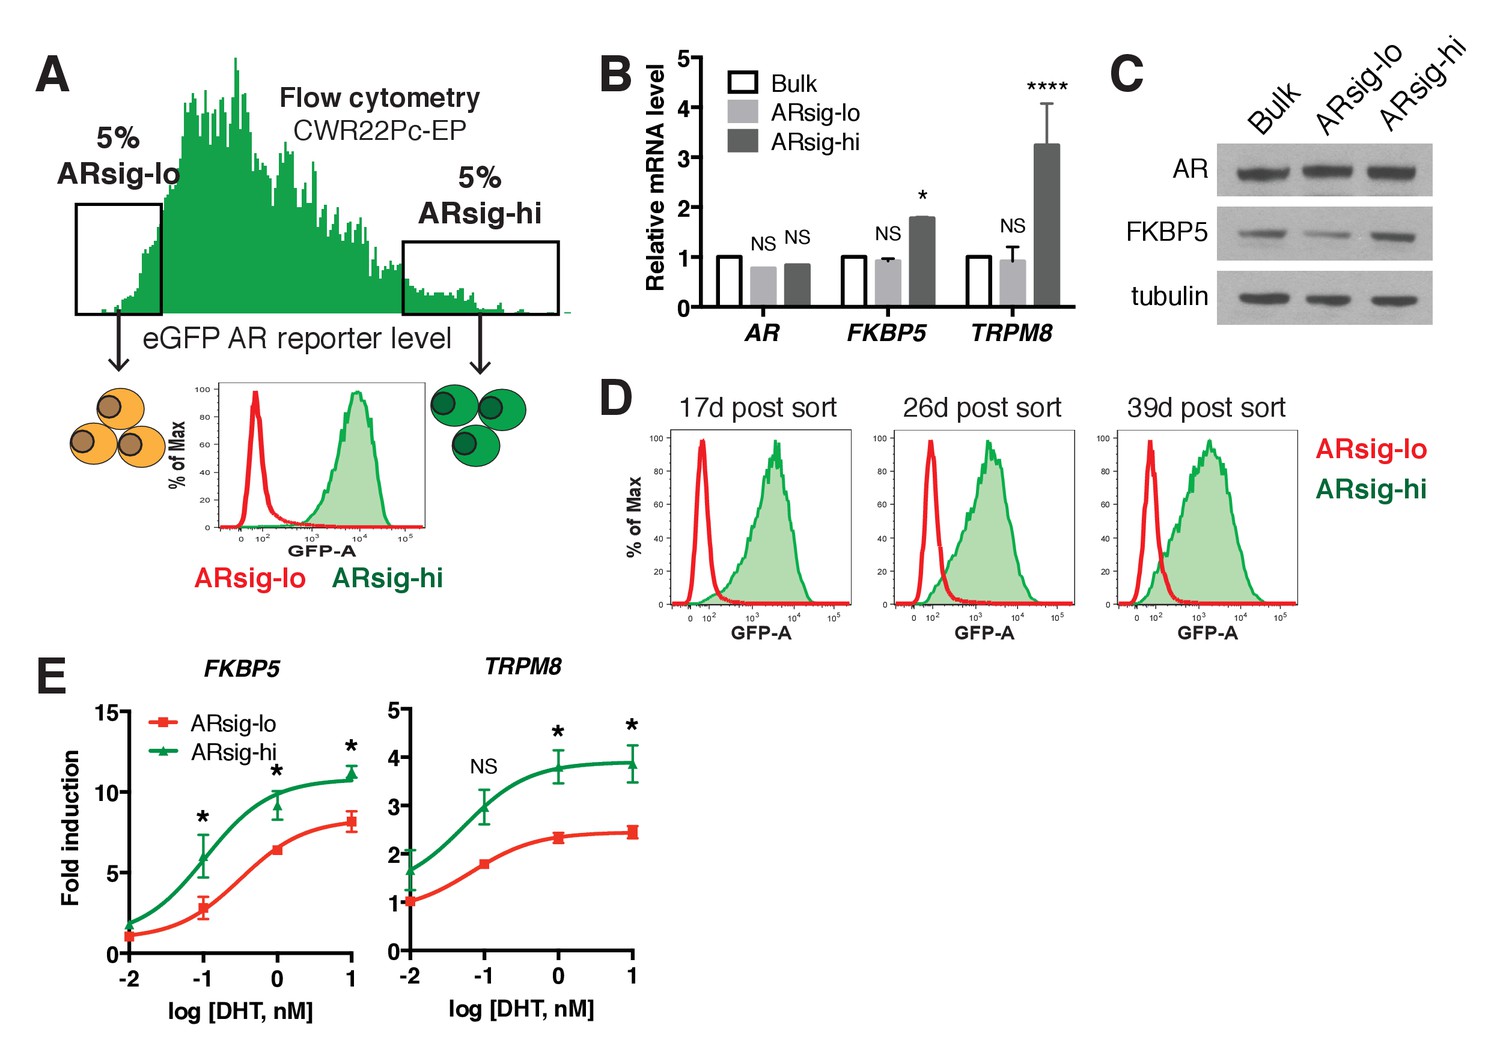
Characterization of CWR22Pc-EP prostate cancer cells with low vs. high AR output.
(A) CWR22Pc-EP cells with low (ARsig-lo) or high (ARsig-hi) AR activities were sorted using flow cytometry based on eGFP AR-reporter expression. (B–C) CWR22Pc-EP ARsig-hi cells have higher AR output while having the same level of AR. The q-PCR data (B) is presented as mean fold change ±SD relative to the bulk population. NS = not significant, *p<0.05, ****p<0.0001, one-way ANOVA compared to the bulk population. (D) CWR22Pc-EP ARsig-lo and ARsig-hi cells maintain their AR activity levels over time. (E) CWR22Pc-EP ARsig-hi cells have enhanced DHT-induced AR transcriptional activity compared to ARsig-lo cells. The q-PCR data is presented as mean fold change ±SD relative to the DMSO control. NS = not significant, *p<0.05, unpaired t-test compared to ARsig-lo population.
Figure 1—figure supplement 2
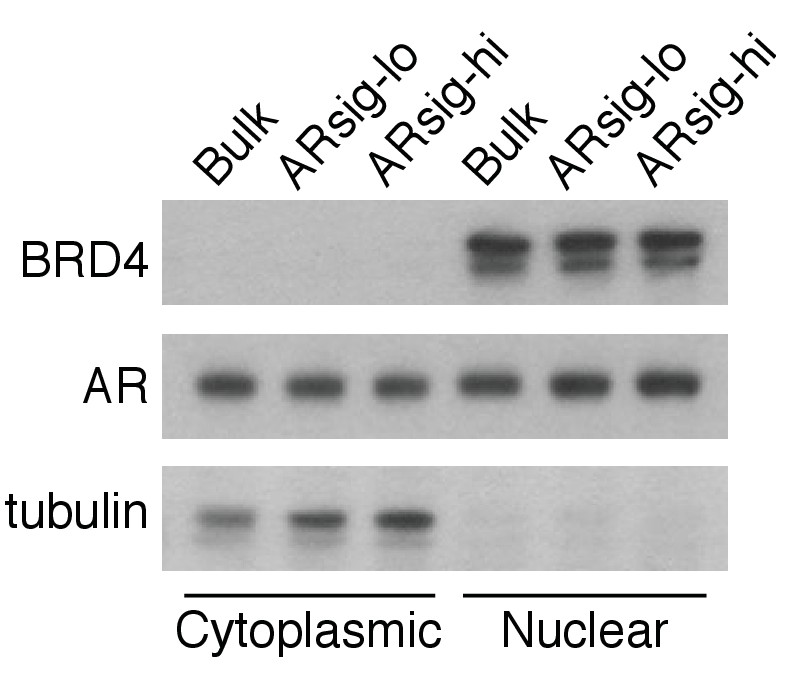
LNCaP ARsig-lo and ARsig-hi cells have comparable nuclear AR levels.
The BRD4 and tubulin were used as nuclear and cytoplasmic loading controls, respectively.
Figure 1—figure supplement 3
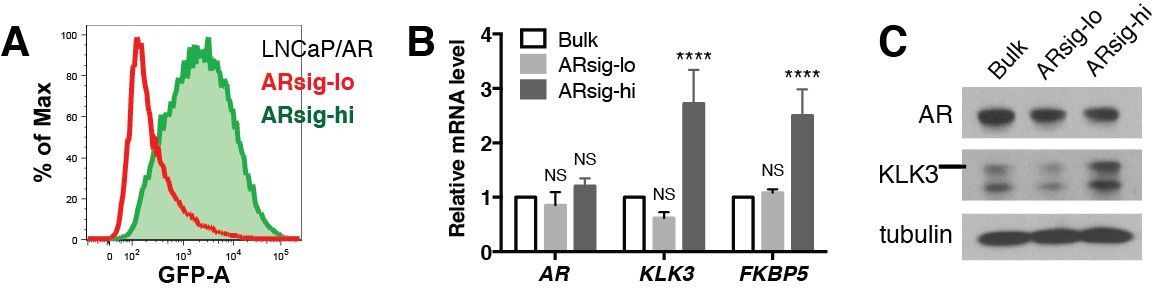
Characterization of LNCaP/AR prostate cancer cells with low vs. high AR output.
(A–C) LNCaP/AR cells with low (ARsig-lo) and high (ARsig-hi) AR activities were sorted using flow cytometry based on eGFP AR-reporter expression. The AR reporter activity (A) and AR target gene expression (B–C) were analyzed 7 days post sorting. The q-PCR data (B) is presented as mean fold change ±SD relative to the bulk population. NS = not significant, ****p<0.0001, one-way ANOVA compared to the bulk population.
Figure 1—figure supplement 4
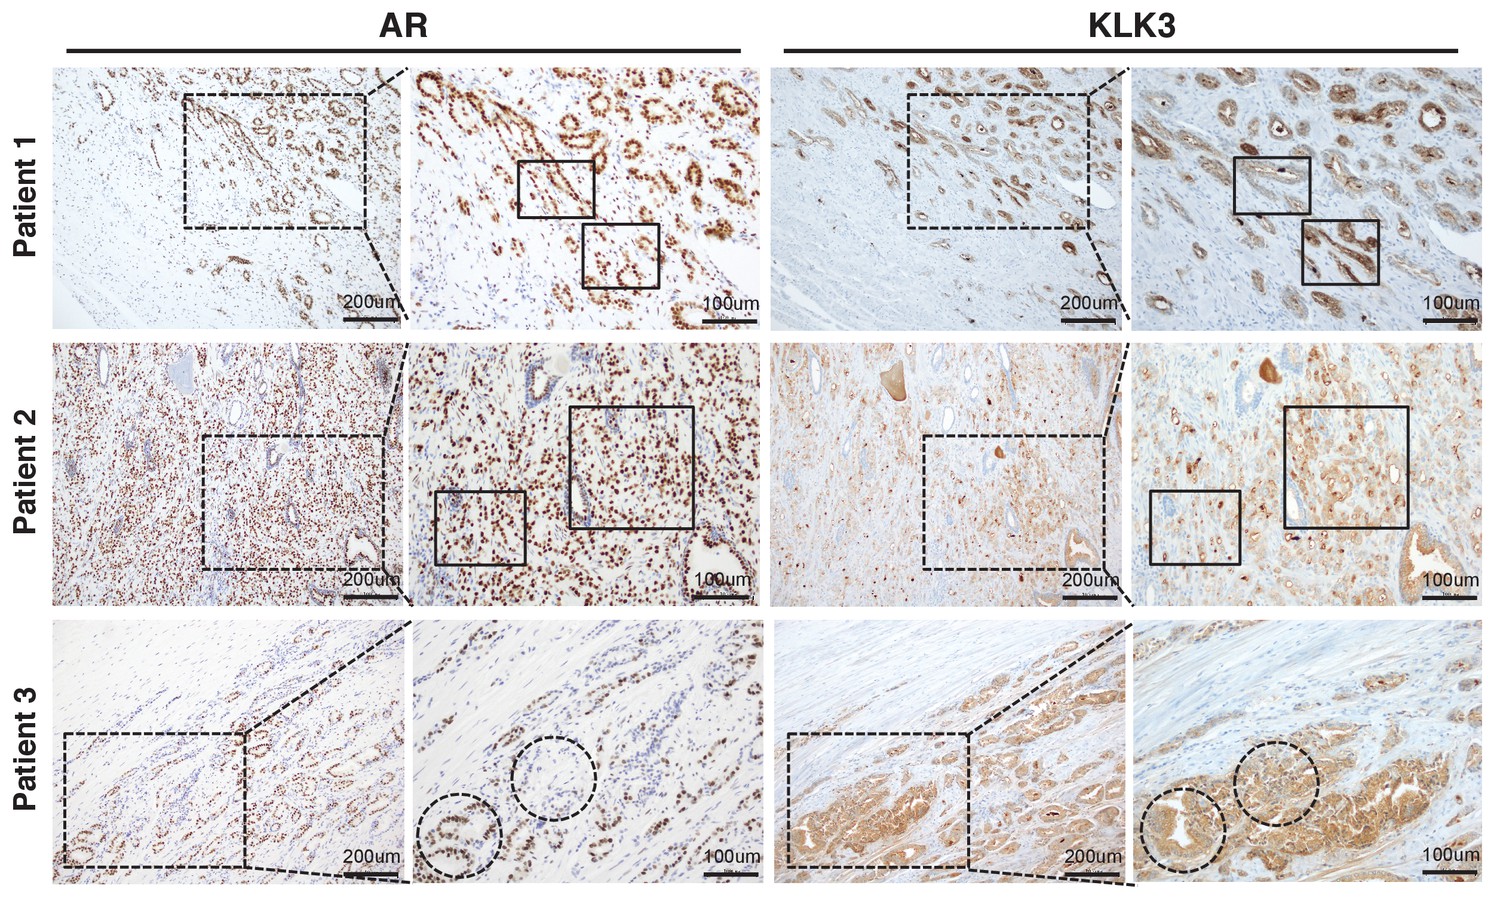
AR and KLK3 staining in untreated localized prostate cancer shows heterogeneous KLK3 staining that is not strictly correlated with AR level.
https://doi.org/10.7554/eLife.41913.007
Figure 2 with 1 supplement
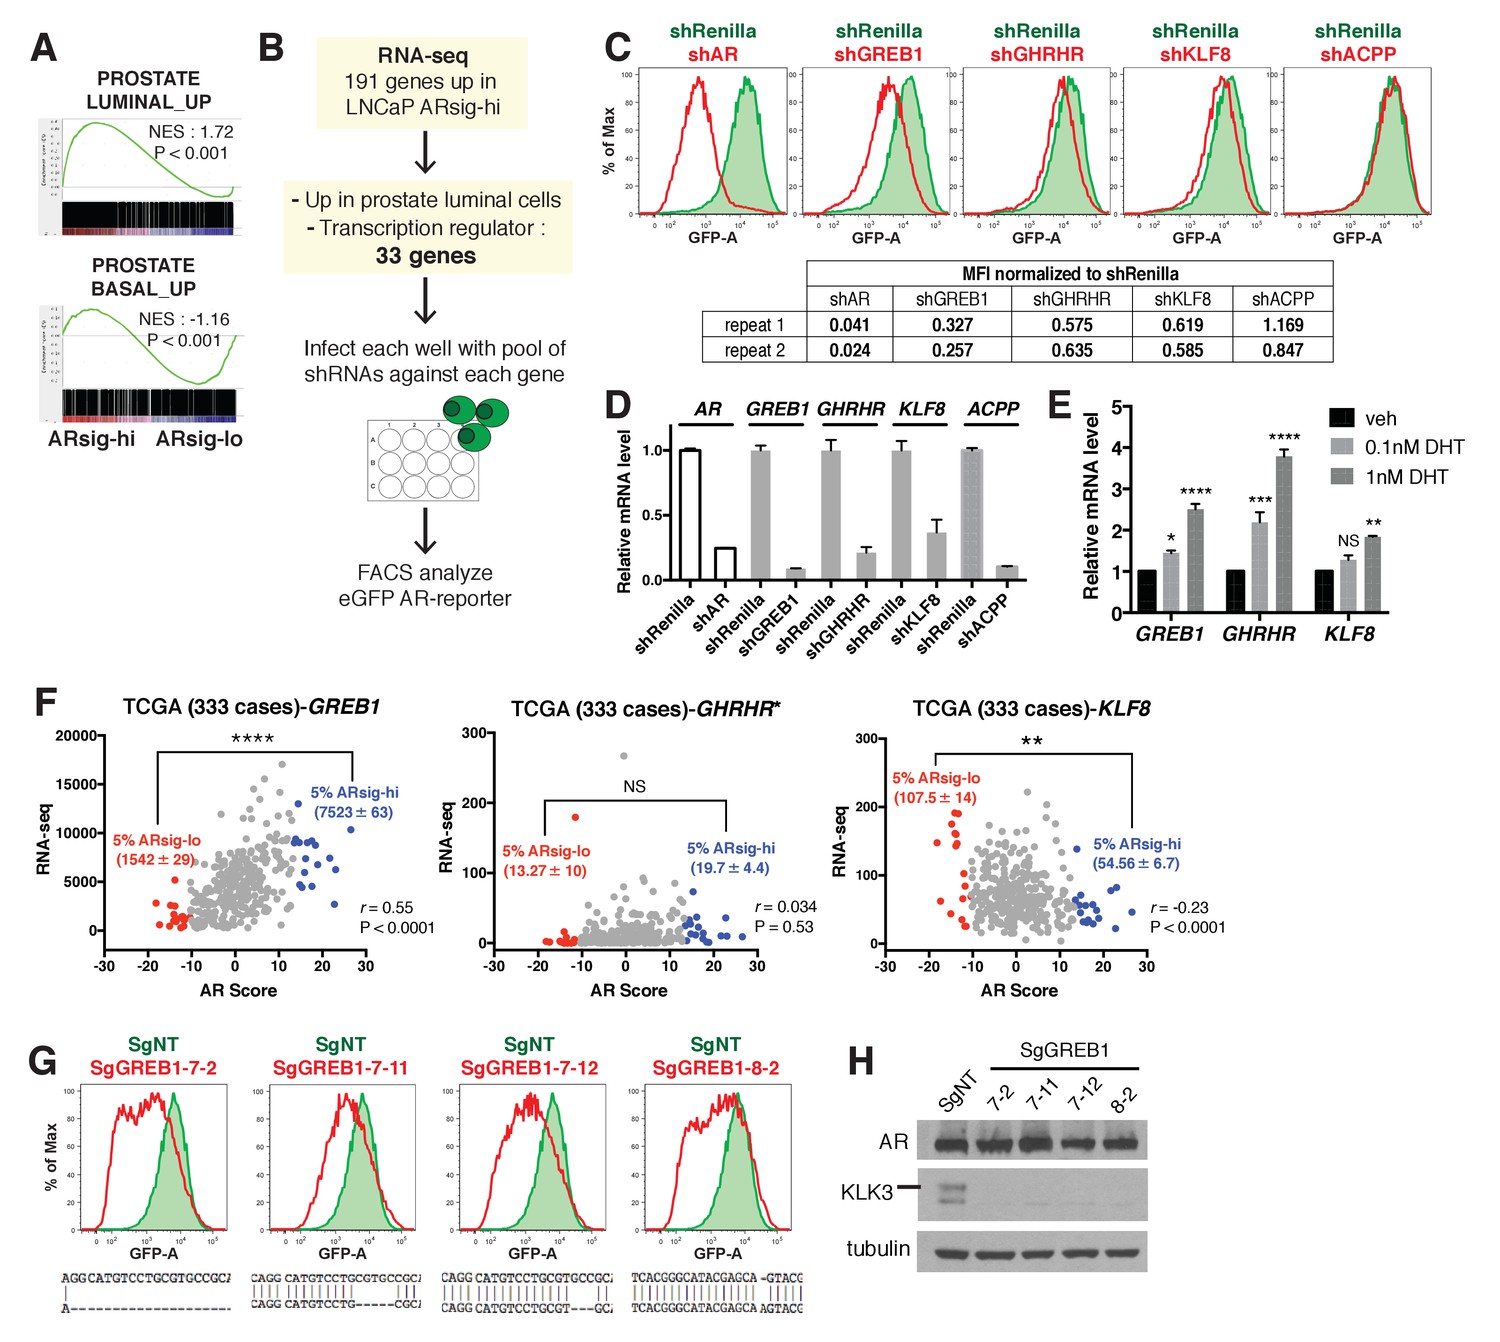
Knockdown of the three AR regulated genes, GREB1, GHRHR and KLF8, inhibited AR activity in cells with high AR activity.
(A) Gene set enrichment analysis (GSEA) shows that genes upregulated in human prostate luminal and basal cells are enriched in LNCaP ARsig-hi and ARsig-lo cells, respectively. (B) The schematic of the knockdown study with 33 selected genes upregulated in LNCaP ARsig-hi cells. Details can be found in the Materials and methods. (C) The flow cytometry results show that the knockdown of GREB1, GHRHR and KLF8 inhibited AR reporter activity in LNCaP ARsig-hi cells. Top: The flow cytometry plot of one of the duplicate assays is shown. Bottom: The normalized median fluorescence intensity (MFI) of eGFP reporter in each assay is shown. AR shRNA was used as a positive control. ACPP shRNA is shown as a representative hairpin that had no effect on reporter activity. (D) The knockdown level of AR, GREB1, GHRHR, KLF8 and ACPP from the cells represented in (C). The q-PCR data is presented as mean fold change ±SD relative to the shRenilla control. (E) The transcription of GREB1, GHRHR and KLF8 is regulated by androgen in LNCaP. The data is presented as mean fold change ±SD relative to the DMSO control. NS = not significant, *p<0.05, **p<0.01, ***p<0.001, ****p<0.0001, one-way ANOVA compared to the DMSO control. (F) The correlation between RNA levels of GREB1, GHRHR and KLF8 and AR score in 333 TCGA primary prostate tumors were analyzed using Pearson’s correlation analysis (r). The RNA levels of the three genes were also compared between tumors with lowest (ARsig-lo, red points) and highest (ARsig-hi, blue points) AR score (5% of 333 cases: 17 cases each). NS = not significant, **p<0.01, ****p<0.0001, unpaired t-test. *One data point (GHRHR, x = −0.67, y = 1252.6072) is outside the y-axis limit. (G) The GREB1 function is inhibited by CRISPR/Cas9 in four LNCaP ARsig-hi sublines. (Top) AR reporter activity was inhibited in all four GREB1 CRISPR cell lines compared to control (SgNT). (Bottom) An example of the genomic alteration in the targeted sequence for each cell line is shown. (H) The CRISPR/Cas9-mediated inhibition of GREB1 suppressed KLK3 expression without affecting the AR level.
-
Figure 2—source data 1
Differentially expressed genes between ARsig-lo vs. ARsig-hi.
- https://doi.org/10.7554/eLife.41913.011
-
Figure 2—source data 2
Summary of Median eGFP Intensity of small-scale shRNA screen.
- https://doi.org/10.7554/eLife.41913.012
-
Figure 2—source data 3
AR scores and RNA levels of GREB1, GHRHR and KLF8 of 333 TCGA cases.
- https://doi.org/10.7554/eLife.41913.013
Figure 2—figure supplement 1
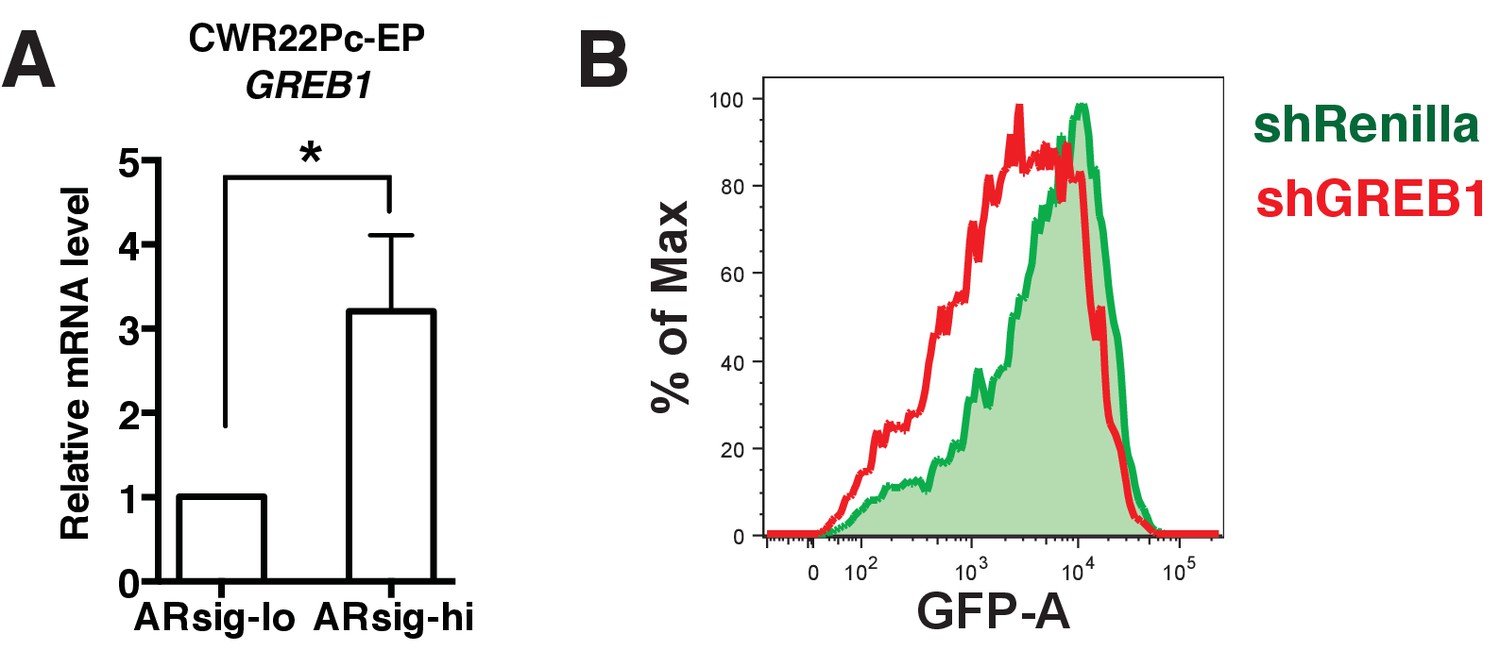
Inhibition of GREB1 suppresses AR transcriptional activity in CWR22Pc-EP cells.
(A) GREB1 is upregulated in CWR22Pc-EP ARsig-hi cells. *p<0.05, unpaired t-test. (B) Knockdown of GREB1 in CWR22Pc-EP ARsig-hi cells inhibited AR reporter activity.
Figure 3 with 3 supplements

GREB1 amplifies AR transcriptional activity by enhancing AR binding to chromatin.
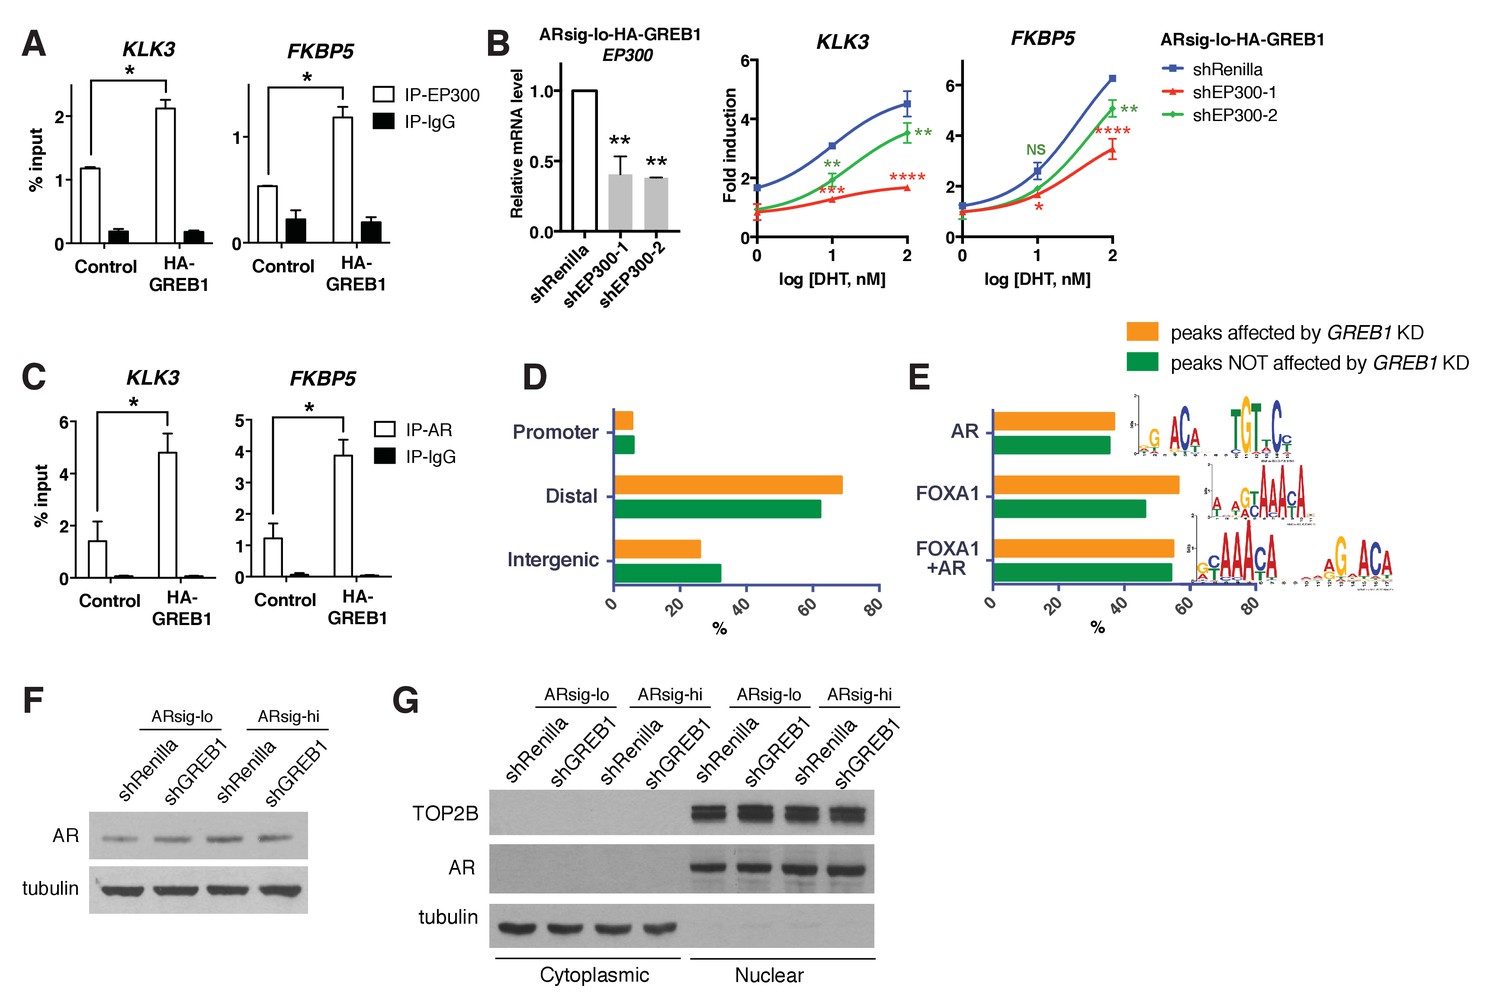
(A) GREB1 overexpression in LNCaP ARsig-lo cells with stable integration of a GREB1 lentiviral vector containing an amino-terminal HA-tag. (B) LNCaP ARsig-lo cells with GREB1 overexpression show higher induction of AR target genes in response to DHT treatment. The q-PCR data is presented as mean fold change ±SD relative to the DMSO control. NS = not significant, *p<0.05, **p<0.01, ***p<0.001, ****p<0.0001, unpaired t-test compared to the control cells. (C) GREB1 overexpression in LNCaP ARsig-lo cells increases protein levels of AR target genes without affecting AR level. (D) Co-immunoprecipitation using nuclear extracts shows an interaction between AR and GREB1 (HA) in LNCaP ARsig-lo cells. (E) ChIP against the HA-tag shows GREB1 binding on the KLK3 and FKBP5 enhancer regions in LNCaP ARsig-lo cells. *p<0.05, unpaired t-test. (F–G) LNCaP ARsig-hi cells have increased EP300 binding on the KLK3 and FKBP5 enhancer regions in a GREB1 dependent manner. *p<0.05, **p<0.01, unpaired t-test. (H) GREB1 knockdown or CRISPR decreases AR binding to KLK3 enhancer in LNCaP ARsig-hi cells. *p<0.05, **p<0.01, ***p<0.001, unpaired t-test (shRenilla vs. shGREB1), one-way ANOVA (SgNT vs. SgGREB1). The ChIP q-PCR data (E–H) is presented as mean percentage input ±SD. (I) Overlap of AR ChIP-sequencing peaks shows that AR peaks are disrupted by GREB1 knockdown in LNCaP ARsig-hi cells. (J) ChIP-sequencing summary plot shows that AR enrichment across the AR-binding sites is reduced by GREB1 knockdown. (K) Example of AR genomic peaks at NKX3-1.
Figure 3—figure supplement 1
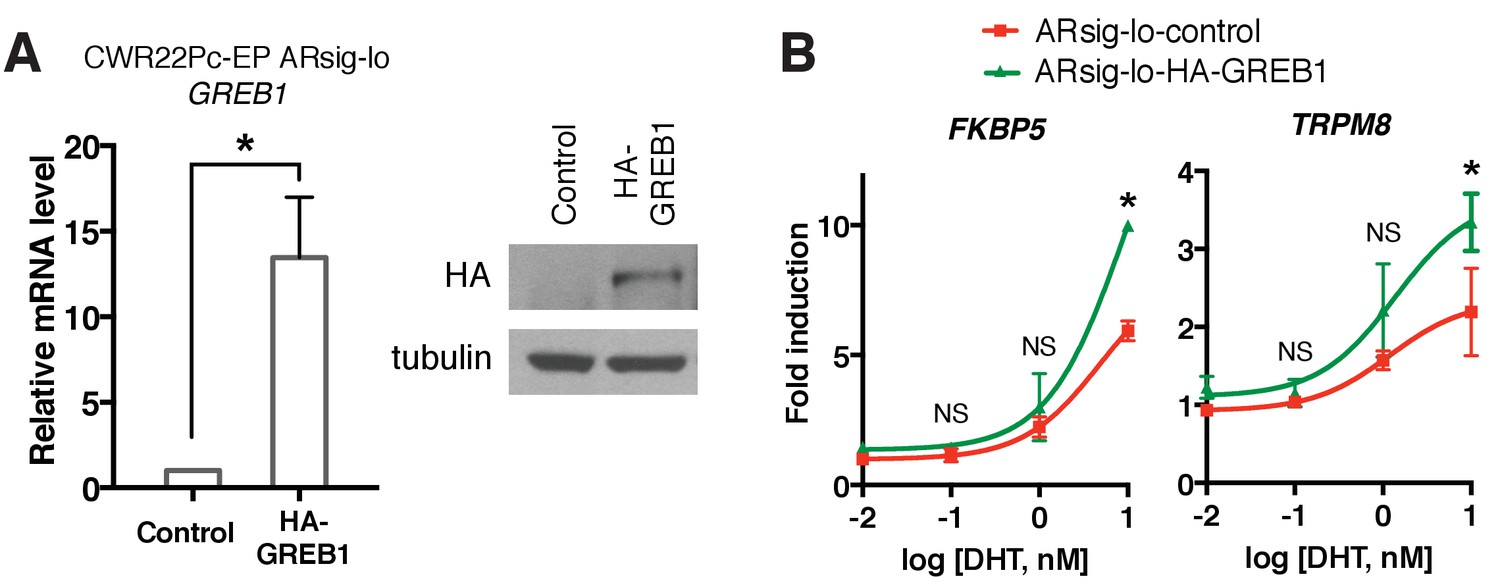
GREB1 amplifies AR transcriptional activity in CWR22Pc-EP cells.
(A) GREB1 overexpression in CWR22Pc-EP ARsig-lo cells with stable integration of GREB1 lentiviral vector containing HA-tag. *p<0.05, unpaired t-test. (B) CWR22Pc-EP ARsig-lo cells with GREB1 overexpression show higher induction of AR target genes in response to DHT treatment. The q-PCR data is presented as mean fold change ±SD relative to the DMSO control. NS = not significant, *p<0.05, unpaired t-test compared to the control cells.
Figure 3—figure supplement 2
GREB1 enhances EP300 recruitment to AR and AR binding to chromatin.
(A) GREB1 overexpression promotes EP300 binding to KLK3 and FKBP5 enhancer regions in LNCaP ARsig-lo cells. *p<0.05, unpaired t-test. The ChIP q-PCR data is presented as mean percentage input ±SD. (B) Knockdown of EP300 in LNCaP ARsig-lo cells with GREB1 overexpression suppressed DHT-induced AR target gene upregulation. The q-PCR data is presented as mean fold change ±SD relative to the shRenilla (left graph) or DMSO control (right graph). NS = not significant, *p<0.05, **p<0.01, ***p<0.001, ****p<0.0001, one-way ANOVA compared to the shRenilla control. (C) GREB1 overexpression promotes AR binding to KLK3 and FKBP5 enhancer regions in LNCaP ARsig-lo cells. *p<0.05, unpaired t-test. The ChIP q-PCR data is presented as mean percentage input ±SD. (D–E) The location (D) and motif (E) analysis of the AR ChIP-sequencing data shows no difference between peaks affected and not affected by GREB1 knockdown. (F–G) GREB1 knockdown has no effect on total (F) and nuclear (G) AR level in both LNCaP ARsig-lo and ARsig-hi cells. TOP2B and tubulin were used as nuclear and cytoplasmic loading controls, respectively.
Figure 3—figure supplement 3
GREB1 has a unique function compared to ER or NCOA1 and NCOA2.
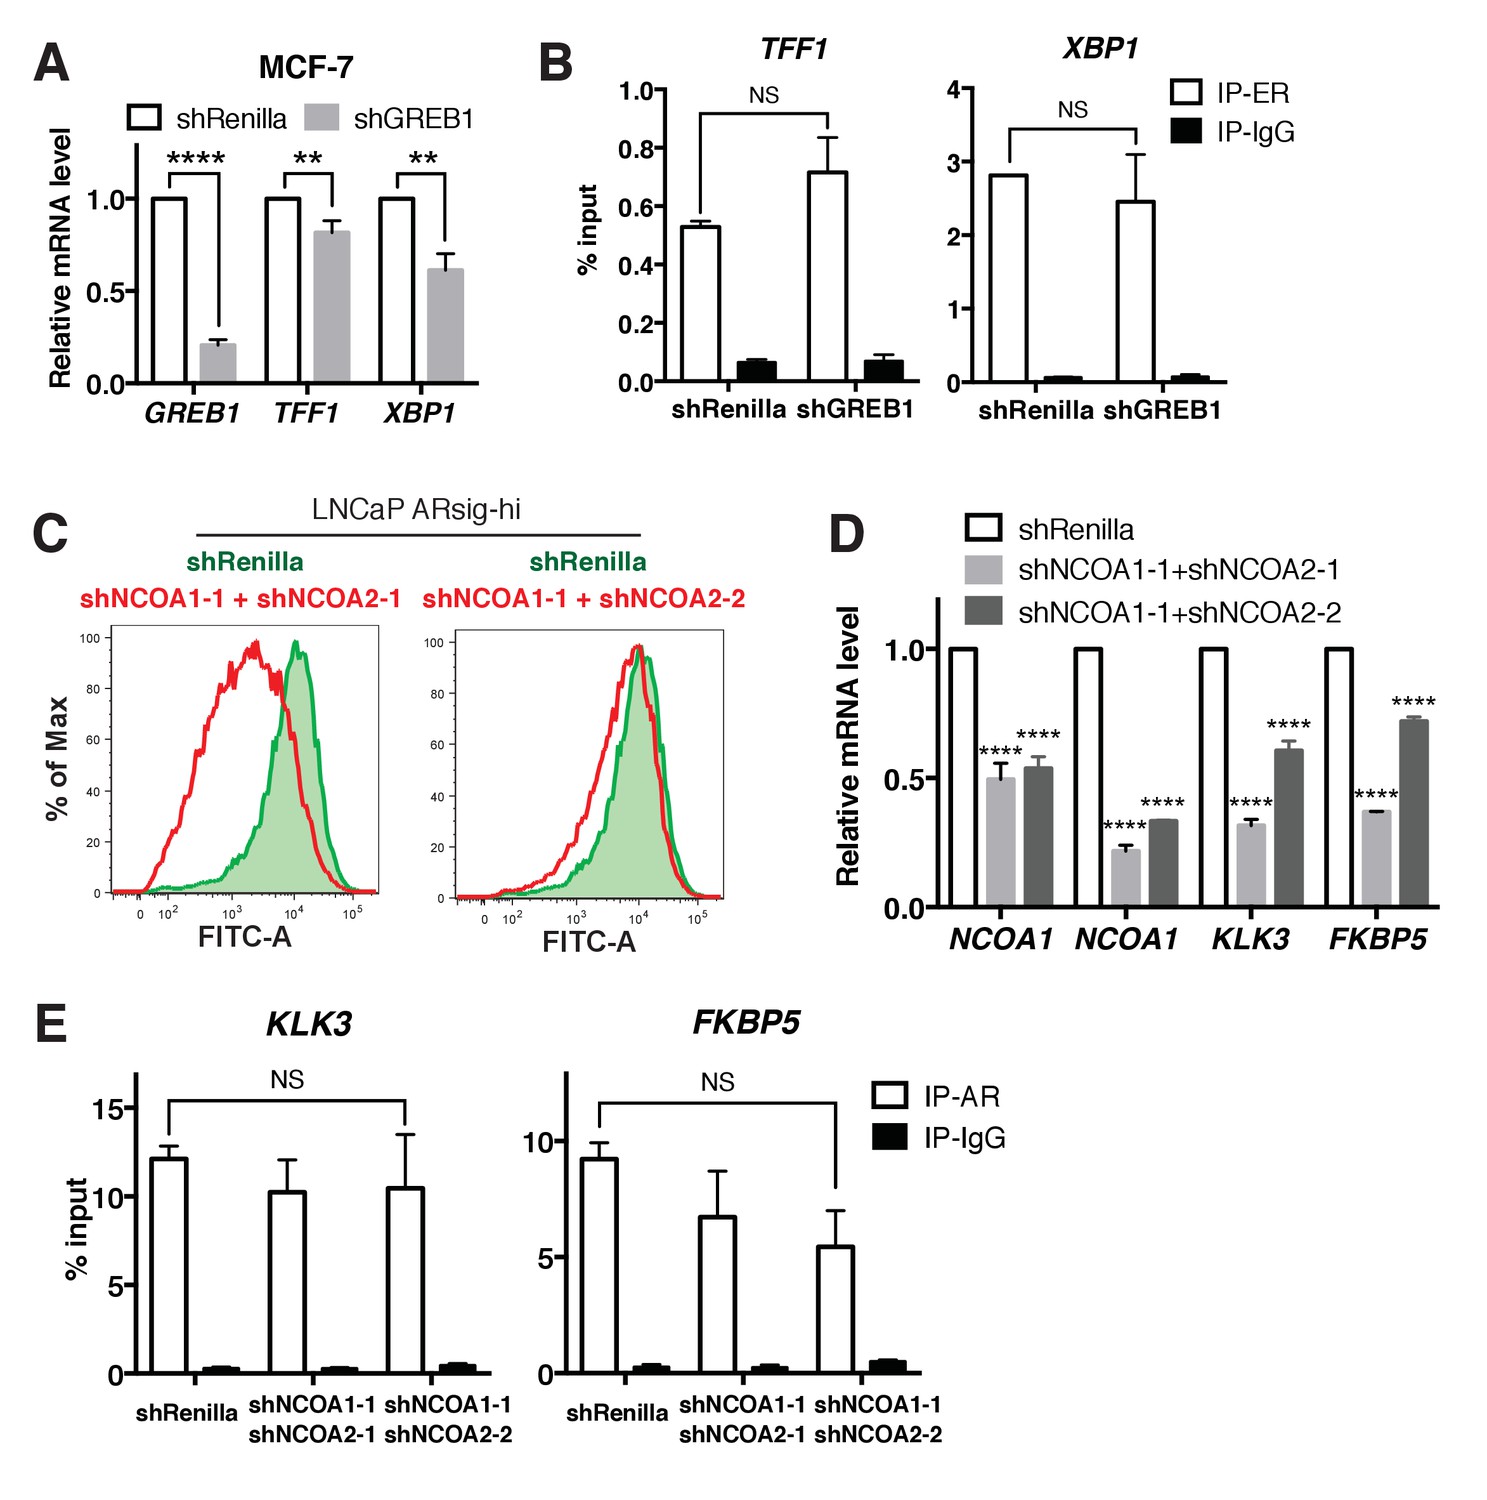
(A–B) Knockdown of GREB1 in MCF7 cells inhibits ER target gene expression (A), but has no effect on ER recruitment to binding sites (B). (C–E) Knockdown of both NCOA1 and NCOA2 in LNCaP ARsig-hi cells inhibits AR reporter activity (C) and AR target gene expression (D), but does not affect AR binding on KLK3 and FKBP5 enhancer regions (E). The q-PCR data (A,D) is presented as mean fold change ±SD relative to the shRenilla control. The ChIP q-PCR data (B,E) is presented as mean percentage input ±SD. NS = not significant, **p<0.01, ****p<0.0001, unpaired t-test (A,B), one-way ANOVA (D,E) compared to the shRenilla control.
Figure 4 with 1 supplement
GREB1 is the major molecular determinant of ARsig-hi cells.
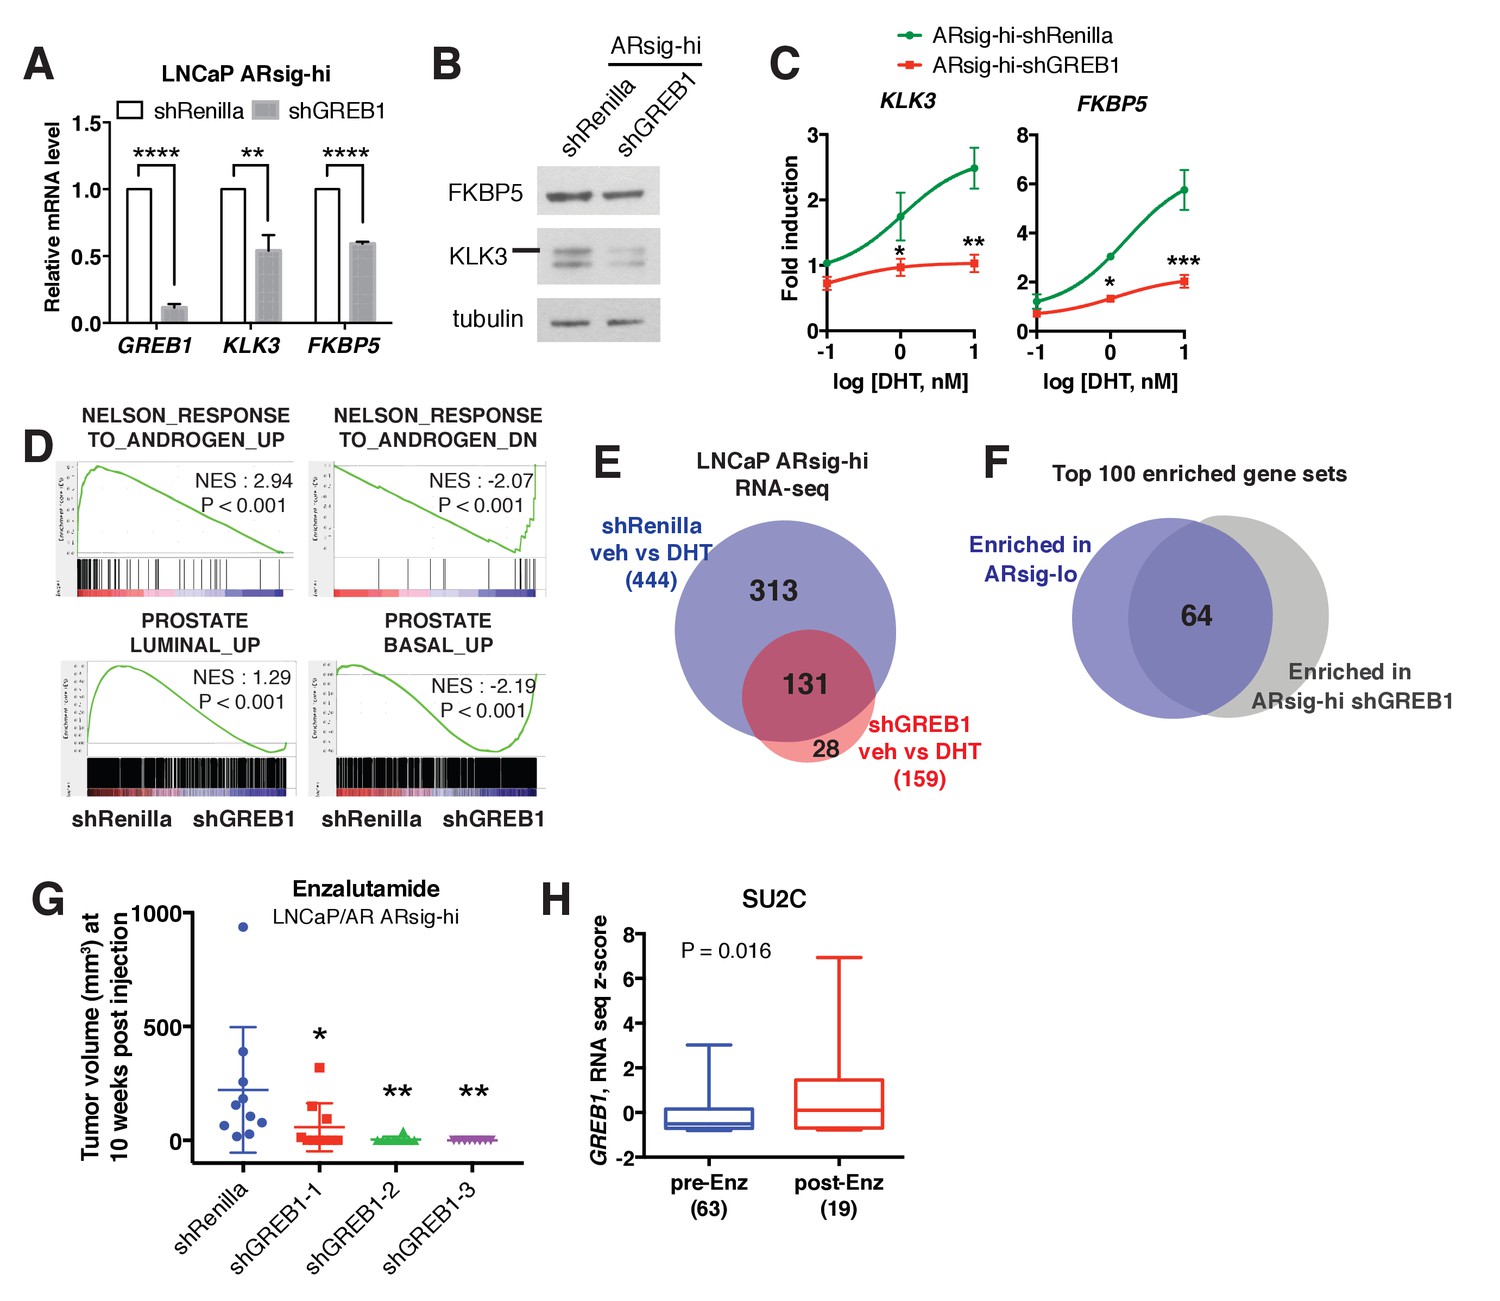
(A–B) Knockdown of GREB1 inhibited AR target gene expression in LNCaP ARsig-hi cells. The q-PCR data (A) is presented as mean fold change ±SD relative to the shRenilla control. **p<0.01, ****p<0.0001, unpaired t-test. (C) Knockdown of GREB1 suppressed the enhanced AR transcriptional activity in LNCaP ARsig-hi cells. The q-PCR data is presented as mean fold change ±SD relative to the DMSO control. *p<0.05, **p<0.01, ***p<0.001, unpaired t-test compared to the shRenilla control. (D) Gene set enrichment analysis (GSEA) shows that the gene sets up- and down-regulated by androgen are enriched in LNCaP ARsig-hi control and GREB1 knockdown cells, respectively and genes upregulated in human prostate luminal and basal cells are enriched in ARsig-hi control and GREB1 depleted cells, respectively. (E) Venn diagram showing that 70.5% of DHT-induced genes in control LNCaP ARsig-hi cells were inhibited by GREB1 knockdown. (F) Venn diagram showing that 64% of the top 100 gene sets enriched in LNCaP ARsig-lo overlap with the top 100 gene sets enriched in GREB1 depleted ARsig-hi cells. (G) Knockdown of GREB1 inhibited development of enzlutamide-resistant LNCaP/AR xenografts derived from ARsig-hi cells. The sorted LNCaP/AR ARsig-hi cells were infected with control or three different shRNAs targeting GREB1 and injected into physically castrated mice. Mice were treated with enzalutamide immediately after injection. Data is presented as mean ±SEM (N = 10). *p<0.05, **p<0.01, one-way ANOVA compared to the shRenilla control. (H) The SU2C cases that have received enzalutamide (Enz) have increased level of GREB1 (unpaired t-test).
-
Figure 4—source data 1
Upregulated genes in ARsig-hi shRenilla DHT vs. veh.
- https://doi.org/10.7554/eLife.41913.020
-
Figure 4—source data 2
Upregulated genes in ARsig-hi shGREB1 DHT vs. veh.
- https://doi.org/10.7554/eLife.41913.021
-
Figure 4—source data 3
GSEA Results (ARsig-hi shRenilla DHT vs. shGREB1 DHT).
- https://doi.org/10.7554/eLife.41913.022
Figure 4—figure supplement 1
Knockdown of GREB1 inhibits AR signaling.
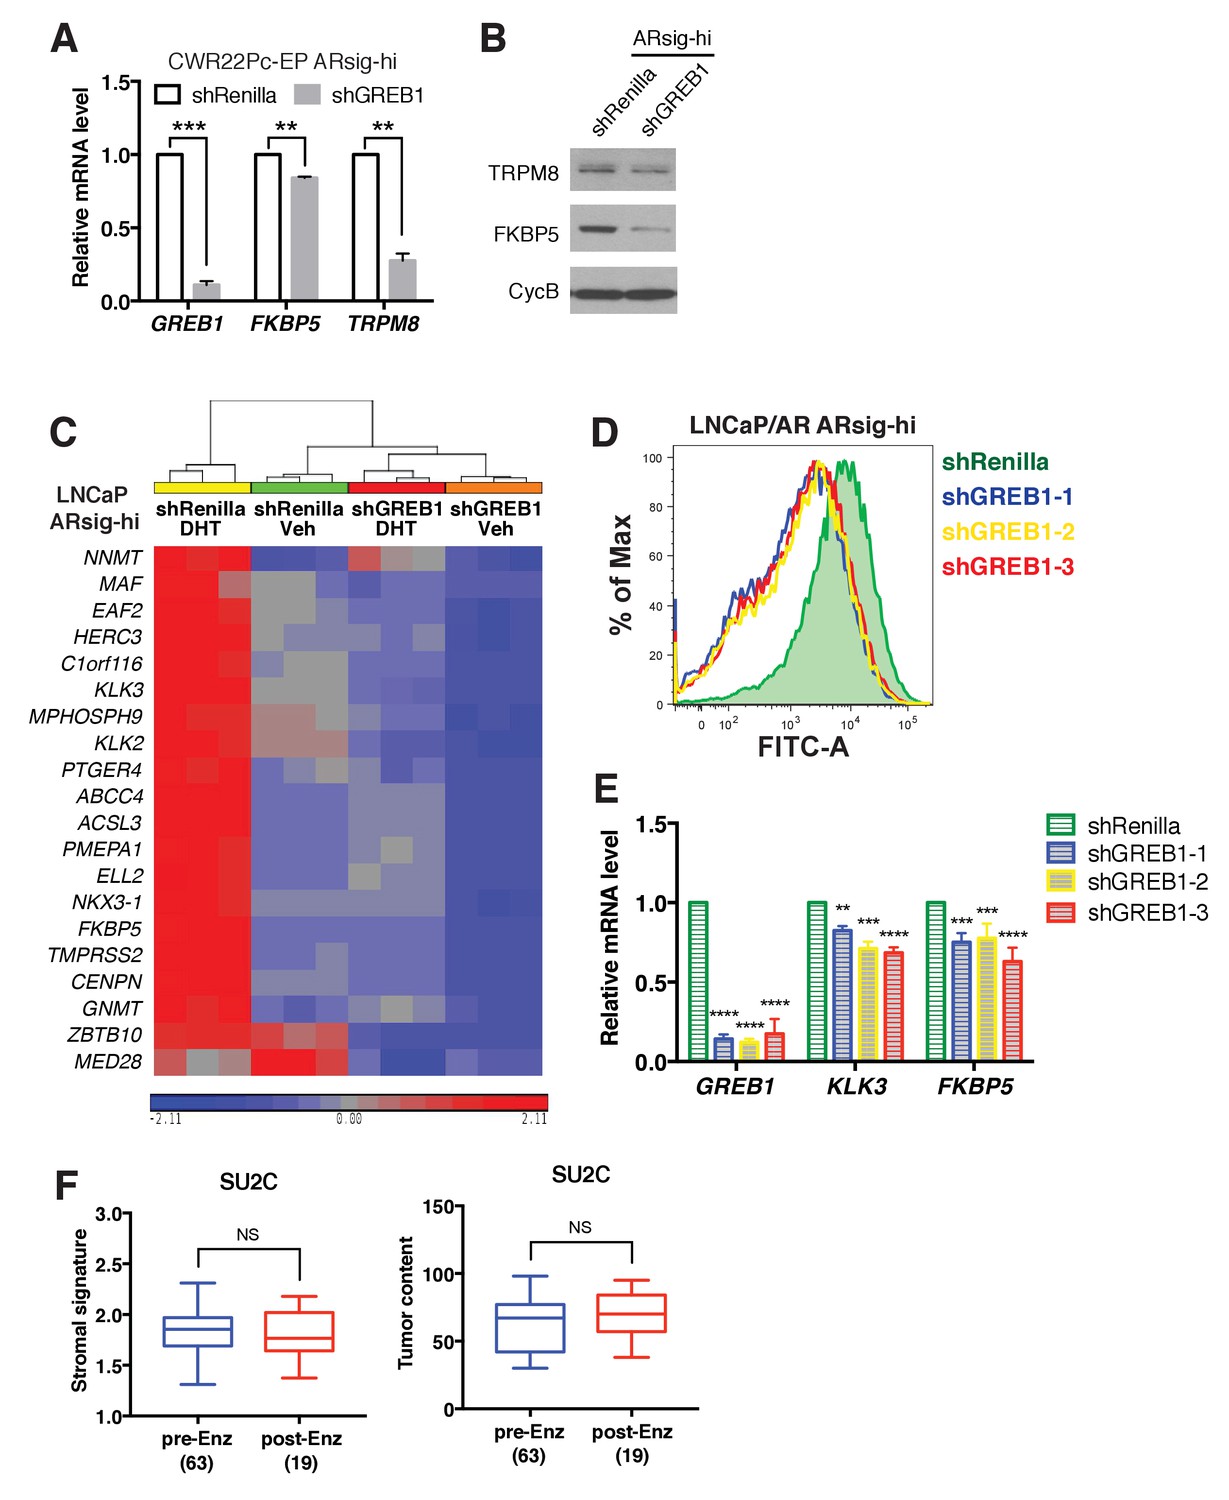
(A–B) Knockdown of GREB1 inhibited AR target gene expression in CWR22Pc-EP ARsig-hi cells. (C) Heatmap generated from the RNA-sequencing data shows that the expression of 20 AR target genes used to calculate the AR score are suppressed by GREB1 knockdown in LNCaP ARsig-hi cells. (D–E) Knockdown of GREB1 in LNCaP/AR ARsig-hi cells inhibited AR reporter activity (D) and expression of AR target genes (E). The q-PCR data (A,E) is presented as mean fold change ±SD relative to the shRenilla control. **p<0.01, ***p<0.001, ****p<0.0001, unpaired t-test (A), one-way ANOVA (E) compared to the shRenilla control. (F) The stromal signature score and tumor purity content show no significant change between pre- vs. post-enzalutamide (Enz) treated SU2C cases. NS = not significant, unpaired t-test.
Tables
Key resources table
| Reagent type (species) or resource | Designation | Source or reference | Identifiers | Additional information |
|---|---|---|---|---|
| Cell line (H. sapiens) | LNCaP | ATCC | CRL-1740, RRID:CVCL_1379 | |
| Cell line (H. sapiens) | LNCaP/AR | PMID: 14702632 | ||
| Cell line (H. sapiens) | CWR22Pc-EP | PMID: 28059768 | ||
| Antibody | AR | abcam | ab108341, RRID:AB_10865716 | WB (1:1000), IP (5 ug/IP) |
| Antibody | AR | Santa Cruz | sc-816, RRID:AB_1563391 | IF (1:500), ChIP (5 ug/IP) |
| Antibody | AR | Agilent | 441 | IHC |
| Antibody | KLK3 | Cell Signaling Technology | 5365 | WB (1:500) |
| Antibody | KLK3 | Biogenex | IHC | |
| Antibody | FKBP5 | Cell Signaling Technology | 8245, RRID:AB_10831198 | WB (1:500) |
| Antibody | TRPM8 | Epitomics | 3466–1, RRID:AB_10715643 | WB (1:1000) |
| Antibody | tubulin | Santa Cruz | sc-9104, RRID:AB_2241191 | WB (1:1000) |
| Antibody | Cyclophilin B | abcam | ab178397 | WB (1:100,000) |
| Antibody | BRD4 | Cell Signaling Technology | 13440, RRID:AB_2687578 | WB (1:1000) |
| Antibody | TOP2B | abcam | ab58442, RRID:AB_883147 | WB (1:1000) |
| Antibody | HA | Cell Signaling | 3724, RRID:AB_1549585 | WB (1:1000) |
| Antibody | HA | Abcam | ab9110, RRID:AB_307019 | ChIP (5 ug/IP) |
| Antibody | Alexa Fluor 647 | Invitrogen/ Thermo Fisher | A-31573, RRID:AB_2536183 | IF (1:1000) |
| Antibody | p300 | Santa Cruz | sc-585, RRID:AB_2231120 | ChIP (5 ug/IP) |
| Antibody | ER | Santa Cruz | sc-8002, RRID:AB_627558 | ChIP (5 ug/IP) |
| Antibody | normal rabbit IgG | Millipore Sigma | 12–370, RRID:AB_145841 | ChIP (5 ug/IP) |
| Antibody | Protein A/G agarose beads | Santa Cruz | sc-2003, RRID:AB_10201400 | |
| Recombinant DNA reagent | ARR3tk-eGFP/ SV40-mCherry | This paper | Addgene plasmid #24304 | |
| Recombinant DNA reagent | SCEP-shRenilla | This paper, PMID: 24332856 | ||
| Recombinant DNA reagent | SCEP-shAR.177 | This paper, PMID: 24332856 | ||
| Recombinant DNA reagent | SCEP-shGREB1-1 | This paper, PMID: 24332856 | ||
| Recombinant DNA reagent | SCEP-shGREB1-2 | This paper, PMID: 24332856 | ||
| Recombinant DNA reagent | SCEP-shGREB1-3 | This paper, PMID: 24332856 | ||
| Recombinant DNA reagent | SCEP-shKLF8.3467 | This paper, PMID: 24332856 | ||
| Recombinant DNA reagent | SCEP-shKLF8.2180 | This paper, PMID: 24332856 | ||
| Recombinant DNA reagent | SCEP-shKLF8.2684 | This paper, PMID: 24332856 | ||
| Recombinant DNA reagent | SCEP-shGHRHR.544 | This paper, PMID: 24332856 | ||
| Recombinant DNA reagent | SCEP-shGHRHR.1571 | This paper, PMID: 24332856 | ||
| Recombinant DNA reagent | SCEP-shGHRHR.1583 | This paper, PMID: 24332856 | ||
| Recombinant DNA reagent | SCEP-sh-p300-1 | This paper, PMID: 24332856 | ||
| Recombinant DNA reagent | SCEP-sh-p300-2 | This paper, PMID: 24332856 | ||
| Recombinant DNA reagent | SCEP-shSRC1-1 | This paper, PMID: 24332856 | ||
| Recombinant DNA reagent | SCEP-shSRC2-1 | This paper, PMID: 24332856 | ||
| Recombinant DNA reagent | SCEP-shSRC2-2 | This paper, PMID: 24332856 | ||
| Recombinant DNA reagent | lentiCRISPRv2-SgNT | PMID: 24336569 | Addgene plasmid #52961 | |
| Recombinant DNA reagent | lentiCRISPRv2- SgGREB1-7 | This paper | Addgene plasmid #52961 | |
| Recombinant DNA reagent | lentiCRISPRv2- SgGREB1-8 | This paper | Addgene plasmid #52961 | |
| Recombinant DNA reagent | pCMV6-GREB1 | PMID: 23403292 | ||
| Recombinant DNA reagent | pLVX-TRE3G- HA-GREB1 | This paper | ||
| Sequence- based reagent | q-PCR primers | This paper | See Supplementary file 1 | |
| Sequence- based reagent | shRNAs | This paper | ||
| Sequence- based reagent | gRNAs | This paper | ||
| Commercial assay or kit | QIAshredder | Qiagen | 79656 | |
| Commercial assay or kit | RNeasy Mini Kit | Qiagen | 74106 | |
| Commercial assay or kit | High Capacity cDNA Reverse Transcription Kit | thermo fisher | 4368814 | |
| Commercial assay or kit | QuantiFast SYBR Green PCR Kit | Qiagen | 204057 | |
| Commercial assay or kit | BCA Protein Assay | ThermoFisher | 23225 | |
| Commercial assay or kit | Subcellular Protein Fractionation Kit | ThermoFisher | 78840 | |
| Commercial assay or kit | Peira TM900 system | Peira bvba | ||
| Commercial assay or kit | the KAPA Biosystems Hyper Library Prep Kit | Kapa Biosystems | KK8504 | |
| Chemical compound, drug | FBS | Omega Scientific | FB-11 | |
| Chemical compound, drug | Accumax | Innovative Cell Technologies | AM105 | |
| Chemical compound, drug | matrigel | Corning | 356237 | |
| Chemical compound, drug | Laemmli sample buffer | BioRad | 1610747 | |
| Chemical compound, drug | 4% formaldehyde | electron microscopy sciences | 15714 s | |
| Chemical compound, drug | normal goat serum | Vector Lab | S-1000, RRID:AB_2336615 | |
| Chemical compound, drug | normal horse serum | Vector Lab | S-2000, RRID:AB_2336617 | |
| Chemical compound, drug | 10% Triton X- 100 solution | Teknova | T1105 | |
| Chemical compound, drug | DAPI mounting solution | Vector Lab | H-1200, RRID:AB_2336790 | |
| Chemical compound, drug | charcoal-stripped dextran-treated fetal bovine serum | Omega Scientific | FB-04 | |
| Chemical compound, drug | Puromycin | Invivogen | ant-pr | |
| Chemical compound, drug | RPMI | Media Preparation Core at Sloan Kettering Institute | ||
| Chemical compound, drug | DMEM | Media Preparation Core at Sloan Kettering Institute | ||
| Software, algorithm | Partek Genomics Suite software | Partek Inc | RRID:SCR_011860 | |
| Software, algorithm | FlowJo software | FlowJo software | RRID:SCR_008520 | version 9.9.6 |
| Software, algorithm | GSEA | Broad Institute | RRID:SCR_003199 | http://www.broadinstitute.org/gsea/index.jsp |
| Software, algorithm | GraphPad Prism | GraphPad Prism | RRID:SCR_002798 | version 7 |
| Software, algorithm | STAR aligner | PMID: 23104886 | RRID:SCR_015899 | |
| Software, algorithm | Kalisto | PMID: 27043002 | ||
| Software, algorithm | RSeQC | PMID: 22743226 | RRID:SCR_005275 | http://broadinstitute.github.io/picard/ |
| Software, algorithm | DESeq2 package | http://www-huber.embl.de/users/anders/DESeq | RRID:SCR_015687 | |
| Software, algorithm | Picard | http://broadinstitute.github.io/picard/index.html | RRID:SCR_006525 | |
| Software, algorithm | MACS2 | PMID: 22936215 | ||
| Software, algorithm | ChAsE | PMID: 27378294 | ||
| Software, algorithm | MEME-ChIP | PMID: 21486936 | ||
| Software, algorithm | HOMER | http://homer.ucsd.edu/homer/ | RRID:SCR_010881 |
Additional files
-
Supplementary file 1
Primer list.
- https://doi.org/10.7554/eLife.41913.023
-
Supplementary file 2
The basal and luminal gene signatures used for GSEA.
- https://doi.org/10.7554/eLife.41913.024
-
Transparent reporting form
- https://doi.org/10.7554/eLife.41913.025
Download links
A two-part list of links to download the article, or parts of the article, in various formats.
Downloads (link to download the article as PDF)
Open citations (links to open the citations from this article in various online reference manager services)
Cite this article (links to download the citations from this article in formats compatible with various reference manager tools)
GREB1 amplifies androgen receptor output in human prostate cancer and contributes to antiandrogen resistance
eLife 8:e41913.
https://doi.org/10.7554/eLife.41913


