GREB1 amplifies androgen receptor output in human prostate cancer and contributes to antiandrogen resistance
- Memorial Sloan Kettering Cancer Center, United States
- Albert Einstein College of Medicine, United States
- Howard Hughes Medical Institute, United States
Abstract
Genomic amplification of the androgen receptor (AR) is an established mechanism of antiandrogen resistance in prostate cancer. Here, we show that the magnitude of AR signaling output, independent of AR genomic alteration or expression level, also contributes to antiandrogen resistance, through upregulation of the coactivator GREB1. We demonstrate 100-fold heterogeneity in AR output within human prostate cancer cell lines and show that cells with high AR output have reduced sensitivity to enzalutamide. Through transcriptomic and shRNA knockdown studies, together with analysis of clinical datasets, we identify GREB1 as a gene responsible for high AR output. We show that GREB1 is an AR target gene that amplifies AR output by enhancing AR DNA binding and promoting EP300 recruitment. GREB1 knockdown in high AR output cells restores enzalutamide sensitivity in vivo. Thus, GREB1 is a candidate driver of enzalutamide resistance through a novel feed forward mechanism.
https://doi.org/10.7554/eLife.41913.001eLife digest
The prostate is a roughly walnut-sized gland that makes up part of the reproductive system in men. The normal development of this gland depends on a protein known as the androgen receptor. This protein also plays an important role in driving the growth of prostate cancers, and doctors routinely treat such cancers with drugs that block the androgen receptor. While these treatments often shrink the tumors at first, the prostate cancer cells commonly become resistant to the existing “antiandrogen” drugs, highlighting the need to find new drugs for this cancer.
The main way that prostate cancers become resistant to antiandrogen drugs is by making more of the androgen receptor. As such, a better understanding of this protein’s activity may prove vital to discovering new treatments. Together with other proteins called co-factors, the androgen receptor binds to DNA and switches on a set of target genes that drive the growth of prostate cancers. The activity of these genes, referred to as “androgen receptor output”, varies between different patients with prostate cancer and even between different cells from a single patient’s tumor. This variation may occur even when the level of the androgen receptor is constant, which suggests that other factors affect the output of the androgen receptor.
Lee et al. set out to discover if cells with different androgen receptor outputs, but constant androgen receptor levels, respond differently to antiandrogen drugs. First, human prostate cancer cells were separated according to their androgen receptor output. Lee et al. then treated all the cells with an antiandrogen drug known as enzalutamide: tumors grown from cells with a high output became resistant to the drug faster than cells with low output. Next, a large-scale experiment revealed the differences in gene activity between cells with high and low outputs. On average, the cells with a high androgen receptor output had more of an androgen receptor co-factor called GREB1 than the cells with a low output. Biochemical experiments showed that the GREB1 protein interacts with the androgen receptor and amplifies the expression of the receptor’s target genes. When the levels of the GREB1 protein were experimentally decreased in prostate cancer cells with a high androgen receptor output, the cells became less resistant to the antiandrogen drug.
Future work will be needed to know if GREB1 levels are a good proxy for patients with high androgen receptor output. The current work predicts that those patients will respond less well to current antiandrogen drugs. A better understanding of how GREB1 and androgen receptor cooperate may also be useful for developing new drugs to treat prostate cancer.
https://doi.org/10.7554/eLife.41913.002Introduction
Androgen receptor (AR) targeted therapy is highly effective in advanced prostate cancer but is complicated by the emergence of drug resistance, called castration-resistant prostate cancer (CRPC) (Shen and Abate-Shen, 2010; Watson et al., 2015). The most common mechanism of CRPC is restored AR signaling, primarily through amplification of AR (Chen et al., 2004; Robinson et al., 2015). The importance of AR amplification as a clinically important drug resistance mechanism is underscored by recent data showing that AR amplification, detected in circulating tumor DNA or in circulating tumor cells (CTCs), is correlated with reduced clinical benefit from the next generation AR inhibitors abiraterone or enzalutamide (Annala et al., 2018; Podolak et al., 2017).
Genomic landscape studies of prostate cancer have revealed several molecular subtypes defined by distinct genomic drivers (Berger et al., 2011; Cancer Genome Atlas Research Network, 2015; Taylor et al., 2010). In addition to this genomic heterogeneity, primary prostate cancers also display heterogeneity in AR transcriptional output, measured by an AR activity score (Hieronymus et al., 2006). Notably, these differences in transcriptional output occur in the absence of genomic alterations in AR, which are generally found only in CRPC (Cancer Genome Atlas Research Network, 2015). One potential explanation for this heterogeneity in AR transcriptional output is through coactivators and other AR regulatory proteins such as FOXA1, SPOP, FOXP1 and TRIM24 (Cancer Genome Atlas Research Network, 2015; Geng et al., 2013; Groner et al., 2016; Pomerantz et al., 2015; Takayama et al., 2014).
Much of the work to date has focused on inter-tumoral heterogeneity. Here, we address the topic of intra-tumoral heterogeneity in AR transcriptional output, for which we find substantial evidence in prostate cancer cell lines and in primary prostate tumors. Using a sensitive reporter of AR transcriptional activity to isolate cells with low versus high AR output, we show that high AR output cells have an enhanced response to low doses of androgen and reduced sensitivity to enzalutamide, in the absence of changes in AR mRNA and protein expression. To understand the molecular basis for these differences, we performed transcriptome and shRNA knockdown studies and identified three genes (GREB1, KLF8 and GHRHR) upregulated in high AR output cells, all of which promote AR transcriptional activity through a feed-forward mechanism. Of these, we prioritized GREB1 for further characterization because GREB1 mRNA levels are increased in primary prostate tumors that have high AR activity. GREB1 amplifies AR transcriptional activity through a two-part mechanism: by promoting EP300 recruitment and by enhancing AR binding to chromatin. Importantly, GREB1 knockdown converted high AR output cells to a low AR output state and restored enzalutamide sensitivity in vivo. Collectively, these data implicate GREB1 as an AR signal amplifier that contributes to prostate cancer disease progression and antiandrogen resistance.
Results
Isolation of cells with low and high AR output but comparable AR expression
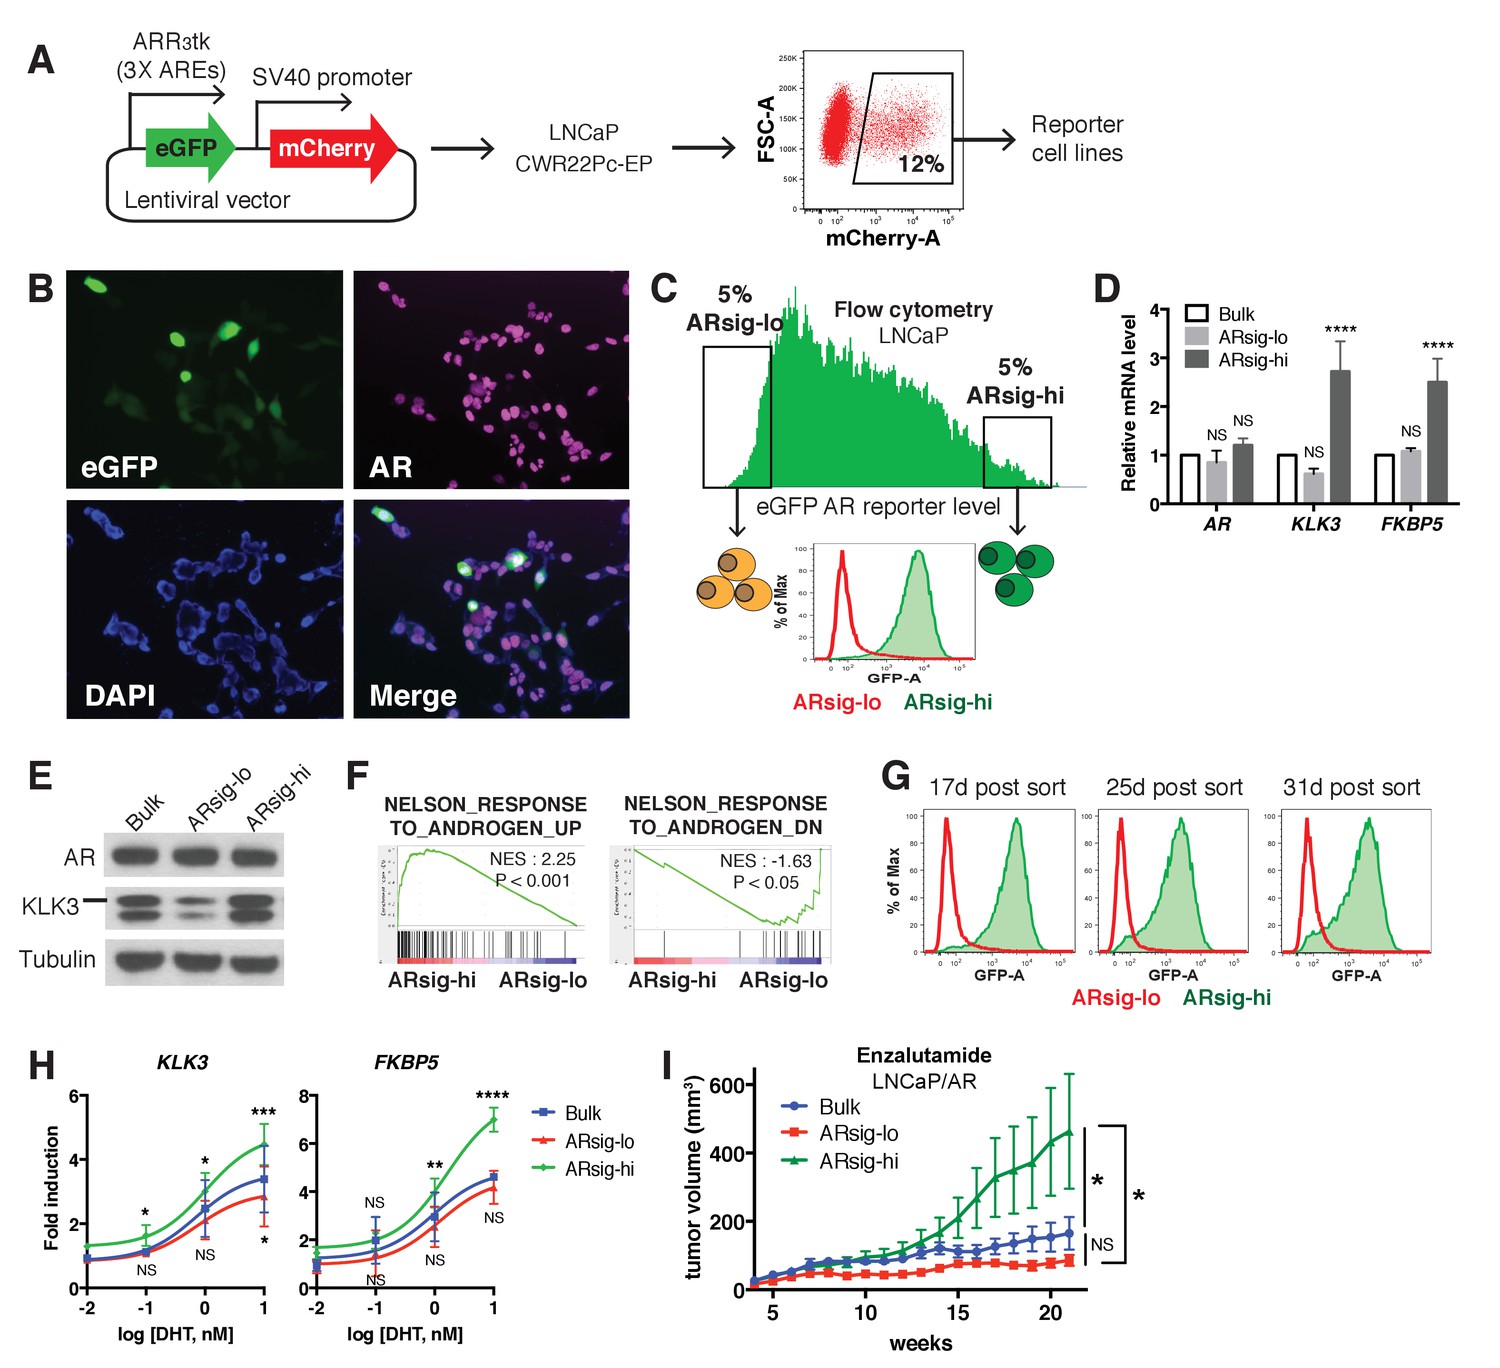
Previous work using a KLK3 promoter/GFP reporter (PSAP-eGFP) showed that LNCaP prostate cancer cells display varying levels of eGFP expression. Characterization of low GFP cells in this analysis revealed reduced AR levels and increased expression of stem cell and developmental gene sets (Qin et al., 2012). We explored this question in the context of the contemporary data on heterogeneity in AR transcriptional output using a different AR-responsive reporter, ARR3tk-eGFP, where eGFP expression is driven by the probasin promoter modified to contain three AR responsive elements (Snoek et al., 1998). LNCaP (Figure 1) and CWR22PC-EP (Figure 1—figure supplement 1) prostate cancer cells containing a single copy of the reporter construct were derived by infection with lentivirus containing the reporter at a low multiplicity of infection (MOI) (Figure 1A). Remarkably, we observed >100 fold range in eGFP expression, as measured by flow cytometry, despite similar levels of AR by immunofluorescence microscopy (Figure 1B,C, Figure 1—figure supplement 1A).
Figure 1 with 4 supplements see all
Characterization of prostate cancer cells with low vs. high AR output.
(A) The LNCaP and CWR22Pc-EP reporter cell lines were generated by lentiviral infection with the eGFP AR reporter construct (details can be found in Materials and methods). Cells with stable integration of the construct were positively sorted by mCherry expression using flow cytometry. (B) LNCaP cells infected with the AR reporter display variable expression levels of eGFP (green) and AR (magenta). Nuclei were labeled with DAPI (blue). (C) LNCaP cells with low (ARsig-lo) or high (ARsig-hi) AR activities were sorted using flow cytometry based on eGFP AR-reporter expression. (D–E) LNCaP ARsig-hi cells have higher AR output while having the same level of AR. The q-PCR data (D) is presented as mean fold change ±SD relative to the bulk population. NS = not significant, ****p<0.0001, one-way ANOVA compared to the bulk population. (F) Gene set enrichment analysis (GSEA) shows that the gene sets up- and down-regulated by androgen are enriched in LNCaP ARsig-hi and ARsig-lo cells, respectively. (G) LNCaP ARsig-lo and ARsig-hi cells maintain their AR activity levels over time. (H) LNCaP ARsig-hi cells showed enhanced upregulation of AR target genes in response to DHT treatment. The q-PCR data is presented as mean fold change ±SD relative to the DMSO control. NS = not significant, *p<0.05, **p<0.01, ***p<0.001, ****p<0.0001, one-way ANOVA compared to the bulk population. (I) LNCaP/AR xenografts derived from ARsig-hi cells become resistant to enzalutamide faster than other populations. The bulk, sorted ARsig-lo and ARsig-hi cells were injected into physically castrated mice and the mice were treated with enzalutamide immediately after injection. Data is presented as mean ±SEM (N = 10). NS = not significant, *p<0.05, one-way ANOVA.
-
Figure 1—source data 1
GSEA Results (ARsig-lo vs. ARsig-hi).
- https://doi.org/10.7554/eLife.41913.008
We then used flow cytometry to isolate eGFP-positive cells from both ends of the spectrum of AR transcriptional output, which we refer to as ARsig-hi (high AR output) and ARsig-lo (low AR output) cells, respectively (Figure 1C, Figure 1—figure supplement 1A). ARsig-hi cells also express higher levels of endogenous AR target genes (FKBP5, KLK3, TRPM8) (Figure 1D,E, Figure 1—figure supplement 1B,C), and have an overall increase in AR transcriptional activity based on RNA-sequencing analysis (Figure 1F). In addition, the ARsig-lo and ARsig-hi transcriptional phenotypes remain stable for over 30 days post-sorting (Figure 1G, Figure 1—figure supplement 1D). Interestingly, ARsig-lo cells showed upregulation of gene sets related to proliferation and cell cycle (Figure 1—source data 1). Of note, Qin et al. (2012) reported downregulation of these gene sets in their low/absent KLK3 cells, suggesting that the two reporters read out different transcriptional activities. Importantly, the difference in AR output between ARsig-lo and ARsig-hi cells is not explained by different levels of AR expression or nuclear translocation, since both were comparable in each subpopulation (Figure 1D,E, Figure 1—figure supplement 1B,C, Figure 1—figure supplement 2).
We next asked if isolated ARsig-lo and ARsig-hi populations have different responses to ligands such as dihydrotestosterone (DHT) or antagonists such as enzalutamide. ARsig-hi cells showed enhanced sensitivity to DHT in a dose-dependent manner (Figure 1H; Figure 1—figure supplement 1E). This result is similar to the effect of increased AR expression in conferring sensitivity to low doses of androgen (Chen et al., 2004), but now without a change in AR level. To address sensitivity to enzalutamide, we used LNCaP/AR xenografts (derived from LNCaP cells) because this model has a track record of revealing clinically relevant mechanisms of enzalutamide resistance (Arora et al., 2013; Balbas et al., 2013). As we did with LNCaP and CWR22PC-EP cells, we derived ARsig-lo and ARsig-hi subpopulations by flow cytometry and also observed differential AR output despite similar levels of AR expression (Figure 1—figure supplement 3A–C). Remarkably, ARsig-hi cells developed enzalutamide resistance significantly faster that ARsig-lo or parental cells when injected into castrated mice treated with enzalutamide (Figure 1I).
Having demonstrated heterogeneous AR output within prostate cancer cell lines, we asked if similar, intra-tumoral heterogeneity is observed clinically by immunohistochemical analysis of KLK3 and AR expression in several primary cancers. Consistent with previous reports (Qin et al., 2012; Ruizeveld de Winter et al., 1994), we observed heterogeneous KLK3 staining that is not strictly correlated with AR level. For example, we found variable intensity of KLK3 staining in tumor cells with comparable levels of AR staining (lined boxes; Figure 1—figure supplement 4) and, conversely, variable intensity of AR staining in tumor cells with similar KLK3 staining (dotted circles; Figure 1—figure supplement 4). Although this is a small dataset, the results indicate that the AR transcriptional heterogeneity we observe in prostate cancer cell lines is present in patient samples. Emerging technologies for conducting single cell RNA and protein analysis in clinical material will enable deeper investigation of this question.
GREB1 maintains high AR transcriptional output
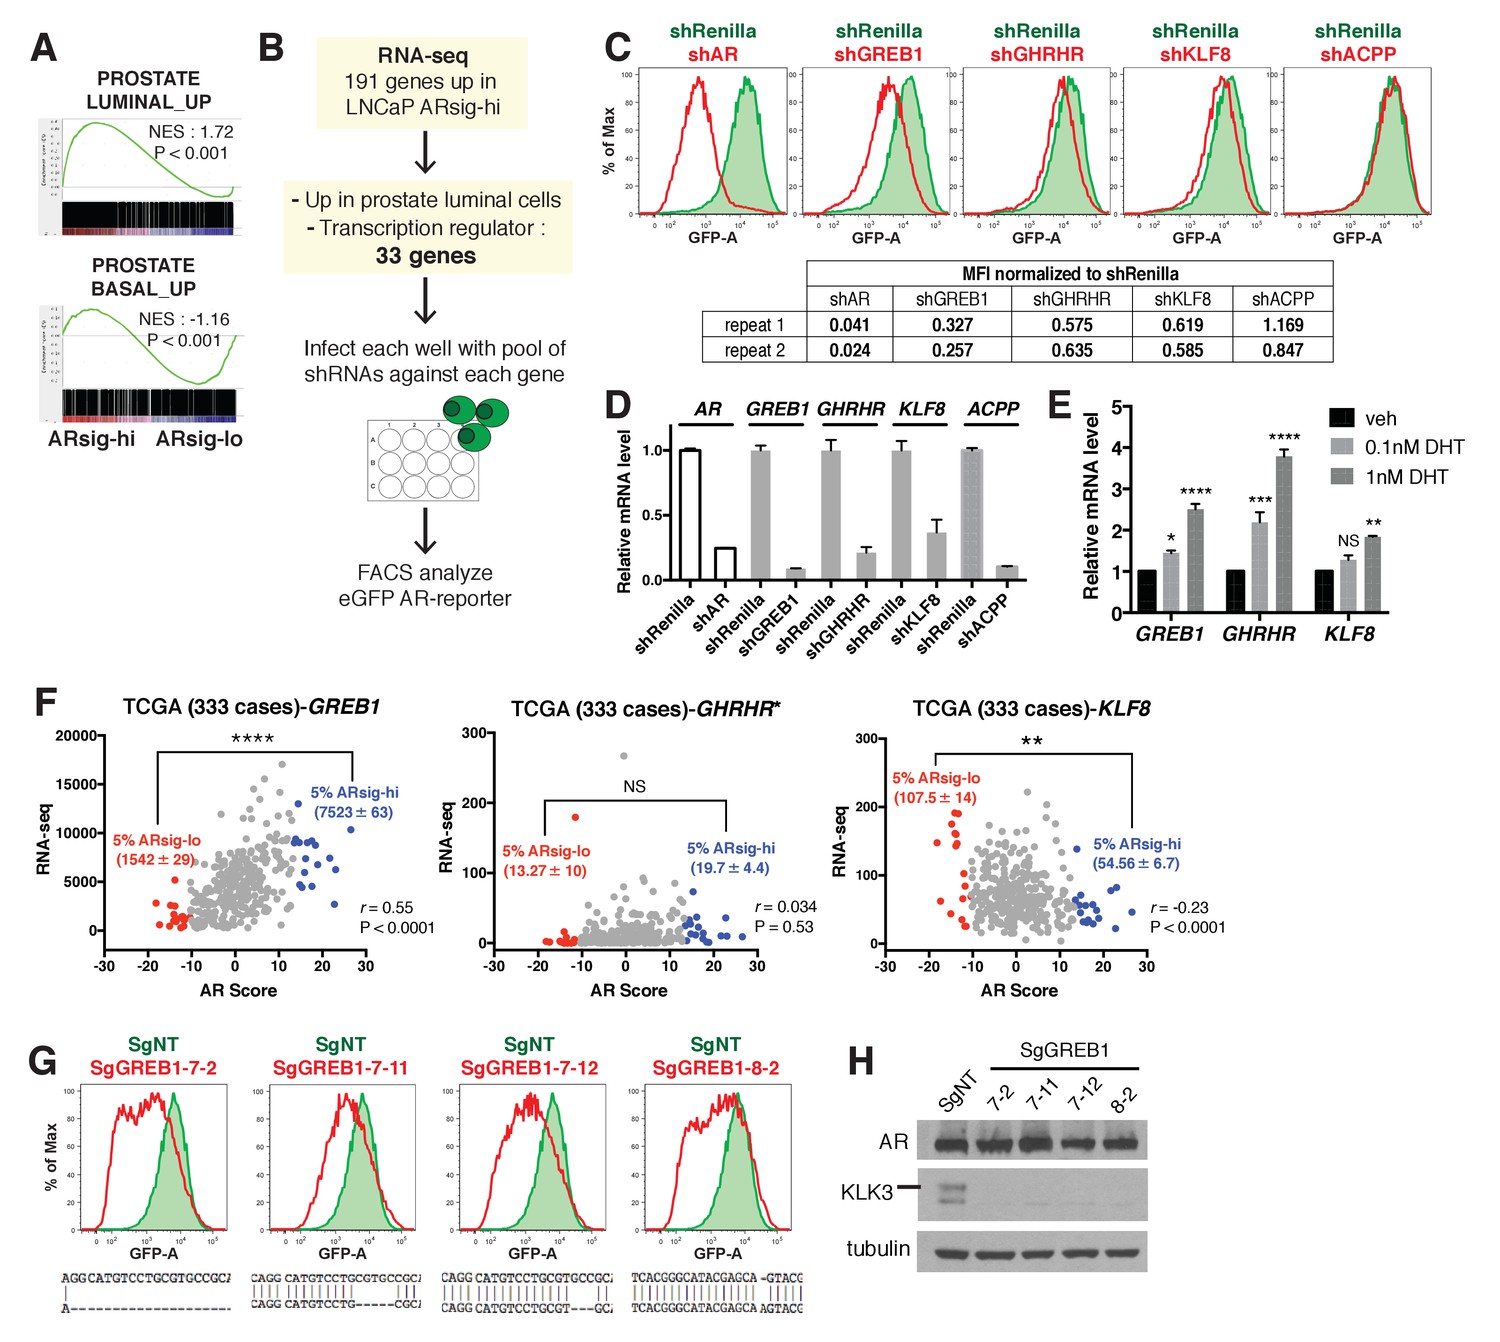
To elucidate the molecular basis underlying the differences in ARsig-lo and ARsig-hi cells, we performed RNA-sequencing and found 69 genes upregulated in ARsig-lo cells and 191 genes upregulated in ARsig-hi cells (fold change ≥1.5, p<0.05, Figure 2—source data 1). In addition to enrichment of gene sets regulated by androgen (Figure 1F), human prostate luminal and basal cell gene sets were enriched in ARsig-hi and ARsig-lo cells, respectively (Figure 2A). Based on these results, we postulated that high AR output could be a consequence of upregulation of transcriptional co-activators and/or of genes involved in luminal differentiation. We therefore filtered the list of 191 genes upregulated in ARsig-hi cells and identified 33 genes annotated as co-activators or luminal genes (Figure 2—source data 2), then measured the consequence of shRNA knockdown of each one on AR output in ARsig-hi cells (Figure 2B). Three of the 33 candidate genes (GREB1, GHRHR, KLF8) inhibited AR activity when knocked down in ARsig-hi cells, with successful knockdown confirmed by qRT-PCR (Figure 2C,D). AR knockdown served as a positive control, and ACPP (one of the 30 genes that did not score) served as a negative control. Interestingly, all three hits are transcriptional upregulated by DHT simulation (Figure 2E), which likely explains their increased expression in ARsig-hi cells.
Figure 2 with 1 supplement see all
Knockdown of the three AR regulated genes, GREB1, GHRHR and KLF8, inhibited AR activity in cells with high AR activity.
(A) Gene set enrichment analysis (GSEA) shows that genes upregulated in human prostate luminal and basal cells are enriched in LNCaP ARsig-hi and ARsig-lo cells, respectively. (B) The schematic of the knockdown study with 33 selected genes upregulated in LNCaP ARsig-hi cells. Details can be found in the Materials and methods. (C) The flow cytometry results show that the knockdown of GREB1, GHRHR and KLF8 inhibited AR reporter activity in LNCaP ARsig-hi cells. Top: The flow cytometry plot of one of the duplicate assays is shown. Bottom: The normalized median fluorescence intensity (MFI) of eGFP reporter in each assay is shown. AR shRNA was used as a positive control. ACPP shRNA is shown as a representative hairpin that had no effect on reporter activity. (D) The knockdown level of AR, GREB1, GHRHR, KLF8 and ACPP from the cells represented in (C). The q-PCR data is presented as mean fold change ±SD relative to the shRenilla control. (E) The transcription of GREB1, GHRHR and KLF8 is regulated by androgen in LNCaP. The data is presented as mean fold change ±SD relative to the DMSO control. NS = not significant, *p<0.05, **p<0.01, ***p<0.001, ****p<0.0001, one-way ANOVA compared to the DMSO control. (F) The correlation between RNA levels of GREB1, GHRHR and KLF8 and AR score in 333 TCGA primary prostate tumors were analyzed using Pearson’s correlation analysis (r). The RNA levels of the three genes were also compared between tumors with lowest (ARsig-lo, red points) and highest (ARsig-hi, blue points) AR score (5% of 333 cases: 17 cases each). NS = not significant, **p<0.01, ****p<0.0001, unpaired t-test. *One data point (GHRHR, x = −0.67, y = 1252.6072) is outside the y-axis limit. (G) The GREB1 function is inhibited by CRISPR/Cas9 in four LNCaP ARsig-hi sublines. (Top) AR reporter activity was inhibited in all four GREB1 CRISPR cell lines compared to control (SgNT). (Bottom) An example of the genomic alteration in the targeted sequence for each cell line is shown. (H) The CRISPR/Cas9-mediated inhibition of GREB1 suppressed KLK3 expression without affecting the AR level.
-
Figure 2—source data 1
Differentially expressed genes between ARsig-lo vs. ARsig-hi.
- https://doi.org/10.7554/eLife.41913.011
-
Figure 2—source data 2
Summary of Median eGFP Intensity of small-scale shRNA screen.
- https://doi.org/10.7554/eLife.41913.012
-
Figure 2—source data 3
AR scores and RNA levels of GREB1, GHRHR and KLF8 of 333 TCGA cases.
- https://doi.org/10.7554/eLife.41913.013
Among the three, GREB1 emerged as the most compelling candidate for further investigation based on interrogation of clinical datasets. Specifically, we found a statistically significant positive correlation (r) between GREB1 RNA level and AR output score (Cancer Genome Atlas Research Network, 2015; Hieronymus et al., 2006) across the primary prostate tumors from the TCGA dataset, but not GHRHR or KLF8 (Figure 2F). Consistent with this, increased expression of GREB1, but not GHRHR or KLF8, was observed in TCGA cases with high AR scores (top 5%) versus low AR scores (bottom 5%) (Figure 2F, Figure 2—source data 3). To be sure that GREB1 is relevant in other model systems, we confirmed GREB1 upregulation in CWR22PC-EP ARsig-hi cells (Figure 2—figure supplement 1A) and reduced AR output after GREB1 knockdown (Figure 2—figure supplement 1B). We further validated the knockdown data using CRISPR/Cas9, which also showed inhibition of AR output (by flow cytometry) and highly reduced KLK3 expression in LNCaP ARsig-hi sublines expressing different sgRNAs targeting GREB1, without detectable changes in AR protein level (Figure 2G,H).
GREB1 amplifies AR transcriptional activity by enhancing AR DNA binding
GREB1 was first reported as an estrogen-regulated gene in breast cancer (Rae et al., 2005) then shown to bind directly to ER, presumably through its LxxLL motif, and function as an ER coactivator by promoting interaction with cofactors (Mohammed et al., 2013). To determine if GREB1 also functions as an AR coactivator, we introduced exogenous GREB1 (HA-GREB1) into ARsig-lo LNCaP and CWR22PC-EP cells and derived stably expressing sublines (Figure 3A, Figure 3—figure supplement 1A). GREB1 overexpression enhanced DHT-induced AR target gene expression in a dose-dependent manner (Figure 3B,C, Figure 3—figure supplement 1B), indicating that GREB1 also promotes AR activity.
Figure 3 with 3 supplements see all

GREB1 amplifies AR transcriptional activity by enhancing AR binding to chromatin.
(A) GREB1 overexpression in LNCaP ARsig-lo cells with stable integration of a GREB1 lentiviral vector containing an amino-terminal HA-tag. (B) LNCaP ARsig-lo cells with GREB1 overexpression show higher induction of AR target genes in response to DHT treatment. The q-PCR data is presented as mean fold change ±SD relative to the DMSO control. NS = not significant, *p<0.05, **p<0.01, ***p<0.001, ****p<0.0001, unpaired t-test compared to the control cells. (C) GREB1 overexpression in LNCaP ARsig-lo cells increases protein levels of AR target genes without affecting AR level. (D) Co-immunoprecipitation using nuclear extracts shows an interaction between AR and GREB1 (HA) in LNCaP ARsig-lo cells. (E) ChIP against the HA-tag shows GREB1 binding on the KLK3 and FKBP5 enhancer regions in LNCaP ARsig-lo cells. *p<0.05, unpaired t-test. (F–G) LNCaP ARsig-hi cells have increased EP300 binding on the KLK3 and FKBP5 enhancer regions in a GREB1 dependent manner. *p<0.05, **p<0.01, unpaired t-test. (H) GREB1 knockdown or CRISPR decreases AR binding to KLK3 enhancer in LNCaP ARsig-hi cells. *p<0.05, **p<0.01, ***p<0.001, unpaired t-test (shRenilla vs. shGREB1), one-way ANOVA (SgNT vs. SgGREB1). The ChIP q-PCR data (E–H) is presented as mean percentage input ±SD. (I) Overlap of AR ChIP-sequencing peaks shows that AR peaks are disrupted by GREB1 knockdown in LNCaP ARsig-hi cells. (J) ChIP-sequencing summary plot shows that AR enrichment across the AR-binding sites is reduced by GREB1 knockdown. (K) Example of AR genomic peaks at NKX3-1.
In breast cancer, GREB1 functions as a coactivator through binding to ER and recruitment of the EP300/CBP complex to ER target genes (Mohammed et al., 2013). We find that GREB1 functions similarly in prostate cells, as shown by co-immunoprecipitation documenting AR-GREB1 interaction (Figure 3D) and ChIP experiments showing recruitment of GREB1 to KLK3 and FKBP5 enhancer regions (Figure 3E). Furthermore, ARsig-hi cells showed a GREB1-dependent increase in EP300 binding (Figure 3F,G) and GREB1 overexpression increased EP300 recruitment to AR target genes in ARsig-lo cells (Figure 3—figure supplement 2A). Knockdown of EP300 suppressed the effect of GREB1 overexpression on DHT-induced AR target gene upregulation in ARsig-lo cells (Figure 3—figure supplement 2B, refer also to Figure 3B), suggesting that EP300 is required for the function of GREB1 as an AR co-factor.
In addition to this canonical coactivator function of promoting assembly of an active transcription complex, we found that GREB1 also impacts AR DNA binding. For example, knockdown or CRISPR deletion of GREB1 in ARsig-hi cells significantly reduced binding of AR to the KLK3 enhancer and, conversely, GREB1 overexpression promoted AR recruitment in ARsig-lo cells (Figure 3H, Figure 3—figure supplement 2C). AR ChIP-sequencing revealed that this effect is genome-wide, with a significant reduction in the mean height of AR peaks in GREB1-depleted cells (Figure 3I–K). Importantly, the location of AR peaks (enhancer, promoter) was identical in intact versus GREB1 knockdown cells and there were no differences in consensus binding sites (Figure 3—figure supplement 2D,E). Therefore, GREB1 enhances AR DNA efficiency but not alter DNA-binding site specificity. As seen previously in our analysis of ARsig-hi cells, total and nuclear AR levels were not changed by GREB1 knockdown or overexpression (Figure 3C, Figure 3—figure supplement 2F,G).
Of note, earlier studies of GREB1 in breast cancer did not report any effect on ER DNA binding (Mohammed et al., 2013), which we confirmed by GREB1 knockdown in MCF7 breast cancer cells (Figure 3—figure supplement 3A,B). Thus, GREB1 functions as a coactivator of both ER and AR but through somewhat different mechanisms. To address the possibility that other hormone receptor coactivators might also function differently in prostate cells, we asked if NCOA1 and NCOA2, previously shown to recruit the EP300/CBP complex to AR (Leo and Chen, 2000), also influence AR DNA binding. To do so, we knocked down both genes in ARsig-hi cells based on prior work showing redundancy between NCOA1 and NCOA2 (Leo and Chen, 2000; Wang et al., 2005). AR reporter activity and target gene expression was inhibited in NCOA1/2-depleted cells, as expected, but AR occupancy of AR binding sites was unchanged (Figure 3—figure supplement 3C–E). Thus, in addition to a role in EP300/CBP recruitment, GREB1 has unique effects on AR DNA binding that distinguish it from other coactivators.
GREB1 is required for enzalutamide resistance of high AR output cells
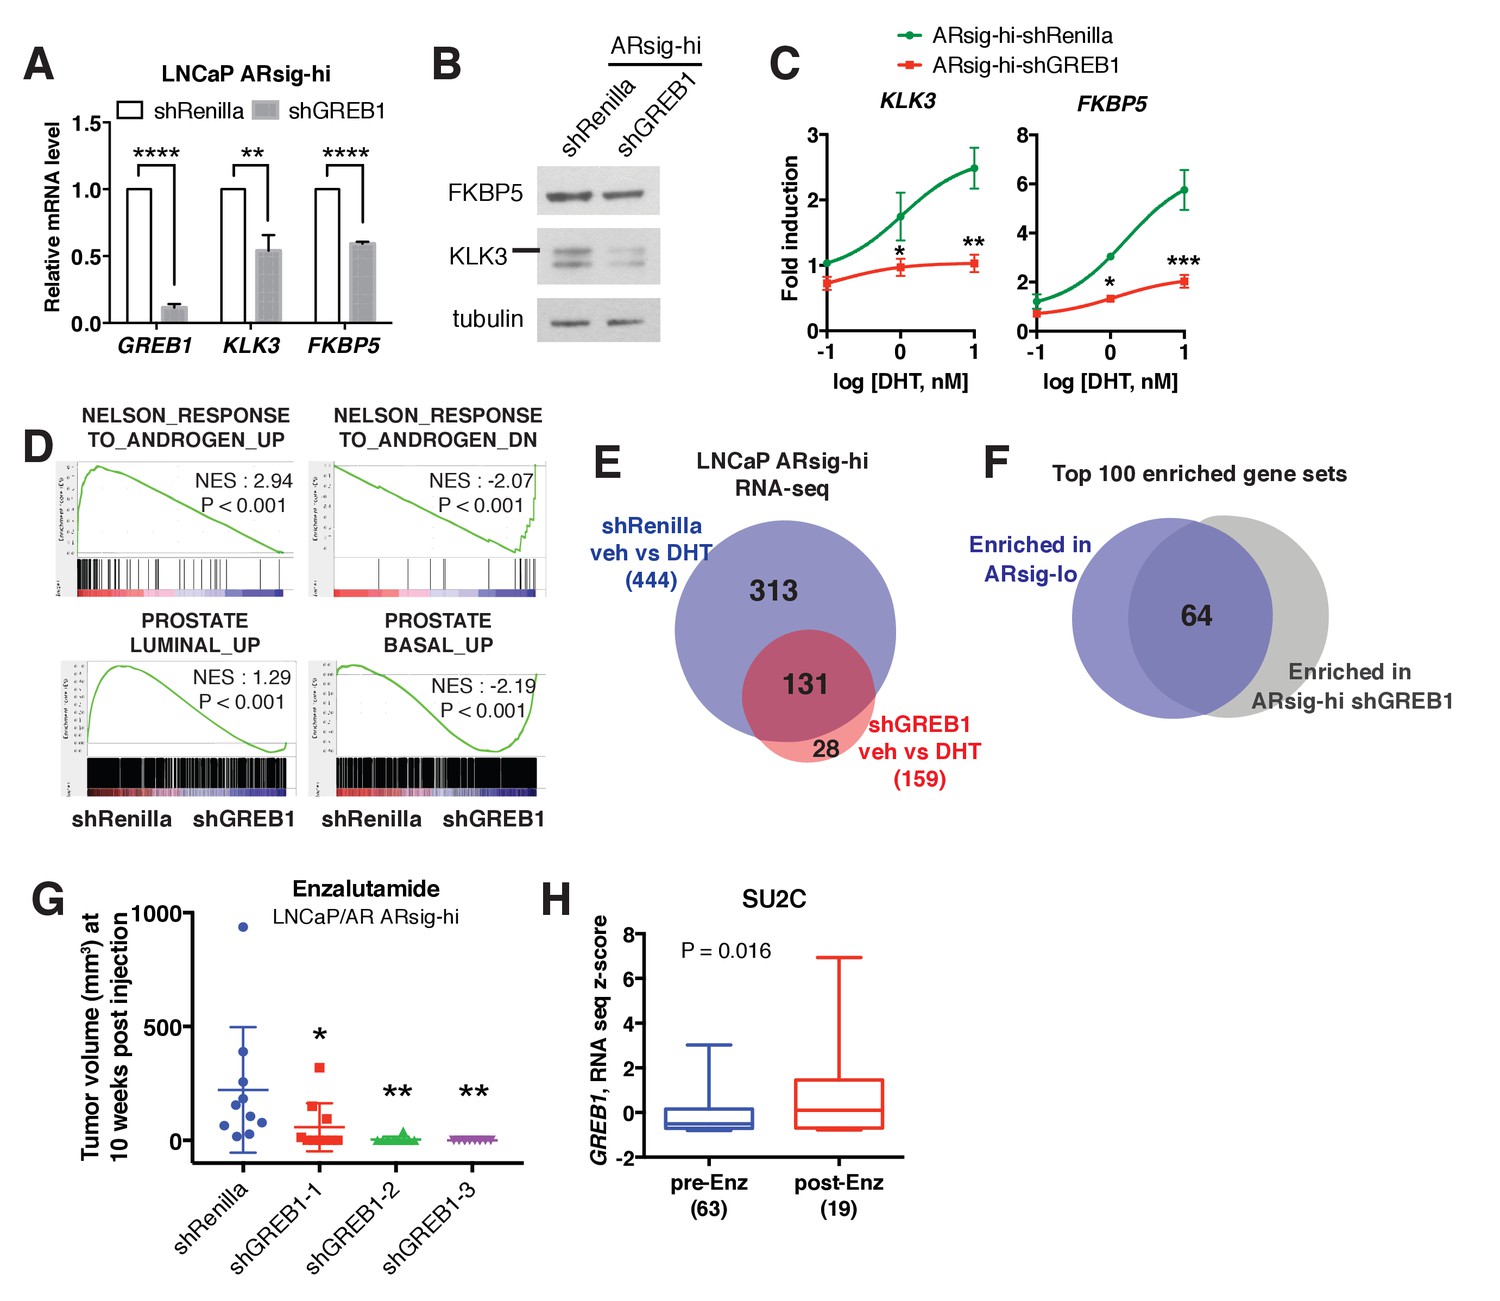
Having demonstrated that GREB1 is overexpressed in ARsig-hi cells and functions as an AR coactivator, we asked if GREB1 is required for maintenance of the ARsig-hi state. First we evaluated the consequences of GREB1 knockdown on transcription. Consistent with experiments in ARsig-lo cells showing that GREB1 overexpression enhanced AR transcriptional activity (Figure 3B,C, Figure 3—figure supplement 1B), GREB1 knockdown inhibited baseline and DHT-induced AR target gene expression in ARsig-hi cells (Figure 4A–C, Figure 4—figure supplement 1A,B). RNA-sequencing confirmed enrichment of androgen down-regulated gene sets in GREB1-depleted cells (Figure 4D) as well as downregulation of the 20 AR target genes used to calculate the AR activity score in TCGA tumors (Figure 4—figure supplement 1C). GREB1 knockdown cells also showed enrichment of the same prostate basal gene set that was enriched in ARsig-lo cells (Figure 4D, refer also to Figure 2A). Additional analysis of RNA-seq data suggests that GREB1 is a major molecular determinant of the ARsig-hi state: specifically, (i) GREB1 knockdown impaired the induction of >70% of all DHT-induced genes (Figure 4E, Figure 4—source datas 1 and 2) and (ii) the top 100 gene sets enriched in GREB1-depleted ARsig-hi cells and ARsig-lo cells show significant overlap (Figure 4F, Figure 4—source data 3).
Figure 4 with 1 supplement see all
GREB1 is the major molecular determinant of ARsig-hi cells.
(A–B) Knockdown of GREB1 inhibited AR target gene expression in LNCaP ARsig-hi cells. The q-PCR data (A) is presented as mean fold change ±SD relative to the shRenilla control. **p<0.01, ****p<0.0001, unpaired t-test. (C) Knockdown of GREB1 suppressed the enhanced AR transcriptional activity in LNCaP ARsig-hi cells. The q-PCR data is presented as mean fold change ±SD relative to the DMSO control. *p<0.05, **p<0.01, ***p<0.001, unpaired t-test compared to the shRenilla control. (D) Gene set enrichment analysis (GSEA) shows that the gene sets up- and down-regulated by androgen are enriched in LNCaP ARsig-hi control and GREB1 knockdown cells, respectively and genes upregulated in human prostate luminal and basal cells are enriched in ARsig-hi control and GREB1 depleted cells, respectively. (E) Venn diagram showing that 70.5% of DHT-induced genes in control LNCaP ARsig-hi cells were inhibited by GREB1 knockdown. (F) Venn diagram showing that 64% of the top 100 gene sets enriched in LNCaP ARsig-lo overlap with the top 100 gene sets enriched in GREB1 depleted ARsig-hi cells. (G) Knockdown of GREB1 inhibited development of enzlutamide-resistant LNCaP/AR xenografts derived from ARsig-hi cells. The sorted LNCaP/AR ARsig-hi cells were infected with control or three different shRNAs targeting GREB1 and injected into physically castrated mice. Mice were treated with enzalutamide immediately after injection. Data is presented as mean ±SEM (N = 10). *p<0.05, **p<0.01, one-way ANOVA compared to the shRenilla control. (H) The SU2C cases that have received enzalutamide (Enz) have increased level of GREB1 (unpaired t-test).
-
Figure 4—source data 1
Upregulated genes in ARsig-hi shRenilla DHT vs. veh.
- https://doi.org/10.7554/eLife.41913.020
-
Figure 4—source data 2
Upregulated genes in ARsig-hi shGREB1 DHT vs. veh.
- https://doi.org/10.7554/eLife.41913.021
-
Figure 4—source data 3
GSEA Results (ARsig-hi shRenilla DHT vs. shGREB1 DHT).
- https://doi.org/10.7554/eLife.41913.022
Earlier we showed that ARsig-hi cells rapidly acquire resistance to enzalutamide (refer to Figure 1I). To determine the role of GREB1 in this drug resistant phenotype, we performed knockdown experiments using the LNCaP/AR xenograft. After confirming that AR activity was inhibited in ARsig-hi cells (Figure 4—figure supplement 1D,E), we injected LNCaP/AR ARsig-hi xenografts with GREB1 shRNAs into castrated mice treated with enzalutamide and found a significant delay in the development of enzalutamide resistance after 10 weeks (Figure 4G). Clinical data from CRPC patients also supports for a role of GREB1 in enzalutamide resistance. Although the samples are not matched pre- and post-treatment, we observed an overall increase in GREB1 expression in those who progressed on enzalutamide treatment (Figure 4H). When we analyzed tumor purity content and stromal signature score as described previously (Carter et al., 2012; Shah et al., 2017; Yoshihara et al., 2013), no significant difference was observed between samples collected pre- vs. post-treatment (Figure 4—figure supplement 1F).
Discussion
There is abundant evidence from tumor sequencing studies that genomic alterations in AR (amplification and/or mutation) are present in over 50% of CRPC patients (Cancer Genome Atlas Research Network, 2015; Robinson et al., 2015) and that AR amplification is associated with a less favorable clinical response to abiraterone or enzalutamide treatment (Annala et al., 2018). Therefore, high levels of AR transcriptional output can promote castration-resistant disease progression. Here we show that prostate cancers can amplify AR output through increased expression of the dual AR/ER coactivator GREB1, in the absence of genomic AR alterations. As with genomic AR amplification, increased AR output driven by high GREB1 expression is also associated with enzalutamide resistance.
In addition to demonstrating the importance of transcriptional heterogeneity in drug resistance, we also show that GREB1 amplifies AR activity by a novel two-part mechanism. Similar to canonical coactivators such as NCOA1/2, GREB1 binds AR and promotes the assembly of an active transcription complex by recruitment of histone acetyl transferases such as EP300/CBP (Lee and Lee Kraus, 2001). However, GREB1 has the additional property of improving the efficiency of AR binding to DNA, which further enhances AR transcriptional output. Although conceptually distinct from canonical coactivators, this dual mechanism of AR activation is may not be unique to GREB1. For example, TRIM24 has been shown to function as an oncogenic AR cofactor and, similar to GREB1, knockdown of TRIM24 impairs recruitment of AR to target genes (Groner et al., 2016). Curiously, the effect of GREB1 on AR DNA binding is not seen with ER, suggesting different conformational consequences of GREB1 binding on AR and ER, respectively, then influence DNA binding.
One curious observation is the fact that prostate cancers can maintain transcriptional heterogeneity as a stable phenotype, despite the fact that GREB1 expression drives a feed forward loop which, in principle, should result in an increased fraction of high AR output cells over time. One potential explanation for the ability of these populations to maintain stable proportions of high versus low AR output cells at steady state is the fact that androgen has growth inhibitory effects at higher concentrations (Culig et al., 1999). Because GREB1 amplifies the magnitude of AR output in response to normal (growth stimulatory) androgen concentrations, the biologic consequence of high GREB1 levels could be the same growth suppression seen with high androgen concentrations. This model predicts that high AR output cells would gain a fitness advantage under conditions of androgen deprivation or pharmacologic AR inhibition, as demonstrated by the enzalutamide resistance observed in xenograft models.
Further work is required to understand the clinical implications of our work, particularly whether GREB1 levels in CRPC patients are predictive of response to next generation AR therapy. While we show that GREB1 levels are elevated in the tumors of CRPC patients who have progressed on enzalutamide, it will be important to address this question prospectively, prior to next generation AR therapy. It is also important to note that the positive correlation of GREB1 levels with high AR activity is largely based on the hormone-naïve TCGA cohort. It is also possible that the LNCaP cell line used for functional studies has an AR point mutation could potentially influence response to GREB1 expression, but we obtained similar results in 22PC cells that lack this mutation (Veldscholte et al., 1992). In terms of therapeutic implications, GREB1 knockdown experiments provide genetic evidence that GREB1 is required for in vivo enzalutamide resistance in xenograft models. Although pharmacologic strategies to inhibit GREB1 function are not currently available, a small molecule inhibitor that blocks protein-protein interactions between the AR N-terminal domain and CBP/EP300 is currently in clinical development (Andersen et al., 2010) (NCT02606123). This work provides precedent that similar strategies to disrupt GREB1/AR interaction may be possible.
Materials and methods
Key resources table
| Reagent type (species) or resource | Designation | Source or reference | Identifiers | Additional information |
|---|---|---|---|---|
| Cell line (H. sapiens) | LNCaP | ATCC | CRL-1740, RRID:CVCL_1379 | |
| Cell line (H. sapiens) | LNCaP/AR | PMID: 14702632 | ||
| Cell line (H. sapiens) | CWR22Pc-EP | PMID: 28059768 | ||
| Antibody | AR | abcam | ab108341, RRID:AB_10865716 | WB (1:1000), IP (5 ug/IP) |
| Antibody | AR | Santa Cruz | sc-816, RRID:AB_1563391 | IF (1:500), ChIP (5 ug/IP) |
| Antibody | AR | Agilent | 441 | IHC |
| Antibody | KLK3 | Cell Signaling Technology | 5365 | WB (1:500) |
| Antibody | KLK3 | Biogenex | IHC | |
| Antibody | FKBP5 | Cell Signaling Technology | 8245, RRID:AB_10831198 | WB (1:500) |
| Antibody | TRPM8 | Epitomics | 3466–1, RRID:AB_10715643 | WB (1:1000) |
| Antibody | tubulin | Santa Cruz | sc-9104, RRID:AB_2241191 | WB (1:1000) |
| Antibody | Cyclophilin B | abcam | ab178397 | WB (1:100,000) |
| Antibody | BRD4 | Cell Signaling Technology | 13440, RRID:AB_2687578 | WB (1:1000) |
| Antibody | TOP2B | abcam | ab58442, RRID:AB_883147 | WB (1:1000) |
| Antibody | HA | Cell Signaling | 3724, RRID:AB_1549585 | WB (1:1000) |
| Antibody | HA | Abcam | ab9110, RRID:AB_307019 | ChIP (5 ug/IP) |
| Antibody | Alexa Fluor 647 | Invitrogen/ Thermo Fisher | A-31573, RRID:AB_2536183 | IF (1:1000) |
| Antibody | p300 | Santa Cruz | sc-585, RRID:AB_2231120 | ChIP (5 ug/IP) |
| Antibody | ER | Santa Cruz | sc-8002, RRID:AB_627558 | ChIP (5 ug/IP) |
| Antibody | normal rabbit IgG | Millipore Sigma | 12–370, RRID:AB_145841 | ChIP (5 ug/IP) |
| Antibody | Protein A/G agarose beads | Santa Cruz | sc-2003, RRID:AB_10201400 | |
| Recombinant DNA reagent | ARR3tk-eGFP/ SV40-mCherry | This paper | Addgene plasmid #24304 | |
| Recombinant DNA reagent | SCEP-shRenilla | This paper, PMID: 24332856 | ||
| Recombinant DNA reagent | SCEP-shAR.177 | This paper, PMID: 24332856 | ||
| Recombinant DNA reagent | SCEP-shGREB1-1 | This paper, PMID: 24332856 | ||
| Recombinant DNA reagent | SCEP-shGREB1-2 | This paper, PMID: 24332856 | ||
| Recombinant DNA reagent | SCEP-shGREB1-3 | This paper, PMID: 24332856 | ||
| Recombinant DNA reagent | SCEP-shKLF8.3467 | This paper, PMID: 24332856 | ||
| Recombinant DNA reagent | SCEP-shKLF8.2180 | This paper, PMID: 24332856 | ||
| Recombinant DNA reagent | SCEP-shKLF8.2684 | This paper, PMID: 24332856 | ||
| Recombinant DNA reagent | SCEP-shGHRHR.544 | This paper, PMID: 24332856 | ||
| Recombinant DNA reagent | SCEP-shGHRHR.1571 | This paper, PMID: 24332856 | ||
| Recombinant DNA reagent | SCEP-shGHRHR.1583 | This paper, PMID: 24332856 | ||
| Recombinant DNA reagent | SCEP-sh-p300-1 | This paper, PMID: 24332856 | ||
| Recombinant DNA reagent | SCEP-sh-p300-2 | This paper, PMID: 24332856 | ||
| Recombinant DNA reagent | SCEP-shSRC1-1 | This paper, PMID: 24332856 | ||
| Recombinant DNA reagent | SCEP-shSRC2-1 | This paper, PMID: 24332856 | ||
| Recombinant DNA reagent | SCEP-shSRC2-2 | This paper, PMID: 24332856 | ||
| Recombinant DNA reagent | lentiCRISPRv2-SgNT | PMID: 24336569 | Addgene plasmid #52961 | |
| Recombinant DNA reagent | lentiCRISPRv2- SgGREB1-7 | This paper | Addgene plasmid #52961 | |
| Recombinant DNA reagent | lentiCRISPRv2- SgGREB1-8 | This paper | Addgene plasmid #52961 | |
| Recombinant DNA reagent | pCMV6-GREB1 | PMID: 23403292 | ||
| Recombinant DNA reagent | pLVX-TRE3G- HA-GREB1 | This paper | ||
| Sequence- based reagent | q-PCR primers | This paper | See Supplementary file 1 | |
| Sequence- based reagent | shRNAs | This paper | ||
| Sequence- based reagent | gRNAs | This paper | ||
| Commercial assay or kit | QIAshredder | Qiagen | 79656 | |
| Commercial assay or kit | RNeasy Mini Kit | Qiagen | 74106 | |
| Commercial assay or kit | High Capacity cDNA Reverse Transcription Kit | thermo fisher | 4368814 | |
| Commercial assay or kit | QuantiFast SYBR Green PCR Kit | Qiagen | 204057 | |
| Commercial assay or kit | BCA Protein Assay | ThermoFisher | 23225 | |
| Commercial assay or kit | Subcellular Protein Fractionation Kit | ThermoFisher | 78840 | |
| Commercial assay or kit | Peira TM900 system | Peira bvba | ||
| Commercial assay or kit | the KAPA Biosystems Hyper Library Prep Kit | Kapa Biosystems | KK8504 | |
| Chemical compound, drug | FBS | Omega Scientific | FB-11 | |
| Chemical compound, drug | Accumax | Innovative Cell Technologies | AM105 | |
| Chemical compound, drug | matrigel | Corning | 356237 | |
| Chemical compound, drug | Laemmli sample buffer | BioRad | 1610747 | |
| Chemical compound, drug | 4% formaldehyde | electron microscopy sciences | 15714 s | |
| Chemical compound, drug | normal goat serum | Vector Lab | S-1000, RRID:AB_2336615 | |
| Chemical compound, drug | normal horse serum | Vector Lab | S-2000, RRID:AB_2336617 | |
| Chemical compound, drug | 10% Triton X- 100 solution | Teknova | T1105 | |
| Chemical compound, drug | DAPI mounting solution | Vector Lab | H-1200, RRID:AB_2336790 | |
| Chemical compound, drug | charcoal-stripped dextran-treated fetal bovine serum | Omega Scientific | FB-04 | |
| Chemical compound, drug | Puromycin | Invivogen | ant-pr | |
| Chemical compound, drug | RPMI | Media Preparation Core at Sloan Kettering Institute | ||
| Chemical compound, drug | DMEM | Media Preparation Core at Sloan Kettering Institute | ||
| Software, algorithm | Partek Genomics Suite software | Partek Inc | RRID:SCR_011860 | |
| Software, algorithm | FlowJo software | FlowJo software | RRID:SCR_008520 | version 9.9.6 |
| Software, algorithm | GSEA | Broad Institute | RRID:SCR_003199 | http://www.broadinstitute.org/gsea/index.jsp |
| Software, algorithm | GraphPad Prism | GraphPad Prism | RRID:SCR_002798 | version 7 |
| Software, algorithm | STAR aligner | PMID: 23104886 | RRID:SCR_015899 | |
| Software, algorithm | Kalisto | PMID: 27043002 | ||
| Software, algorithm | RSeQC | PMID: 22743226 | RRID:SCR_005275 | http://broadinstitute.github.io/picard/ |
| Software, algorithm | DESeq2 package | http://www-huber.embl.de/users/anders/DESeq | RRID:SCR_015687 | |
| Software, algorithm | Picard | http://broadinstitute.github.io/picard/index.html | RRID:SCR_006525 | |
| Software, algorithm | MACS2 | PMID: 22936215 | ||
| Software, algorithm | ChAsE | PMID: 27378294 | ||
| Software, algorithm | MEME-ChIP | PMID: 21486936 | ||
| Software, algorithm | HOMER | http://homer.ucsd.edu/homer/ | RRID:SCR_010881 |
Cell lines
Request a detailed protocolLNCaP and MCF7 cell lines were obtained from American Type Culture Collection (ATCC, Manassas, VA) and maintained in RPMI (LNCaP) or DMEM (MCF7) +10% FBS (Omega Scientific, Tarzana, CA). LNCaP/AR cell line was generated and maintained as previously described (Chen et al., 2004). CWR22Pc was a gift from Marja T. Nevalainen (Thomas Jefferson University, Philadelphia, PA) and CWR22Pc-EP was generated and maintained as previously described (Mu et al., 2017). Cell lines were authenticated by exome sequencing methods, and were negative for mycoplasma contamination testing.
Flow cytometry analysis and FACS-sorting
Request a detailed protocolRapidly cycling eGFP AR reporter cells were collected using Accumax dissociation solution (Innovative Cell Technologies, San Diego, CA), and dead cells were counterstained with DAPI (Invitrogen, Grand Island, NY). For FACS-sorting of ARsig-lo and ARsig-hi cells, 5% of the entire population with lowest and highest eGFP expression was sorted out using BD FACSAria cell sorter. The 5% cutoff was used because it generates at least a 100-fold difference in median AR-GFP reporter signal between ARsig-lo and ARsig-hi cells and also allows us to have sufficient numbers of sorted cells to conduct various assays. For flow cytometric analysis of reporter activity, eGFP expression was measured using the BD-LDRII flow cytometer and analysis was done using FlowJo software.
Plasmid construction and cell transduction
Request a detailed protocolThe lentiviral eGFP AR reporter (ARR3tk-eGFP/SV40-mCherry) was generated by switching 7xTcf promoter of 7xTcf-eGFP/SV40-mCherry (Addgene, Cambridge, MA, 24304) with probasin promoter containing 3xARE (ARR3tk) (Snoek et al., 1998). For shRNA knockdown experiments, SCEP vector was generated by substituting GFP cassette of SGEP (pRRL-GFP-miRE- PGK-PuroR, gift from Johannes Zuber) (Fellmann et al., 2013) with mCherry cassette. The following guide sequences were used for knockdown:
shAR.177: TAGTGCAATCATTTCTGCTGGC
shGREB1-1: TTGTCAGGAACAGACACTGGTT
shGREB1-2: TTTCAGATTTATATGATTGGAG
shGREB1-3: TTGACAAGATACCTAAAGCCGA
shKLF8.3467: TTGAGTTCTAAAGTTTTCCTGA
shKLF8.2180: TATTTGTCCAAATTTAACCTAA
shKLF8.2684: TTATAAAACAATCTGATTGGGC
shGHRHR.544: TAAAAGTGGTGAACAGCTGGGT
shGHRHR.1571: TTTATTGGCTCCTCTGAGCCTT
shGHRHR.1583: TTCATTTACAGGTTTATTGGCT
shEP300-1: TCCAGAAAGAACTAGAAGAAAA
shEP300-2: TTAATCTATCTTCAGTAGCTTG
shNCOA1-1: TTCTTCTTGGAACTTGTCGTTT
shNCOA2-1: TTGCTGAACTTGCTGTTGCTGA
shNCOA2-2: TTAACTTTGCTCTTCTCCTTGC
shRenilla was previously described as Ren.713 targeting Renilla luciferase (Fellmann et al., 2013). Pools of 3 shRNAs were used to knockdown GREB1, KLF8 and GHRHR in a small-scale shRNA screen, and shGREB1-1 was used for further studies. For CRISPR/Cas9 experiments, lentiCRISPRv2 vector gifted by F. Zhang (Addgene, 52961) was used with the following guide sequences designed using http://crispr.mit.edu/ website:
SgGREB1-7: AGGCATGTCCTGCGTGCCGC
SgGREB1-8: TCACGGGCATACGAGCAGTA sgNT was previously described (Wang et al., 2014). pCMV6-GREB1 plasmid was a gift from J. Carroll (Cancer Research UK Cambridge Institute, Cambridge, UK). The lentiviral GREB1 cDNA plasmid was constructed by cloning GREB1 cDNA from pCMV6-GREB1 into Tet-inducible pLV-based lentiviral expression vector with HA-tag.
Lentiviral transduction of cells was performed as described previously (Mu et al., 2017). To make AR reporter cell line, cells were infected with ARR3tk-eGFP/SV40-mCherry at low multiplicity of infection (MOI) to enable each cell has one copy of reporter construct, and the transduced cells were sorted by mCherry flow cytometry. To inactivate GREB1 gene, we single-cell cloned the cells infected with lentiCRISPRv2 vector containing SgGREB1-7 or SgGREB1-8, and isolated a clone that had genomic alteration at target sequence. Three clones were generated by using SgGREB1-7 (SgGREB1-7-2, 7–11 and 7–12) and one clone was generated by using SgGREB1-8 (SgGREB1-8-2).
shRNA screen
Request a detailed protocolFACS-based small-scale shRNA screen with 33 selected genes was performed as follows: FACS-sorted ARsig-hi cells were plated in 12 well plate (1.5 × 10⁵ cells per well, Corning, 353043) and each well was infected with pool of 3 SEPC shRNAs against each gene on the following day. Cells with stable integration of hairpins were selected with 2 μg/ml puromycin. 9 days after infection, half of the cells in each well was used to analyze eGFP AR reporter activity using flow cytometry, and the other half was subjected to qRT-PCR to determine knockdown level of the gene. We performed the screen in duplicate and each replicate included wells infected with shRenilla or shAR as controls. The median fluorescence intensity (MFI) of eGFP was measured using FlowJo software. The shRNAs decreased eGFP MFI more than 1.5 fold compared to shRenilla (normalized value lower than 0.667) in both duplicate were considered as hits. The list of 33 genes used in the screen and the summary of median eGFP intensity can be found at Figure 2—source data 2.
Xenograft assay
Request a detailed protocolTo compare time to acquire enzalutamide resistance in vivo, FACS-sorted bulk, ARsig-lo and ARsig-hi populations derived from LNCaP/AR were cultured for 6 days after sorting to obtain enough number of cells for xenograft assay. 2 × 10⁶ cells were injected subcutaneously into the flank of physically castrated CB17 SCID mice in a 50:50 mix of matrigel (BD Biosciences, San Jose, CA) and regular culture medium (five mice, 10 tumors per group), and enzalutamide treatment was initiated on the day of injection. To test the effect of GREB1 knockdown on development of enzalutamide resistance, FACS-sorted ARsig-hi population derived from LNCaP/AR was infected with control or three different shGREB1 constructs 2 days after sorting. Cells with stable integration of hairpin were selected with 2 μg/ml puromycin. 5 days after infection, 2 × 10⁶ cells were injected subcutaneously into the flank of castrated CB17 SCID mice (five mice, 10 tumors per group), and enzalutamide treatment was initiated on the day of injection. The same cell populations used for injection were also used to test eGFP AR reporter activity using flow cytometry, and qRT-PCR to test knockdown level of GREB1. Measurements were obtained weekly using Peira TM900 system (Peira bvba, Belgium). All animal experiments were performed in compliance with the approved institutional animal care and use committee (IACUC) protocols (#06-07-012) of the Research Animal Resource Center of Memorial Sloan Kettering Cancer Center.
Immunoblot, immunoprecipitation and immunostaining
Request a detailed protocolProtein was extracted from cells using Triton lysis buffer and quantified by BCA Protein Assay (ThermoFisher Scientific, Waltham, MA, 23225). Nuclear/cytoplasmic fractionation was achieved with Subcellular Protein Fractionation Kit (ThermoFisher Scientific, 78840). Protein lysates were subjected to SDS-PAGE and immunoblotted with the following antibodies against: AR (Abcam, Cambridge, United Kingdom, ab108341), KLK3 (Cell Signaling Technology, Danvers, MA, 5365), FKBP5 (Cell Signaling, 8245) TRPM8 (Epitomics, Burlingame, CA, 3466–1), tubulin (Santa Cruz Biotechnology, Dallas, TX, sc-9104), Cyclophilin B (Abcam, ab178397), BRD4 (Cell Signaling, 13440), TOP2B (Abcam, ab58442), HA (Cell Signaling, 3724).
For AR immunoprecipitation, at least 1.5 mg of total protein was incubated with AR antibody (Abcam, ab108341) overnight at 4°C followed by the addition of Protein A/G agarose beads (Santa Cruz, sc-2003) for 2 hr. Immune complexes were extensively washed with Triton buffer and solubilized using Laemmli sample buffer (BioRad, Hercules, CA).
For immunofluorescence staining, cells were fixed with 4% formaldehyde, permeabilized with 0.2% Triton-X, blocked with 5% normal goat and 5% normal horse serum, stained with anti-AR (Santa Cruz, sc-816) primary and Alexa Fluor 647 (Invitrogen) secondary antibodies, and mounted with DAPI mounting solution (Vector Lab, Burlingame, CA). For Immunohistochemistry, tumor sections were stained with anti-AR (Agilent, Santa Clara, CA, 441) and KLK3 (Biogenex, Fremont, CA) antibodies using Leica Bond RX (Leica Biosystems, Wetzlar, Germany).
Transcription analysis
Request a detailed protocolTotal RNA was isolated using the QiaShredder kit (Qiagen, Germantown, MD) for cell lysis and the RNeasy kit (Qiagen) for RNA purification. For quantitative PCR with reverse transcription (RT–qPCR), we used the High-Capacity cDNA Reverse Transcription Kit (Applied Biosystems, Grand Island, NY) to synthesize cDNA according to the manufacturer's protocol. Real-time PCR was performed using gene-specific primers and 2X SYBR green quantfast PCR Mix (Qiagen, 1044154). Data were analyzed by the DDCT method using GAPDH as a control gene and normalized to control samples, which were arbitrarily set to 1. To test DHT-induced AR target gene upregulation, cells were hormone-deprived in 10% charcoal-stripped dextran-treated fetal bovine serum (Omega Scientific) media for 2 days and then treated with indicated concentration of DHT for 24 hr. Triplicate measurements were made on at least three biological replicates. The primer sequences used for q-PCR are listed at Supplementary file 1.
For RNA-seq, library preparation, sequencing and expression analysis were performed by the New York Genome Center. Libraries were prepared using TruSeq Stranded mRNA Library Preparation Kit in accordance with the manufacturer’s instructions and sequenced on an Illumina HiSeq2500 sequencer (rapid run v2 chemistry) with 50 base pair (bp) reads. Partek Genomics Suite software (Partek Inc, St. Louis, MO) was used to analyze differentially expressed genes between ARsig-lo vs. ARsig-hi (Fold change ≥1.5, p<0.05). To analyze RNA-seq data from ARsig-hi cells with shRenilla vs. shGREB1, reads were aligned to the NCBI GRCh37 human reference using STAR aligner (Dobin et al., 2013). Quantification of genes annotated in Gencode vM2 were performed using featureCounts and quantification of transcripts using Kalisto (Bray et al., 2016). QC were collected with Picard and RSeQC (Wang et al., 2012) (http://broadinstitute.github.io/picard/). Normalization of feature counts was done using the DESeq2 package (http://www-huber.embl.de/users/anders/DESeq/). Differentially expressed genes were defined as a 1.5 fold difference, p<0.05 of DESeq-normalized expression. For GSEA, statistical analysis was performed with publicly available software from the Broad Institute (http://www.broadinstitute.org/gsea/index.jsp). The basal and luminal gene signatures used for GSEA (Supplementary file 2) were generated by conducting RNA-sequencing with normal human basal vs. luminal prostate cells isolated as previously described (Karthaus et al., 2014). Full description of this study will be reported separately.
ChIP
Request a detailed protocolChIP experiments were performed as previously described (Arora et al., 2013), using SDS-based buffers. Antibodies were used at a concentration of 5 ug per 1 mL of IP buffer, which encompassed approximately 8 million cells per IP. Antibodies used were: AR (Santa Cruz, sc-816), EP300 (Santa Cruz, sc-585), HA (Abcam, ab9110), ER (Santa Cruz, sc-8002). The primer sequences used for ChIP-qPCR are listed at Supplementary file 1.
For ChIP–seq, library preparation and RNA-seq were performed by the NYU Genome Technology Center. Libraries were made using the KAPA Biosystems Hyper Library Prep Kit (Kapa Biosystems, Woburn, MA, KK8504), using 10 ng of DNA as input and 10 PCR cycles for library amplification. The libraries were sequenced on a HiSeq 2500, as rapid run v2 chemistry, paired-end mode of 51 bp read length.
The ChIP-seq reads were aligned to the human genome (hg19, build 37) using the program BWA (VN: 0.7.12; default parameters) within the PEMapper. Duplicated reads were marked by the software Picard (VN: 1.124; http://broadinstitute.github.io/picard/index.html) and removed. The software MACS2 (Feng et al., 2012) (-q 0.1) was used for peak identification with data from ChIP input DNAs as controls. Peaks of sizes > 100 bp and with at least one base pair covered by >18 reads were selected as the final high confident peaks. Peaks from shGREB1/control conditions were all merged to obtain non-overlapping genomic regions, which were then used to determine conditional specific AR binding. Overlapped peaks were defined as those sharing at least one base pair. To generate graphs depicting AR ChIP–seq read density in ±2 kilobase regions of the AR peak summits, the same number of ChIP–seq reads from different conditions were loaded into the software ChAsE (Younesy et al., 2016), and the resulting read density matrices were sorted by the read densities in the shRenilla control, before coloring. The read density was also used to select peaks with significant signal difference between shGREB1 and controls. The criteria for assigning peaks to genes have been described previously (Rockowitz and Zheng, 2015). The MEME-ChIP software (Machanick and Bailey, 2011) was applied to 300 bp sequences around the peak summits for motif discovery, and the comparison of sequence motifs was also analyzed with HOMER (http://homer.ucsd.edu/homer/).
Analysis of human prostate cancer datasets
Request a detailed protocolAll analysis of human prostate cancer data was conducted using previously published datasets of The Cancer Genome Atlas (TCGA) (Cancer Genome Atlas Research Network, 2015) and PCF/SU2C (Robinson et al., 2015), which can be explored in the cBioPortal for Cancer Genomics (http://www.cbioportal.org). Tumor purity content was estimated computationally using the ABSOLUTE method (Carter et al., 2012), based on mutant allele variant fractions and zygosity shifts. Stromal signature score was applied to the normalized RNA-seq expression dataset (Yoshihara et al., 2013).
Statistics
For comparison of pooled data between two different groups, unpaired t tests were used to determine significance. For comparison of data among three groups, one-way ANOVA was used to determine significance. In vitro assays represent three independent experiments from biological replicates, unless otherwise indicated. In all figures, *p<0.05, **p<0.01, ***p<0.001 and ****p<0.0001. For GSEA, statistical analysis was performed with publicly available software from the Broad Institute (http://www.broadinstitute.org/gsea/index.jsp). The sample size estimate was based on our experience with previous experiments (Balbas et al., 2013; Bose et al., 2017; Chen et al., 2013). No formal randomization process was used to assign mice to a given xenograft assay, and experimenters were not blinded.
Data availability
RNA-seq data has been deposited in GEO under accession code GSE120720. ChIP-seq data has been deposited in GEO under accession code GSE120680
-
NCBI Gene Expression OmnibusID GSE120720. GREB1 amplifies androgen receptor output in prostate cancer and contributes to antiandrogen resistance.
-
NCBI Gene Expression OmnibusID GSE120680. GREB1 amplifies androgen receptor output in prostate cancer and contributes to antiandrogen resistance.
-
NCBI dbGapID phs000915.v1.p1. Integrative clinical genomics of advanced prostate cancer.
-
cBioPortal for Cancer GenomicsThe Molecular Taxonomy of Primary Prostate Cancer.
References
-
Near-optimal probabilistic RNA-seq quantificationNature Biotechnology 34:525–527.https://doi.org/10.1038/nbt.3519
-
Absolute quantification of somatic DNA alterations in human cancerNature Biotechnology 30:413–421.https://doi.org/10.1038/nbt.2203
-
Molecular determinants of resistance to antiandrogen therapyNature Medicine 10:33–39.https://doi.org/10.1038/nm972
-
STAR: ultrafast universal RNA-seq alignerBioinformatics 29:15–21.https://doi.org/10.1093/bioinformatics/bts635
-
Identifying ChIP-seq enrichment using MACSNature Protocols 7:1728–1740.https://doi.org/10.1038/nprot.2012.101
-
Nuclear receptors, coactivators and chromatin: new approaches, new insightsTrends in Endocrinology & Metabolism 12:191–197.https://doi.org/10.1016/S1043-2760(01)00392-7
-
MEME-ChIP: motif analysis of large DNA datasetsBioinformatics 27:1696–1697.https://doi.org/10.1093/bioinformatics/btr189
-
GREB 1 is a critical regulator of hormone dependent breast cancer growthBreast Cancer Research and Treatment 92:141–149.https://doi.org/10.1007/s10549-005-1483-4
-
Androgen receptor status in localized and locally progressive hormone refractory human prostate cancerThe American Journal of Pathology 144:735–746.
-
Molecular genetics of prostate cancer: new prospects for old challengesGenes & Development 24:1967–2000.https://doi.org/10.1101/gad.1965810
-
Integrative analysis of FOXP1 function reveals a tumor-suppressive effect in prostate cancerMolecular Endocrinology 28:2012–2024.https://doi.org/10.1210/me.2014-1171
-
The androgen receptor in LNCaP cells contains a mutation in the ligand binding domain which affects steroid binding characteristics and response to antiandrogensThe Journal of Steroid Biochemistry and Molecular Biology 41:665–669.https://doi.org/10.1016/0960-0760(92)90401-4
-
RSeQC: quality control of RNA-seq experimentsBioinformatics 28:2184–2185.https://doi.org/10.1093/bioinformatics/bts356
-
Emerging mechanisms of resistance to androgen receptor inhibitors in prostate cancerNature Reviews Cancer 15:701–711.https://doi.org/10.1038/nrc4016
-
ChAsE: chromatin analysis and exploration toolBioinformatics 32:3324–3326.https://doi.org/10.1093/bioinformatics/btw382
Article and author information
Author details
Funding
U.S. Department of Defense (W81XWH-15-1-0540)
- Eugine Lee
Iris and Junming Le Foundation
- Eugine Lee
Howard Hughes Medical Institute
- Charles L Sawyers
National Institutes of Health (CA155169)
- Charles L Sawyers
Starr Foundation (I10-0062)
- Charles L Sawyers
National Institutes of Health (CA193837)
- Charles L Sawyers
National Institutes of Health (CA224079)
- Charles L Sawyers
National Institutes of Health (CA092629)
- Charles L Sawyers
National Institutes of Health (CA160001)
- Charles L Sawyers
National Institutes of Health (CA008748)
- Charles L Sawyers
The funders had no role in study design, data collection and interpretation, or the decision to submit the work for publication.
Acknowledgements
We thank the flow cytometry core facility at MSKCC for technical support, NYU Genome Technology Center for conducting ChIP-sequencing, New York Genome Center for conducting the RNA-sequencing, MSKCC Pathology Core for assistance with IHC staining of patient samples, Wouter Karthaus for help with cloning and providing the basal and luminal gene signature, Wassim Abida for help with analyzing patient data, Kayla Lawrence and Tejasveeta Nadkarni for help with cloning and Jason Carroll (Cancer Research UK Cambridge Institute) for generously providing pCMV6-GREB1 plasmid, and the members of the Sawyers laboratory for helpful discussions.
Ethics
Animal experimentation: All animal experiments were performed in compliance with the approved institutional animal care and use committee (IACUC) protocols (#06-07-012) of the Research Animal Resource Center of Memorial Sloan Kettering Cancer Center.
Copyright
© 2019, Lee et al.
This article is distributed under the terms of the Creative Commons Attribution License, which permits unrestricted use and redistribution provided that the original author and source are credited.
Metrics
-
- 2,848
- views
-
- 461
- downloads
-
- 24
- citations
Views, downloads and citations are aggregated across all versions of this paper published by eLife.
Citations by DOI
-
- 24
- citations for umbrella DOI https://doi.org/10.7554/eLife.41913
Download links
A two-part list of links to download the article, or parts of the article, in various formats.
Downloads (link to download the article as PDF)
Open citations (links to open the citations from this article in various online reference manager services)
Cite this article (links to download the citations from this article in formats compatible with various reference manager tools)
GREB1 amplifies androgen receptor output in human prostate cancer and contributes to antiandrogen resistance
eLife 8:e41913.
https://doi.org/10.7554/eLife.41913


