Nuclear genetic regulation of the human mitochondrial transcriptome
- King’s College London, United Kingdom
Figures
Figure 1
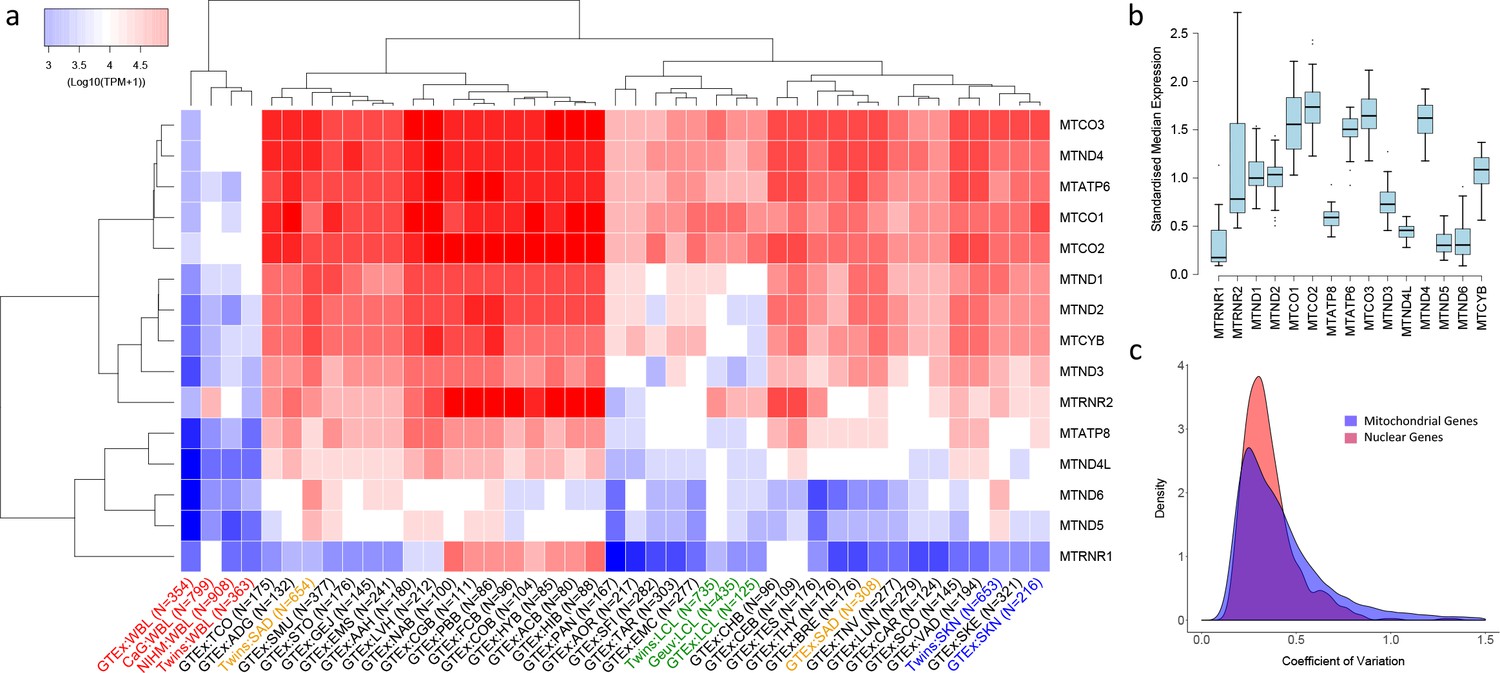
Variation in the expression of mitochondrial-encoded genes across datasets.
(A) Hierarchical clustering of median expression levels per gene across all datasets where WBL = Whole Blood, SAD = Subcutaneous Adipose, LCL = Lymphoblastoid cell lines, SKN = Non sun exposed skin, SKE = Sun exposed skin, VAD = Visceral omentum adipose, ADG = Adrenal gland, AOR = Aorta, CAR = Coronary artery, TAR = Tibial artery, ACB = Anterior cingulate cortex (BA24) (Brain), CGB = Caudate basal ganglia (Brain), CHB = Cerebellar Hemisphere (Brain), CEB = Cerebellum (Brain), COB = Cortex (Brain), FCB = Frontal cortex (BA9) (Brain), HIB = Hippocampus (Brain), HYB = Hypothalamus (Brain), NAB = Nucleus accumbens (basal ganglia) (Brain), PBB = Putamen basal ganglia (Brain), BRE = Breast mammary tissue, SCO = Sigmoid colon, TCO = Transverse colon, GEJ = Gastroesophageal junction, EMC = Esophagus mucosa, EMS = Esophagus Muscularis, AAH = Atrial appendage (Heart), LVH = Left ventricle (Heart), LUN = Lung, SMU = Skeletal muscle, TNV = Tibial Nerve, PAN = Pancreas, SFI = Transformed fibroblasts, STO = Stomach, TES = Testes and THY = Thyroid, Multi-dataset tissues on the x-axis are shown in red (whole blood), orange (subcutaneous adipose), green (lymphoblastoid cell lines) and blue (non-sun exposed skin). (B) Standardized expression levels of each mitochondrial-encoded gene across all independent datasets, (C) Coefficient of variation across individuals for the expression levels of mitochondrial encoded genes and the top 1000 most highly expressed nuclear genes in all datasets. Range of coefficient of variation is restricted to between 0 and 1.5 as this contains the majority of the data.
Figure 2 with 1 supplement
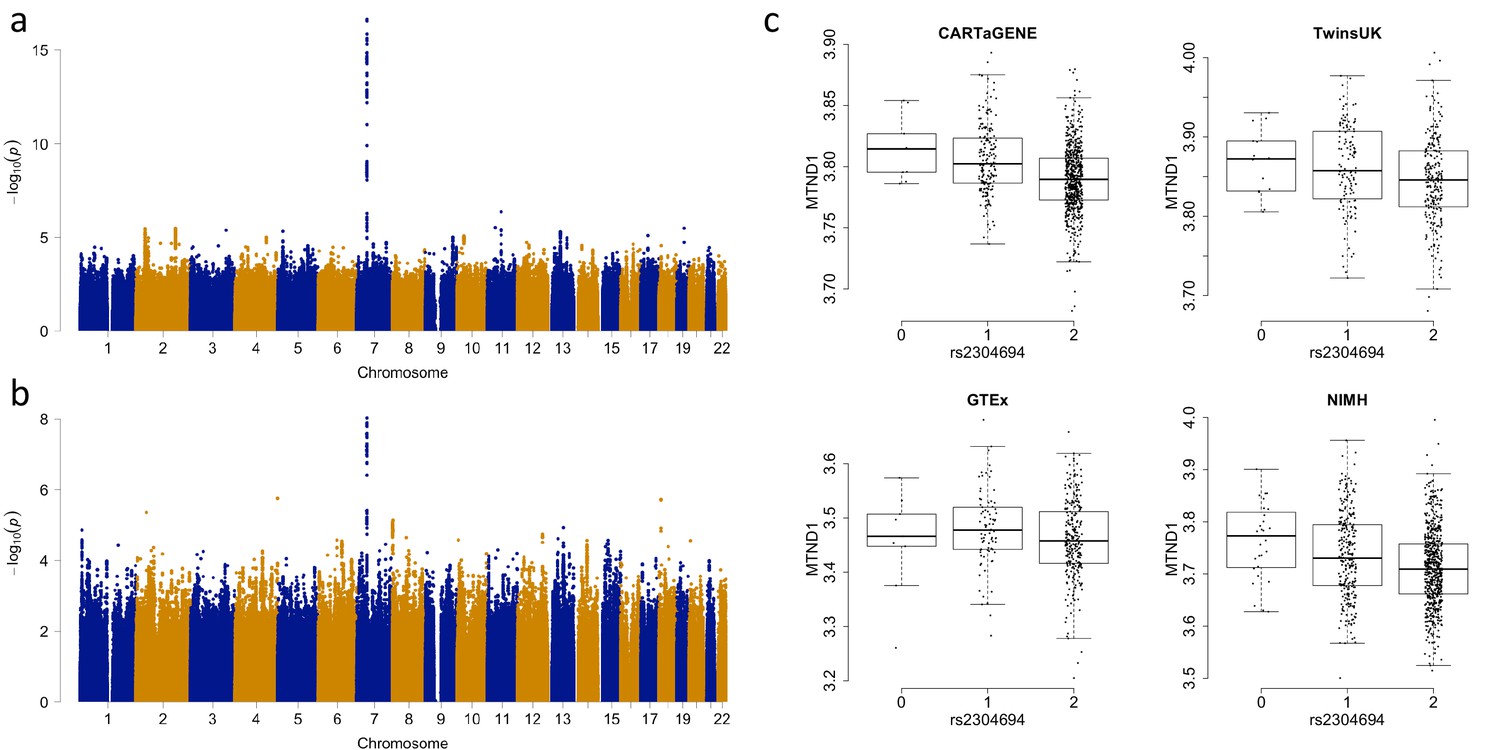
Associations between the expression of MTND1 and rs2304694 in whole blood data.
(A) Genome-wide association analysis for the expression of MTND1 in whole blood data from the discovery datasets (meta-analysis of CARTaGENE, TwinsUK and GTEx data), (B) Genome-wide association analysis for the expression of MTND1 in whole blood data from the replication dataset (NIMH data), (C) Expression of MTND1 (Log10(TPM +1)) versus non-reference allele frequency of rs2304694 in the four independent whole blood datasets.
Figure 2—figure supplement 1
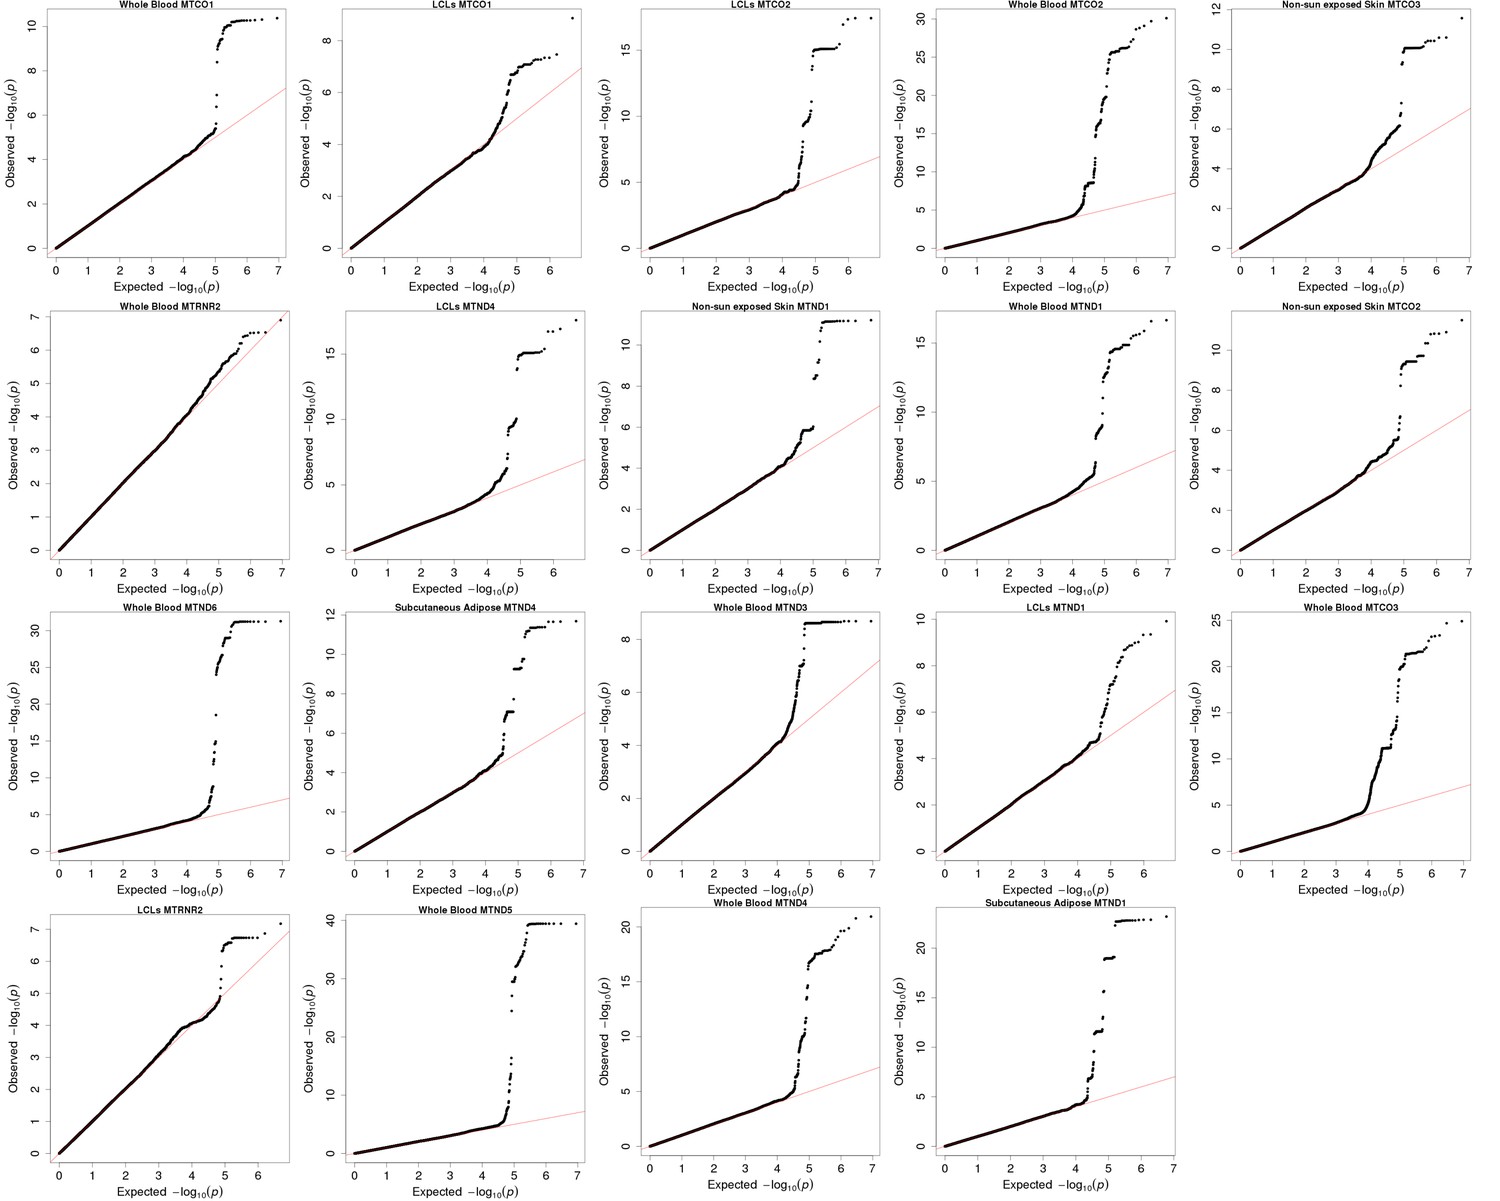
QQ plots for associations between nuclear genetic variants and mitochondrial gene expression for discovery associations that replicate at the nominal 5% level.
https://doi.org/10.7554/eLife.41927.005
Figure 3

Replication and validation of significant associations between nuclear genetic variants and the expression of mitochondria-encoded genes.
(A) Discovery versus replication beta estimates for significant associations between nuclear genetic variation and mitochondrial gene expression detected in discovery data at FDR 5%, (B) Validation of the association between rs2304694 and the expression of MTND4 using quantitative PCR in LCLs. MTND4 mRNA expression levels are normalised to GAPDH (theoretical quantities).
Tables
Table 1
Associations where a suggestive causal nuclear gene is implicated.
‘Missense mutation’ denotes that the nuclear genetic variant associated with the expression of a mitochondrial-encoded gene is a missense mutation, ‘Mediation (Mitochondrial Gene)’ denotes that the expression of a nearby nuclear gene known to play a role in mitochondrial processes explains a significant proportion of the association between a nuclear genetic variant and the expression level of a mitochondrial encoded gene, and ‘Mediation (other nuclear gene)’ denotes a similar result whereby the nuclear gene identified is thought to have no known role in mitochondrial processes (see Materials and methods).
| Tissue | Peak SNP | MT gene | Missense mutation | Mediation (Mitochondrial Gene) | Mediation (other nuclear gene) |
|---|---|---|---|---|---|
| Whole Blood | rs7558127 | MTND6 | NA | PNPT1 | NA |
| Whole Blood | rs6973982 | MTCO2 | NA | TBRG4 | NA |
| Whole Blood | rs11085147 | MTCO2 | LONP1 | NA | NA |
| Whole Blood | rs2304693 | MTCYB | TBRG4 | NA | NA |
| Whole Blood | rs74025341 | MTCYB | NA | NA | SLC7A6OS,ZFP90 |
| Whole Blood | rs7158706 | MTND2 | NA | NA | PPP2R3C |
| Whole Blood | rs10172506 | MTND5 | NA | PNPT1 | NA |
| Whole Blood | rs74863981 | MTCO1 | NA | NA | UBOX5,TGM3,LZTS3 |
| Whole Blood | rs76125482 | MTND3 | NA | FASTKD1 | NA |
| Whole Blood | rs6973982 | MTND4 | NA | NA | RP4-647J21.1,CCM2 |
| Whole Blood | rs11008009 | MTND4 | NA | MTPAP | NA |
| Whole Blood | rs2304694 | MTND1 | TBRG4 | NA | NA |
| Whole Blood | rs1692120 | MTND1 | NA | NA | MYRF |
| Whole Blood | rs6973982 | MTATP6 | NA | NA | CCM2 |
| Whole Blood | rs589809 | MTATP6 | NA | NA | FLT1 |
| Whole Blood | rs375640557 | MTCO3 | NA | NA | CCDC104 |
| Whole Blood | rs6973982 | MTCO3 | NA | TBRG4 | NA |
| Whole Blood | rs10165864 | MTRNR2 | NA | PNPT1 | NA |
| Whole Blood | rs66892251 | MTRNR2 | NA | MTPAP | NA |
| Whole Blood | rs61988269 | MTRNR1 | NA | MRPP3 | NA |
| Subcutaneous Adipose | rs2304694 | MTND6 | TBRG4 | NA | NA |
| Subcutaneous Adipose | rs2304694 | MTND5 | TBRG4 | NA | NA |
| Subcutaneous Adipose | rs2304694 | MTND1 | TBRG4 | NA | NA |
| Subcutaneous Adipose | rs12579998 | MTND1 | NA | MRPS35 | NA |
| Subcutaneous Adipose | rs2304693 | MTCO3 | TBRG4 | NA | NA |
| Skin (Not sun exposed) | rs2304693 | MTCO2 | TBRG4 | NA | NA |
| Skin (Not sun exposed) | rs2304693 | MTCO3 | TBRG4 | NA | NA |
| LCLs | rs7559561 | MTCO2 | NA | LRPPRC | NA |
| LCLs | rs2304694 | MTCO2 | TBRG4 | NA | NA |
| LCLs | rs1047991 | MTND3 | MTPAP | NA | NA |
| LCLs | rs2304694 | MTND4 | TBRG4 | NA | NA |
| LCLs | rs10205130 | MTND1 | NA | LRPPRC | NA |
| LCLs | rs35739334 | MTND1 | NA | TBRG4 | NA |
| LCLs | rs2304694 | MTCO3 | TBRG4 | NA | NA |
| LCLs | rs2304694 | MTRNR2 | TBRG4 | NA | NA |
| LCLs | rs2304694 | MTND4L | TBRG4 | NA | NA |
Table 2
Significant associations between nuclear genetic variants and the expression levels of genes encoded in the mitochondrial genome that replicate in independent tissue matched datasets.
Point-wise permutation P values were generated by extrapolating from the underlying beta distribution (see Materials and methods).
| Tissue | Peak nuclear SNP | Chr | Position | A1 | MAF | MT gene | P value | P value (FDR corrected) | P value (Point-wise Permutation) | Beta | Replication P value | Replication beta | Nuclear gene annotation | Nuclear SNP annotation |
|---|---|---|---|---|---|---|---|---|---|---|---|---|---|---|
| LCLs | rs10205130 | 2 | 44151572 | C | 0.426 | MTND1 | 1.23E-10 | 6.40E-05 | 1.18E-10 | 0.023 | 5.70E-05 | 0.015 | LRPPRC | Intronic |
| Whole Blood | rs10172506 | 2 | 55865469 | C | 0.062 | MTND5 | 4.40E-40 | 2.00E-33 | 1.39E-39 | 0.058 | 2.00E-08 | 0.037 | PNPT1 | Intronic |
| Whole Blood | rs7558127 | 2 | 55866605 | G | 0.064 | MTND6 | 5.26E-32 | 8.30E-26 | 5.29E-32 | 0.070 | 8.70E-07 | 0.043 | PNPT1 | Intronic |
| LCLs | rs2627775 | 2 | 55877113 | T | 0.458 | MTCO1 | 1.33E-09 | 4.10E-04 | 9.95E-10 | 0.017 | 6.30E-04 | 0.013 | PNPT1 | Intronic |
| LCLs | rs62165226 | 2 | 55878339 | C | 0.484 | MTCO3 | 2.79E-08 | 7.60E-03 | 2.71E-08 | −0.018 | 6.80E-06 | −0.018 | PNPT1 | Intronic |
| Whole Blood | rs6973982 | 7 | 45143892 | G | 0.148 | MTCO2 | 7.53E-31 | 8.60E-25 | 1.12E-30 | −0.028 | 2.30E-08 | −0.023 | TBRG4 | Intronic |
| Whole Blood | rs6973982 | 7 | 45143892 | G | 0.148 | MTCO3 | 1.23E-25 | 6.40E-20 | 1.05E-25 | −0.028 | 1.40E-04 | −0.019 | TBRG4 | Intronic |
| Skin (Not sun exposed) | rs2304693 | 7 | 45148667 | A | 0.201 | MTCO3 | 2.84E-12 | 2.10E-05 | 2.93E-12 | −0.027 | 1.80E-03 | −0.026 | TBRG4 | Missense |
| Whole Blood | rs2304694 | 7 | 45148773 | A | 0.148 | MTND1 | 2.34E-17 | 6.10E-12 | 3.19E-17 | 0.015 | 1.60E-08 | 0.024 | TBRG4 | Missense |
| LCLs | rs2304694 | 7 | 45148773 | A | 0.197 | MTND4 | 2.35E-18 | 3.90E-11 | 2.22E-18 | −0.029 | 1.40E-04 | −0.019 | TBRG4 | Missense |
| Subcutaneous Adipose | rs12579998 | 12 | 27861446 | G | 0.174 | MTND1 | 2.48E-23 | 6.50E-17 | 1.09E-23 | −0.032 | 3.20E-05 | −0.032 | - | Intergenic |
| Subcutaneous Adipose | rs12579998 | 12 | 27861446 | G | 0.174 | MTND4 | 2.20E-12 | 1.70E-06 | 1.56E-12 | −0.022 | 4.00E-04 | −0.027 | - | Intergenic |
| Skin (Not sun exposed) | rs11049103 | 12 | 27862081 | A | 0.179 | MTND1 | 7.72E-12 | 2.10E-05 | 6.68E-12 | −0.022 | 8.10E-04 | −0.026 | - | Intergenic |
| Whole Blood | rs74863981 | 20 | 3109875 | A | 0.099 | MTCO1 | 4.24E-11 | 5.40E-06 | 5.25E-11 | −0.024 | 6.60E-05 | −0.022 | UBOX5 | Intronic |
Additional files
-
Supplementary file 1
Significant associations between nuclear genetic variants and the expression levels of genes encoded in the mitochondrial genome.
See Materials and methods for a description of the calculation of different permutation P values.
- https://doi.org/10.7554/eLife.41927.009
-
Supplementary file 2
Details of trans-genome associations when calculating TPM values for mitochondrial-encoded genes using the total number of reads mapping to the mitochondrial genome.
- https://doi.org/10.7554/eLife.41927.010
-
Supplementary file 3
Replication P-values and Beta Coefficients for mitochondrial trans-genome eQTLs in all tissue types.
- https://doi.org/10.7554/eLife.41927.011
-
Supplementary file 4
Gene expression matrices for all dataset used in the study.
Values show log-transformed (TPM +1) values. After transformation, outlier values were removed (three inter-quartile ranges above/below the upper/lower quartiles respectively).
- https://doi.org/10.7554/eLife.41927.012
-
Supplementary file 5
Population, sex and allele information for cell lines used in qPCR validation experiments.
- https://doi.org/10.7554/eLife.41927.013
-
Supplementary file 6
Forest plots for each peak variant detected in association analyses.
Each plot contains Beta estimates and confidence intervals for each of the datasets and tissues considered in the study.
- https://doi.org/10.7554/eLife.41927.014
-
Transparent reporting form
- https://doi.org/10.7554/eLife.41927.015
Download links
A two-part list of links to download the article, or parts of the article, in various formats.
Downloads (link to download the article as PDF)
Open citations (links to open the citations from this article in various online reference manager services)
Cite this article (links to download the citations from this article in formats compatible with various reference manager tools)
Nuclear genetic regulation of the human mitochondrial transcriptome
eLife 8:e41927.
https://doi.org/10.7554/eLife.41927


