HIV-1 Vpu is a potent transcriptional suppressor of NF-κB-elicited antiviral immune responses
- Ulm University Medical Center, Germany
- Sanford Burnham Prebys Medical Discovery Institute, United States
- École Polytechnique Fédérale de Lausanne, Switzerland
- Swiss Institute of Bioinformatics, Switzerland
Figures
Figure 1 with 2 supplements

Generation of Vpu mutants that fail to inhibit NF-κB activation or to counteract tetherin.
(A) Vpu-mediated inhibition of NF-κB activation via two independent mechanisms. Asterisks illustrate mutations in Vpu that were introduced to selectively abrogate tetherin counteraction (orange) or inhibition of NF-κB activation downstream of tetherin (blue). (B) Wt and mutant HIV-1 clones used in this study. MSM, man having sex with men; WSM, woman having sex with men. (C) Vpu-mediated inhibition of NF-κB activation. HEK293T cells were co-transfected with the indicated proviral constructs, a firefly luciferase-based NF-κB reporter vector, a Gaussia luciferase construct for normalization, and an expression vector for a constitutively active mutant of IKKβ as NF-κB inducer. Two days post-transfection, luciferase activity was determined. Mean values of three to seven independent experiments, each performed in triplicate ±SEM are shown (*p<0.05; **p<0.01; RM one-way ANOVA with Greenhouse-Geisser correction and Dunnett’s multiple comparison test). (D) Vpu-mediated down-modulation of tetherin. Human PBMCs were infected with the indicated VSV-G pseudotyped HIV-1 strains. Three days post-infection, tetherin surface levels of p24 positive cells were determined by flow cytometry. Mean values of three to five independent experiments ± SEM are shown (*p<0.05; **p<0.01; ***p<0.001; RM one-way ANOVA with Greenhouse-Geisser correction and Dunnett’s multiple comparison test). (E) Vpu-mediated enhancement of infectious virus yield. HEK293T cells were co-transfected with the indicated proviral constructs and increasing amounts of an expression plasmid for human tetherin. Two days post-transfection, infectious virus yield was determined by infection of TZM-bl reporter cells. Mean values of three to four independent experiments ± SEM are shown. (F) Expression of Vpu. HEK293T cells were transfected with the indicated proviral constructs. Two days post-transfection, cells were harvested and analyzed by Western Blotting.
Figure 1—figure supplement 1
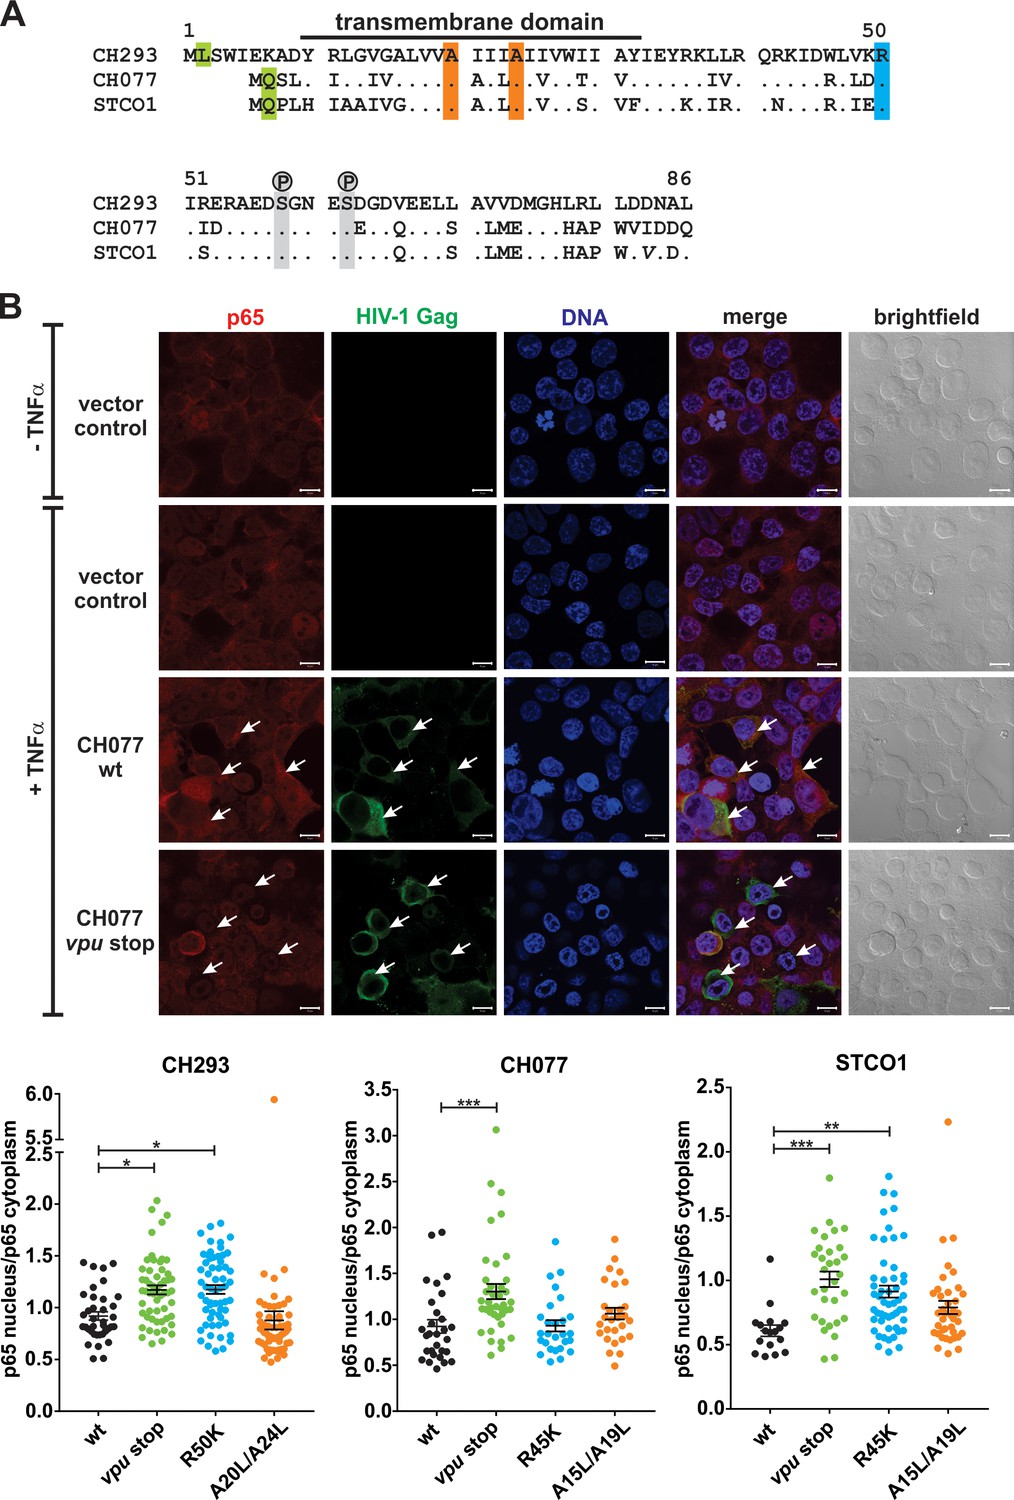
Vpu alignment and Vpu-mediated inhibition of nuclear translocation of p65.
(A) Amino acid sequence alignment of CH293, CH077 and STCO1 Vpu. Residues that were mutated to abrogate the anti-tetherin activity, ability to inhibit NF-κB activation or expression of Vpu are highlighted in orange, blue and green, respectively. Phosphorylated serine residues are shown in grey. (B) HEK293T cells were transfected with the indicated proviral constructs or an empty vector control. Two days post-transfection, cells were stimulated with 5 ng/ml TNFα for 15 min before fixation and staining for intracellular p65 (red), HIV-1 p24/Gag (green) and DNA (blue). Exemplary images are shown on top (scale bar: 10 µm). Arrows indicate exemplary cells containing high and low levels of cytoplasmic p65 in cells expressing wild type and vpu-deficient HIV-1, respectively. To quantify nuclear translocation, the average p65 signal intensity in the nucleus was determined and divided by the p65 signal intensity in the cytoplasm. The bottom panel shows the quantification of 475 cells from one of two independent experiments. Mean values ± SEM are shown (*p<0.05; **p<0.01; ***p<0.001; ordinary one-way ANOVA with Dunnett’s multiple comparison test).
Figure 1—figure supplement 2
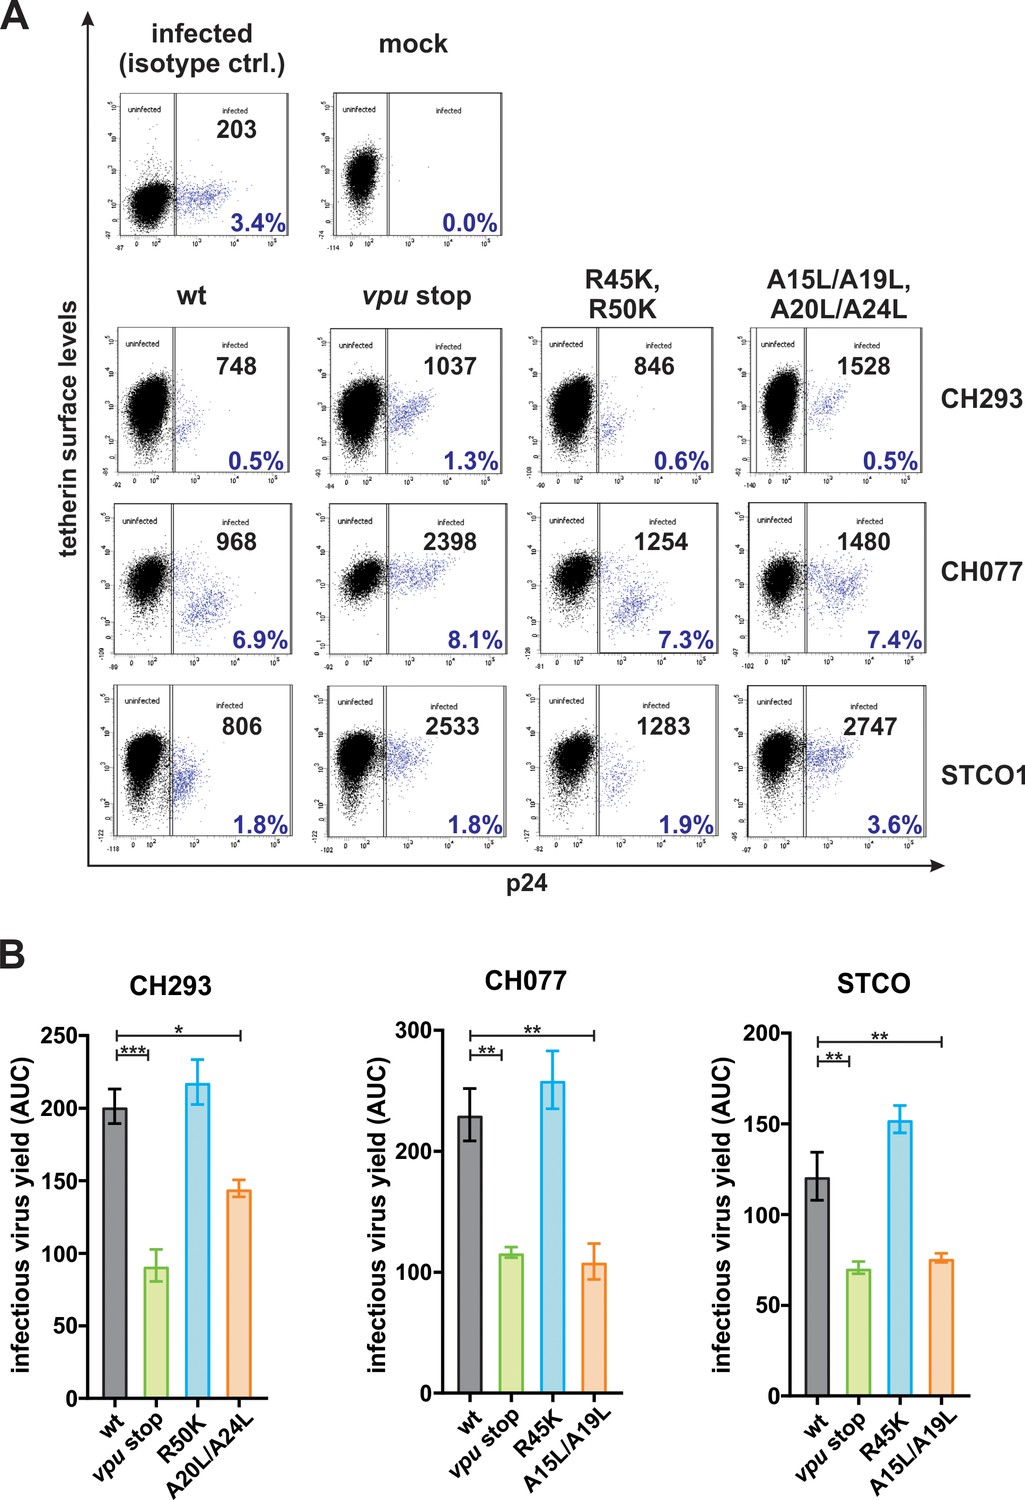
Vpu-mediated counteraction of tetherin.
(A) Human PBMCs were infected with the indicated VSV-G pseudotyped HIV-1 strains. Three days post-infection, tetherin surface levels of p24 positive cells were determined by flow cytometry. Exemplary primary data of the results shown in Figure 1D illustrating the gating strategy are shown. The mean fluorescence intensity of tetherin surface staining and the percentage of infected cells are shown in black and blue, respectively. (B) Area under the curve (AUC) of the data shown in Figure 1E was calculated. Mean values of three to four independent experiments ± SEM are shown (*p<0.05; **p<0.01; ***p<0.001; ordinary one-way ANOVA with Dunnett’s multiple comparison test).
Figure 2 with 1 supplement

RNA sequencing of CD4 +T cells infected with wt or vpu-mutated HIV-1.
(A) Experimental setup. CD4 +T cells of four healthy donors were infected with wt or vpu-mutated HIV-1. Three days post-infection, cells were harvested and RNA sequencing was performed. (B) Principal component analysis demonstrating that samples are clustered by donor (A - D) and virus (CH077, CH293, STCO1) rather than the vpu genotype. (C) MA plot providing a global view of differentially expressed genes between Vpu wt and mock infected samples (combined analysis of CH077, CH293, and STCO1). Red dots represent significant genes with a q value < 0.1 after Benjamini-Hochberg correction. (D) KEGG pathways significantly down- or up-regulated upon infection with HIV-1 wt (combined analysis of CH077, CH293, and STCO1) (* q < 0.1; ** q < 0.01; *** q < 0.001). HIV-1 suppresses pathways involved in transcription/translation (red), cell division (orange) and energy metabolism (purple), but induces immune responses (yellow), signaling cascades (green) and pathways involved in cell-to-cell interactions and motility (blue). Pathway analysis was performed using GAGE (Luo et al., 2009).
Figure 2—figure supplement 1
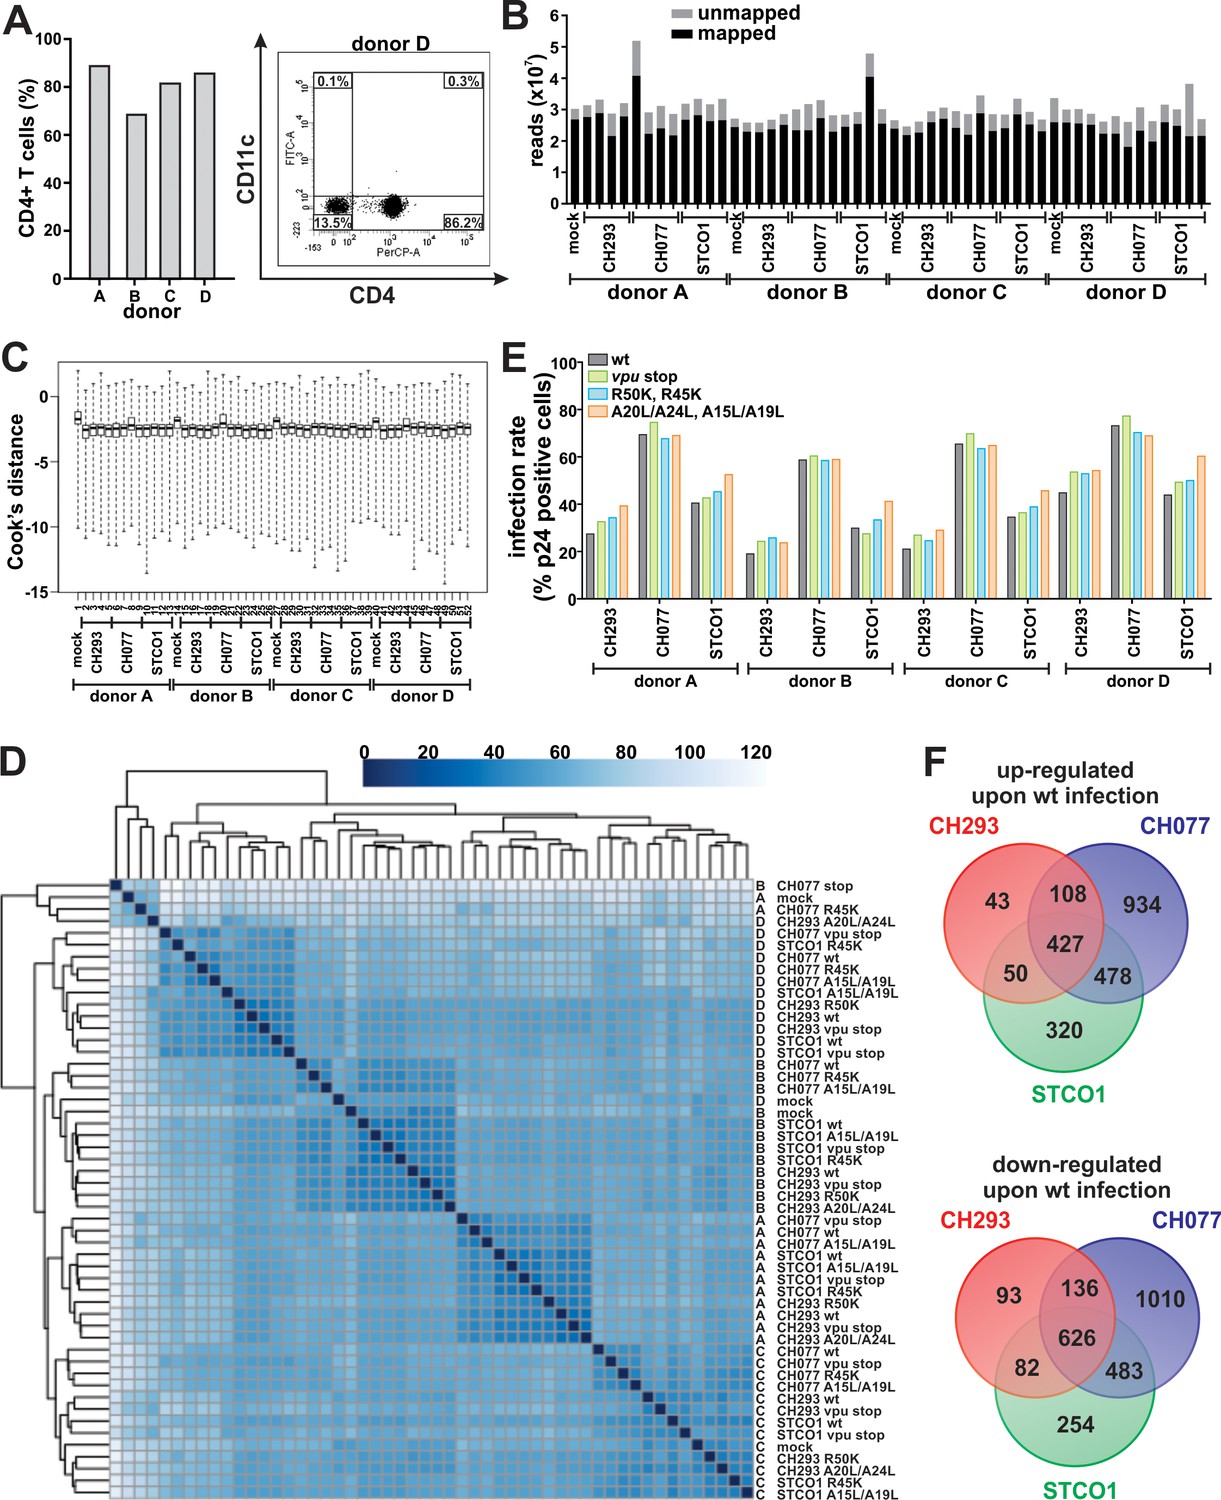
Isolation, infection and RNA sequencing of CD4 +T cells.
(A) Purity of isolated CD4 +T cells. After negative isolation, cells were stained for surface CD4 and CD11c and analyzed by flow cytometry. In the left panel, the percentage of CD4+ (CD11c-) T cells for donors A, B, C and D is shown. An exemplary dot plot of donor D illustrating the gating strategy is shown on the right. (B) Number of reads per sample, unmapped and mapped to the human genome. (C) Cook’s distances of all 52 samples (see Supplementary file 1 for sample identity). (D) Heatmap of the sample distance matrix, showing hierarchical clustering of sample-to-sample distances. (E) Infection rates of CD4 +T cells used for RNA sequencing. CD4 +T cells were infected with the indicated VSV-G pseudotyped HIV-1 strains. Three days post-infection, infection rates were determined by intracellular staining for p24 and subsequent flow cytometric analysis. (F) Venn diagram illustrating the overlap of differentially expressed genes (q < 0.1) for the three viruses analyzed (HIV-1 wt infected vs. mock infected control).
Figure 3 with 1 supplement
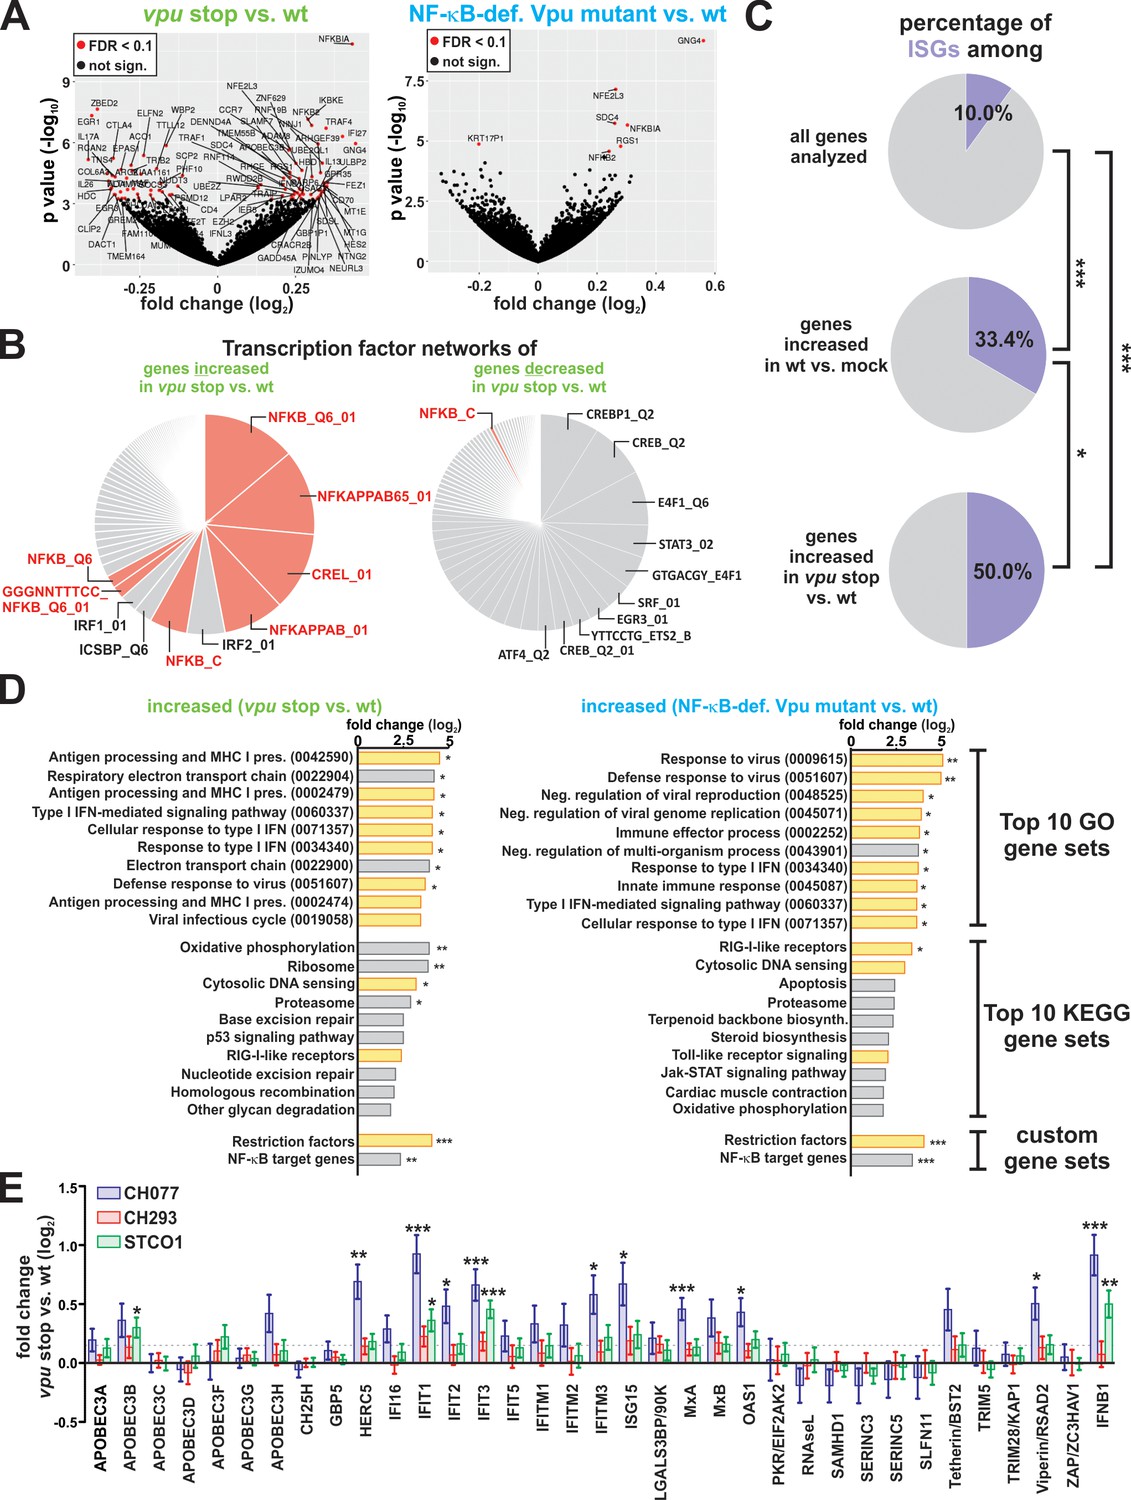
Vpu suppresses the induction of NF-κB-dependent immune responses.
(A) Volcano plots illustrating differentially expressed genes (red) in vpu stop vs. wt (left panel) or NF-κB-def. Vpu mutant vs. wt (right panel) infected CD4 +T cells. (B) Pie charts illustrating the relative size of gene sets that are targeted by a specific transcription factor. Genes whose expression is significantly increased or decreased upon loss of vpu were analyzed in the left and right panel, respectively. NF-κB target gene sets are highlighted in pink. (C) Pie charts illustrating the percentage of ISGs among different gene sets. The analysis is based on a list of ISGs obtained through the interferome v2.1 database (Rusinova et al., 2013) (***p<0.001; *p<0.05; Fisher’s exact test). (D) Top10 KEGG and GO pathways that are induced upon complete loss of Vpu (left panel) or selective loss of Vpu-mediated NF-κB inhibition (right panel). Modulation of two custom-defined gene sets (i.e. Restriction factors and NF-κB target genes) is shown at the bottom. Pathways involved in intrinsic, innate or adaptive immunity are highlighted in yellow. Pathway analysis was performed using GAGE (Luo et al., 2009) (* q < 0.1; ** q < 0.01; *** q < 0.001). (E) n-fold modulation of host restriction factor and IFN-β mRNA levels upon loss of Vpu. Mean values of four independent infections ± SEM are shown. Statistical significance was determined using negative binomial generalized linear models as implemented in DESeq2 (Love et al., 2014) (* q < 0.1; ** q < 0.01; *** q < 0.001). The dotted line indicates the mean change of restriction factor expression upon loss of Vpu.
Figure 3—figure supplement 1
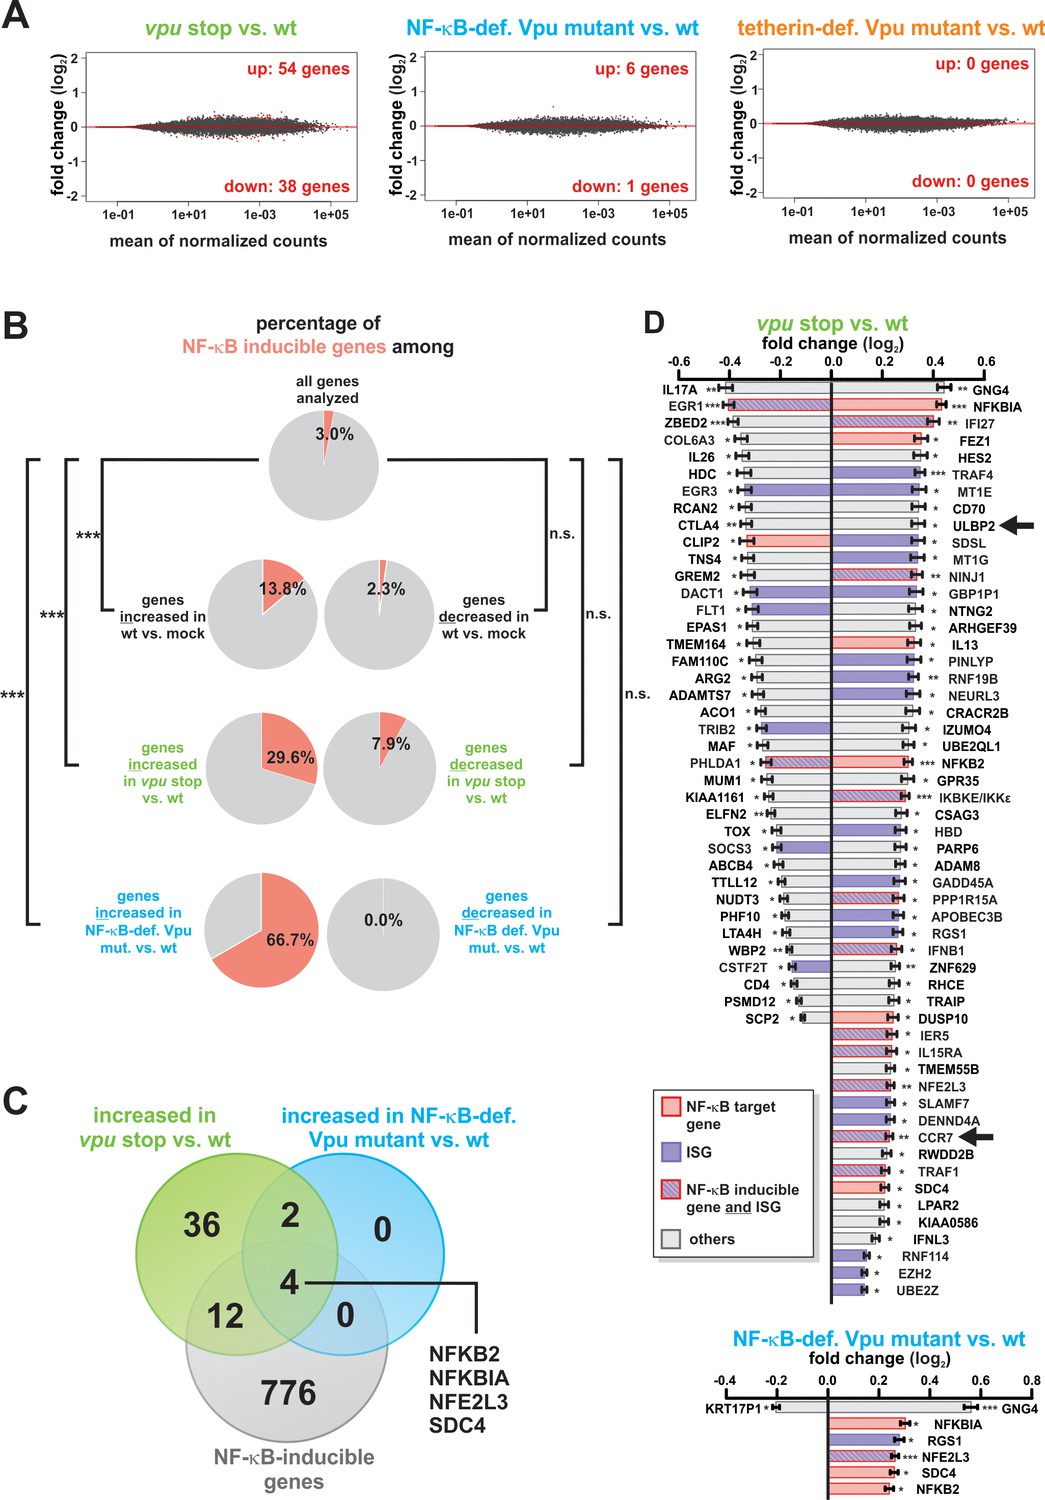
Modulation of NF-κB-dependent gene expression by Vpu.
(A) MA plots illustrating the number of differentially expressed genes (red) between each vpu mutant and wt, using a P value threshold of 0.1 after Benjamini-Hochberg correction. (B) Pie charts illustrating the percentage of known NF-κB target genes among different gene sets. The analysis is based on a list of NF-κB inducible genes obtained through the NF-κB target gene database (70) (***p<0.001; n.s. not significant; Fisher’s exact test). (C) Venn diagram illustrating the overlap of NF-κB inducible genes (70) and genes, whose expression is suppressed by Vpu. (D) Genes that are differentially expressed in vpu stop vs. wt (top panel) or NF-κB-def. Vpu mutant vs. wt (bottom panel) infected CD4 +T cells. NF-κB inducible genes (70) and ISGs (Rusinova et al., 2013) are highlighted in pink and purple, respectively. Statistical significance was determined using negative binomial generalized linear models as implemented in DESeq2 (* q < 0.1; ** q < 0.01; *** q < 0.001) (Love et al., 2014). Arrows highlight previously identified targets of Vpu.
Figure 4 with 1 supplement
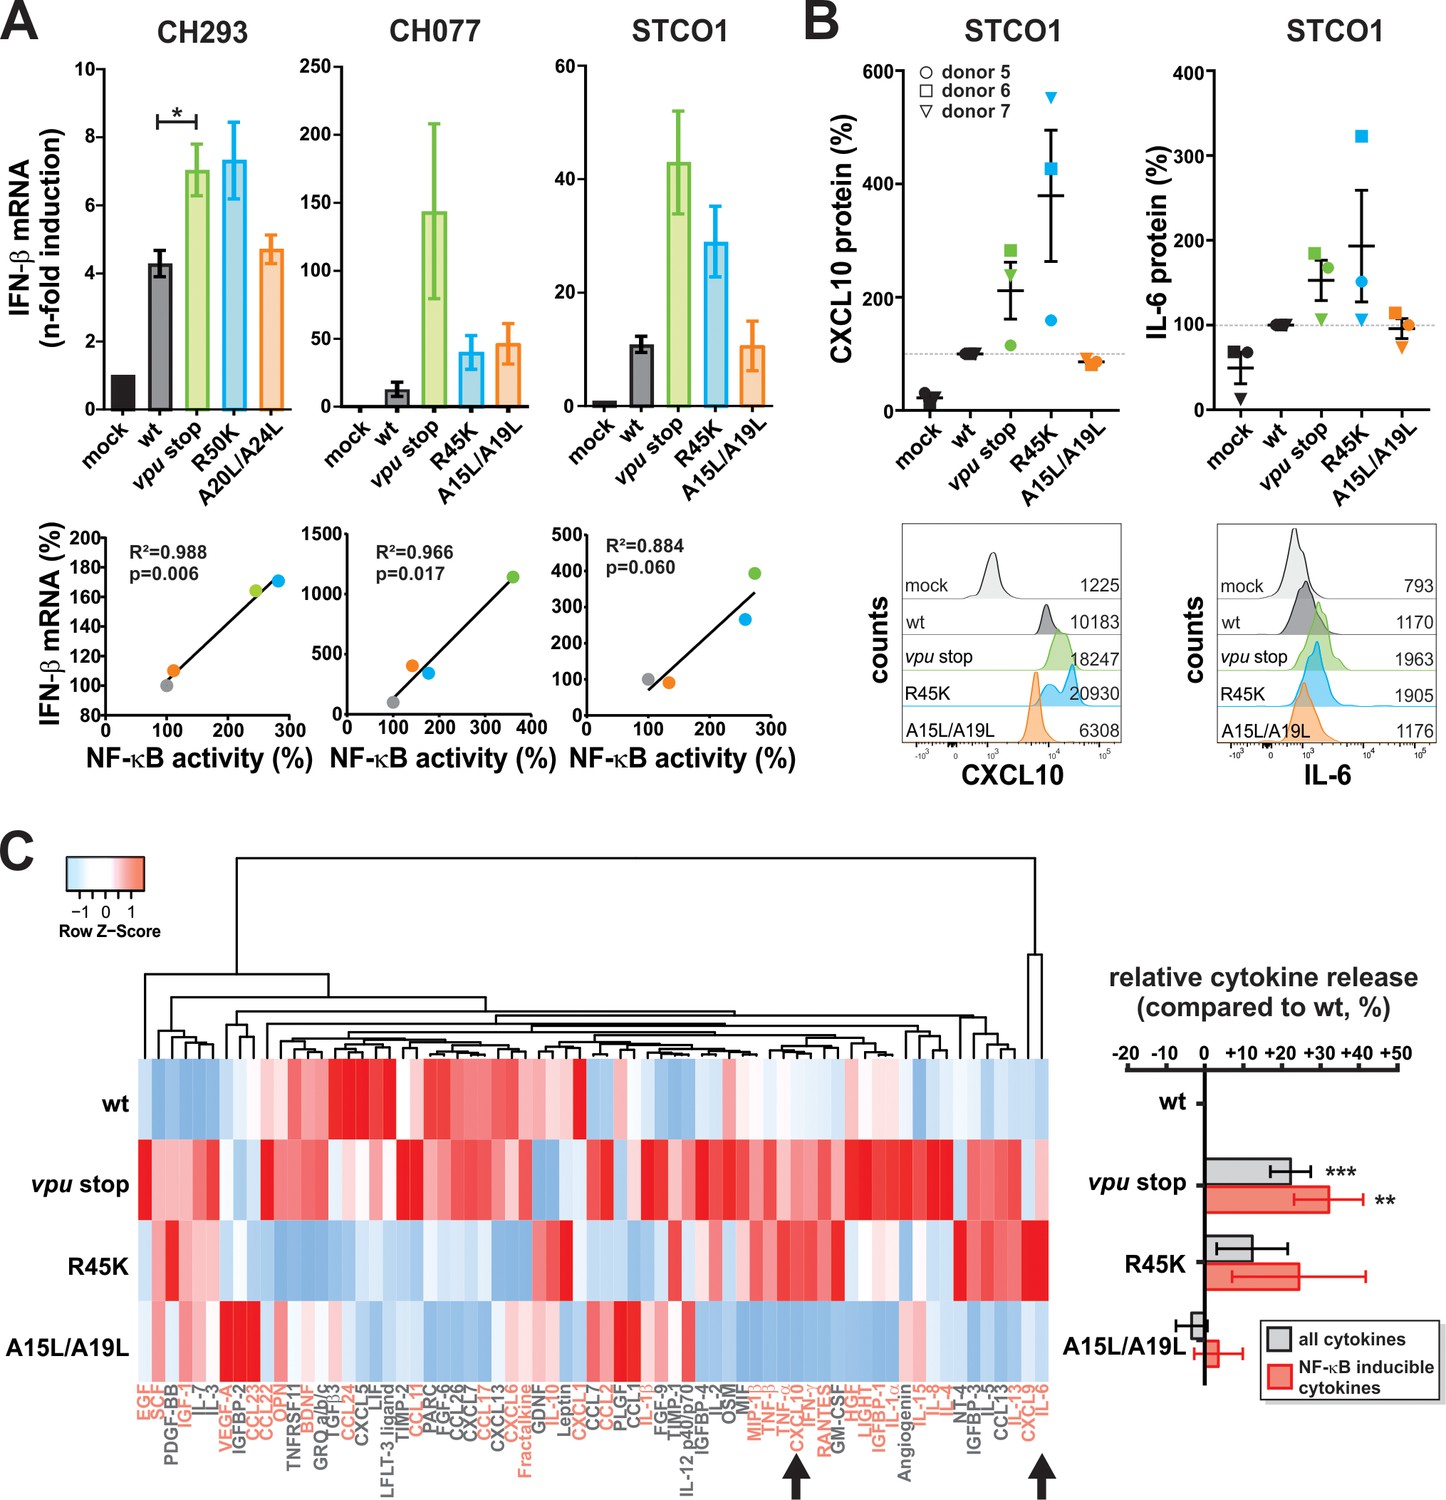
Vpu suppresses pro-inflammatory cytokine production.
(A) Vpu inhibits IFN-β expression. CD4 +T cells were infected with the indicated VSV-G pseudotyped HIV-1 strains. Three days post-infection, IFN-β mRNA levels were quantified by qRT-PCR and normalized to the respective mock control. In the top panels, mean values of three to four independent experiments ± SEM are shown. The bottom panels show correlation analyses of IFN-β mRNA levels and NF-κB activity (determined in Figure 1C) (*p<0.05; RM one-way ANOVA with Greenhouse-Geisser correction and Dunnett’s multiple comparison test). (B) Vpu suppresses release of CXCL10 and IL-6. CD4 +T cells were infected with the indicated VSV-G pseudotyped HIV-1 STCO1 mutants. Three days post-infection, cytokine concentrations in the cell culture supernatant were quantified by flow cytometry using a bead-based immunoassay, in which the analytes are captured between two antibodies. In the top panels, each data point represents results obtained with one of three donors, normalized to the wild type control (100%). Error bars indicate SEM. Representative primary data of one donor are shown in the bottom panels. Numbers indicate mean fluorescence intensity. (C) Vpu exerts broad suppressive effects on cytokine release. CD4 +T cells were infected with the indicated VSV-G pseudotyped HIV-1 STCO1 mutants. Three days post-infection, cytokine release was determined using a cytokine array, based on antibody-coated membranes. The heat map on the left illustrates relative cytokine release and is based on the mean of three independent experiments. Cytokines that were not detectable in more than one donor were omitted from the heat map. Known NF-κB inducible genes (70) are shown in pink. Arrows indicate CXCL10 and IL-6 that were also analyzed in panel (B). Mean changes ± SEM in cytokine release relative to HIV-1 wt are shown in the right panel. (**p<0.01; ***p<0.001; RM one-way ANOVA with Greenhouse-Geisser correction and Dunnett’s multiple comparison test).
Figure 4—figure supplement 1
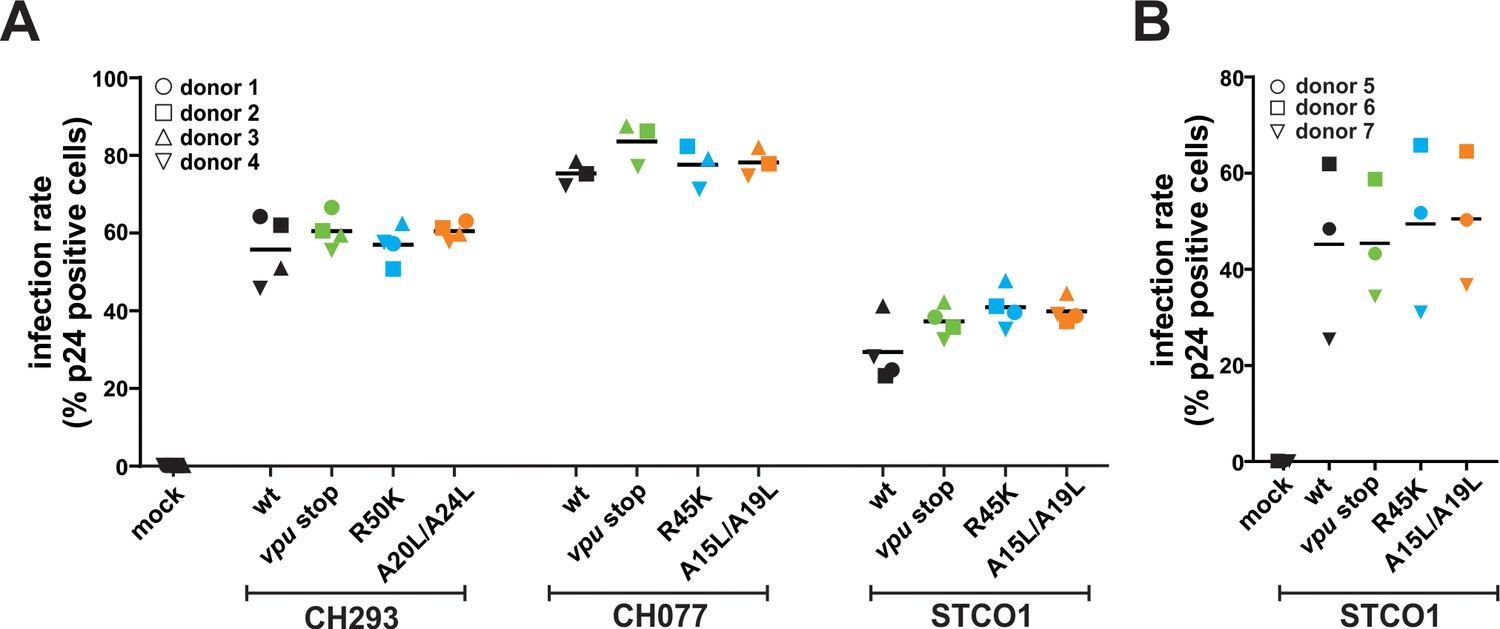
Infection rates of CD4 +T cells.
(A) Infection rates of donors analyzed in Figure 4A. (B) Infection rates of donors analyzed in Figure 4B and C. Human CD4 +T cells were infected with the indicated VSV-G pseudotyped HIV-1 strains. Three days post-infection, infection rates were determined by intracellular staining for p24 and subsequent flow cytometric analysis. Horizontal lines indicate mean values of three to four donors.
Tables
Key resources table
| Reagent type (species) or resource | Designation | Source or reference | Identifiers | Additional information |
|---|---|---|---|---|
| Gene (H. sapiens) | Custom-defined gene set of NF-κB target genes | see Supplementary file 2 of this paper | N/A | |
| Gene (H. sapiens) | Custom-defined gene set of host restriction factors | see Supplementary file 3 of this paper | N/A | |
| Strain, strain background (E. coli) | XL-2 blue | Stratagene | Cat#200150 | |
| Strain, strain background (E. coli) | XL2-Blue MRF’ TM Ultracompetent cells | Agilent Technologies | Cat#200151 | |
| Cell line (H. sapiens) | HEK293T, female | ATCC | Cat#CRL-3216; RRID: CVCL_0063 | |
| Cell line (H. sapiens) | TZM-bl, female | NIH | Cat#8129; RRID: CVCL_B478 | |
| Biological sample (H. sapiens) | peripheral blood mononuclear cells (donors A and C: male; donors B and D: female) | DRK-Blutspendedienst Baden-Württemberg-Hessen, Ulm, Germany | N/A | derived from four healthy donors |
| Antibody | anti-HIV-1 p24 (capsid protein), FITC-conjugated (mouse monoclonal) | Beckman Coulter | Cat#6604665; RRID: AB_1575987 | FACS (1:25) |
| Antibody | anti-BST-2/tetherin, APC-conjugated (mouse monoclonal) | Biolegend | Cat#348410; RRID:AB_2067121 | FACS (1:20) |
| Antibody | anti-Human CD4, PerCP-conjugated (mouse monoclonal) | BD Pharmingen | Cat#550631; RRID:AB_393791 | FACS (1:12.5) |
| Antibody | anti-CD11c [3.9], FITC-conjugated (mouse monoclonal) | Abcam | Cat#ab82445-100; RRID:AB_1859733 | FACS (1:12.5) |
| Antibody | anti-CD11c [BU15], FITC-conjugated (mouse monoclonal) | Abcam | Cat#ab22540 | FACS (1:5) |
| Antibody | IgG1, κ, APC-conjugated (mouse) | Biolegend | Cat#400122; RRID:AB_326443 | FACS (1:20) |
| Antibody | HIV-1 subtype C serum | NIH | Cat#11942 | WB (1:5000) |
| Antibody | HIV-1 NL4-3 Vpu antiserum | N/A | N/A | WB (1:500); kindly provided by S. Bolduan |
| Antibody | Anti-HIV1 p24 antibody [39/5.4A] | Abcam | Cat#ab9071; RRID:AB_306981 | WB (1:5000) |
| Antibody | Purified anti-GAPDH antibody | Biolegend | Cat#607902; RRID:AB_2734503 | WB (1:1000) |
| Antibody | IRDye 800CW Goat anti-Mouse IgG (H + L) | LI-COR | Cat#926–32210; RRID:AB_621842 | WB (1:20000) |
| Antibody | IRDye 680RD Goat anti-Rabbit IgG (H + L) | LI-COR | Cat#925–68071; RRID:AB_2721181 | WB (1:20000) |
| Antibody | IRDye 800CW Goat anti-Rat IgG (H + L) | LI-COR | Cat#925–32219; RRID:AB_2721932 | WB (1:20000) |
| Antibody | anti-HIV-1 p24 (mouse monoclonal) | Abcam | Cat#ab9071; RRID:AB_306981 | IF (1:500) |
| Antibody | anti-p65 (rabbit polyclonal IgG) | Santa Cruz | Cat#sc-372; RRID:AB_632037 | IF (1:150) |
| Antibody | Donkey anti-Mouse IgG (H + L), AF647- conjugated | Thermo Scientific | Cat#A31571; RRID:AB_162542 | IF (1:350) |
| Antibody | Goat anti-Rabbit IgG (H + L), AF568- conjugated | Thermo Scientific | Cat#A11011; RRID:AB_143157 | IF (1:350) |
| Recombinant DNA reagent | pBR322_HIV-1 M subtype B STCO1 wt (plasmid) | PMID: 23542380 | N/A | kindly provided by B. Hahn |
| Recombinant DNA reagent | pBR322_HIV-1 M subtype B STCO1 vpu stop (plasmid) | PMID: 27531907 | N/A | |
| Recombinant DNA reagent | pBR322_HIV-1 M subtype B STCO1 Vpu R45K (plasmid) | PMID: 29324226 | N/A | |
| Recombinant DNA reagent | pBR322_HIV-1 M subtype B STCO1 Vpu A15L/A19L (plasmid) | PMID: 27531907 | N/A | |
| Recombinant DNA reagent | pUC57rev_HIV-1 M subtype C CH293 w8 wt (plasmid) | PMID: 23542380 | N/A | kindly provided by B. Hahn |
| Recombinant DNA reagent | pUC57rev_HIV-1 M subtype C CH293 w8 vpu stop (plasmid) | PMID: 2562070 | N/A | |
| Recombinant DNA reagent | pUC57rev_HIV-1 M subtype C CH293 w8 Vpu R50K (plasmid) | this paper | N/A | derived from pUC57rev_HIV-1 M subtype C CH293 w8 wt (plasmid) |
| Recombinant DNA reagent | pUC57rev_HIV-1 M subtype C CH293 w8 Vpu A20L/A24L (plasmid) | this paper | N/A | derived from pUC57rev_HIV-1 M subtype C CH293 w8 wt (plasmid) |
| Recombinant DNA reagent | pCR-XL-TOPO_HIV-1 M subtype B CH077 wt (plasmid) | PMID: 22190722 | N/A | kindly provided by B. Hahn |
| Recombinant DNA reagent | pCR-XL-TOPO_HIV-1 M subtype B CH077 vpu stop (plasmid) | PMID: 27531907 | N/A | |
| Recombinant DNA reagent | pCR-XL-TOPO_HIV-1 M subtype B CH077 Vpu R45K (plasmid) | this paper | N/A | derived from pCR-XL-TOPO_HIV-1 M subtype B CH077 wt (plasmid) |
| Recombinant DNA reagent | pCR-XL-TOPO_HIV-1 M subtype B CH077 Vpu A15L/A19L (plasmid) | PMID: 27531907 | N/A | |
| Recombinant DNA reagent | p_human IKKβ, constitutively active mutant (S177E, S181E) (plasmid) | PMID: 23552418 | N/A | kindly provided by B. Baumann |
| Recombinant DNA reagent | p_NF-κB(3x)-Firefly Luciferase (plasmid) | PMID: 23552418 | N/A | kindly provided by B. Baumann |
| Recombinant DNA reagent | pTAL_Gaussia Luciferase (plasmid) | PMID: 23552418 | N/A | |
| Recombinant DNA reagent | pCG_human Tetherin IRES DsRed2 (plasmid) | PMID: 19917496 | N/A | |
| Recombinant DNA reagent | pHIT-G_VSV-G (vesicular stomatitis virus glycoprotein) (plasmid) | PMID: 9303297 | N/A | |
| Sequence- based reagent | Primers used for mutagenesis of vpu | see Supplementary file 4 of this paper | N/A | |
| Sequence- based reagent | TaqMan Gene Expression Assay for IFN-beta | Thermo Fisher Scientific | Cat#Hs01077958_s1 | |
| Sequence- based reagent | Human GAPD (GAPDH) Endogenous Control (VIC/TAMRA probe, primer limited) | Thermo Fisher Scientific | Cat#4310884E | |
| Peptide, recombinant protein | IRDye 800CW streptavidin, 0.5 mg | LI-COR | Cat#926–32230 | |
| Commercial assay or kit | GalScreen | Applied Bioscience | Cat#T1027 | |
| Commercial assay or kit | PrimeScript RT-PCR Kit | TAKARA | Cat#RR014A | |
| Commercial assay or kit | RNeasy Plus Mini kit | QIAGEN | Cat#74136 | |
| Commercial assay or kit | RosetteSep Human CD4 + T Cell Enrichment Cocktail | Stem Cell Technologies | Cat#15062 | |
| Commercial assay or kit | Luciferase Assay System 10-pack | Promega | Cat#E1501 | |
| Commercial assay or kit | LEGENDplex Human Anti-Virus Response Panel | BioLegend | Cat#740390 | |
| Commercial assay or kit | RayBio C-Series Human Cytokine Antibody Array C5 | RayBiotech | Cat#AAH-CYT-5–8 | |
| Commercial assay or kit | FIX and PERM Kit (CE-IVD) (1000 Tests) | Nordic-MUbio | Cat#GAS-002–1 | |
| Commercial assay or kit | DNA-free DNA Removal Kit | ThermoFisher Scientific | Cat#AM1906 | |
| Commercial assay or kit | QuikChange II XL Site-Directed Mutagenesis Kit | Agilent | Cat#200522 | |
| Commercial assay or kit | TruSeq Stranded mRNA Sample Prep Kit | illumina | Cat#RS-122–2101 | |
| Commercial assay or kit | Thermo Script RT-PCR system | Invitrogen | Cat#11146–016 | |
| Commercial assay or kit | Signal Enhancer HIKARI kit for Western Blotting and ELISA | Nacalai Tesque | Cat#02267–41 | |
| Chemical compound, drug | Human IL-2 IS, premium grade | MACS Miltenyi Biotec | Cat#130-097-745 | |
| Chemical compound, drug | Remel PHA purified | ThermoFisher Scientific | Cat#R30852801 | |
| Chemical compound, drug | Recombinant human TNFα | Sigma Aldrich | Cat#H8916-10UG | |
| Chemical compound, drug | DAPI | Sigma Aldrich | Cat#D9542-1MG | |
| Software, algorithm | BD FACSDiva Version 8.0 | BD Biosciences | https://www.bdbiosciences.com; RRID: SCR_001456 | |
| Software, algorithm | Corel DRAW 2017 | Corel Corporation | https://www.coreldraw.com/ | |
| Software, algorithm | GraphPad Prism Version 5.03 | GraphPad Software, Inc. | https://www.graphpad.com; RRID: SCR_002798 | |
| Software, algorithm | ImageJ | Open source | http://imagej.nih.gov/ij/ | |
| Software, algorithm | LI-COR Image Studio Lite Version 3.1 | LI-COR | www.licor.com/; RRID: SCR_013715 | |
| Software, algorithm | FlowJo_V10 | Tree Star, Inc. | https://www.flowjo.com | |
| Software, algorithm | ZEN | Zeiss | https://www.zeiss.com/microscopy/int/products/microscope-software/zen.html; RRID:SCR_013672 | |
| Software, algorithm | Fiji | Open source (Max Planck Institute of Molecular Cell Biology and genetics, Dresden, Germany) | https://imagej.net/Fiji; RRID:SCR_002285 | |
| Software, algorithm | GeneMANIA | Open source | http://genemania.org/ | |
| Software, algorithm | Heatmapper | Open source | http://www2.heatmapper.ca/expression/ | |
| Software, algorithm | R | Open source | https://www.r-project.org/ | |
| Software, algorithm | Kallisto | PMID: 27043002 | https://pachterlab.github.io/kallisto/ | |
| Software, algorithm | DESeq2 | PMID: 25516281 | https://bioconductor.org/packages/release/bioc/html/DESeq2.html | |
| Software, algorithm | GAGE | PMID: 19473525 | https://bioconductor.org/packages/release/bioc/html/gage.html | |
| Software, algorithm | StepOne and StepOnePlus Software v2.3 | Thermo Fisher Scientific | https://www.thermofisher.com/de/de/home/technical-resources/software-downloads/StepOne-and-StepOnePlus-Real-Time-PCR-System.html | |
| Other | Rel/NF-κB target gene database | Open source | http://bioinfo.lifl.fr/NF-KB/ | |
| Other | RNAseq Data | this paper | GEO accession GSE117655 | |
| Other | Interferome database | PMID: 23203888 | http://www.interferome.org/interferome/home.jspx |
Additional files
-
Supplementary file 1
Identity and integrity of RNA-Seq samples.
- https://doi.org/10.7554/eLife.41930.012
-
Supplementary file 2
Custom-defined gene set of NF-κB target genes.
- https://doi.org/10.7554/eLife.41930.013
-
Supplementary file 3
Custom-defined gene set of host restriction factors.
- https://doi.org/10.7554/eLife.41930.014
-
Supplementary file 4
Primers used for mutagenesis of vpu
- https://doi.org/10.7554/eLife.41930.015
-
Transparent reporting form
- https://doi.org/10.7554/eLife.41930.016
Download links
A two-part list of links to download the article, or parts of the article, in various formats.
Downloads (link to download the article as PDF)
Open citations (links to open the citations from this article in various online reference manager services)
Cite this article (links to download the citations from this article in formats compatible with various reference manager tools)
HIV-1 Vpu is a potent transcriptional suppressor of NF-κB-elicited antiviral immune responses
eLife 8:e41930.
https://doi.org/10.7554/eLife.41930


