Analysis of the genomic architecture of a complex trait locus in hypertensive rat models links Tmem63c to kidney damage
- Charité - Universitätsmedizin Berlin, corporate member of Freie Universität Berlin, Humboldt-Universität zu Berlin, Germany
- Institute of Clinical Pharmacology and Toxicology, Berlin Institute of Health, Germany
- Max Delbrück Center for Molecular Medicine in the Helmholtz Association, Electrochemical Signaling in Development and Disease, Germany
- Leiden University Medical Center (LUMC), The Netherlands
- Westfälische Wilhelms University, Genetic Epidemiology, Institute for Human Genetics, Germany
- Max Delbrück Center for Molecular Medicine in the Helmholtz Association, Core Facility Electron Microscopy, Germany
- Max Delbrück Center for Molecular Medicine in the Helmholtz Association, Advanced Light Microscopy, Germany
- Center for Human Disease Modeling, Duke University School of Medicine, United States
- DZHK (German Centre for Cardiovascular Research), Partner site Berlin, Germany
- Maastricht University, Genetic Epidemiology and Statistical Genetics, The Netherlands
Figures
Figure 1
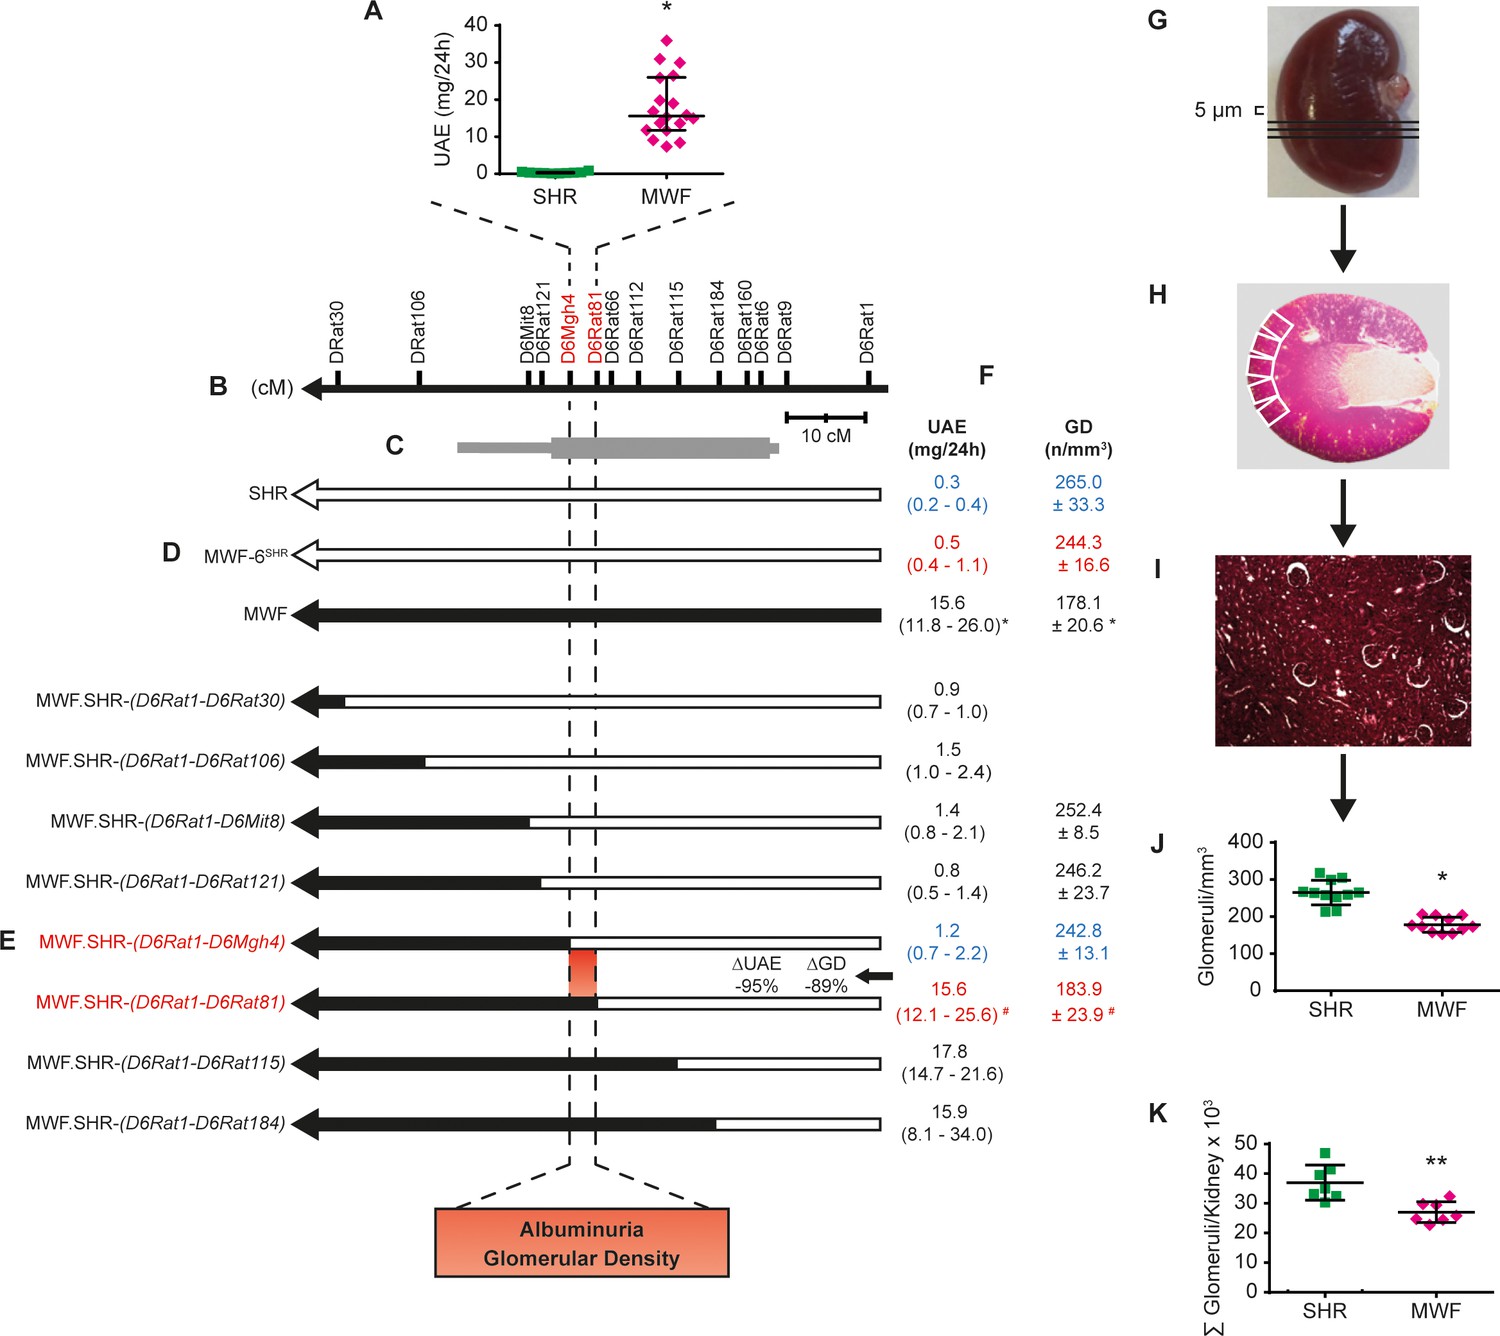
Congenic substitution mapping of the albuminuria and nephron deficit QTL on rat chromosome 6.
(A) Urinary albumin excretion (UAE) in Munich Wistar Frömter (MWF) and spontaneously hypertensive rats (SHR) at 8 weeks of age. MWF (n = 18); SHR (n = 10); values plotted: median ±interquartile range (IQR); Mann-Whitney U test; *p<0.0001. (B) Genetic map of RNO6 with genetic markers and distance in centi Morgan (cM). (C) 1-LOD (thick bar) and 2-LOD (thin bar) confidence intervals for placement of the albuminuria QTL by linkage mapping. (D) The chromosomal fragment for the MWF (black) and SHR (white) genome are indicated for the MWF (n = 18/11§), consomic MWF-6SHR (n = 19/11§), and SHR (n = 10/11§) strains. (E–F) The chromosomal fragment for congenic strains designated as MWF.SHR-(D6Rat1-D6Rat184) (n = 17/0§), MWF.SHR-(D6Rat1-D6Rat115) (n = 10/0§), MWF.SHR-(D6Rat1-D6Rat81) (n = 25/11§), MWF.SHR-(D6Rat1-D6Mgh4) (n = 24/11§), MWF.SHR-(D6Rat1-D6Rat121) (n = 29/6§), MWF.SHR-(D6Rat1-D6Mit8) (n = 18/6§), MWF.SHR-(D6Rat1-D6Rat106) (n = 10/0§), and MWF.SHR-(D6Rat1-D6Rat30) (n = 10/0§) (E). Corresponding phenotypes for UAE and glomerular density (GD) (F). Red values indicate disease phenotypes and blue values an amelioration of phenotypes for informative strains. § n is presented for the phenotypes in the following order UAE/GD; values shown for UAE: median ±IQR, Kruskall-Wallis test with Dunn’s multiple comparisons test; *p<0.0001; values shown for GD: mean ±SD; one-way ANOVA with post hoc Bonferroni’s multiple comparisons test and Mann-Whitney U test; *p<0.0001 vs. SHR, MWF-6SHR, MWF.SHR-(D6Rat1-D6Mgh4), respectively; #p<0.0001 vs. MWF.SHR-(D6Rat1-D6Mgh4), respectively; ##p=0.029 vs. MWF.SHR-(D6Rat1-D6Rat30). (G–K) Evaluation of nephron deficit in MWF and SHR rats by determination of GD. Right kidneys at 4 weeks of age were cut into 5 µm thick histological sections (G). For evaluation of glomerular diameter and glomerular number adjacent pictures were taken for each periodic acid-Schiff (PAS) stained histological section (white rectangles) (H). Calculation of GD (10x magnification) (I). Direct comparison of GD evaluation (J) vs. total glomerular number as previously estimated by the physical fractionator method (K). Total glomerular number (n = 7 each); GD (n = 11 each); values plotted: mean ±SD; two-tailed student’s t-test; *p<0.0001 vs. SHR; **p=0.0024 vs. SHR.
-
Figure 1—source data 1
Albuminuria in parental, consomic, and congenic rat strains.
- https://doi.org/10.7554/eLife.42068.004
-
Figure 1—source data 2
Glomerular density and total nephron number in parental, consomic, and congenic rat strains.
- https://doi.org/10.7554/eLife.42068.005
Figure 2
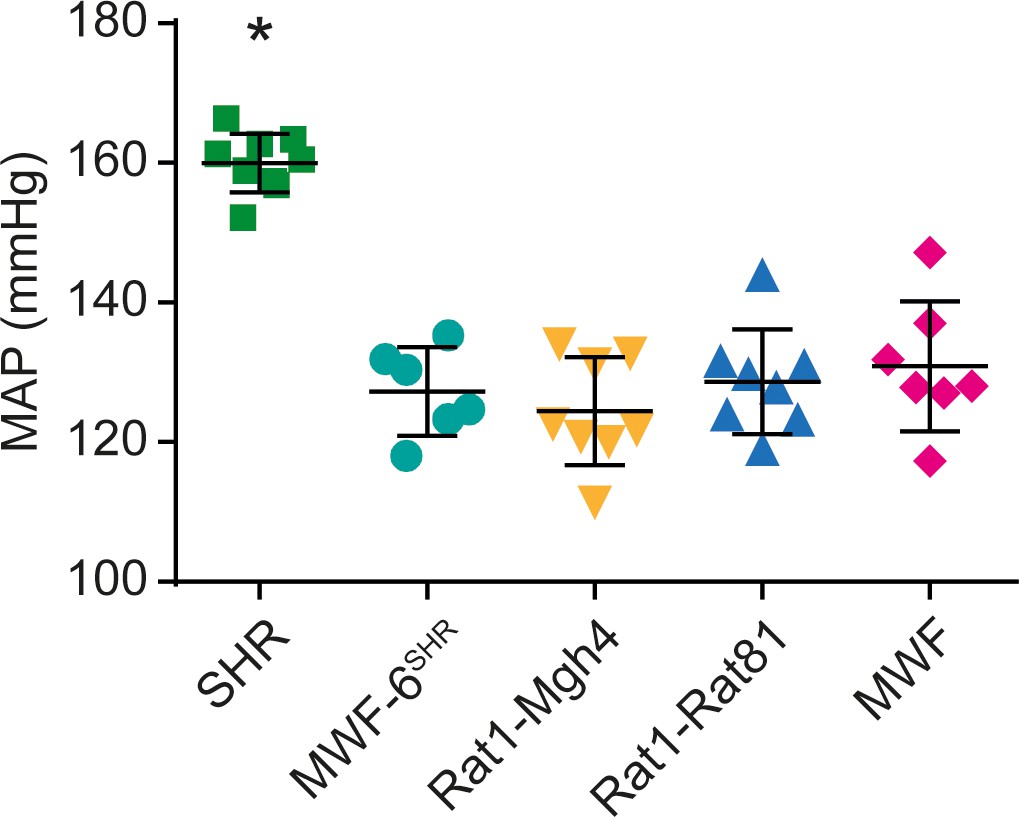
Mean arterial blood pressure (MAP) in consomic and congenic rat strains.
Measurement of MAP is shown for SHR (n = 9), MWF-6SHR (n = 6), congenic MWF.SHR-(D6Rat1-D6Mgh4) (Rat1-Mgh4, n = 8) and congenic MWF.SHR-(D6Rat1-D6Rat81) (Rat1-Rat81, n = 8) and MWF (n = 7) at week 14; values plotted: mean ±SD; one-way ANOVA with Bonferroni’s post hoc analysis; *p<0.0001 vs. other strains, respectively.
-
Figure 2—source data 1
Mean Arterial Pressure in parental, consomic, and congenic rat strains.
- https://doi.org/10.7554/eLife.42068.007
Figure 3 with 1 supplement
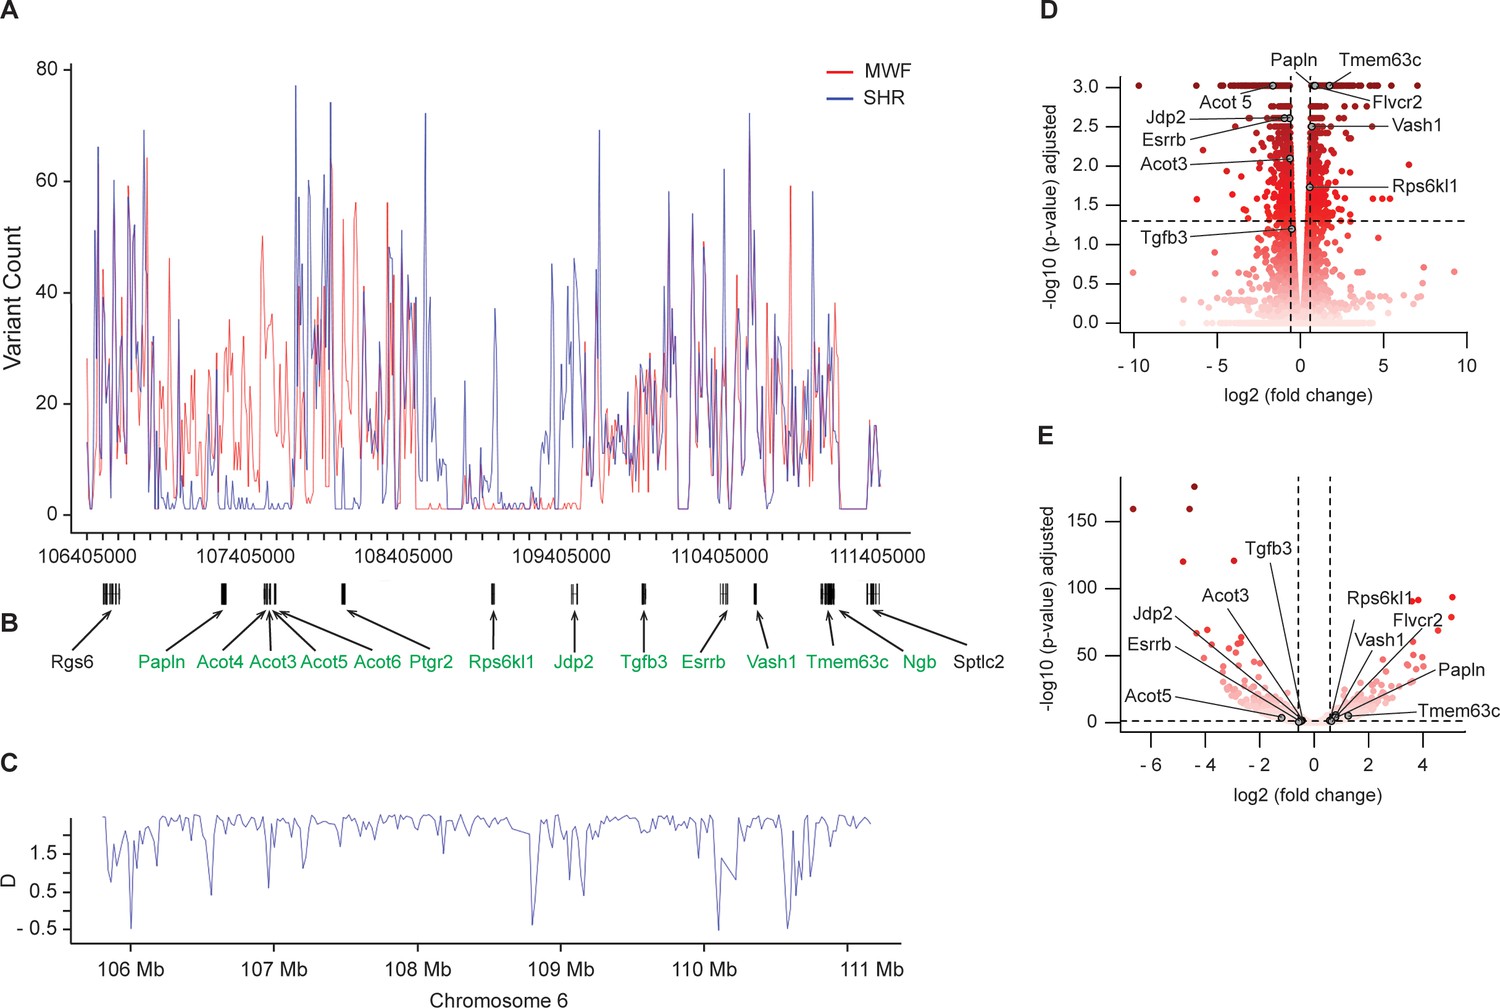
Next-generation sequencing (NGS) analysis of the kidney damage region on rat chromosome 6 and RNA sequencing (RNA-Seq) analysis in isolated glomeruli.
(A–B) DNA sequencing (DNA-Seq) analysis revealed the numbers of DNA variants in comparison to the reference genome across the sequenced region for the Munich Wistar Frömter (MWF) and spontaneously hypertensive rat (SHR) strains (n = 3, each) (A). The physical map between nucleotide position 106,405,000 and 111,405,000 is shown together with positions of potential candidate genes (in green) (B); in addition, the two genes at the 5’-position and 3’-position of the candidate region are visualized in black. (C) The Tajima’s D variation across the sequenced region. (D–E) Volcano plots illustrating the differential expression results (MWF vs. SHR) in RNA-Seq analysis in isolated glomeruli using the Cuffdiff (D) and DESeq2 (E) analysis tools. For each gene, the log10 transformed differential expression P-value adjusted for false discovery rate is plotted against the log2 transformed expression fold change. The color gradient refers to the P-values given on the y-axis. The applied significance threshold of adjusted p-value<0.05 is indicated as dashed horizontal line. Dashed vertical lines indicate fold changes > 1.5. Genes of interest are highlighted in grey and are annotated with gene symbols. (See Figure 3—figure supplement 1).
-
Figure 3—source data 1
Predicted effects of variants identified by NGS in the candidate region on rat chromosome 6 in human.
- https://doi.org/10.7554/eLife.42068.010
Figure 3—figure supplement 1
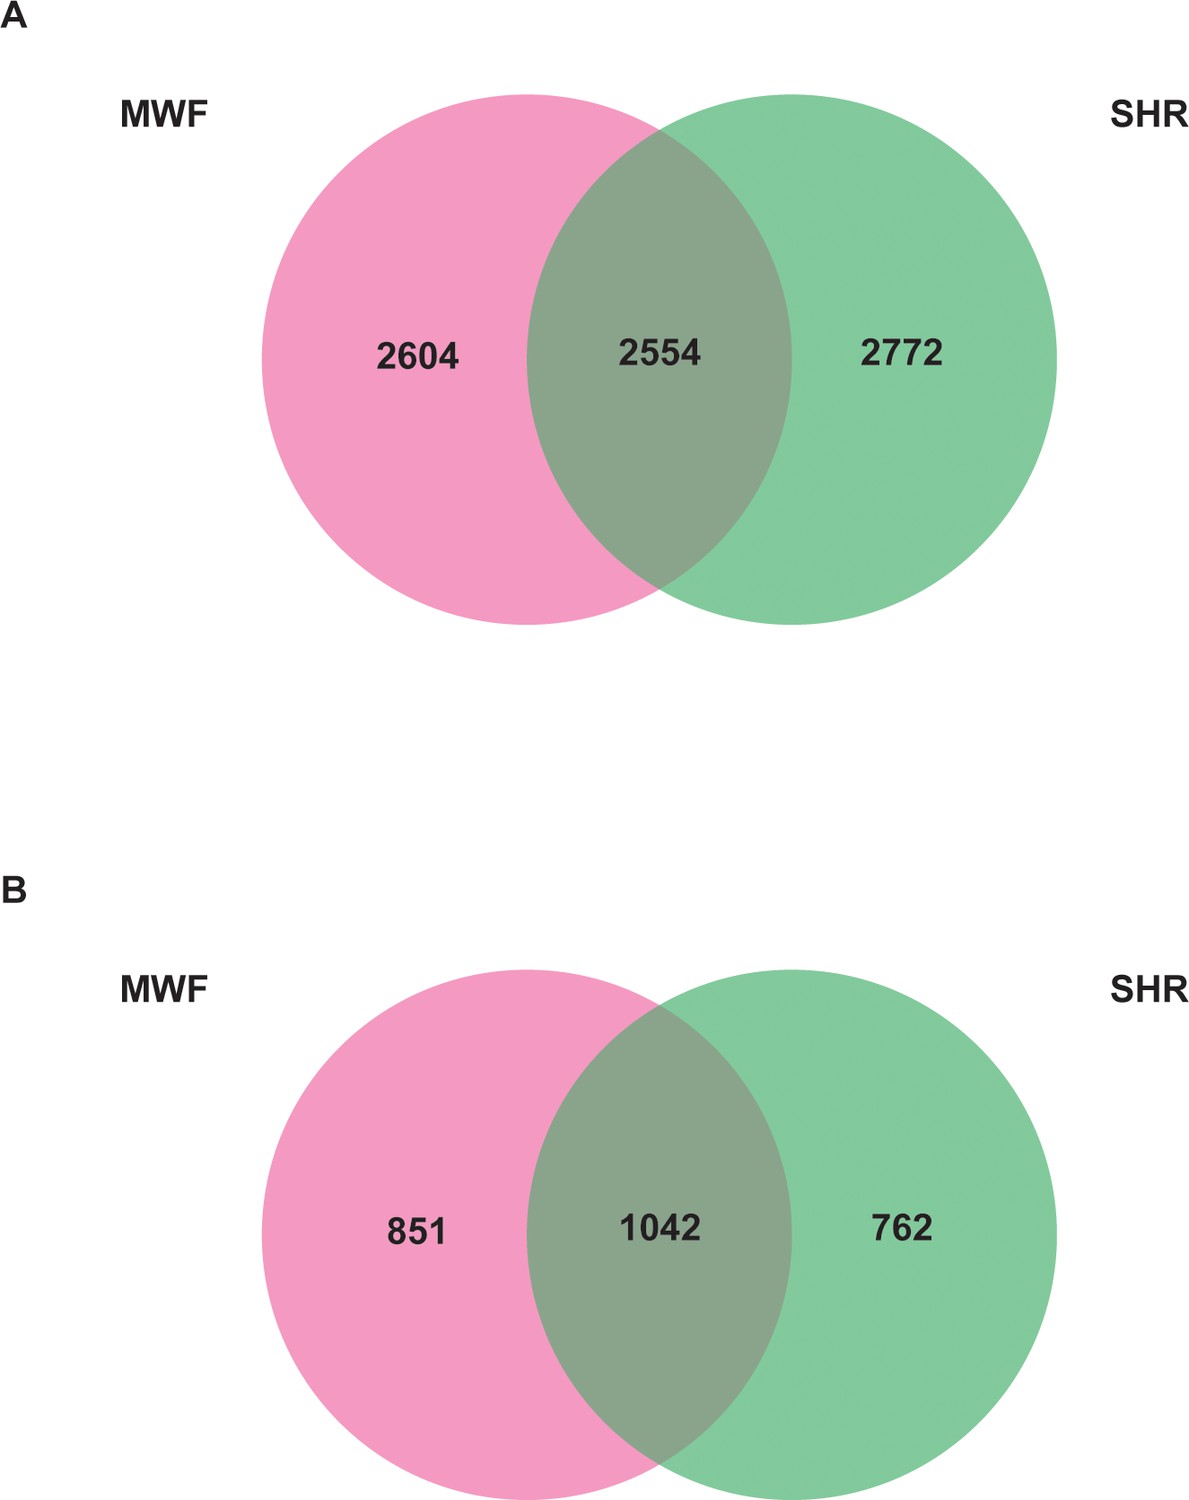
Venn diagram of NGS analysis.
(A–B) The number of SNPs (A) and small insertions and deletions (INDELs) (B) are given in the Munich Wistar Frömter (MWF) and spontaneously hypertensive rat (SHR) strains (n = 3, each) in comparison to the reference genome. The numbers in the intersection refer to the variants that are common between MWF and SHR.
Figure 4
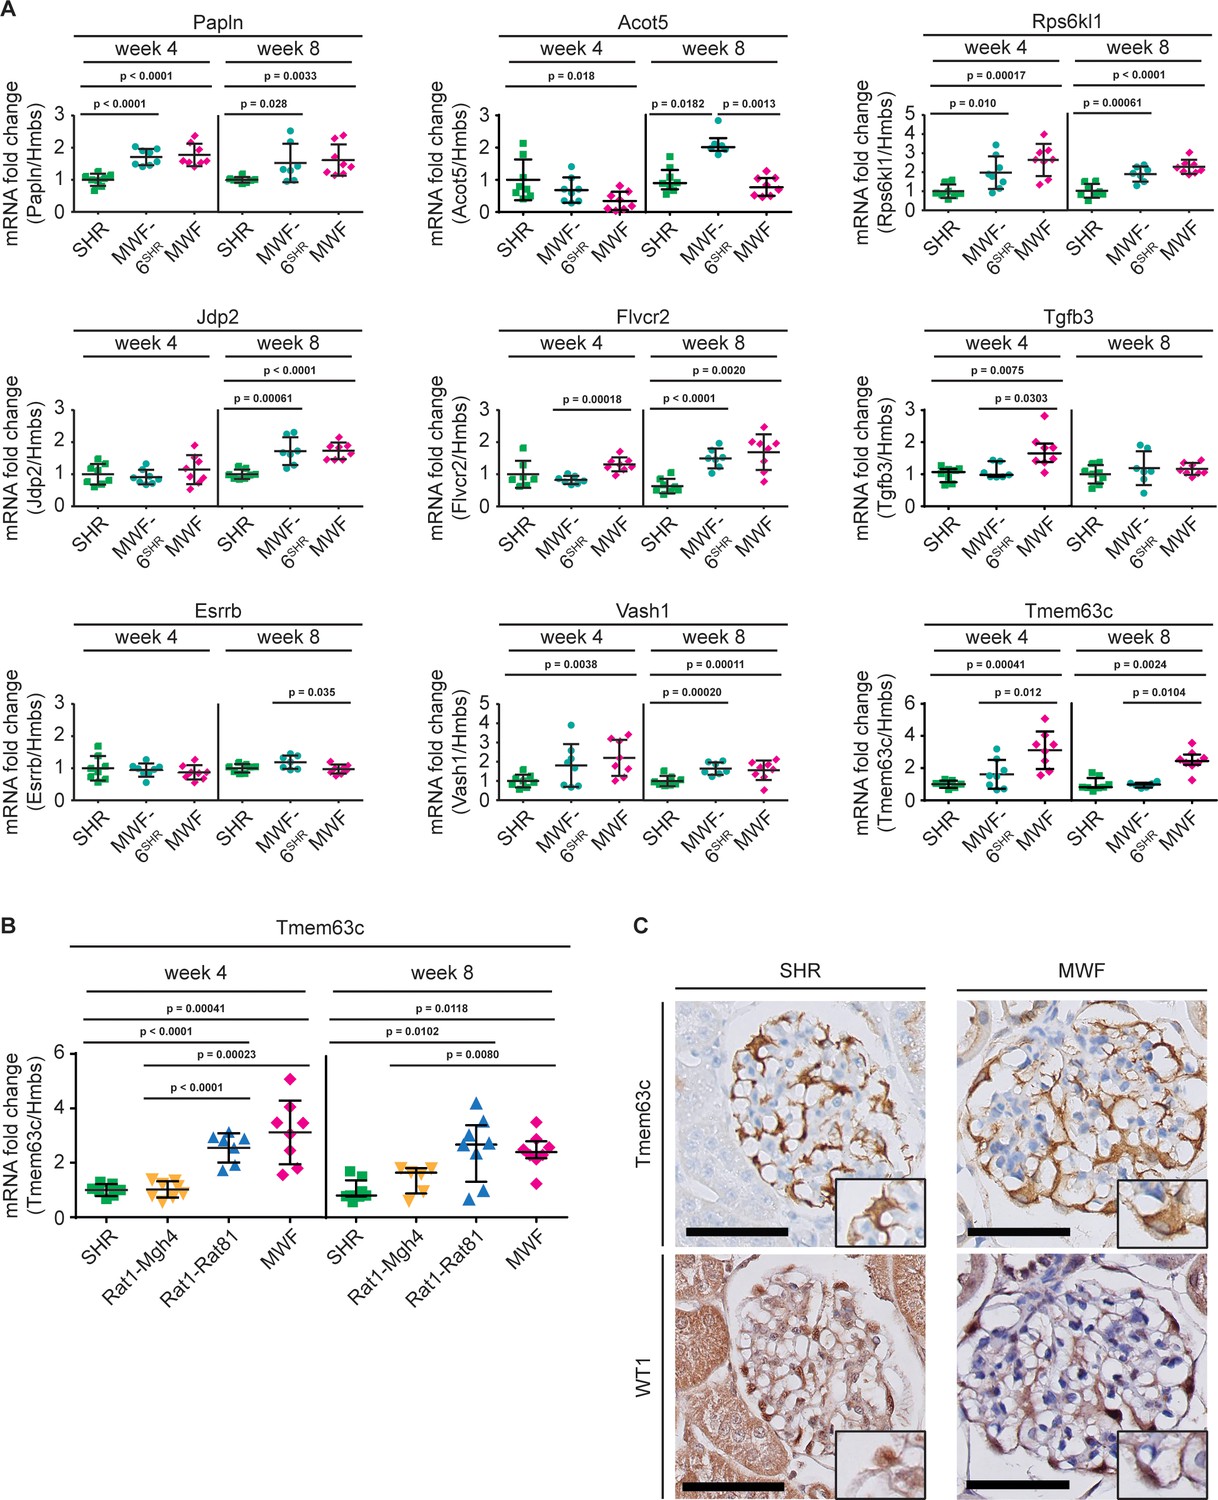
Validation of differentially expressed genes in isolated glomeruli by quantitative real-time PCR (qPCR) analysis.
(A) qPCR analysis showed no consistent differential expression for eight genes from overall 10 genes identified with differential expression in RNA sequencing (RNA-Seq) analysis (Table 3) between parental Munich Wistar Frömter (MWF), spontaneously hypertensive rats (SHR), and consomic MWF-6SHR during the crucial time window for onset of albuminuria between weeks 4 and 8. Only transmembrane protein 63c (Tmem63c) demonstrated differential mRNA expression at both time points. Acyl-CoA thioesterase 3 (Acot3) (Table 3) showed very low mRNA expression in qPCR analysis precluding quantitative analysis. Consequently, Acot3 and the genes shown were excluded from and Tmem63c was included for further functional analysis. Rats per strain (n = 7–8, each); values for Acot5 (week 8),Tgfb3 (week 4) and Tmem63c (week 8) are plotted as median ±IQR, while the rest of data are plotted as mean ±SD; data for Acot5 (week 8), Tgfb3 (week 4) and Tmem63c (week 8) were analyzed using Kruskal-Wallis test with Dunn’s post-hoc analysis and Mann-Whitney U test, while the rest of data was analyzed by one-way ANOVA with Bonferroni’s post hoc analysis and Mann-Whitney U test. (B) mRNA expression analysis for Tmem63c in isolated glomeruli by qPCR analysis is shown for MWF, SHR, congenic MWF.SHR-(D6Rat1-D6Mgh4) (Rat1-Mgh4) and congenic MWF.SHR-(D6Rat1-D6Rat81) (Rat1-Rat81), at week 4 and week 8. Rats per strain (n = 6–8, each); data for week 8 are plotted as median ±IQR and analyzed using Kruskal-Wallis test with Dunn’s post hoc analysis and Mann-Whitney U test; the other data are plotted as mean ±SD and analyzed by one-way ANOVA with Bonferroni’s post hoc analysis and Mann-Whitney U test (C) Representative immunohistochemical stainings of TMEM63C and Wilms tumor 1 (WT1) on kidney sections from SHR and MWF at 8 weeks of age; the insert indicates expression in podocytes. Scale bar = 50 µm. Quantitative analysis of TMEM63C intensity in podocytes using one-way ANOVA revealed lower intensity in MWF (n = 7) vs. SHR (n = 6) at 8 weeks (p=0.0032).
-
Figure 4—source data 1
Quantitative real-time PCR analysis of differentially expressed genes in isolated glomeruli between rat strains.
- https://doi.org/10.7554/eLife.42068.014
-
Figure 4—source data 2
Primer list for quantitative real-time PCR analysis.
- https://doi.org/10.7554/eLife.42068.015
Figure 5

Transmembrane protein 63c (TMEM63C) protein and Nephrin expression deficiency in patients with focal segmental glomerulosclerosis (FSGS).
(A–D) High-intensity TMEM63C staining in a glomerulus of a healthy human control subject (A) and representative glomeruli of FSGS patients with high (+++) (B), intermediate (+) TMEM63C staining intensity (C), or loss (-) of TMEM63C protein expression (D). The inserts indicate TMEM63C-positive podocytes. Scale bar = 50 µm. (E) Scoring of the TMEM63C staining intensity in controls (n = 11) and FSGS patients (n = 9). Percentage of cases with high intensity (green); intermediate intensity (blue); low intensity (yellow) and no TMEM63C staining (magenta). Linear-by-Linear association; p=0.005. (F) Scoring of the percentage of TMEM63C positivity in glomeruli. Green: no loss; blue:<25% loss; yellow: 25–50% loss; magenta:>50% loss of TMEM63C expression. Controls (n = 11) and FSGS patients (n = 9); values plotted: median ±IQR; Mann-Whitney U test; *p<0.0001 vs. control; **p=0.021 vs. control. (G–J) Linear nephrin staining in a glomerulus of a healthy human control subject (G) and segmental loss of nephrin staining in a glomerulus of a patient with FSGS (H), indicated by arrowheads. Nephrin expression was significantly reduced in patients with FSGS compared to healthy controls (I). Moreover, we observed a shift from a normal linear staining pattern, following the glomerular capillary wall, to a granular staining pattern (H and J). values plotted: median ±IQR; Mann-Whitney U test; *p=0.05 vs. control; **p<0.01 vs. control; ***p<0.001 vs. controls.
-
Figure 5—source data 1
TMEM63C intensity score and percentage of TMEM63C positivity in glomeruli in FSGS patients.
- https://doi.org/10.7554/eLife.42068.018
-
Figure 5—source data 2
Nephrin staining in FSGS patients.
- https://doi.org/10.7554/eLife.42068.019
Figure 6
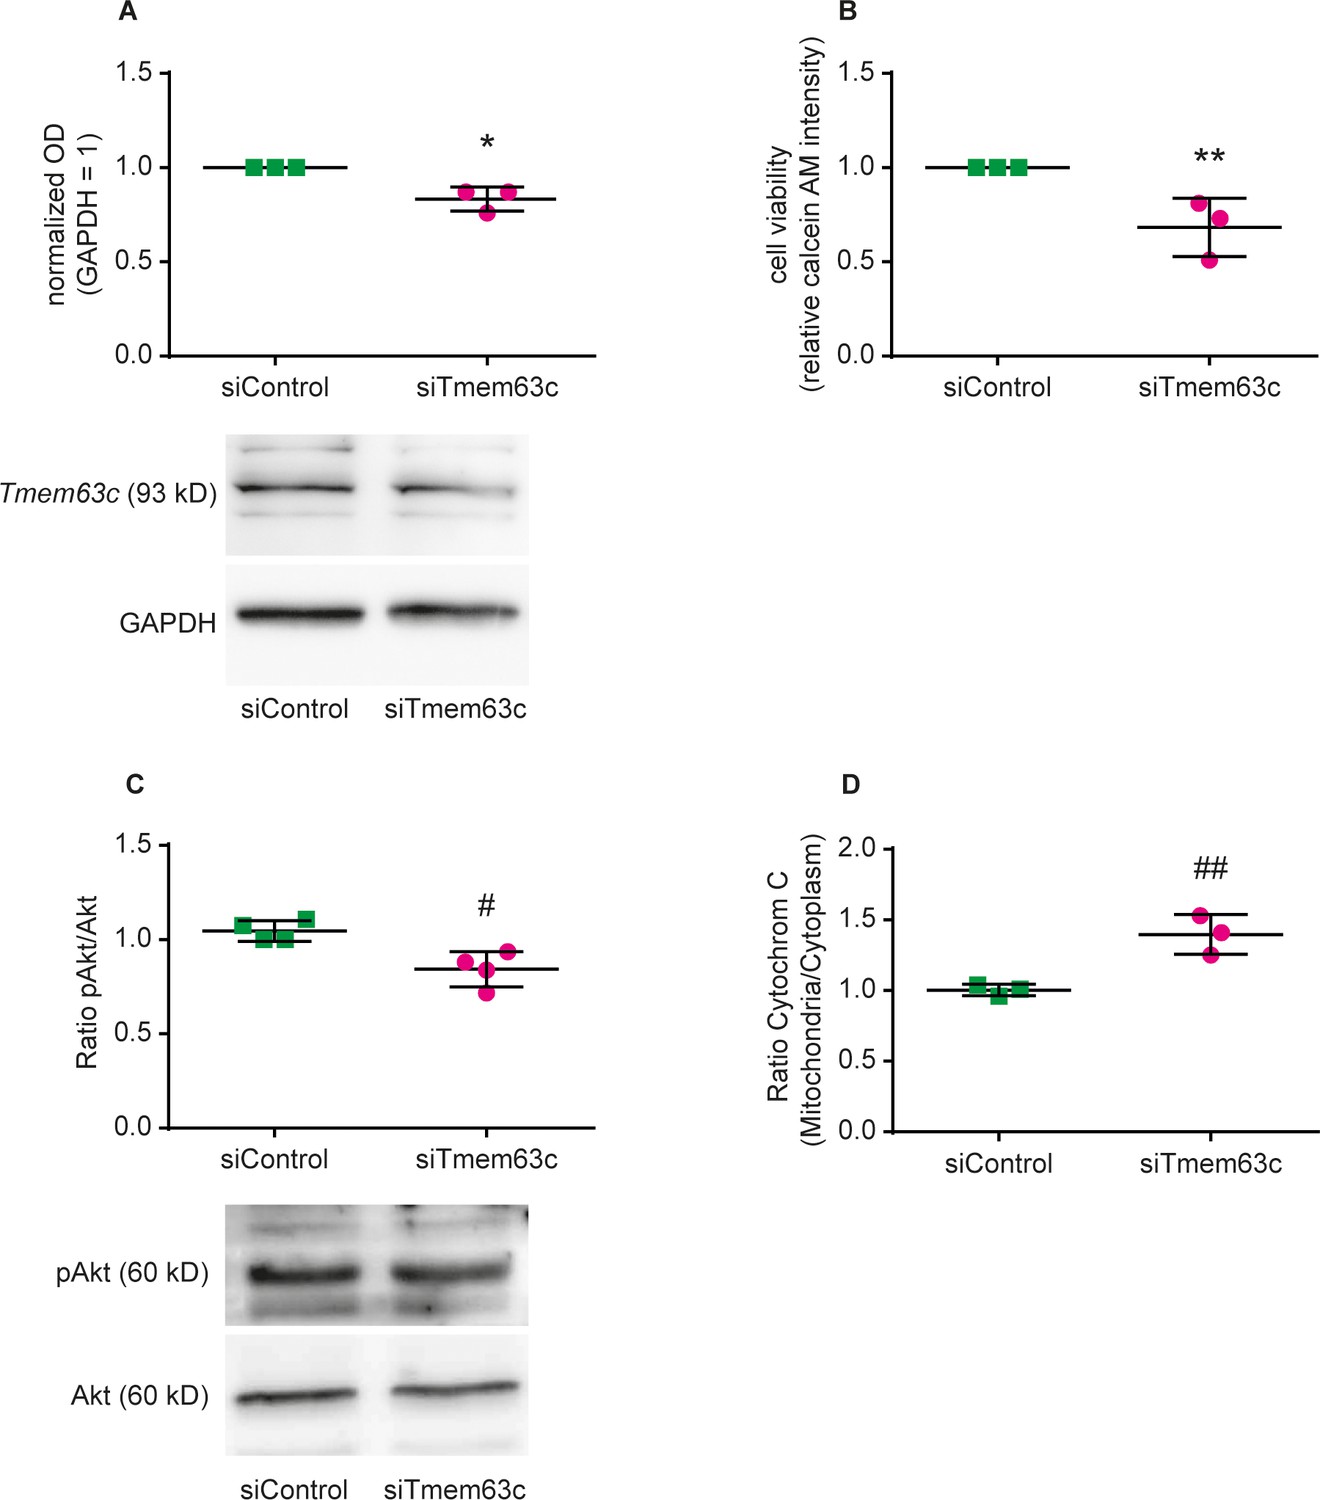
Functional role of TMEM63C in human podocytes (hPC) in vitro.
Shown is the impact of siRNA-mediated inhibition of TMEM63C (siTMEM63C) or treatment of hPC with a corresponding nonsense negative control (siControl). (A) TMEM63C protein expression normalized against GAPDH as a loading control (*p=0.011). Shown is a representative Western blot. (B) Cell viability determined via measurement of calcein acetoxymethyl (AM) fluorescence intensity in hPC (**p=0.024). (C) Phosphorylation state of protein kinase B (pAKT) normalized against the expression of total AKT (AKT) (#p=0.0094). Shown is a representative Western blot, GAPDH is used as a loading control. (D) Pro-apoptotic cytochrome C transition from mitochondria to the cytoplasm of hPC (##p=0.0096). The mean ±SD of at least three independent experiments is shown, respectively. Two-tailed Student´s t-test was performed for all experiments.
-
Figure 6—source data 1
TMEM63C expression in human podocytes using small interfering RNA (siRNA) methodology.
- https://doi.org/10.7554/eLife.42068.021
Figure 7 with 2 supplements
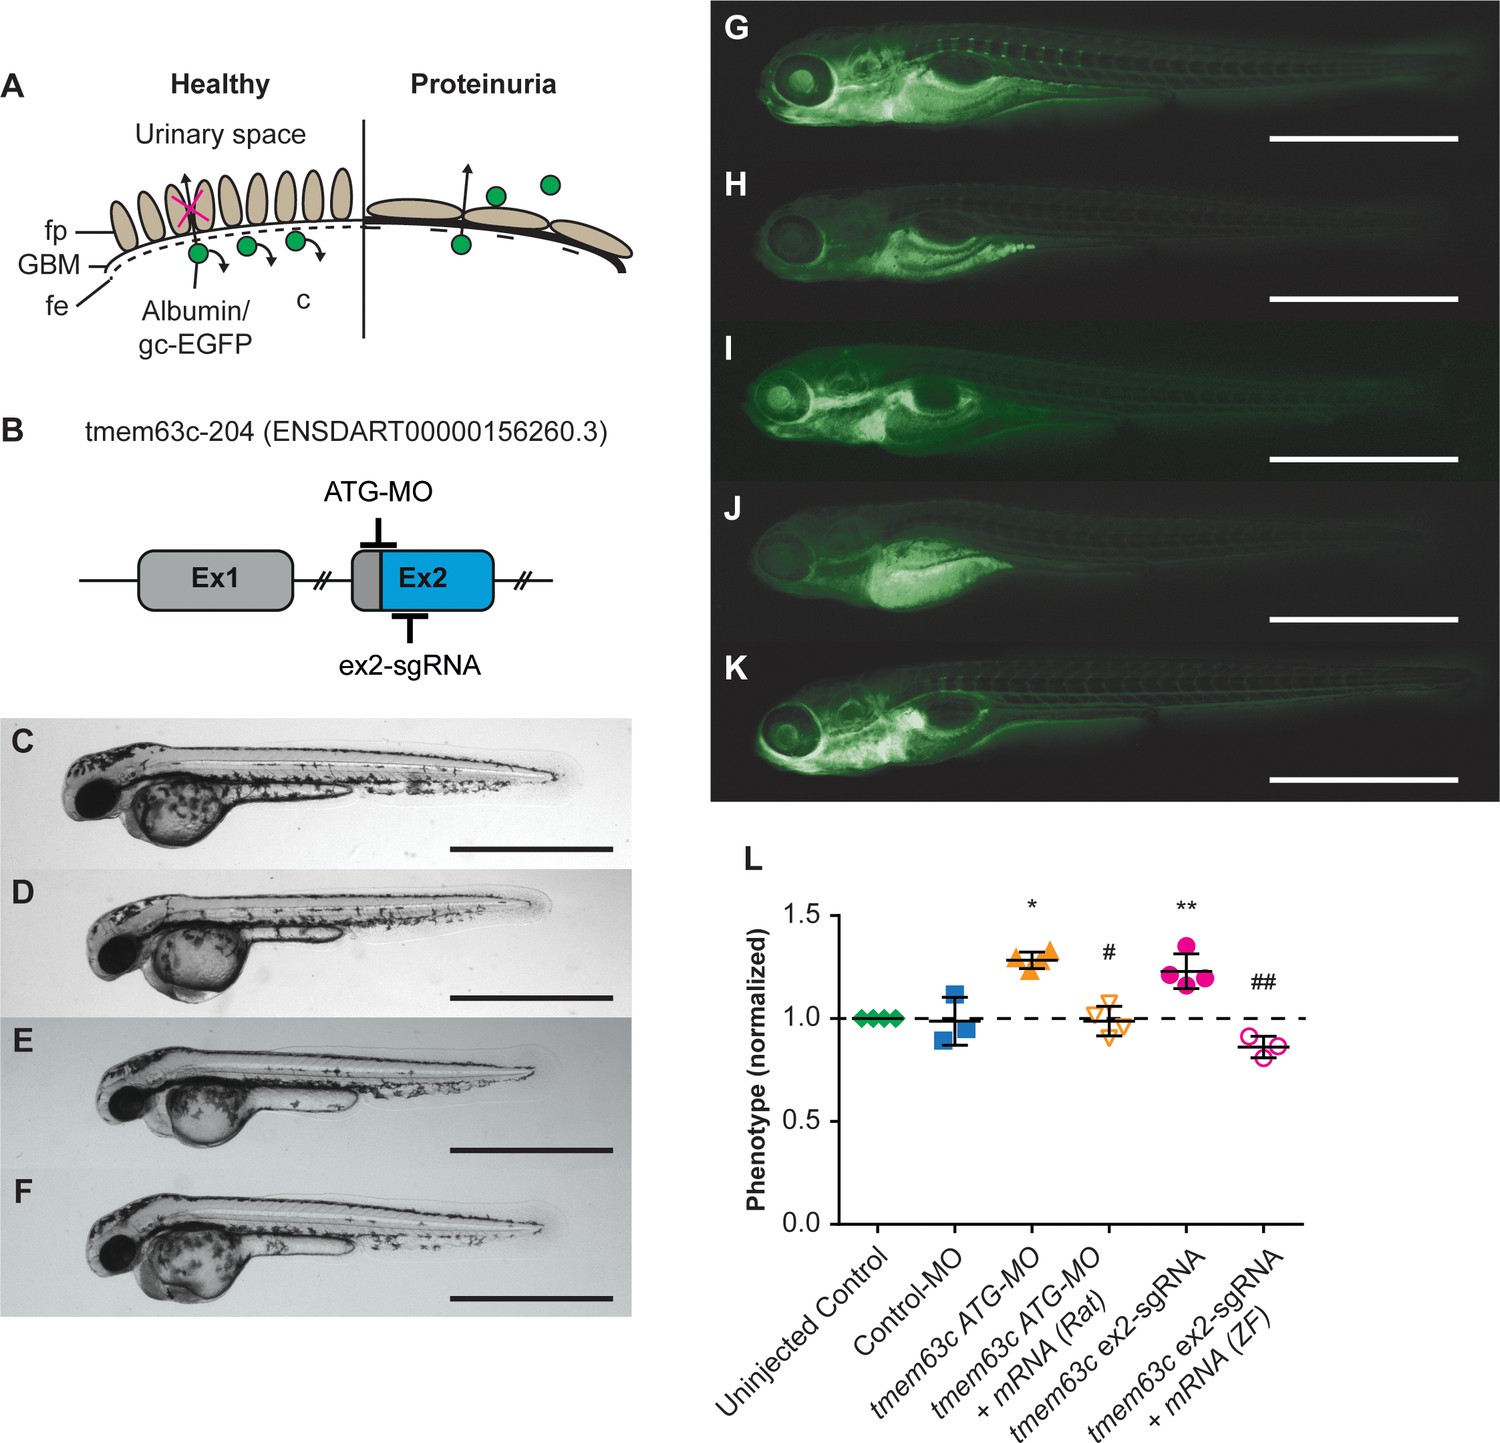
Functional assessment of the glomerular filtration barrier (GFB) after loss of transmembrane protein 63c (tmem63c) in zebrafish.
(A) Scheme of the GFB in healthy and albuminuric zebrafish embryos. Green fluorescent protein (gc-EGFP) represents an albumin surrogate and is filtrated after impairment of the GFB. fe, fenestrated endothelium; fp, foot processes of podocytes; GBM, glomerular basement membrane. (B) Schematic of tmem63c showing the target regions in Exon 2 (ex2) used for Morpholino (MO)- and CRISPR/Cas9-mediated somatic mutagenesis. (C–F) Bright field view of wildtype embryos at 48 hr post-fertilization (hpf) in uninjected controls (C), ATG-MO injected (D), 159.6 ng/µl ex2-sgRNA injected (E), and 250 ng/µl ex2-sgRNA injected embryos (F). Scale bar = 1 mm. (G–K) Fluorescence microscopy of Tg[fabp10a:gc-EGFP] embryos at 120 hpf. Uninjected control with clearly visible gc-EGFP fluorescence in the trunk vasculature (‘fluorescent’) (G). tmem63c ATG-MO-injected embryo with partial or a complete loss of trunk fluorescence (‘deficient-fluorescent’) (H) and tmem63c ATG-MO +Tmem63c mRNA (Rat) co-injected embryo (I) showing rescue of the phenotype. Tmem63c ex2-sgRNA-injected embryo with partial or a complete loss of trunk fluorescence (‘deficient-fluorescent’) (J) and tmem63c ex2-sgRNA + tmem63c mRNA (ZF) co-injected embryo (K) showing rescue of the phenotype. Scale bar = 1 mm. (L) Analysis of gc-EGFP in the trunk vasculature. Shown are embryos categorized as ‘deficient-fluorescent’ (df), see Materials and method section and Figure 7—figure supplement 2 for details. Experimental groups are normalized to the corresponding uninjected control group per experiment. Uninjected Control (n = 1198); Control-MO (n = 189); tmem63c ATG-MO (n = 227); tmem63c ATG-MO +Tmem63c mRNA (Rat) (n = 230); tmem63c ex2-sgRNA (n = 371); tmem63c ex2-sgRNA + tmem63c mRNA (ZF) (n = 126); One-way ANOVA with Bonferroni’s multiple comparisons test. Values plottet: mean ±SD, dashed line at y = 1 indicates the uninjected control level; *p=0.0002 vs. uninjected Control, #p<0.0001 vs. tmem63c ATG-MO. **p=0.0014 vs. uninjected Control, ##p<0.0001 vs. tmem63c ex2-sgRNA. Data points in the graph represent the ratio per independent experiment, %(Uninjected Control (df)) / %(experimental group (df)), N ≥ 3. (See Figure 7—figure supplement 1 and Figure 7—figure supplement 2).
-
Figure 7—source data 1
Functional assessment of the GFB after tmem63c-knockdown using tmem63c ex2-sgRNA and ex2-sgRNA and tmem63c ATG-MO.
- https://doi.org/10.7554/eLife.42068.026
Figure 7—figure supplement 1
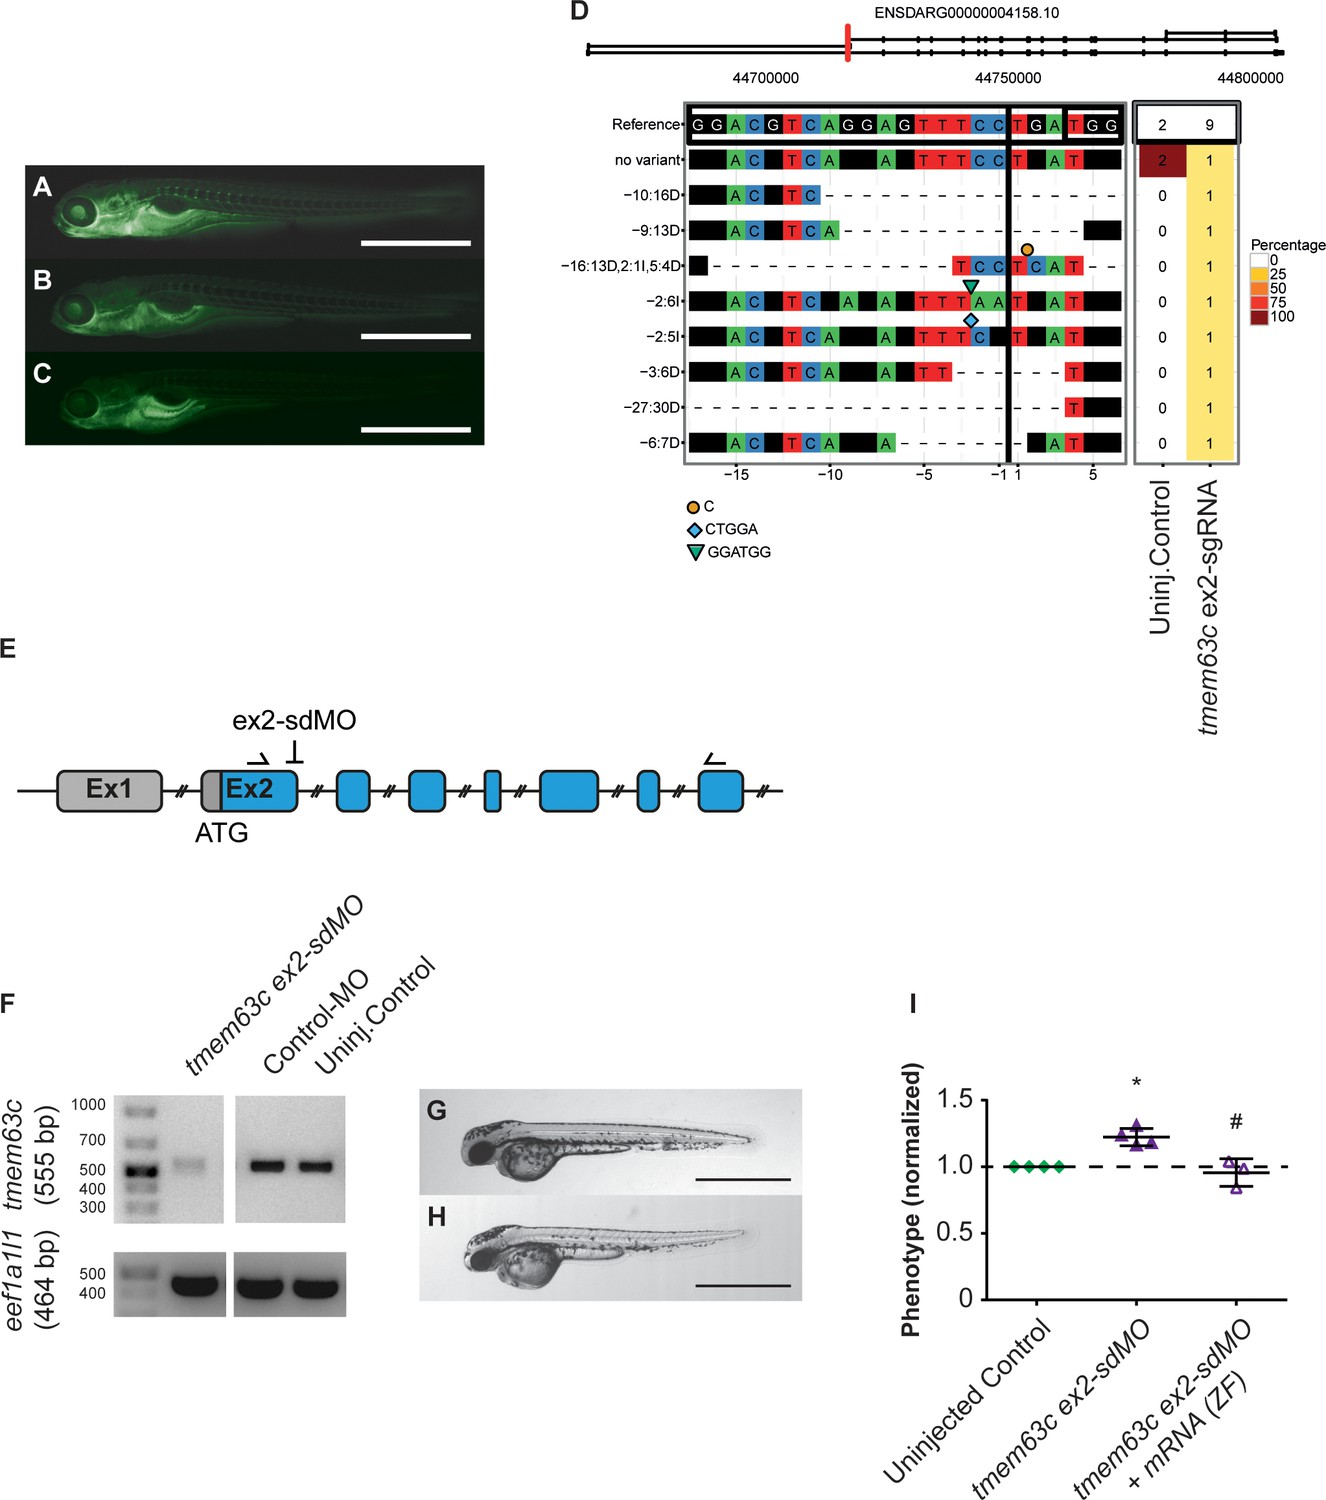
Functional assessment of the glomerular filtration barrier (GFB) in Tg[fabp10a:gc-EGFP] zebrafish embryos.
(A–C) Representative fluorescence microscopy pictures of Tg[fabp10a:gc-EGFP] zebrafish embryos categorized as ‘fluorescent’ or ‘deficient-fluorescent’, respectively to assess functionality of the GBM. An embryo of the ‘fluorescent group’ (A) shows clearly visible fluorescence in the trunk vasculature. (B–C) Embryos of different fluorescence intensities both characterized as ‘deficient-fluorescent’ with marked decrease in the fluorescence in the trunk vasculature. (D) Plot of mutagenesis output in transmembrane protein 63 c (tmem63c) crispants as created by CrispR Variants Lite analysis of the sequencing data from individual embryos. The gene schematic at the top illustrates the location of the sgRNA in red with respect to all overlapping transcripts on the reference strand in the Ensembl database (Yates et al., 2016). The panel below shows the pairwise alignment of each variant to the reference genome. The 20 bp sgRNA and the 3 bp PAM sequences are indicated in boxes in the reference sequence, the cutting site is indicated by a vertical line. Deletions are given by “- “and insertions by symbols with the inserted sequences shown underneath the plot with respect to the cutting site. The right panel demonstrates the frequency of the variants in the embryos analyzed with colors corresponding to variant frequencies as shown. The header displays the total number of embryos sequenced. (E–I) Functional assessment of the GFB after tmem63c-knockdown using tmem63c ex2-sdMO. (E) Schematic of tmem63c showing the region in Exon 2 (ex2) targeted by ex2-sdMO. Arrows indicate the positions of primers used for RT-PCR. (F) RT-PCR showing tmem63c-deficiency after injection of tmem63c ex2-sdMO, but not in Control-MO injected embryos or uninjected Controls, respectively. Eukaryotic translation elongation factor 1 alpha 1, like 1 (eef1a1l1) is used as a loading control. (F–G) Bright-field view of wildtype embryos at 48 hr post-fertilization (hpf) in uninjected controls (F) and tmem63c ex2-sdMO injected embryos (G). Scale bar = 1 mm. (H) Analysis of gc-EGFP in the trunk vasculature. Shown are embryos categorized as ‘deficient-fluorescent’ (df). Experimental groups are normalized to the corresponding uninjected control group per experiment. Uninjected Control (n = 457); tmem63c ex2-sdMO (n = 297); tmem63c ex2-sdMO + tmem63 c mRNA (ZF) (n = 246); One-way ANOVA with Bonferroni’s multiple comparisons test. Values plottet: mean ±SD, dashed line at y = 1 indicates the uninjected control level; *p=0.0039 vs. uninjected Control, # p=0.0021 vs. tmem63c ex2-sdMO. ZF = zebrafish. Data points in the graph represent the ratio per independent experiment, %(Uninjected Control (df)) / %(experimental group (df)), N ≥ 3.
-
Figure 7—figure supplement 1—source data 1
Functional assessment of the GFB after tmem63c-knockdown using tmem63c ex2-sdMO.
- https://doi.org/10.7554/eLife.42068.024
Figure 7—figure supplement 2
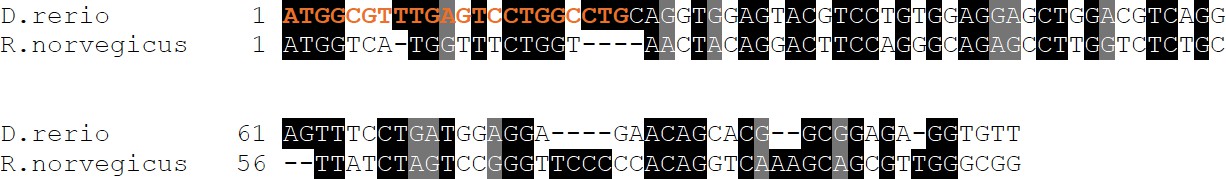
Excerpt from sequence alignment of tmem63c mRNA zebrafish (NM_001159836) vs Tmem63c mRNA rat (NM_001108045.1).
Sequence alignment shows the first 100 bp of tmem63c mRNA zebrafish vs. Tmem63c mRNA rat following ATG. Orange bases indicate the zebrafish sequence following ATG targeted by tmem63c ATG-MO to prove no targeting of rat mRNA by the used tmem63c ATG-MO. Sequence identity is 65,82% (Clustal 2.1) for mRNA sequences or 53,52% (Clustal 2.1) for protein sequences, respectively. D., Danio; R., Rattus.
Figure 8

Ultrastructural and morphological analysis of glomerular structures after loss of tmem63c in zebrafish.
(A–E) Electron microscopy and quantitative assessment of GFB ultrastructure. Representative electron microscopy pictures of the GFB in uninjected Controls (A), Cas9-Controls (B) and after tmem63c knockdown (C), asterisks indicate effaced podocyte foot processes). Quantitative analysis of podocyte foot process width (D) and number of slit diaphragms per µm GBM (E). Uninjected Control (n = 5); Cas9-Control (n = 4); tmem63c ex2-sgRNA (n = 4); Scale bar = 1 µm; values plottet: mean ±SD; One-way ANOVA with Bonferroni’s multiple comparisons test; *p=0.0019 vs. uninjected Control, *p=0.0017 vs Cas9-Control; # p=0.0171 vs. uninjected Control, # p=0.0148 vs. Cas9-Control. (F–J) Confocal microscopy and analysis of absolute and relative podocyte cell number in Tg(wt1b:EGFP) at 96 hpf. Representative confocal microscopy pictures of glomeruli in uninjected Controls (F), Cas9-Controls (G) and after tmem63c knockdown (H). Quantitative analysis of absolute (I) and relative (J) podocyte cell number. Relative podocyte cell number has been obtained after normalization to the glomerular volume. Uninjected Control (n = 6); Cas9-Control (n = 6); tmem63c ex2-sgRNA (n = 7); Scale bar = 15 µm; values plottet: mean ±SD; One-way ANOVA with Bonferroni’s multiple comparisons test; **p=0.0421 vs. uninjected Control.
-
Figure 8—source data 1
Tables and legends.
- https://doi.org/10.7554/eLife.42068.028
Videos
Video 1
Representative spot segmentation of podocyte nuclei and 3D surface reconstruction of glomeruli in uninjected controls of Tg(wt1b:EGFP) zebrafish embryos.
The videos show a maximum intensity projection of the masked DAPI channel acquired by confocal microscopy of Tg(wt1b:EGFP) zebrafish embryos at 96 hpf. The DAPI channel of DAPI+/EGFP+-cells visualized here represents podocyte nuclei. Blue spots show the podocyte nuclei identified by software-based spot segmentation. Spots were counted for quantification of the absolute podocyte cell number. The grey surface represents the 3D surface reconstruction of glomeruli containing all DAPI+/EGFP+ nuclei, which was used for quantification of the total glomerular volume. Shown here are representative analysis results of uninjected controls (Video 1), Cas9-Controls (Video 2) and tmem63c ex2-sgRNA-injected embryos (Video 3).
Video 2
Representative spot segmentation of podocyte nuclei and 3D surface reconstruction of glomeruli in Cas9 - injected controls (Cas9 - controls) of Tg(wt1b:EGFP) zebrafish embryos.
https://doi.org/10.7554/eLife.42068.030
Video 3
Representative spot segmentation of podocyte nuclei and 3D surface reconstruction of glomeruli in tmem63c ex2-sgRNA - injected Tg(wt1b:EGFP) zebrafish embryos
https://doi.org/10.7554/eLife.42068.031Tables
Table 1
Significant variants in the candidate kidney damage region on rat chromosome 6.
https://doi.org/10.7554/eLife.42068.011| Gene | Gene coordinates | Variant position | Variant type | Allelic variants | Amino acid exchange | Effect of sequence variant | PROVEAN score | ||
|---|---|---|---|---|---|---|---|---|---|
| Start position (bp) | Stop position (bp) | MWF | SHR | ||||||
| Acot4 | 107,517,668 | 107,522,952 | 107,518,131 | exonic | A | G | Gly → Arg | non-synonymous | −5.660 |
| Acot5 | 107,550,904 | 107,557,688 | 107,551,446 | exonic | A | C | Arg → Ser | non-synonymous | −2.842 |
| 107,551,528 | exonic | A | G | Arg → His | non-synonymous | −2.646 | |||
| 107,551,717 | exonic | G | C | Pro → Arg | non-synonymous | −5.314 | |||
| 107,557,092 | exonic | A | T | Leu → Gln | non-synonymous | −5.291 | |||
| Acot6 | 107,581,608 | 107,590,373 | 107,590,006 | exonic | C | T | Leu → Pro | non-synonymous | −5.091 |
| Ptgr2 | 108,009,251 | 108,029,859 | 108,029,833 | exonic | T | C | Arg → Cys | non-synonymous | −3.672 |
| Ngb | 111,126,261 | 111,132,320 | 111,128,730 | exonic | G | A | Leu → Pro | non-synonymous | −3.000 |
| 111,131,291 | exonic | ACT | A | NA | frameshift deletion | NA | |||
-
MWF, Munich Wistar Frömter; SHR, spontaneously hypertensive rat. NA, not applicable.
Table 2
Presence of the frameshift deletion in inbred rat strains in neuroglobin (Ngb) at 111,131,291 bp.
https://doi.org/10.7554/eLife.42068.012| Strain | Presence of deletion | Strain | Presence of deletion | ||||
|---|---|---|---|---|---|---|---|
| ACI | no | MHS | no | ||||
| BBDP | no | MNS | no | ||||
| BN.Lx | no | SBH | no | ||||
| EVE | no | SBN | no | ||||
| F344/Ncrl | no | SHR | yes | ||||
| FHH | no | SHR/NHsd | yes | ||||
| FHL | no | SHRSP/Gla | yes | ||||
| GK | yes | SR/Jr | no | ||||
| LE/Stm | no | SS/Jr | no | ||||
| LEW | no | SS_JRHSDMCWI | no | ||||
| LEW/NcrlBR | no | WAG | no | ||||
| LH | no | WKY | yes | ||||
| LL | no | WKY/Gla | yes | ||||
| LN | no | WKY_NHSD | yes |
-
The inbred rat strains with presence of the Ngb frame shift deletion in bold belong to a clade of Wistar rat derived strains from Japan.
Table 3
Genes in the candidate kidney damage region with differential expression in RNA-Seq analysis.
https://doi.org/10.7554/eLife.42068.016| Gene | Start (bp position) | End (bp position) | ID | P(DeSeq2) | P(Cuffdiff) | Straina |
|---|---|---|---|---|---|---|
| Acot3 | 107,531,528 | 107,536,789 | ENSRNOG00000053460 | 0.09426742 | 0.00799931 | SHR |
| Rps6kl1 | 108,961,994 | 108,976,489 | ENSRNOG00000005530 | 0.024515465 | 0.0186294 | MWF |
| Acot5 | 107,550,904 | 107,557,688 | ENSRNOG00000032508 | 0.000234652 | 0.000948356 | SHR |
| Papln | 107,245,820 | 107,276,755 | ENSRNOG00000009448 | 8.82E-05 | 0.000948356 | MWF |
| Tmem63c | 111,049,559 | 111,120,799 | ENSRNOG00000011334 | 6.26E-06 | 0.000948356 | MWF |
| Flvcr2 | 109,617,355 | 109,681,495 | ENSRNOG00000008754 | 2.06E-06 | 0.000948356 | MWF |
| Jdp2 | 109,466,060 | 109,505,161 | ENSRNOG00000008224 | 0.052146312 | 0.00245615 | SHR |
| Esrrb | 110,410,141 | 110,455,906 | ENSRNOG00000010259 | 0.278291584 | 0.00245615 | SHR |
| Tgfb3 | 109,913,757 | 109,935,533 | ENSRNOG00000009867 | 0.019914732 | 0.0632265 | SHR |
| Vash1 | 110,624,856 | 110,637,382 | ENSRNOG00000010457 | 0.070552875 | 0.00314268 | MWF |
-
MWF, Munich Wistar Frömter; RNA-Seq, RNA sequencing; SHR, spontaneously hypertensive rat. Genes shown in bold were found to be significantly differentially expressed using both CuffDiff and DeSeq2 analysis. a The strain name is given for upregulation of mRNA expression.
Key resources table
| Reagent type (species) or resource | Designation | Source or reference | Identifiers | Additional information |
|---|---|---|---|---|
| Antibody | anti-TMEM63C | Perbio Science Germany; this paper | epitope: GLRGFARELDPAQFQEGLE | 1:1600 for rat tissue, 1:800 for human biopsies |
| Antibody | rabbit anti-WT1 | Santa Cruz | RRID:AB_632611 | 1:500 |
| Antibody | rabbit anti-nephrin | Abcam | RRID:AB_944400 | 1:750 |
| Antibody | Goat anti-rabbit EnVision HRP conjugate | Dako | ||
| Antibody | GAPDH | Calbiochem | ||
| Antibody | AKT | Merck Chemicals GmbH | ||
| Antibody | phospho-AKT Ser473 | Merck Chemicals GmbH | ||
| Biological sample (Homo sapiens) | Renal biopsy samples of patients with FSGS | archive of the Department of Pathology of the Leiden University Medical Center (LUMC) | For patient information see Table 4 | |
| ell line (Homo sapiens) | hPC | Saleem et al., 2002 | RRID:CVCL_W186 | |
| Gene (Danio rerio) | tmem63c | NA | ZFIN: ZDB-GENE-120928–2 | |
| Gene (Homo sapiens) | TMEM63C | NA | Ensembl: ENST00000298351.4 | |
| Gene (Rattus norvegicus) | Tmem63c | NA | Ensembl: ENSRNOT00000015571.6 | |
| Other | DAPI stain | Sigma Aldrich | stock solution 1 mg/ml diluted 1:2000 in PBS | |
| Other | DNA-Seq database | this paper | GEO and SRA: Submission ID: SUB2950675 and BioProject ID: PRJNA398197 | See Data availability |
| Other | RNA-Seq database | this paper | GEO and SRA: accession GSE102546 | See Data availability |
| Recombinant DNA reagent | tmem63c (cDNA) zebrafish | this paper | Infusion cloning primer sequences for cDNA synthesis: forward: GCTTGATATCGAATTCATGGCGTTTGAGTCCTGGCCTGC; reverse: CGGGCTGCAGGA ATTCTCACTGAAAAGCCACCGGACTG; Sequence additional primer for amplification of ORF: GTGCAGAAACTAATGAAGCTGG; Progenitors: tmem63c (cDNA); pBluescript II SK(+) | |
| Sequence- based reagent | tmem63c ATG-MO | Gene Tools LLC Philomath | sequence: 5’-CAGGCCAGGACTCAAACGCCATTGC-3’ | |
| Sequence- based reagent | tmem63c ex2-sdMO | Gene Tools LLC Philomath | sequence: 5'-TGTTATCATAGATGATGTACCAGCC-3' | |
| Sequence- based reagent | tmem63c ex2-sgRNA | this paper | Sequence synthesis forward primer with CRISPR target site underlined: GAAATTAATACGACTCACTATAGGACGTCAGGAGTTTCCTGAGTT TTAGAGCTAGAAATAGC | |
| Sequence- based reagent | tmem63c ex2- sgRNA primers flanking CRISPR target site | BioTez Berlin-Buch GmbH | Sequences: forward: CAAATGGTGAACACTTGTGAATC, reverse: CTGCGGTTTACTGCGGAGATG | |
| Sequence-based reagent | siTMEM63C | Sigma-Aldrich Chemie GmbH | ||
| Strain, strain background (Danio rerio) | Tg(fabp10a:gc-EGFP) | Zhou and Hildebrandt, 2012 | ||
| Strain, strain background (Danio rerio) | Tg(wt1b:GFP) | Perner et al., 2007 | ||
| Strain, strain background (Rattus norvegicus) | MWF/Rkb | Own colony Charité – Universitätsmedizin Berlin, Germany | http://dels.nas.edu/ilar/ (laboratory code Rkb); Schulz and Kreutz, 2012; RRID:RGD_724569 | |
| Strain, strain background (Rattus norvegicus) | SHR/Rkb | Own colony Charité – Universitätsmedizin Berlin, Germany | http://dels.nas.edu/ilar/ (laboratory code Rkb); Schulz and Kreutz, 2012; RRID:RGD_631696 | |
| Strain, strain background (Rattus norvegicus) | MWF-6SHR | Own colony Charité – Universitätsmedizin Berlin, Germany | http://dels.nas.edu/ilar/ (laboratory code Rkb); Schulz and Kreutz, 2012; RRID:RGD_1641831 | |
| Strain, strain background (Rattus norvegicus) | Congenic strains see Figure 1 | Own colony Charité – Universitätsmedizin Berlin, Germany; this paper | For generation of congenic strains seeMaterials and method section |
Table 4
Characteristics of focal segmental glomerulosclerosis patients.
https://doi.org/10.7554/eLife.42068.032| Patient-specific features | Values‡ |
|---|---|
| Number of patients | 9 |
| Age, years | 36 ± 23 |
| Sex, male | 5 (55%) |
| SBP, mmHg* | 167 ± 38 |
| DBP, mmHg† | 106 ± 25 |
| Hypertension | 7 (88%) |
| Proteinuria, g/day† | 9.2 ± 4.4 |
| Serum creatinine, µmol/l† | 150 ± 43 |
| eGFR, ml/min/1.73 m2* | 51 (42–66) |
| Nephrotic syndrome | 8 (89%) |
-
*n = 7; †n = 6; ‡ values are reported as number (%), mean ±SD or as median (interquartile range) for eGFR.
Additional files
-
Transparent reporting form
- https://doi.org/10.7554/eLife.42068.033
Download links
A two-part list of links to download the article, or parts of the article, in various formats.
Downloads (link to download the article as PDF)
Open citations (links to open the citations from this article in various online reference manager services)
Cite this article (links to download the citations from this article in formats compatible with various reference manager tools)
Analysis of the genomic architecture of a complex trait locus in hypertensive rat models links Tmem63c to kidney damage
eLife 8:e42068.
https://doi.org/10.7554/eLife.42068


