Preacinetobactin not acinetobactin is essential for iron uptake by the BauA transporter of the pathogen Acinetobacter baumannii
- Wellcome Trust Centre of Human Genomics, England
- Research Complex at Harwell, Rutherford Laboratory, England
- University of Cagliari, Italy
- The University of St Andrews, United Kingdom
- Jacobs University, Germany
- The Rosalind Franklin Institute, England
Figures
Figure 1 with 3 supplements
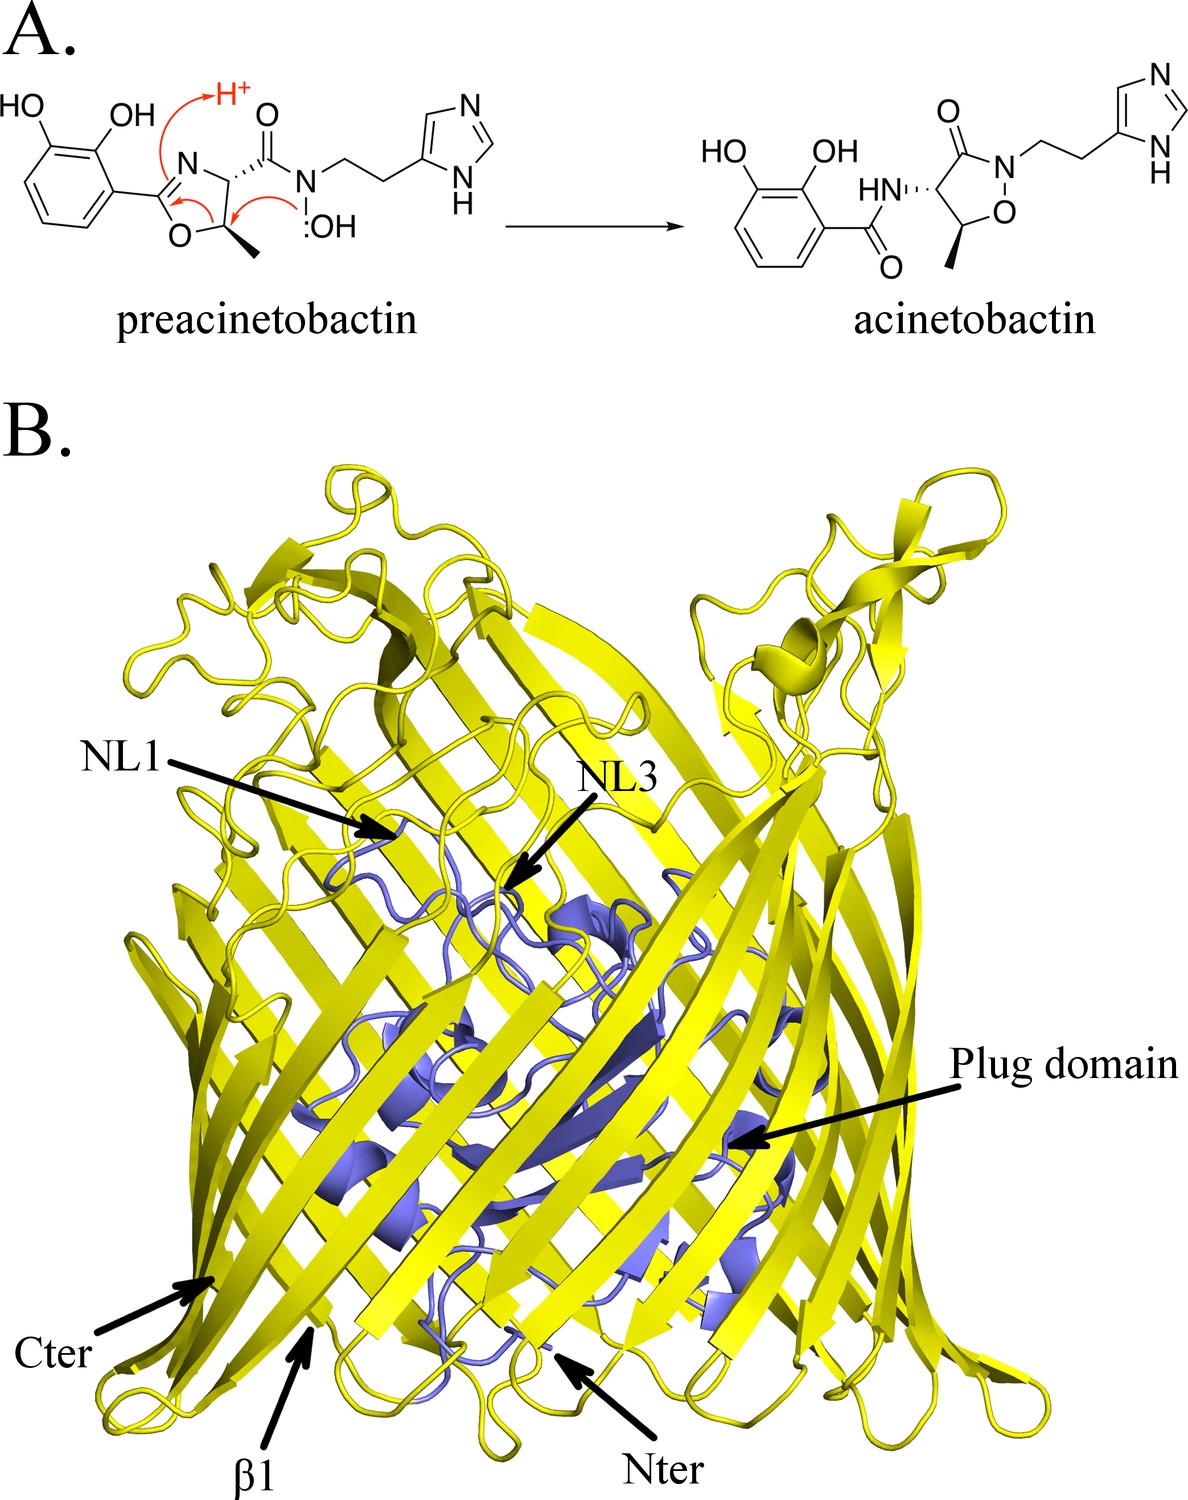
Structure of BauA, the (pre)acinetobactin transporter in A. baumannii.
(A) Schematic representation of the spontaneous isomerization of preacinetobactin into acinetobactin occurring at pH >7. (B) Overall structure of BauA. The N-ter plug domain is colored in blue and the β-barrel in yellow.
Figure 1—figure supplement 1
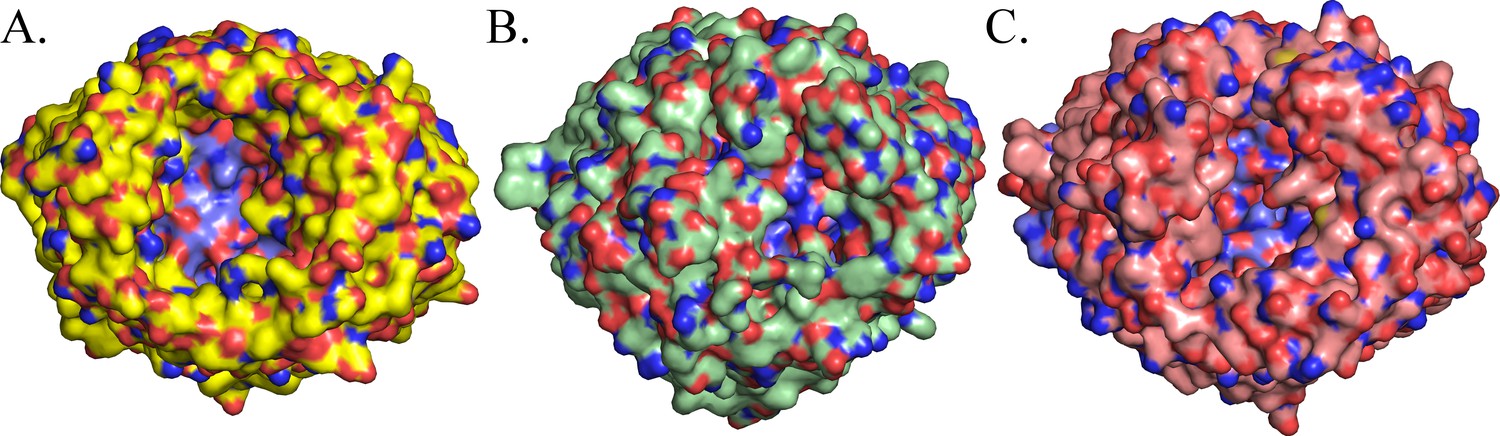
Surface comparison of BauA (A), FepA (B) and FpvA (C).
Plug domains are colored in blue. BauA β-barrel forms a large open cavity giving large access to the loops of the plug domain compared to FepA and FpvA.
Figure 1—figure supplement 2
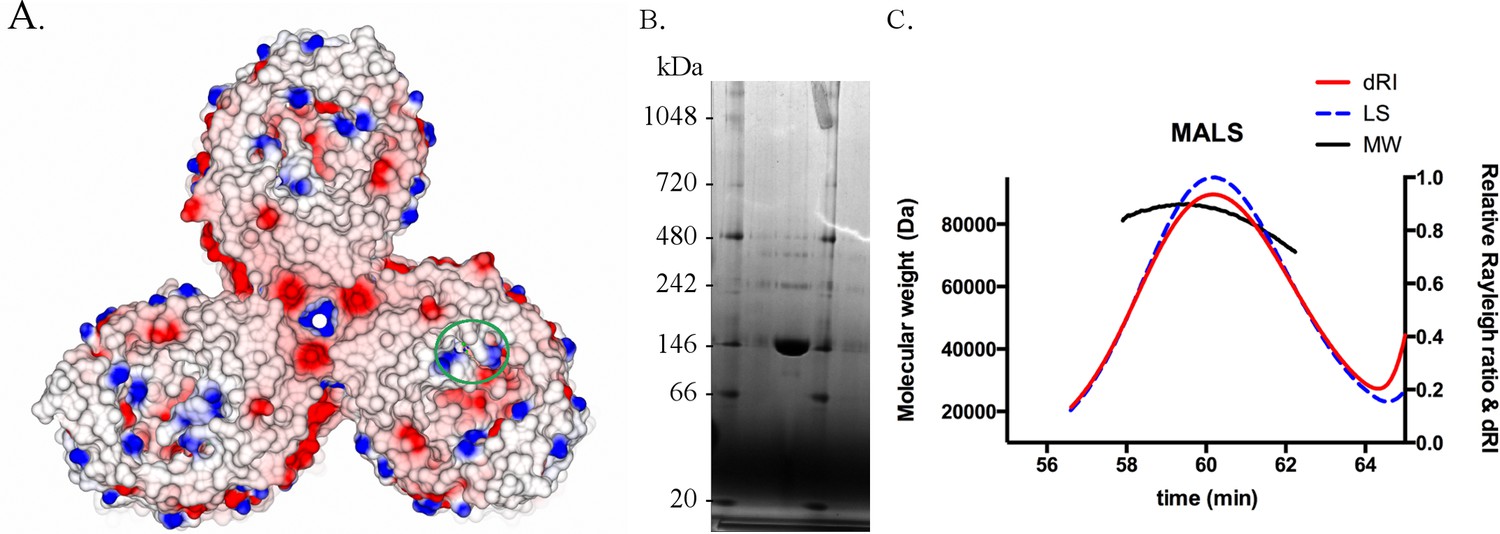
BauA oligomer state.
(A) The asymmetric unit of the crystal contains a trimer. View from the extracellular side of the trimer. The surface of BauA is colored by electrostatic charges calculated in CCP4MG. Position of the binding site have been alighted with a green circle. (B) BauA runs around 146 kDa in a blue native gel. BauA purified sample has been loaded into a NativePAGE Novex Bis-Tris gel (Invitrogen). (C) Size-exclusion chromatography coupled to multi-angle light-scattering (SEC-MALS) analysis gives a molecular weight of 80 kDa which is consistent with a monomeric state. Purified proteins were injected on a Superdex 200 16/60 column (GE Healthcare) equilibrated with 10 mM Tris pH 8, 150 mM NaCl and 0.45% C8E4 and monitored in-line with three detectors for UV absorption, light scattering (LS) and refractive index (RI) using a DAWN HELEOS II light-scattering detector (Wyatt Technology) and an Optilab rEX interferometric refractometer detector (Wyatt Technology). Data were analyzed using ASTRA software (Wyatt Technology).
Figure 1—figure supplement 3
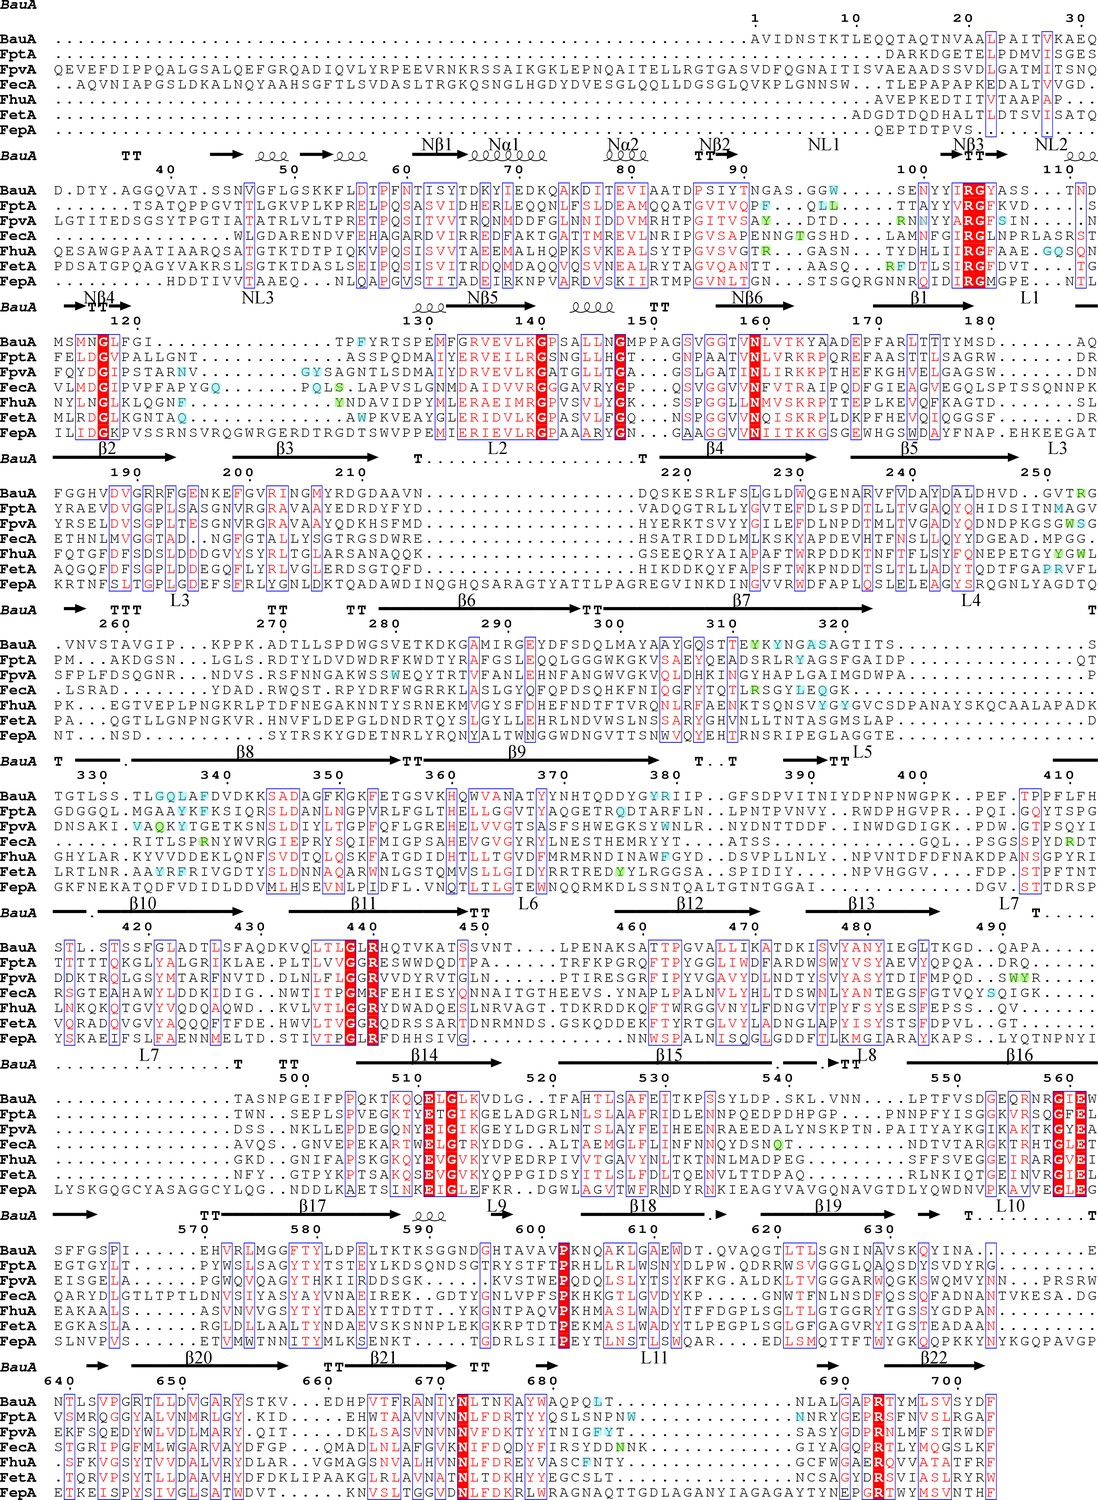
Structure-based sequence alignment of BauA with other siderophore transporters.
Secondary structure elements of BauA are illustrated above the sequence. Nα and Nβ refer to the plug domain elements. Residues forming the binding sites BauA, FptA (Cobessi et al., 2005b), FpvA (Cobessi et al., 2005a) FecA (Ferguson et al., 2002) FhuA (Ferguson et al., 1998), FetA (Brillet et al., 2011), FepA (Buchanan et al., 1999) are highlighted in green and blue for polar and hydrophobic interactions respectively. Residues involved in the binding site are part of the same secondary structure elements. The alignment was performed with PROMALS3D (Pei et al., 2008) and the picture was drawn using ESPript (Robert and Gouet, 2014).
Figure 2 with 3 supplements
BauA binds a heterocomplex Fe3+, preacinetobactin and acinetobactin.
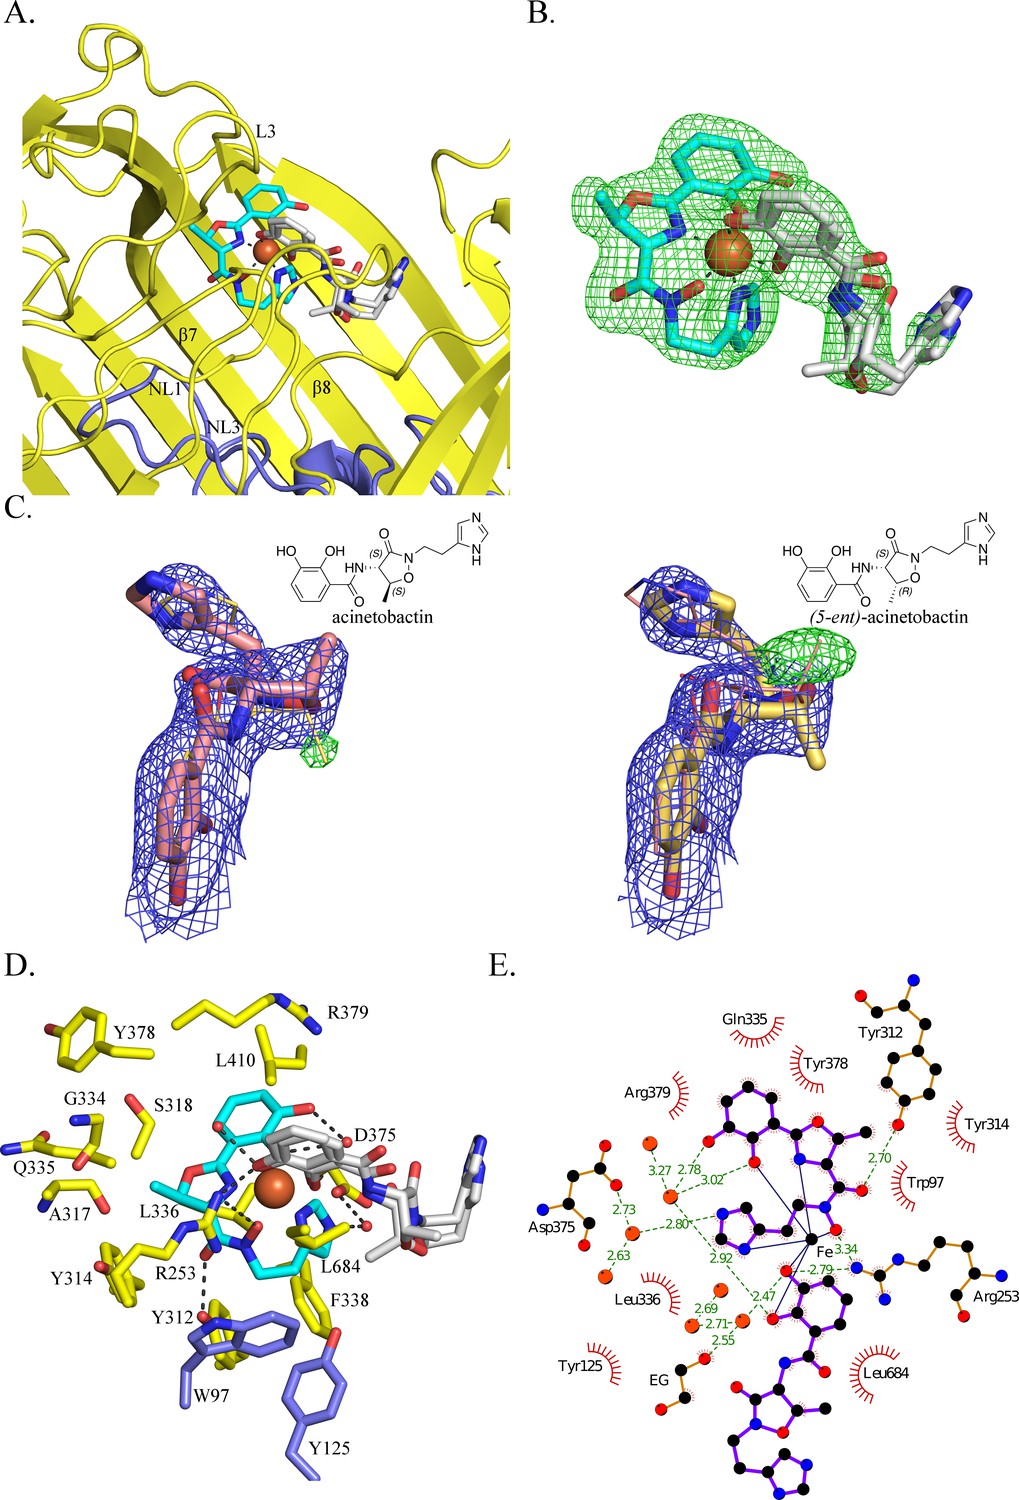
(A) Overall structure of BauA in complex with Fe3+, preacinetobactin and acinetobactin. The N-ter plug domain is colored in blue and the β-barrel in yellow. Preacinetobactin is shown as sticks with carbon atoms colored cyan and acinetobactin carbon atoms are in white, nitrogen in blue and oxygen in red. The Fe3+ is represented as an orange sphere. Secondary structure elements involved in the binding site have been labeled. (B) FO-FC electron density from the original omit map at 3 σ around Fe3+, preacinetobactin and acinetobactin complex. The color scheme of the Fe3+- siderophores is the same as A. We model the second molecule as a mixture of two diastereomers of acinetobactin. (C) 2FO-FC (blue) and FO-FC (green) electron density maps at 1 and 3 σ, respectively, around acinetobactin. In the left panel, only the acinetobactin (carbon atom represented in pink) has been added in the model before refinement. Position of (5-ent)-acinetobactin is shown in yellow line for information. In the right panel, only (5-ent)-acinetobactin (yellow stick) has been added in the model. Position of acinetobactin is shown in pink line for information. Schematic representation of both compounds has been added in the top corner for each image. (D) Binding site of the siderophores. Residues within 4.0 Å of the siderophores are displayed and hydrogen bonds are shown as black broken lines. Carbon atoms of residues of the β-barrel are in yellow and the ones of the plug domain in blue. (E) Ligplot diagram of Fe3+, preacinetobactin, acinetobactin bound to BauA. Covalent bonds of the siderophore and protein residues are in purple and brown sticks, respectively. Hydrogen bonds are represented by green dashed line and hydrophobic contacts are shown as red semi-circles with radiating spokes. One molecule of ethylene glycol is present in the binding site. Figure prepared with Ligplot (Wallace et al., 1995).
Figure 2—figure supplement 1
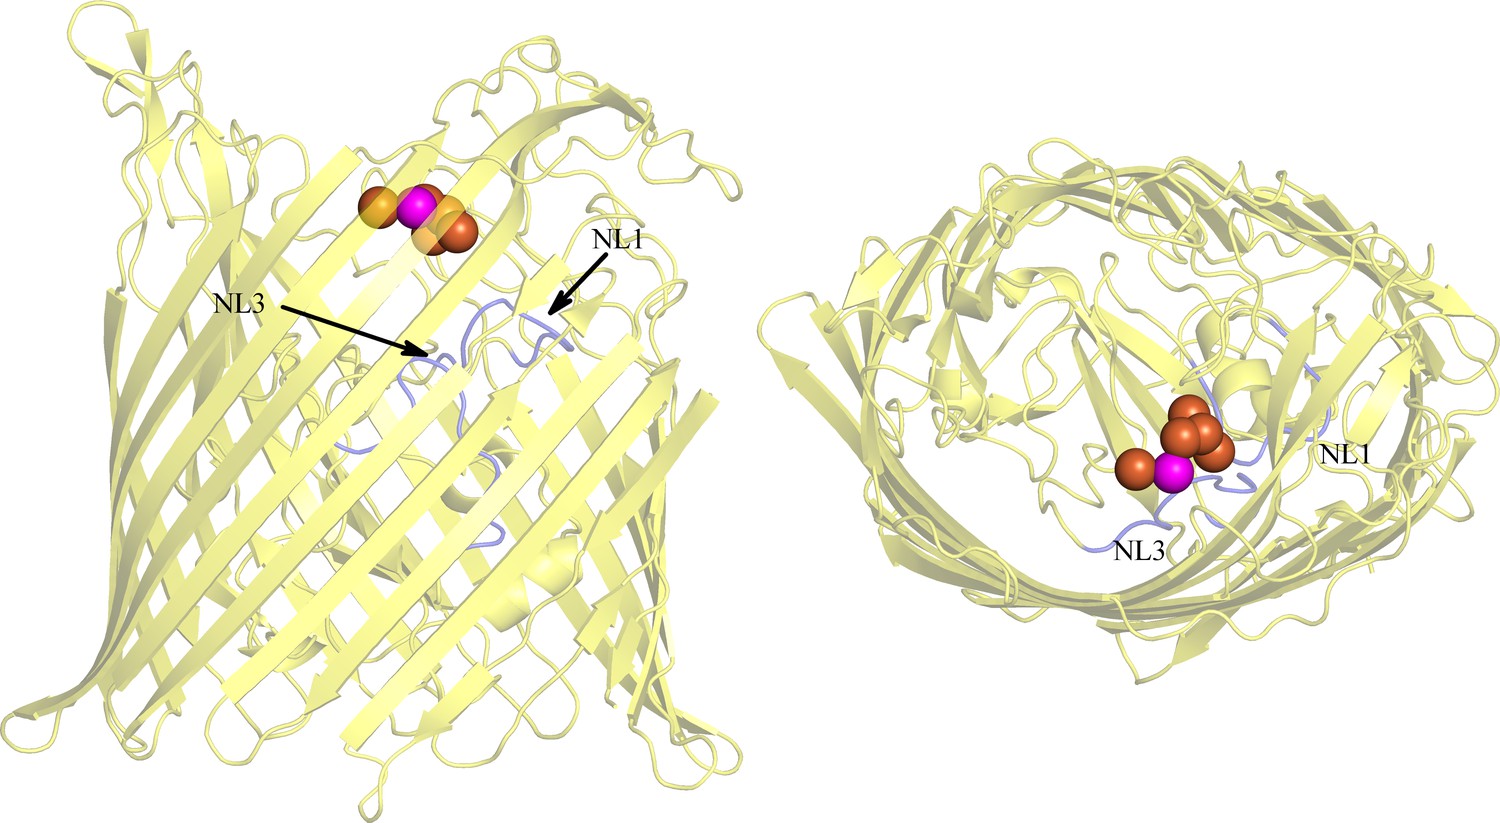
The location of BauA binding site is similar to the ones of the other siderophore transporters.
Fe3+ of FptA (Cobessi et al., 2005b) FpvA (Cobessi et al., 2005a), FecA (Ferguson et al., 2002), FhuA (Ferguson et al., 1998) FetA (Brillet et al., 2011) complexes are represented by an orange sphere and the one of BauA in pink. BauA structure is shown in transparency (yellow) and NL1-NL3 are highlighted in blue.
Figure 2—figure supplement 2
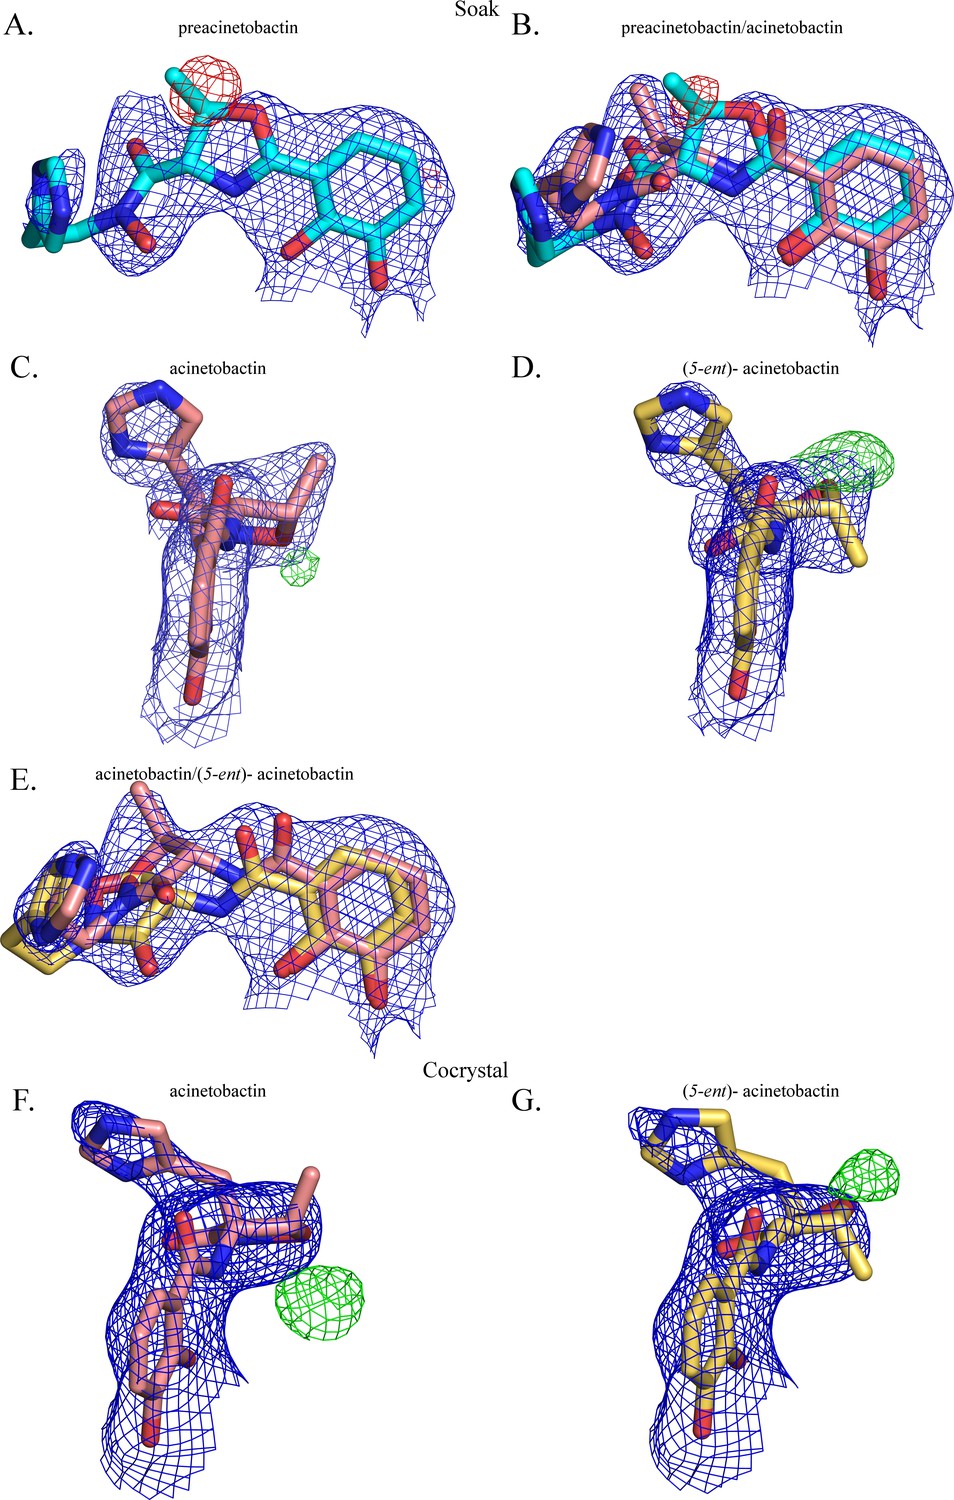
The second molecule has been modeled as a mixture of two diastereomers of acinetobactin.
2FO-FC (contoured at 1 σ blue) and FO-FC (contoured at 3 σ in green and −3 σ in red) electron density maps, respectively, around the second molecule when it has been modeled as (A) preacinetobactin (correct diasteromer), (B) a mixture of preacinetobactin and acinetobactin (both correct diasteromers), (C) acinetobactin (correct diasteromer), (D) acinetobactin (‘wrong’ diastereomer (5-ent)-acinetobactin) and (E) a mixture of the two diastereomers of acinetobactin. In the co-crystal structure, the correct diastereomer (F) shows significant unfilled FO-FC density, where as the ‘wrong’ ‘diastereomer’ (G) (5-ent)-acinetobactin shows less unfilled density.
Figure 2—figure supplement 3
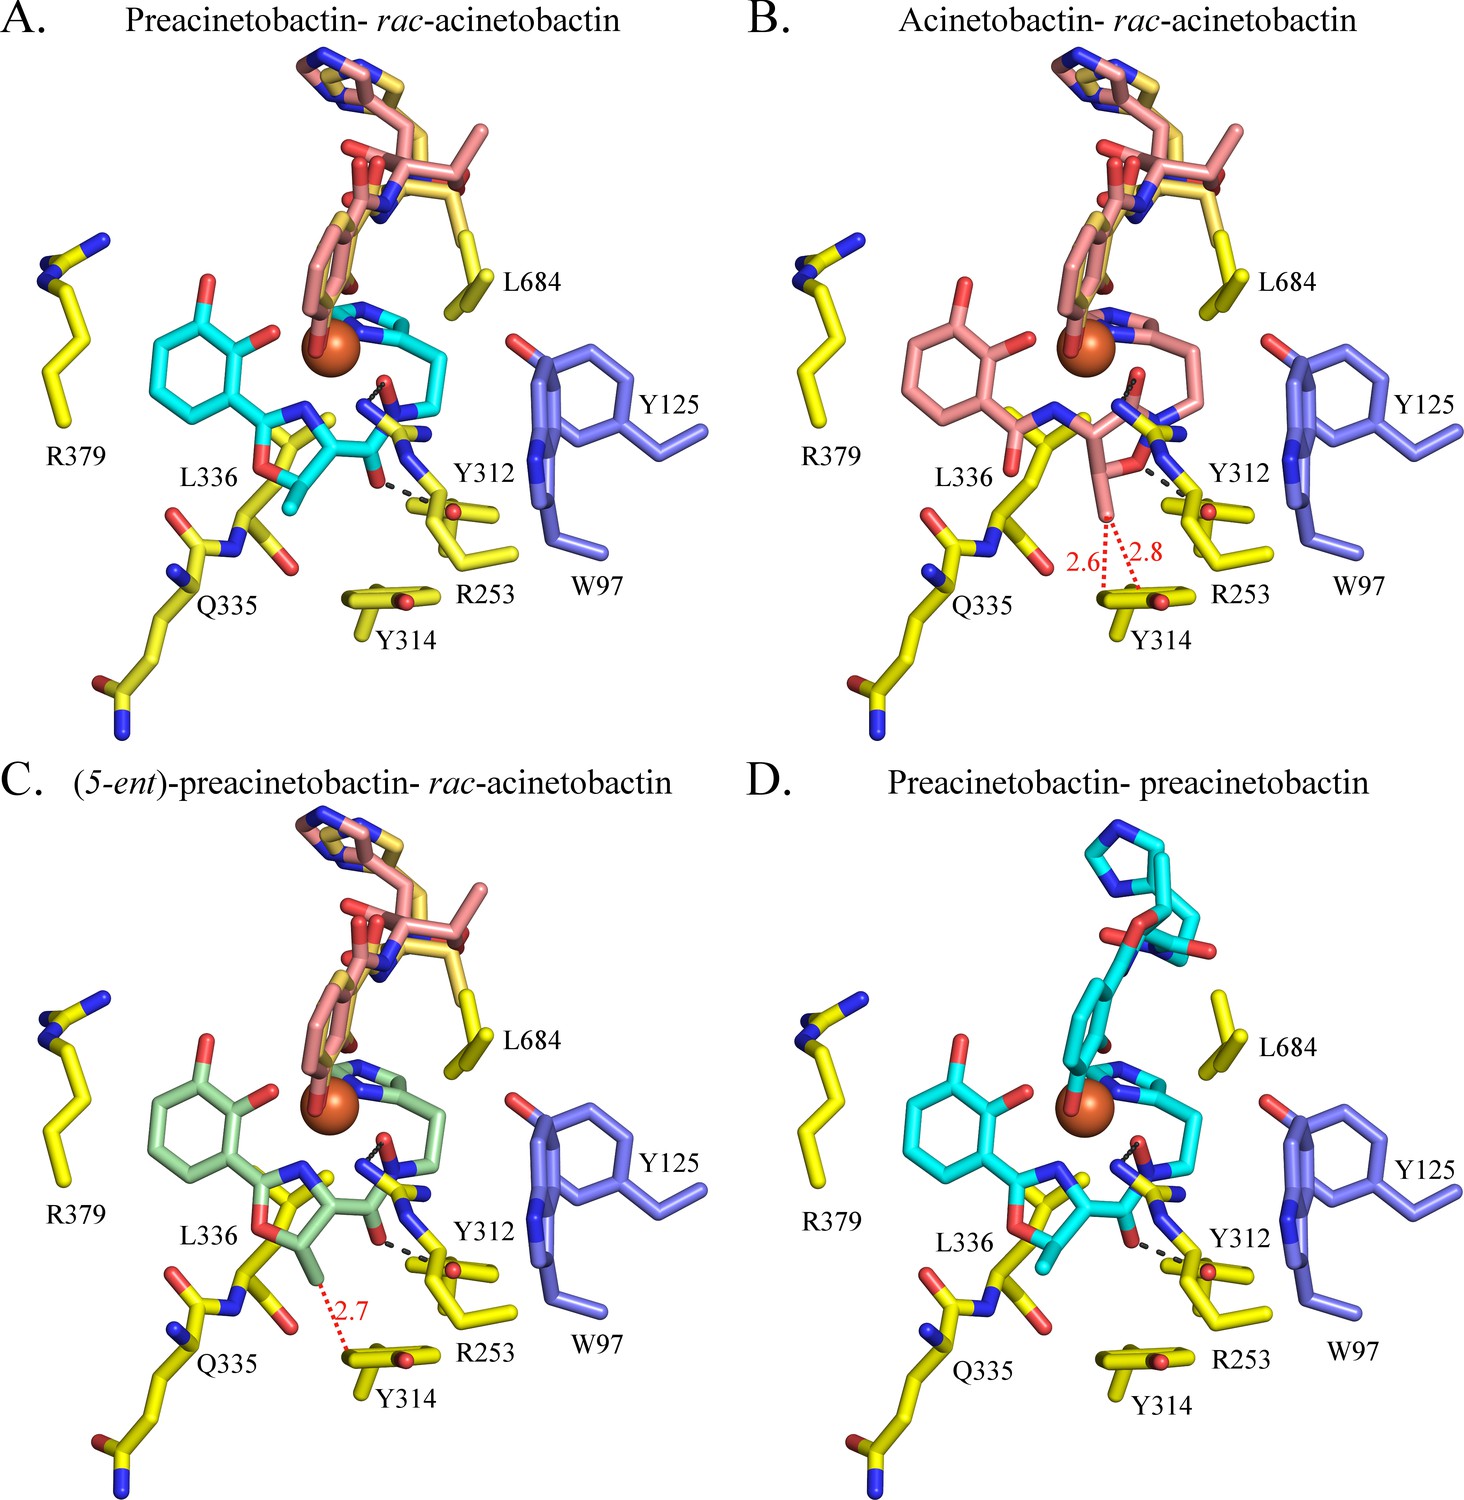
Model of acinetobactin, preacinetobactin, (5-ent)-preacinetobactin binding.
Binding site observed in the crystal structure (A) has been used to model the binding of Fe3+-acinetobactin and a mixture of two diastereomers of acinetobactin (rac-acinetobactin) (B) Fe3+-(5-ent)-preacinetobactin- rac-acinetobactin (C) and Fe3+-preacinetobactin-preacinetobactin (D). Fe3+-acinetobactin- rac-acinetobactin and Fe3+ -(5-ent)-preacinetobactin- rac-acinetobactin would clash with Tyr314 (red dashes).
Figure 3 with 5 supplements
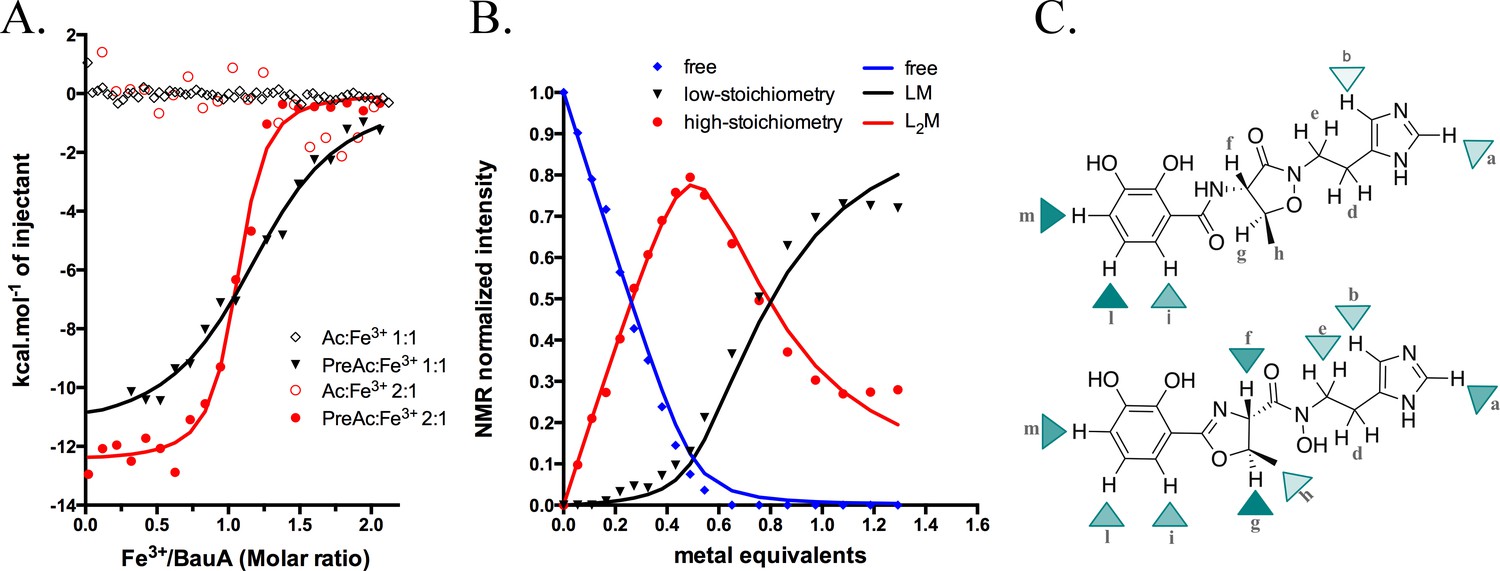
Siderophore iron complex stoichiometry.
(A) Isothermal calorimetry titrations of Fe3+-preacinetobactin (ratio 1:2 in red sphere and 1:1 in black triangle) and Fe3+-acinetobactin (ratio 1:2 in open red circle and 1:1 in open black lozenge). For Fe3+-preacinetobactin, the isotherm fitted with the Origin software gave a Kd of 83 and 763 nM for the ratio 1:2 and 1:1, respectively. With both ratios, no interaction has been detected for Fe3+-acinetobactin. (B) Results of curve fitting for titration of preacinetobactin in acetate buffered saline (ABS) at pH 5.0 (meter reading) with Ga3+. Results are shown for the proton resonance due to the methyl group and the curves correspond to the complexation model with the lowest total square deviation between the calculated (solid lines) and the experimental data (dots). Key: L, ligand; M, metal. (C) Molecular structure of acinetobactin (top) and preacinetobactin (bottom) is shown together with color-coded markers. Cyan triangles were used to represent the chemical shift difference observed in ABS between the resonance of the L2M complex and the corresponding one for the free L in the absence of metal ions (Table 1). Maximum colour intensity was set for the largest shift observed for each case and rescaling the other markers proportionally. Some markers are missing because corresponding resonances were not sufficiently resolved.
Figure 3—figure supplement 1
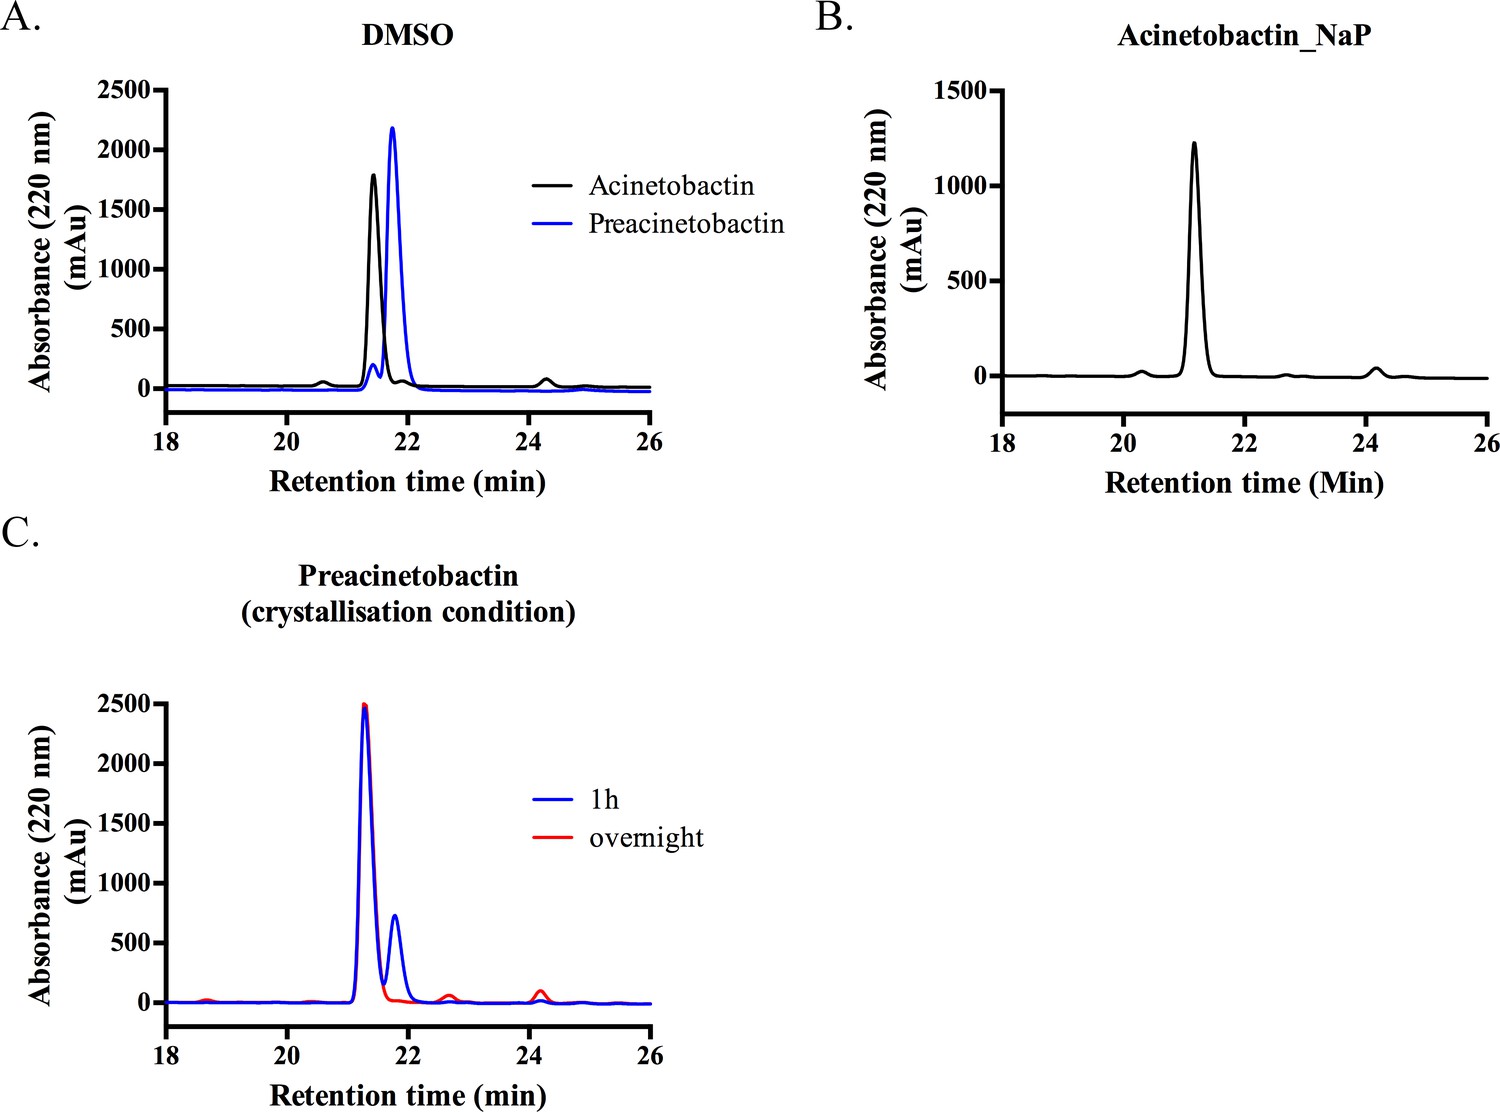
Preacinetobactin and acinetobactin analyses by HPLC.
(A) In DMSO, both samples contain small amounts of the other species (retention time 21.10 and 21.43 min for acinetobactin and preacinetobactin respectively). (B) In 100 mM sodium phosphate buffer, preacinetobactin fully converts to acinetobactin. (C) In the crystallization condition (0.1 M Hepes pH 7.5), 2/3 of preacinetobactin is converted into acinetobactin after 1 hr and is fully converted overnight.
Figure 3—figure supplement 2
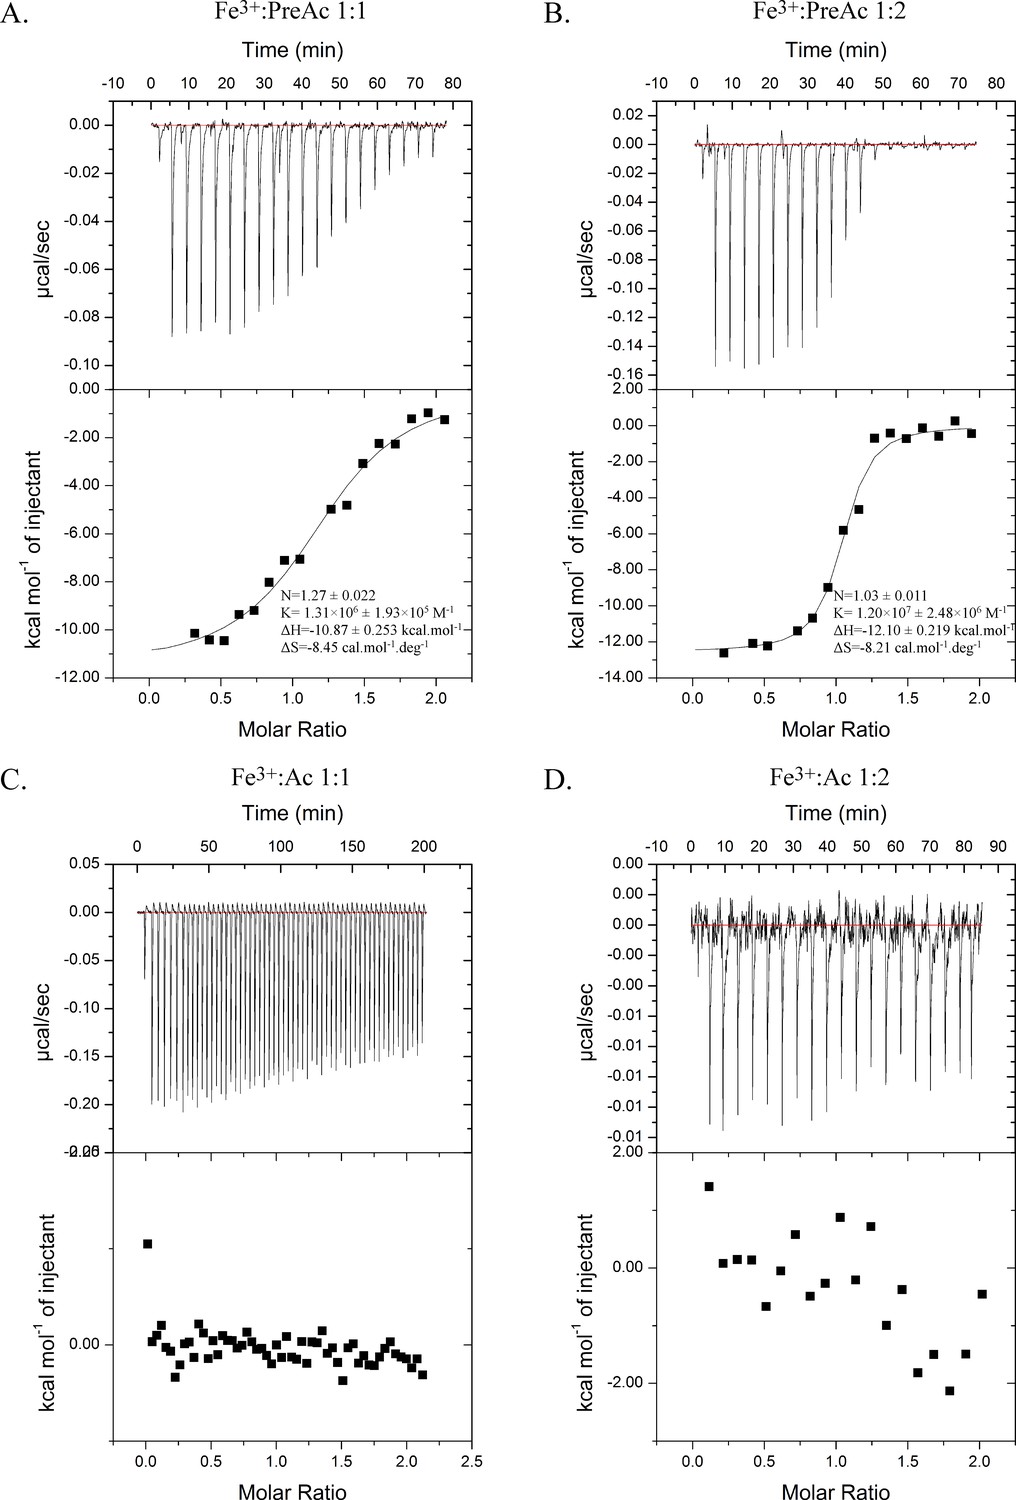
Isothermal calorimetry titrations of Fe3+-Preacinetobactin (ratio 1:1 (A) and 1:2 (B)) and Fe3+-acinetobactin (ratio 1:1 (C) and 1:2 (D)) with BauA.
Top panel raw titration data and bottom panel the fitted isotherm after the control subtraction using Origin software. Experiments A, B, D have been done using an ITC200 and C with a VP-ITC.
Figure 3—figure supplement 3

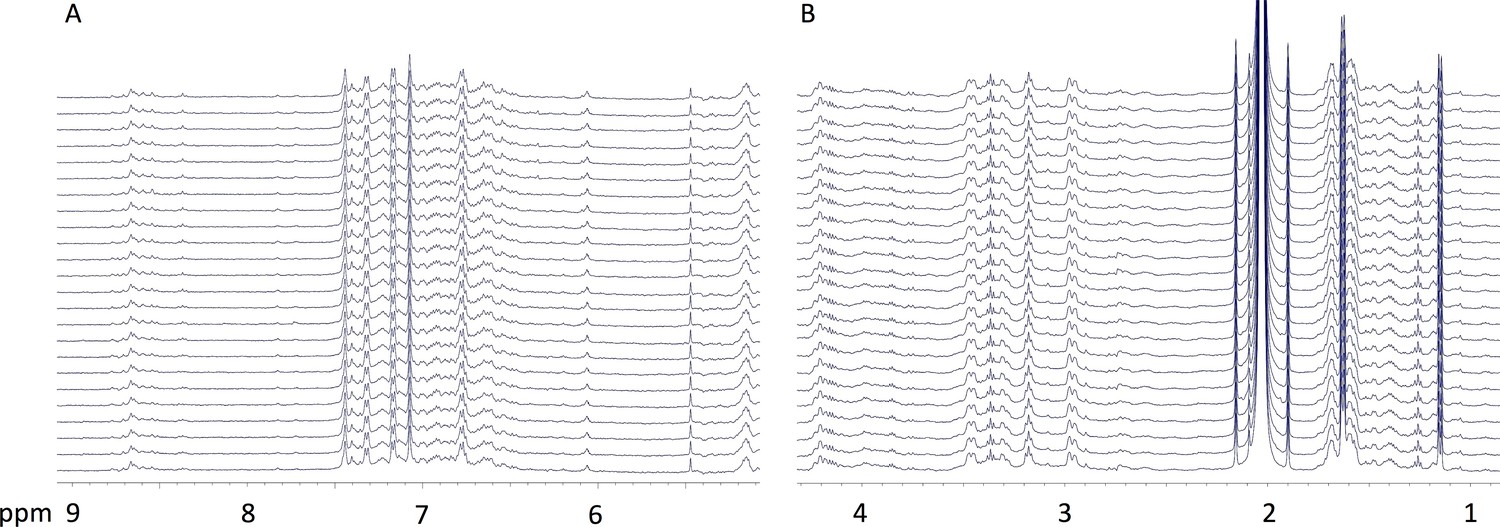
Selected 1H-NMR spectra along the titration of preacinetobactin and acinetobactin with Ga3+.
The molecular structure of both (A) preacinetobactin and (B) acinetobactin are shown together with lower case labels indicating the different proton groups. For each of the two siderophores, selected 1H-NMR spectra are shown from the corresponding titration with Ga3+ ions in acetate buffered saline. In particular, in the case of preacinetobactin (A), three spectra were selected, where the free ligand (0 eq. Ga3+), the ML2 complexes (0.5 eq. Ga3+) and the ML complex (1.0 eq. Ga3+) concentration is maximum, respectively. In the case of acinetobactin (B), two spectra were selected, where the free ligand (0 eq. Ga3+) and the complex (stoichiometry not determined; 0.3 eq. Ga3+) concentration is maximum, respectively. On each spectrum, lower case labels are used to show resonance assignments for the different species formed along the titration.
Figure 3—figure supplement 4
Preacinetobactin is not converted to acinetobactin when involved in metal ion coordination.
At the end of the titration of preacinetobactin with Ga3+ in acetate buffered saline (1.3 eq. Ga3+), one 1H-NMR spectrum was acquired each hour (from bottom to top) for 24 hr. The regions at frequency (A) higher and (B) lower than the water resonance (~4.78 ppm) are shown. No significant changes in the spectrum are observed.
Figure 3—figure supplement 5
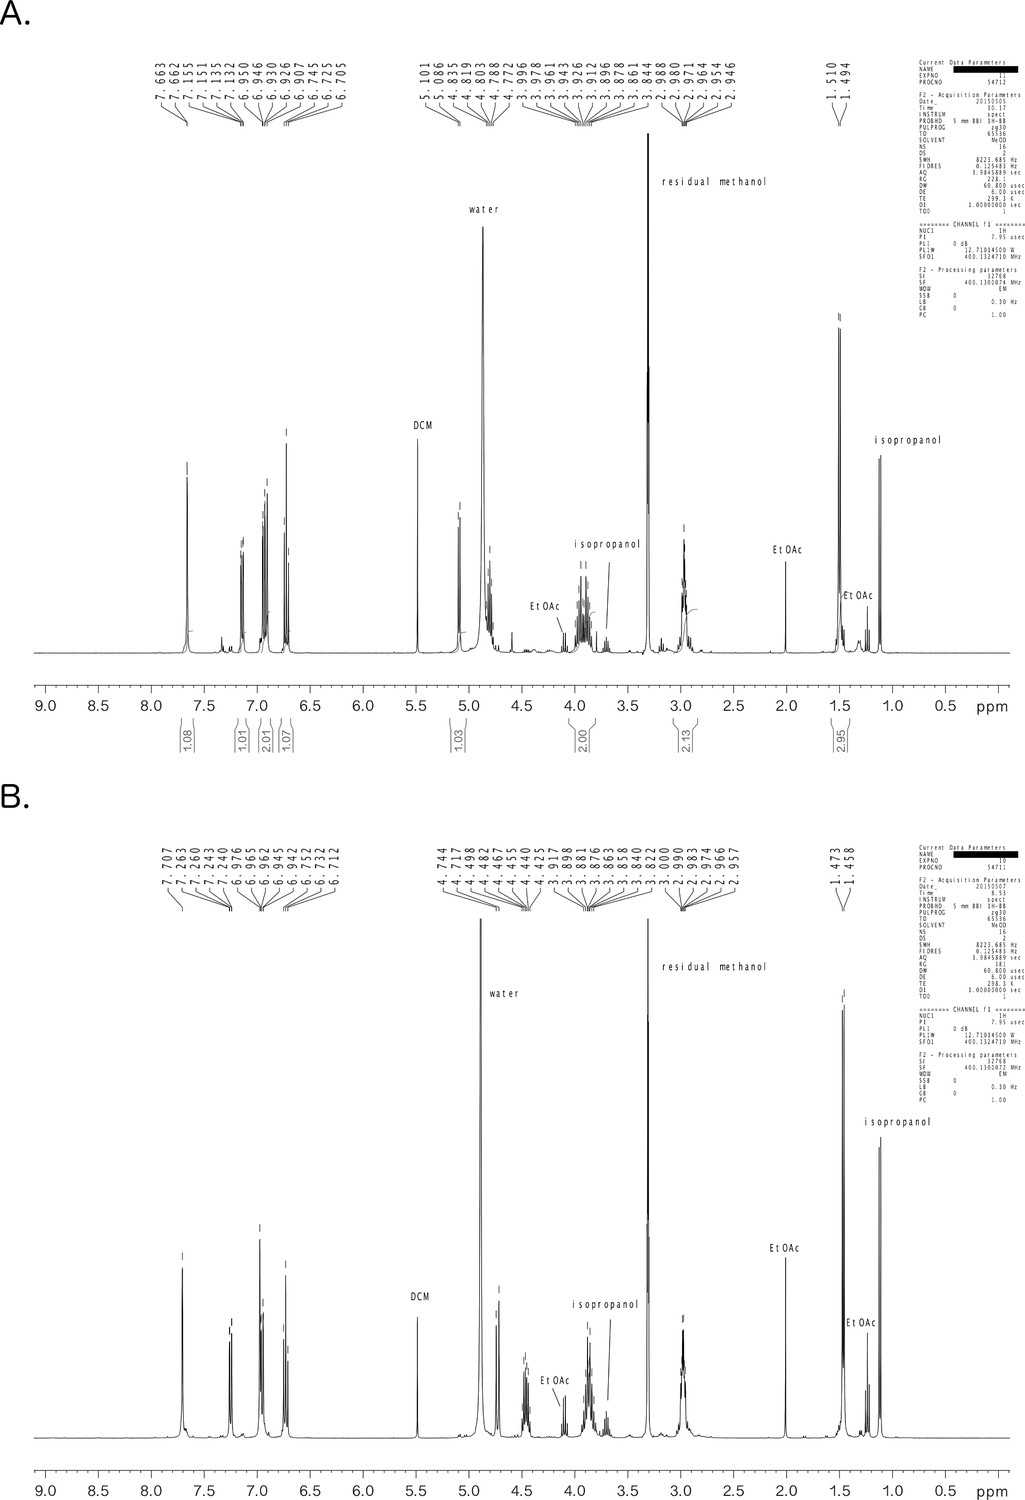
1H NMR spectral data of preacinetobactin (A) and acinetobactin (B).
Spectra have been recorded at 25°C in CD3OD with a Bruker Avance spectrometer (ZH035003, SN1423) with a 9.4 T magnet, 400 MHz for 1H (Z54948, SN01072) and 5 mm BBI probe (PA BBI 400S1 H-BB-D, SN 2820201). The temperature was controlled with a nitrogen flushed BCU-05 temperature unit. Topspin 2.1 software was used for acquisition, automated with Icon NMR 4.1.1 and TopShim (including automatic tuning, matching and shimming). Topspin 2.1 or Topspin 3.2 software were used for evaluation.
Figure 4
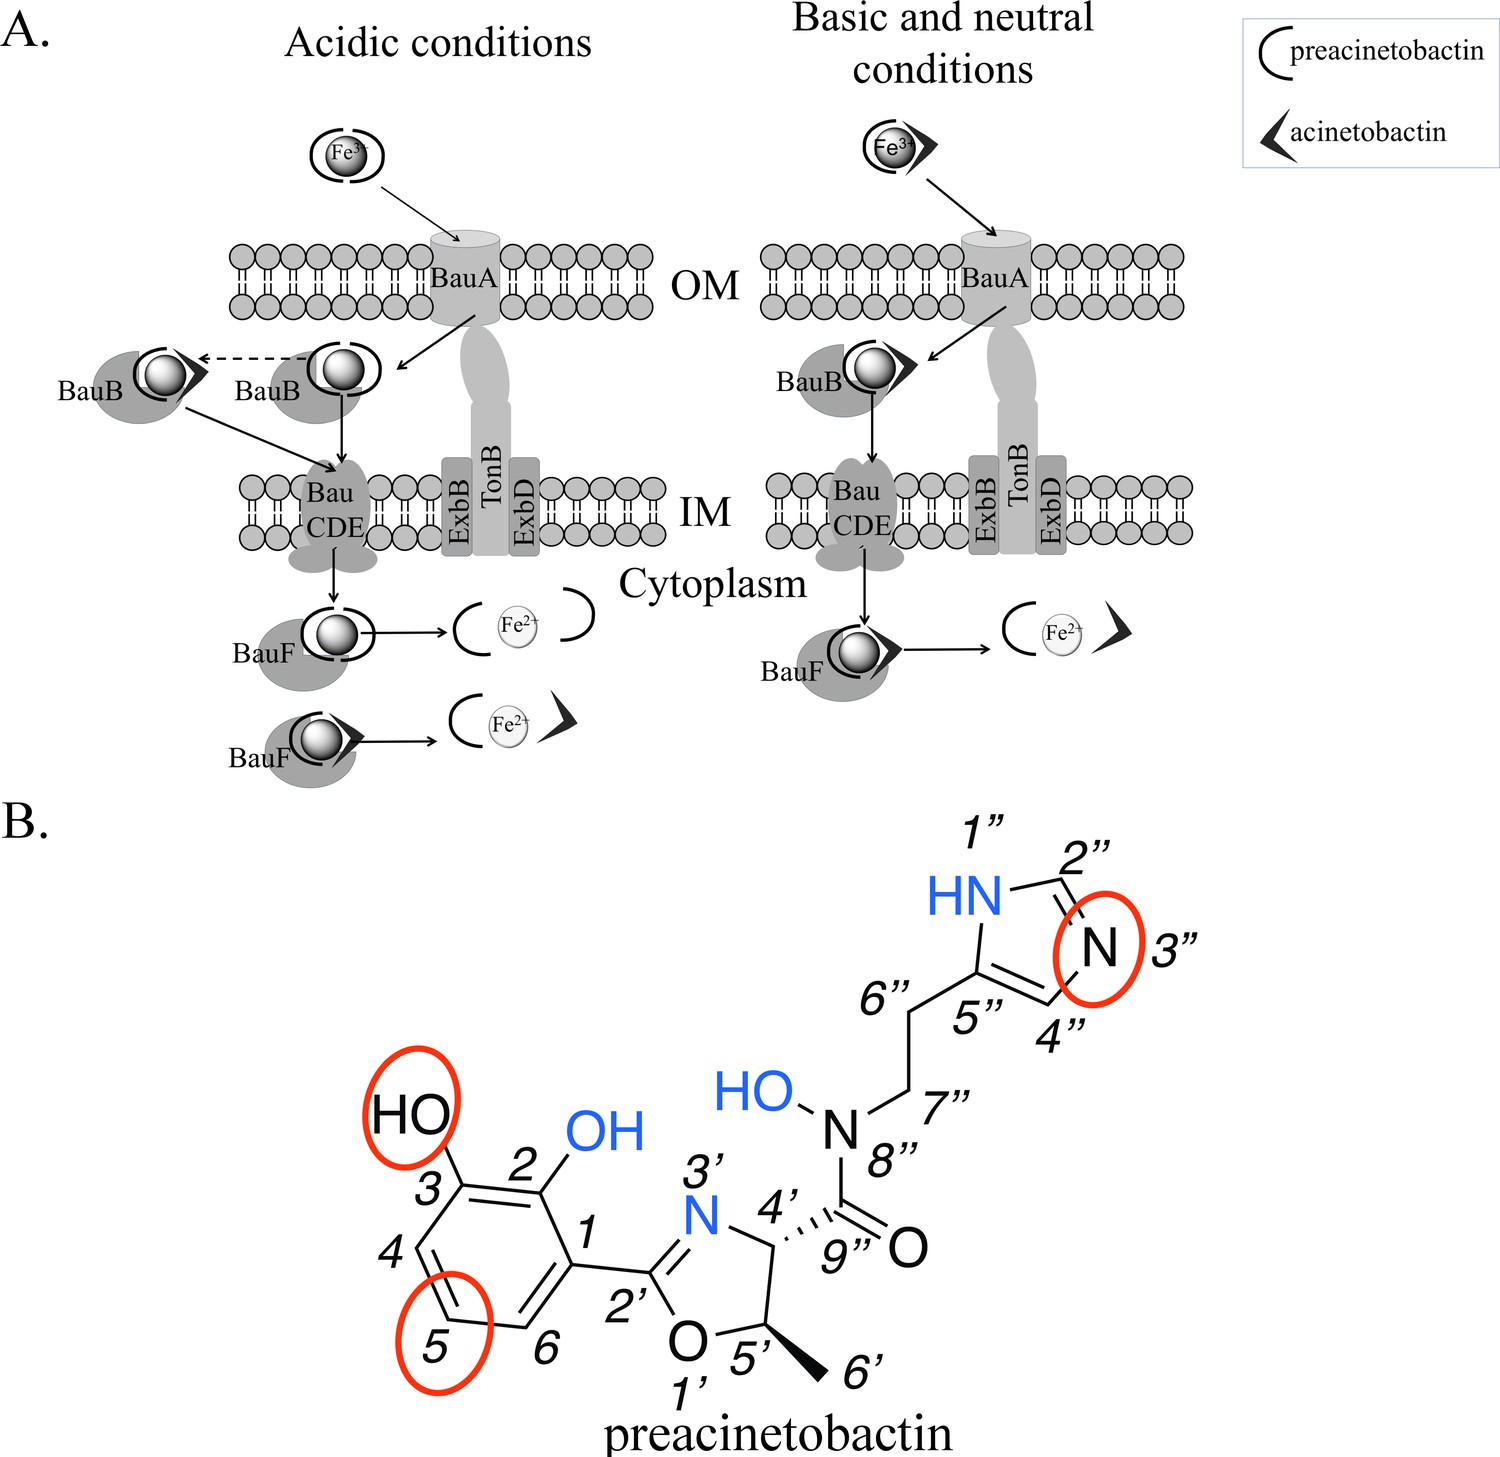
Model of preacinetobactin/acinetobactin uptake and opportunities for design.
(A) In acidic environments, preacinetobactin is stable. Two molecules can chelate Fe3+ and the complex could be stable thus recognised and transported by the TonB dependent transporter, BauA. Once in the periplasm, BauB, a periplasmic binding protein, delivers the Fe3+-siderophore to the inner membrane ABC transport system (BauCDE) to cross the inner membrane. The release of the Fe occurs into the cytoplasm with the help of BauF, a hydrolase. In neutral pH conditions, preacinetobactin isomerizes into acinetobactin. Fe3+ chelation stabilizes one molecule of preacinetobactin but the second molecule isomerizes. The heterotrimeric Fe3+-preacinetobactin-acinetobactin complex is recognised and possibly transported by BauA. (B) Functional groups involved in the Fe3+ chelation are highlighted in blue and the ones which could be modified in the design of siderophore antibiotic conjugates are circled in red.
Tables
Table 1
Chemical shift difference (absolute value of ppm in the absence – ppm in the presence of metal ions) is reported for the resonances of both preacinetobactin and acinetobactin during titration.
https://doi.org/10.7554/eLife.42270.016| 1H nuclei† | preacinetobactin‡ | Acinetobactin |
|---|---|---|
| a | 0.34 | 0.07 |
| b | 0.17 | 0.02 |
| d | n.r. | n.r. |
| e | 0.16 | n.r. |
| f | ~0.4§ | n.r. |
| g | 0.56 | n.r. |
| h | 0.12 | n.o. |
| i | 0.27 | 0.15 |
| l | 0.27 | 0.30 |
| m | 0.39 | 0.28 |
-
The titration performed in acetate buffered saline with Ga3+. Reported values correspond to 0.5 and 0.3 eq. Ga3+ in the case of preacinetobactin and acinetobactin, respectively.† Labels refer to Figure 3C.‡ Two resolved resonances were observed for protons g, h, i, l and m, due to two different L2M species (see the main paper). Average values are reported here.§ Complex overlapped with residual water’s resonance. Value estimated by comparison with additional titration performed in DMSO. n.r.: not sufficiently resolved. n.o.: difference not observed.
Table 2
Crystallographic data and refinement statistics
https://doi.org/10.7554/eLife.42270.017| Semet 6H7V | Apo 6HCP | Complex 6H7F | |
|---|---|---|---|
| Data collection | |||
| Space group | C 1 2 1 | C 1 2 1 | C 1 2 1 |
| Cell dimensions | |||
| a, b, c (Å) α, β, γ (°) | 182.3, 220.4, 101.7 90, 98.7, 90 | 180.2, 219.5, 101.4 90, 99.2, 90 | 179.6, 220.7, 101.1 90, 99.2, 90 |
| Resolution (Å) | 139.53–2.54 (2.61–2.54)* | 57.24–1.83 (1.88–1.83)* | 49.93–2.26 (2.30–2.26) |
| Rsym or Rmerge | 0.12 (0.789) | 0.049 (0.665) | 0.108 (0.844) |
| I / σI | 19.3 (3.8) | 17.1 (2.2) | 9.2 (1.6) |
| Completeness (%) | (99.9) 100 | 99.7 (99.6) | 99.8 (99.9) |
| Redundancy | 15.2 (14.1) | 3.8 (3.9) | 3.8 (3.8) |
| CC half | - | - | 0.995 (0.527) |
| Anom completeness | 99.9 (99.9) | - | - |
| Ano multiplicity | 7.5 (6.9) | - | - |
| Refinement | |||
| Resolution (Å) | 139.53–2.54 | 57.24–1.83 | 49.93–2.26 |
| No. of reflections | 123,580 | 322,409 | 171,799 |
| Rwork/Rfree | 0.183/0.213 | 0.156/0.176 | 0.187/0.217 |
| No. of atoms | |||
| Protein | 15,424 | 16,060 | 15,854 |
| Ligand/ion | 201 | 754 | 691 |
| Water | 303 | 1995 | 752 |
| B-factors | |||
| Protein | 44.4 | 33.40 | 39.70 |
| Ligand/ion | 60.4 | 57.70 | 59.22 |
| Water | 36.90 | 45.90 | 36.87 |
| R.m.s deviations | |||
| Bond lengths (Å) | 0.010 | 0.008 | 0.008 |
| Bond angles (°) | 1.24 | 1.16 | 0.958 |
-
Each dataset was collected from a single crystal. *Values in parentheses are for highest-resolution shell.
Download links
A two-part list of links to download the article, or parts of the article, in various formats.
Downloads (link to download the article as PDF)
Open citations (links to open the citations from this article in various online reference manager services)
Cite this article (links to download the citations from this article in formats compatible with various reference manager tools)
Preacinetobactin not acinetobactin is essential for iron uptake by the BauA transporter of the pathogen Acinetobacter baumannii
eLife 7:e42270.
https://doi.org/10.7554/eLife.42270


