Reactivation of a developmental Bmp2 signaling center is required for therapeutic control of the murine periosteal niche
- Harvard School of Dental Medicine, United States
- University of Zürich, Switzerland
- Universidade Federal de São Paulo, Brazil
- Linköping University, Sweden
- Regeneron Pharmaceuticals, United States
- Kitasato University, Japan
- Vanderbilt University Medical Center, United States
- Geisinger Health System, United States
Figures
Figure 1 with 3 supplements
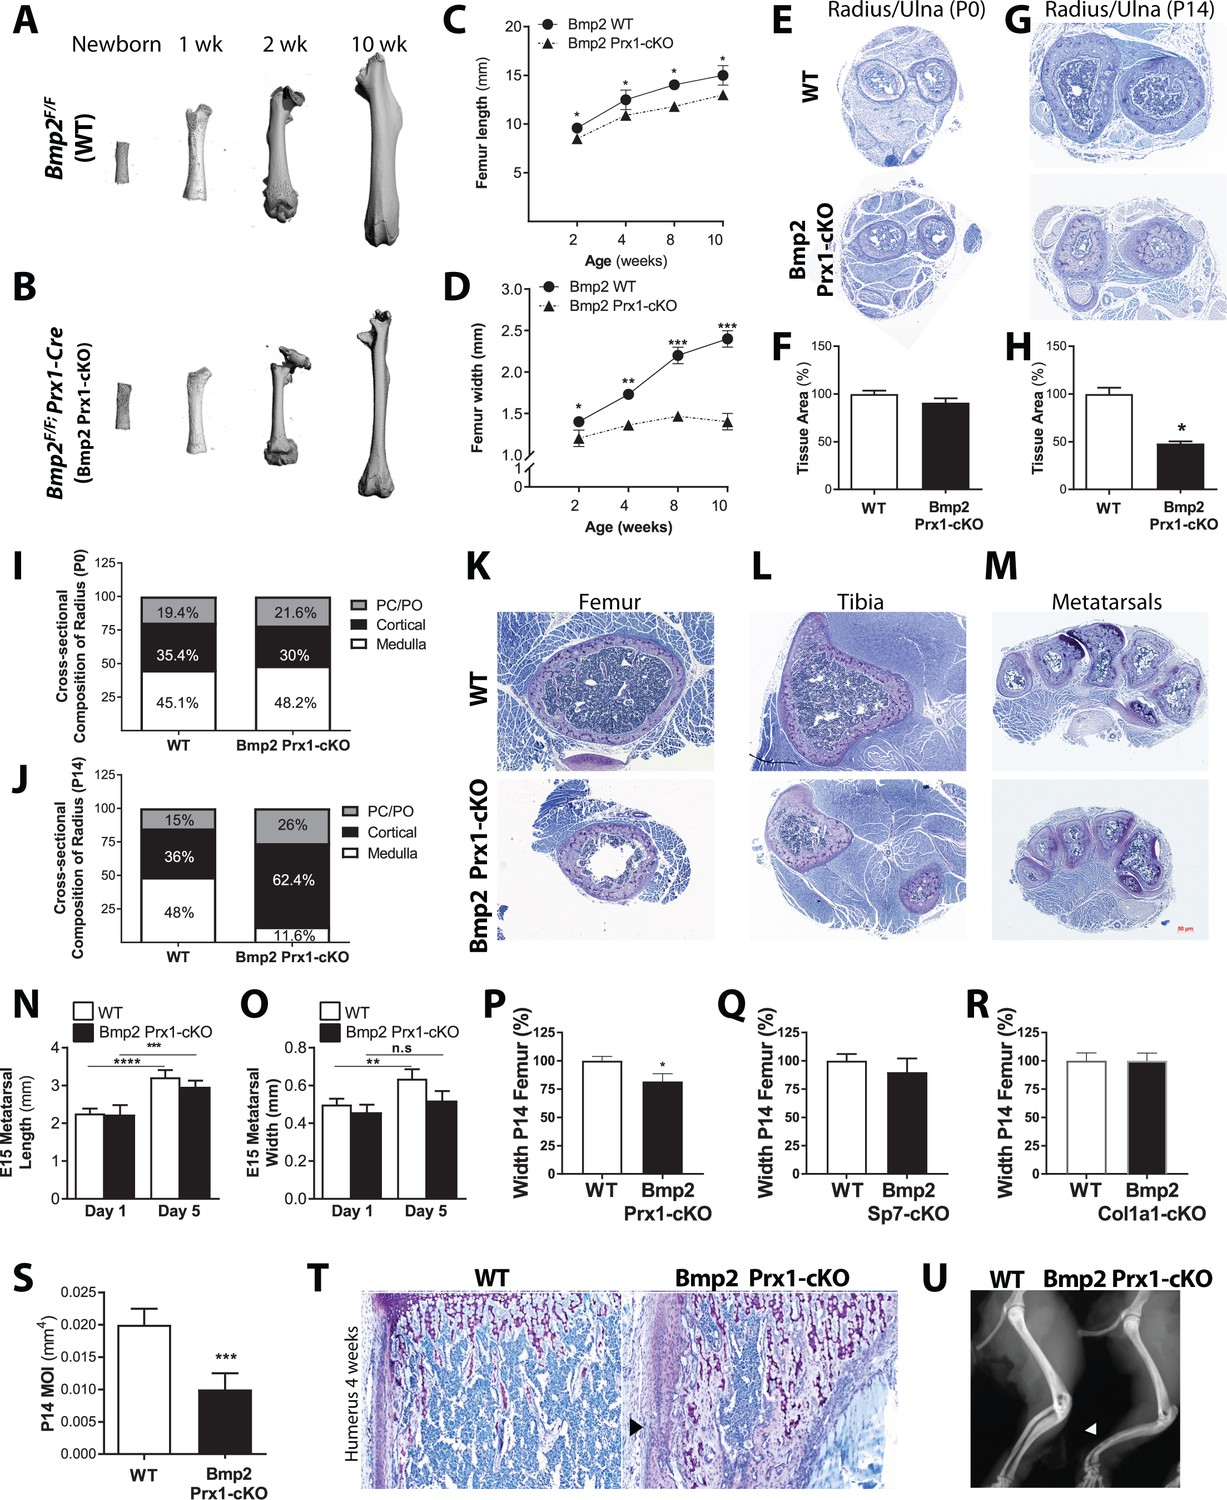
Osteoprogenitor-derived Bmp2 couples length to width in the appendicular skeleton.
(a,b) Representative 3D reconstructions of the murine femur using microcomputed tomography (microCT). (c) Femoral length or (d) femoral width at mid-diaphysis, presented as mean ± s.d. with n = 8–20 bones per age per genotype. *p<0.05, **p<0.005, or ***p<0.0005 vs. age-matched Bmp2 Prx1-cKO cohort. (e,g) Representative toluidine blue histology at the mid-diaphysis of the forelimb. (f,h) MicroCT analysis of total cross-sectional bone tissue area presented as mean ±s.d. with n = 4. *p>0.05. (i,j) Cross-sectional composition of cortical bone in the radius of newborn (n = 6–9 per genotype) or 2 week-old mice (n = 3–9 per genotype) (see Materials and methods). Abbreviations: PC, perichondrium; PO, periosteum. (k,l,m) Representative toluidine blue histology at the mid-diaphysis of indicated skeletal elements. (n) Length or (o) width of embryonic day 15 metatarsals, measured following 1 or 5 days of ex vivo culture. Mean ±s.d. with n = 6–12 where **p<0.005, ***p<0.005, or ****p<0.00005. (p,q,r) Femur width mean ±s.d. with n = 6–12 where *p<0.05. (s) Minimum moment of inertia in P14 femur, calculated by microCT (n = 4) shown as mean ±s.d. where ***p<0.0005. (t) Toludine blue histology revealing cortical microcracks in the humerus of Bmp2 Prx1-cKO mice at 4 weeks of age. (u) X-ray images showing representative bowing of the radius and ulna of Bmp2 Prx1-cKO mice in the absence of frank fractures. Statistical analyses were performed using two-tailed Student’s t-test.
Figure 1—figure supplement 1

BMP2 acts downstream of IGF-1 pathway in the periosteum.
(a) Persistence of IGF1 +cells in Bmp2 Prx1-cKO periosteum. Transverse sections of the radius and ulna were imaged in brightfield following immunostaining to visualize cells expressing IGF-1. (b) Elisa analysis demonstrates that circulating levels of IGF-1 are not statistically reduced in Bmp2 Prx1-cKO mice.
Figure 1—figure supplement 2

Skeletal phenotype analysis of Bmp2Flox/Flox; Col1a1-Cre mice shows that loss of Bmp2 in mature osteoblasts does not cause a periosteal growth defect.
(a,b) Alizarin red and alcian blue whole mount staining of (a) forelimbs and (b) hindlimbs from at postnatal day 14 mice. (c,d) Representative toluidine blue histology at the mid-diaphysis of the (c) forelimb or (c) femur at postnatal day 14. (e) X-ray imaging shows that Bmp2 Col1a1-cKO reach peak adult body size with no evidence of spontaneous fractures. (f) Length and width remain coupled at postnatal day 14 following ablation of Bmp2 in mature osteoblasts.
Figure 1—figure supplement 3
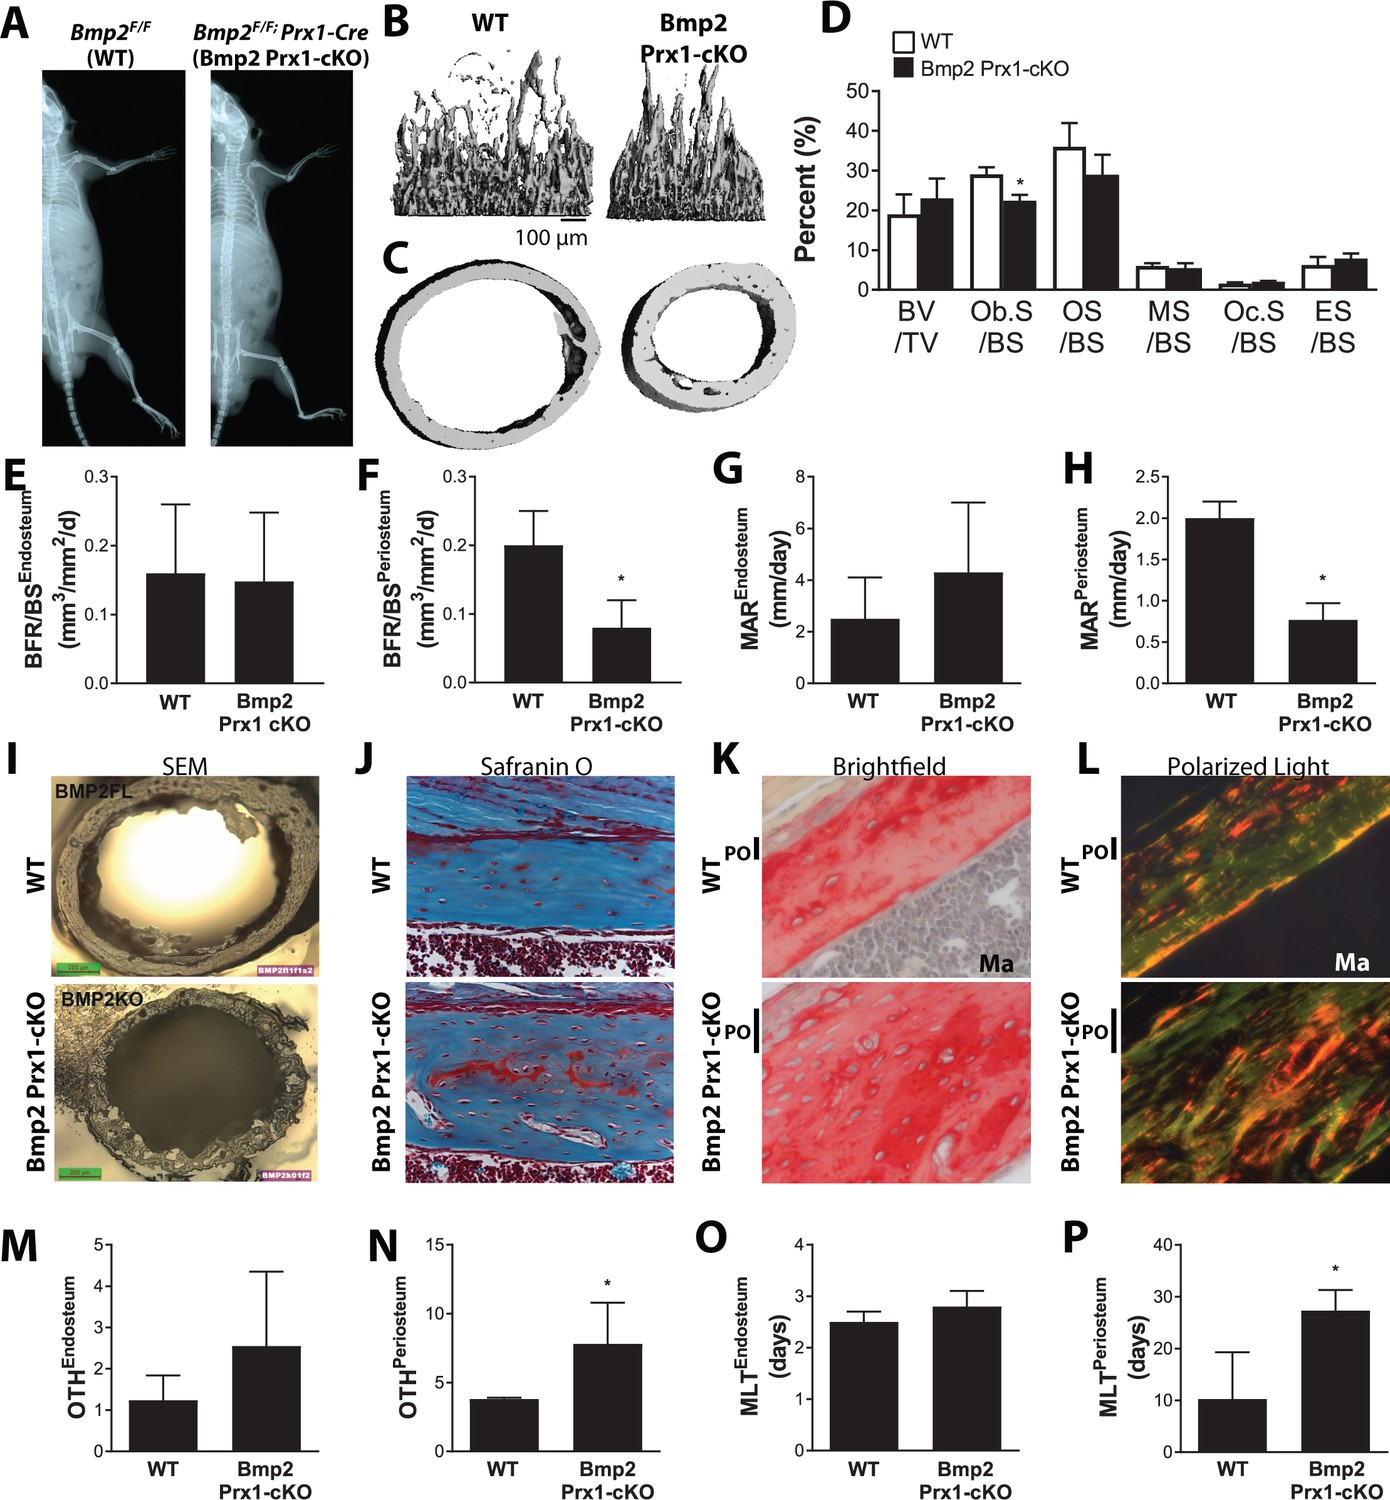
Skeletal phenotype analysis of Bmp2Flox/Flox; Prx1-Cre mice reveals architectural abnormalities compounded by material defects.
Bone mass analyzed in the femur of juvenile (2 week-old) mice by microcomputed tomography (microCT). (a) X-ray imaging shows that Bmp2 Prx1-cKO reach peak adult body size despite slender bones. (b) Trabecular bone at the distal metaphysis and (c) cortical bone at the mid-diaphysis of the femur visualized by 3D reconstructions. Images represent the group mean and are shown to scale. (d–h) Dynamic histomorphometry assessing bone formation rate as a function of bone surface (BFR/BS) at (e) endosteal versus (f) periosteal surfaces, or mineral apposition rate (MAR) at (g) endosteal versus (h) periosteal surfaces. n = 4, presented as mean ±s.d. where *p<0.05 vs. age-matched Bmp2F/F littermates. (i) Scanning electron microscopy of cross-sections at the femoral mid-diaphysis. (j) Residual cartilage islands and increased osteocyte density in the femur of Bmp2 Prx1-cKO mice visualized by safranin O and nuclear red staining. (k,l) Picrosirius red and hematoxylin stain, followed by polarized light microscopy reveal accumulation of disorganized collagen extracellular matrix in the femur of Bmp2 cKO mice. (m–p) Dynamic histomorphometry assessing osteoid thickness (OTH) at (m) endosteal versus (n) periosteal surfaces, or mineralization lag time (MLT) at (o) endosteal versus (p) periosteal surfaces. n = 4, presented as mean ±s.d. where *p<0.05 vs. age-matched Bmp2F/F littermates.
Figure 2 with 2 supplements
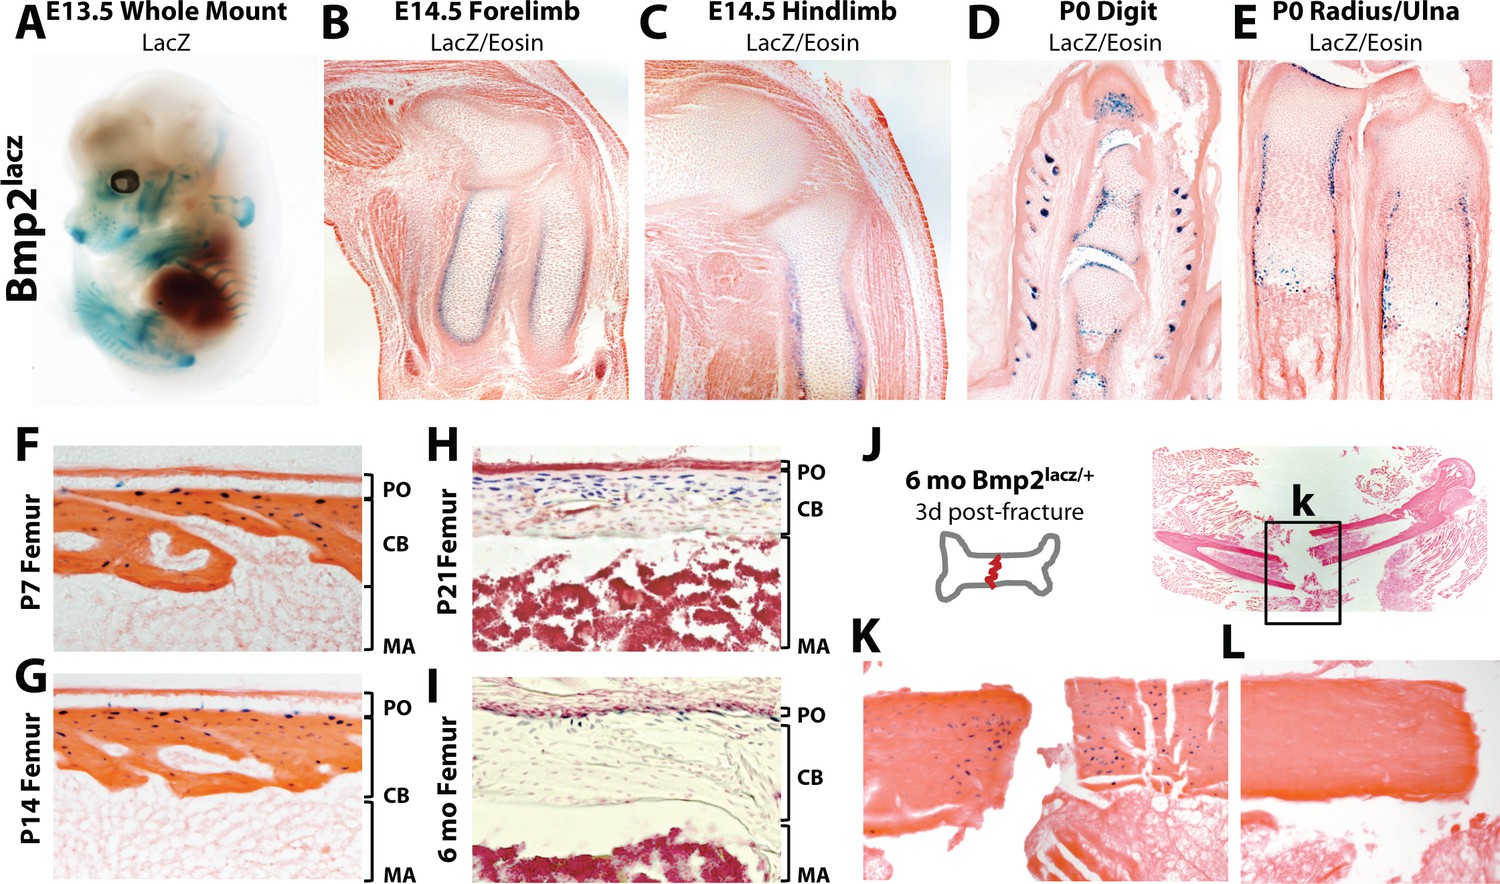
Robust versus quiescent states of Bmp2 expression reflect active versus homeostatic states of periosteal bone growth.
LacZ staining on tissues from mice expressing beta-galactosidase from one allele of the endogenous Bmp2 locus (Bmp2lacz/+). (a) Lateral view of a whole mount E13.5 Bmp2lacz/+ mouse embryo, representative of other Bmp2lacz/+ littermates. (b,c) Longitudinal sections through the (b) forelimb or (c) hindlimb of E14.5 Bmp2lacz/+ mouse embryos. (d,e) Longitudinal sections of (d) digits or (e) radius/ulna of newborn Bmp2lacz/+ mice. (f–l) Longitudinal sections through cortical femoral bone from (f) 7 day-old, (g) 14 day-old, (h) 21 day-old or (i) 6 month-old Bmp2lacz/+ mice. Abbreviations: PO (periosteum), CB (cortical bone), or MA (marrow) in brackets. (j–l) Standardized fractures were established in femurs of Bmp2lacz/+ and WT littermate mice (n = 3). (k,l) LacZ staining 3 days post-fracture in (k) Bmp2lacz/+ or (l) negative control WT mice.
Figure 2—figure supplement 1

Schematic of the Bmp2lacz knock-in allele.
Homologous recombination was used to replace the first 336 coding nucleotides of murine Bmp2 with non-membrane targeted bacterial beta-galactosidase. (a) Specifics of allele construction from the UC Davis Knock Out Mouse Project repository, Velocigene project ID 12406. (b) Schematic of the targeting strategy and the ZEN-Ub1 replacement cassette. (c) Genomic view of targeted locus visualized with the publicly-available Ensembl genome browser (www.ensembl.org).
Figure 2—figure supplement 2
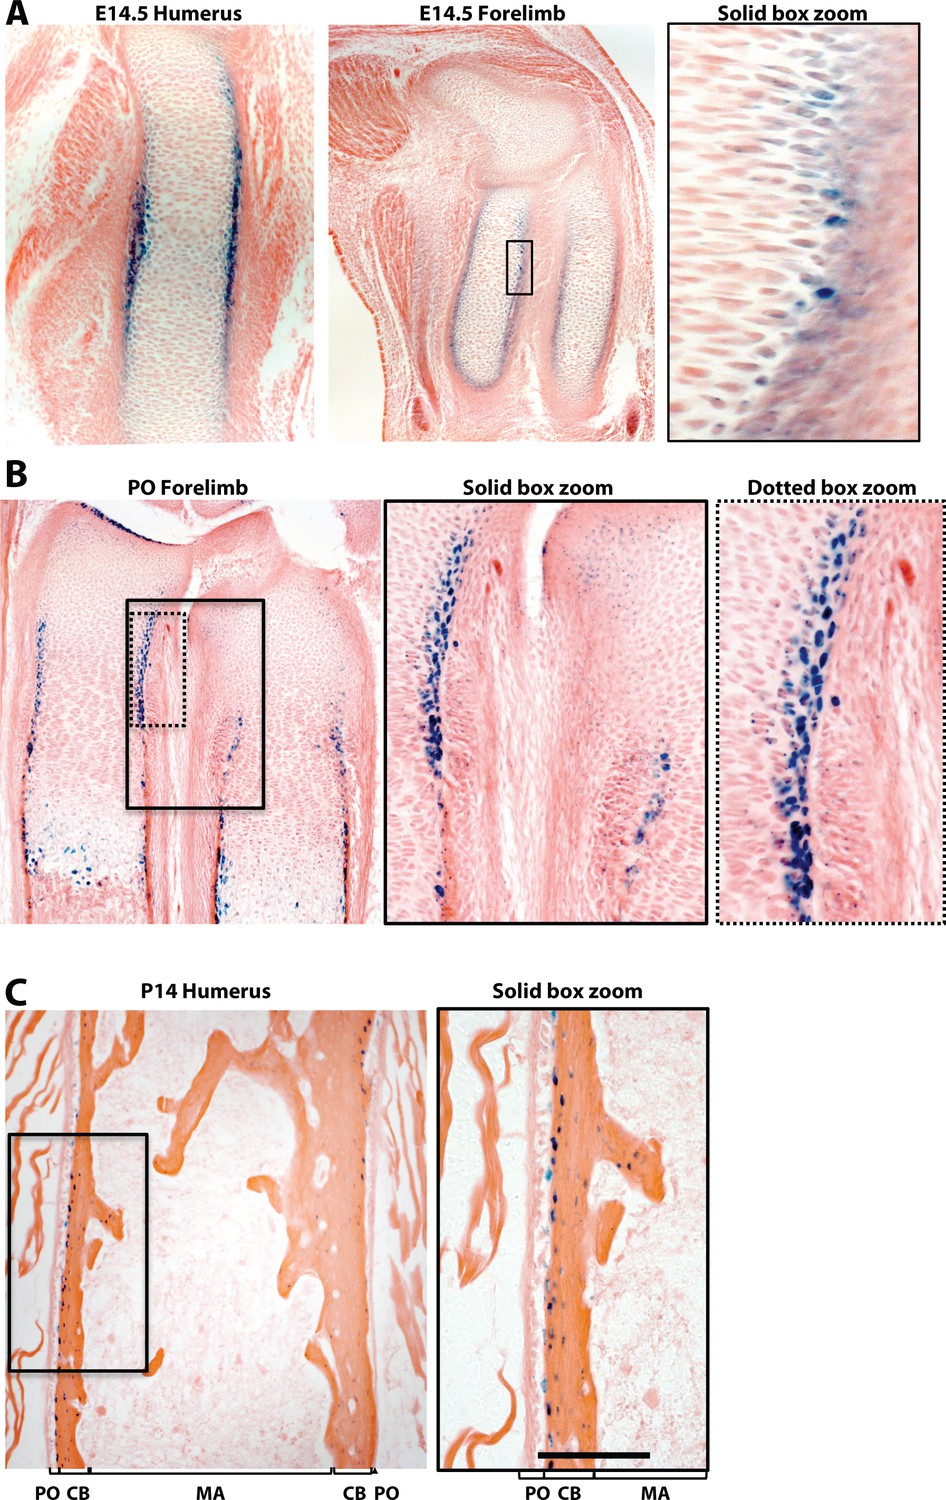
Bmp2 expression domain during periosteal bone growth.
(a) LacZ staining on tissues from mice expressing beta-galactosidase from the endogenous Bmp2 locus (Bmp2lacz/+). Longitudinal sections through the (a) forelimb of an E14.5 Bmp2lacz/+ mouse embryo, (b) forelimb of a newborn Bmp2lacz/+ mouse, or (c) humerus of a 2 week-old Bmp2lacz/+ mouse. Black bar indicates LacZ expression domain in the PO (periosteum), CB (cortical bone), or MA (marrow) in brackets.
Figure 3
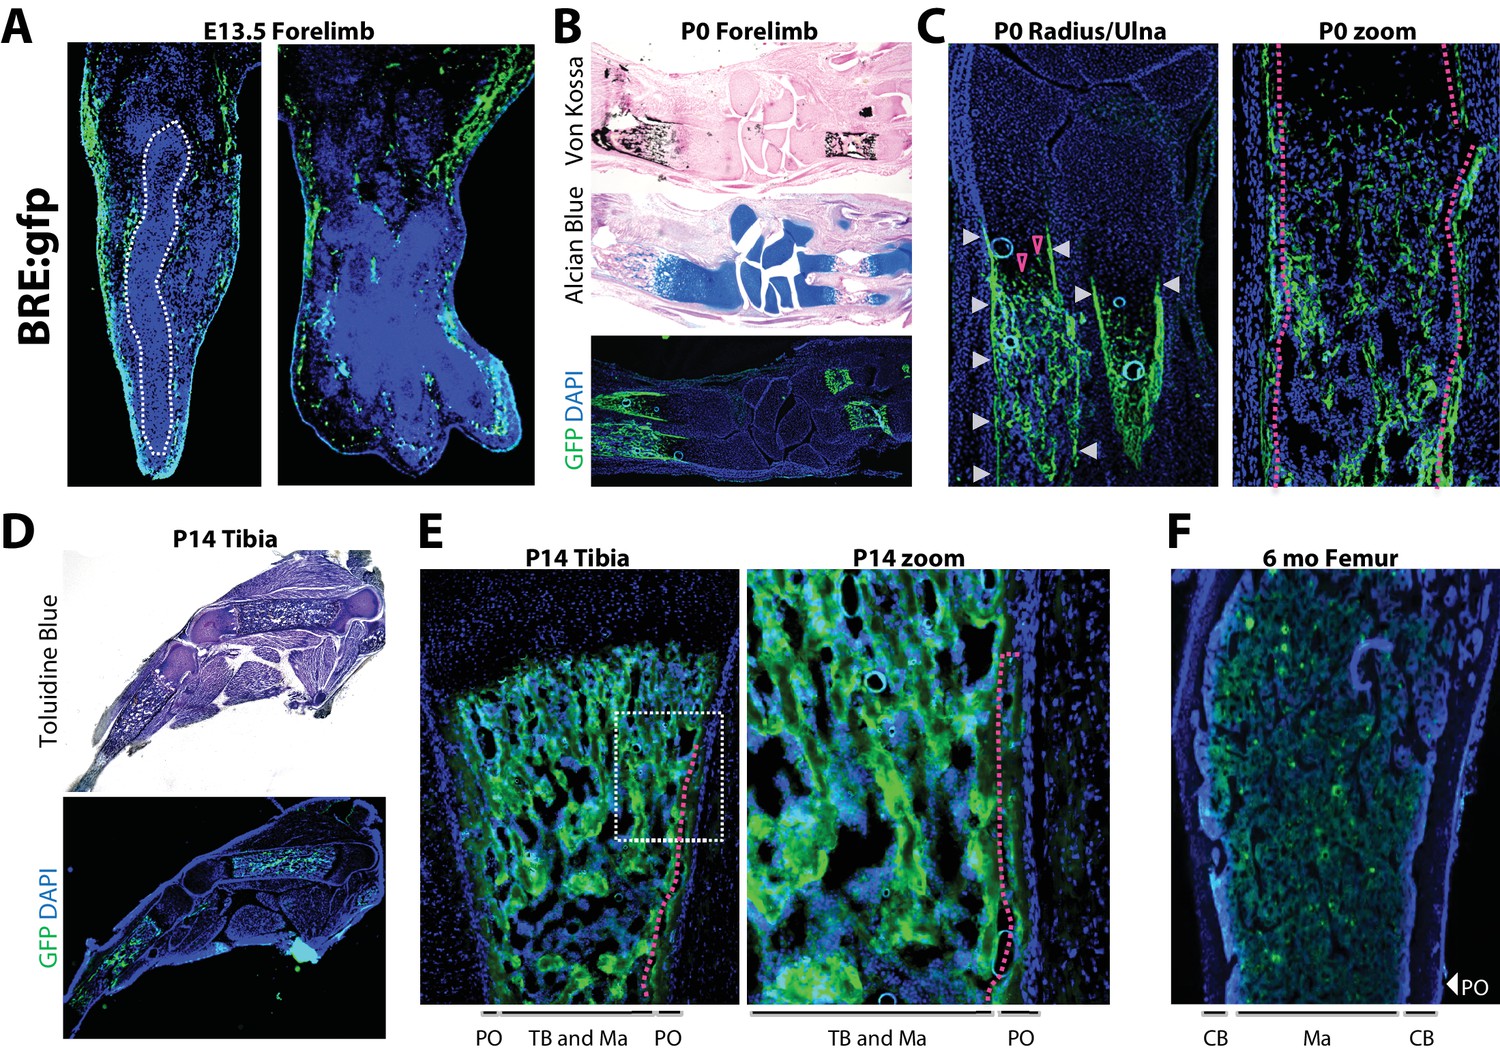
Robust versus quiescent states of periosteal BMP signaling reflect active versus homeostatic states of periosteal bone growth.
Fluorescent and brightfield microscopy on tissues from mice with transgenic expression of enhanced green fluorescent protein (gfp) under the control of a minimal fragment of the Id1 promoter with pan-BMP response elements (BRE:gfp). (a) GFP (green) and DAPI (blue) imaging on sagittal (left) or frontal (right) cryosections of the hand plate from E13.5 BRE:gfp embryos. (b,c) Serial sections through the forelimb of newborn BRE:gfp mice were analyzed by Von Kossa staining for mineralized tissue, Alcian Blue staining for cartilage, or DAPI counterstaining of GFP expression domains. (d,e) Toluidine blue or GFP/DAPI imaging on sagittal cryosections through the femur of (d,e) 2 week-old or (f) 6 month-old BRE:gfp mice. White arrowheads, GFP in the bone collar surrounding the growth plate cartilage; red arrowheads, GFP+ cells in growth plate; red dotted lines demarcate GFP+ cells of the (2c) bone collar or (2e) innermost layer of the periosteum. Abbreviations: PO, periosteum; CB, cortical bone; TB, trabecular bone; Ma, Marrow. For all timepoints, n ≥ 3 histological sections were examined from equivalent skeletal sites of multiple littermate mice.
Figure 4
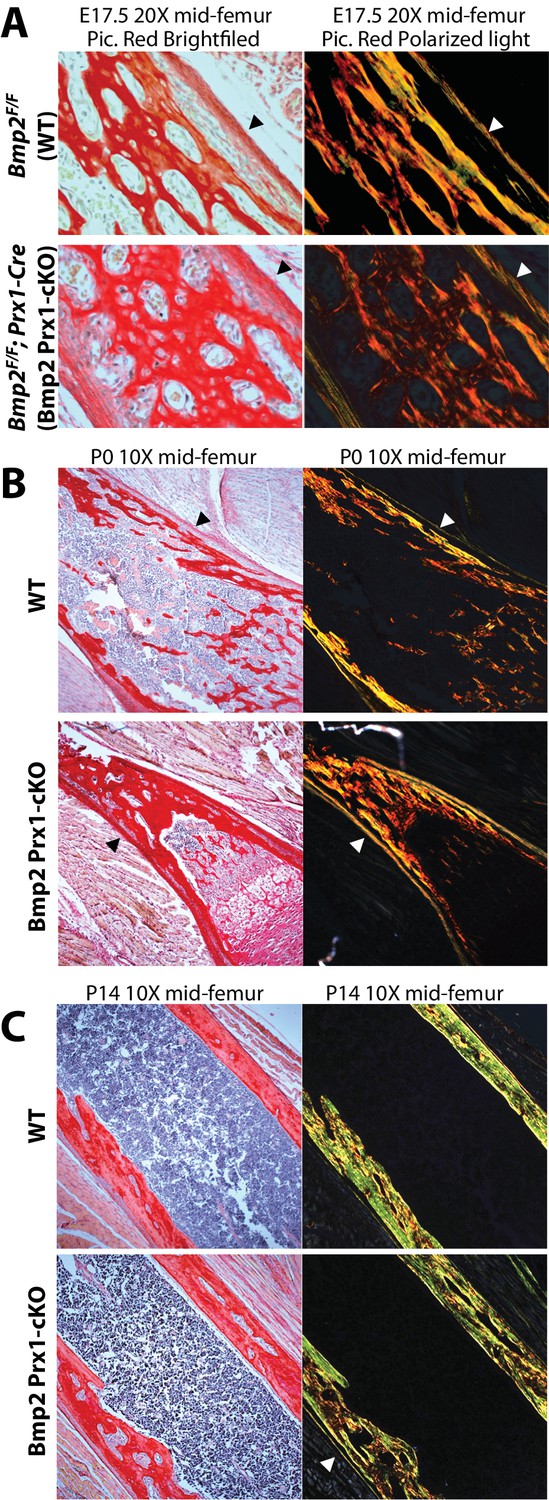
Bmp2 is dispensable for development and maintenance of the periosteum.
(a,b) The periosteum forms during development and is maintained in postnatal life in Bmp2 Prx1-cKO mice. Sagittal sections of the femur from mice were stained with picrosirius red and hematoxylin, and imaged by brightfield (left panels) or polarized light (right panels) microscopy. Images shown are representative of femurs harvested from littermates at ages (a) embryonic day 17.5, (b) postnatal day 0, or (c) postnatal day 14. Arrowheads point to the outer collagen-rich canopy of periosteum in Bmp2 Prx1-cKO mice.
Figure 5
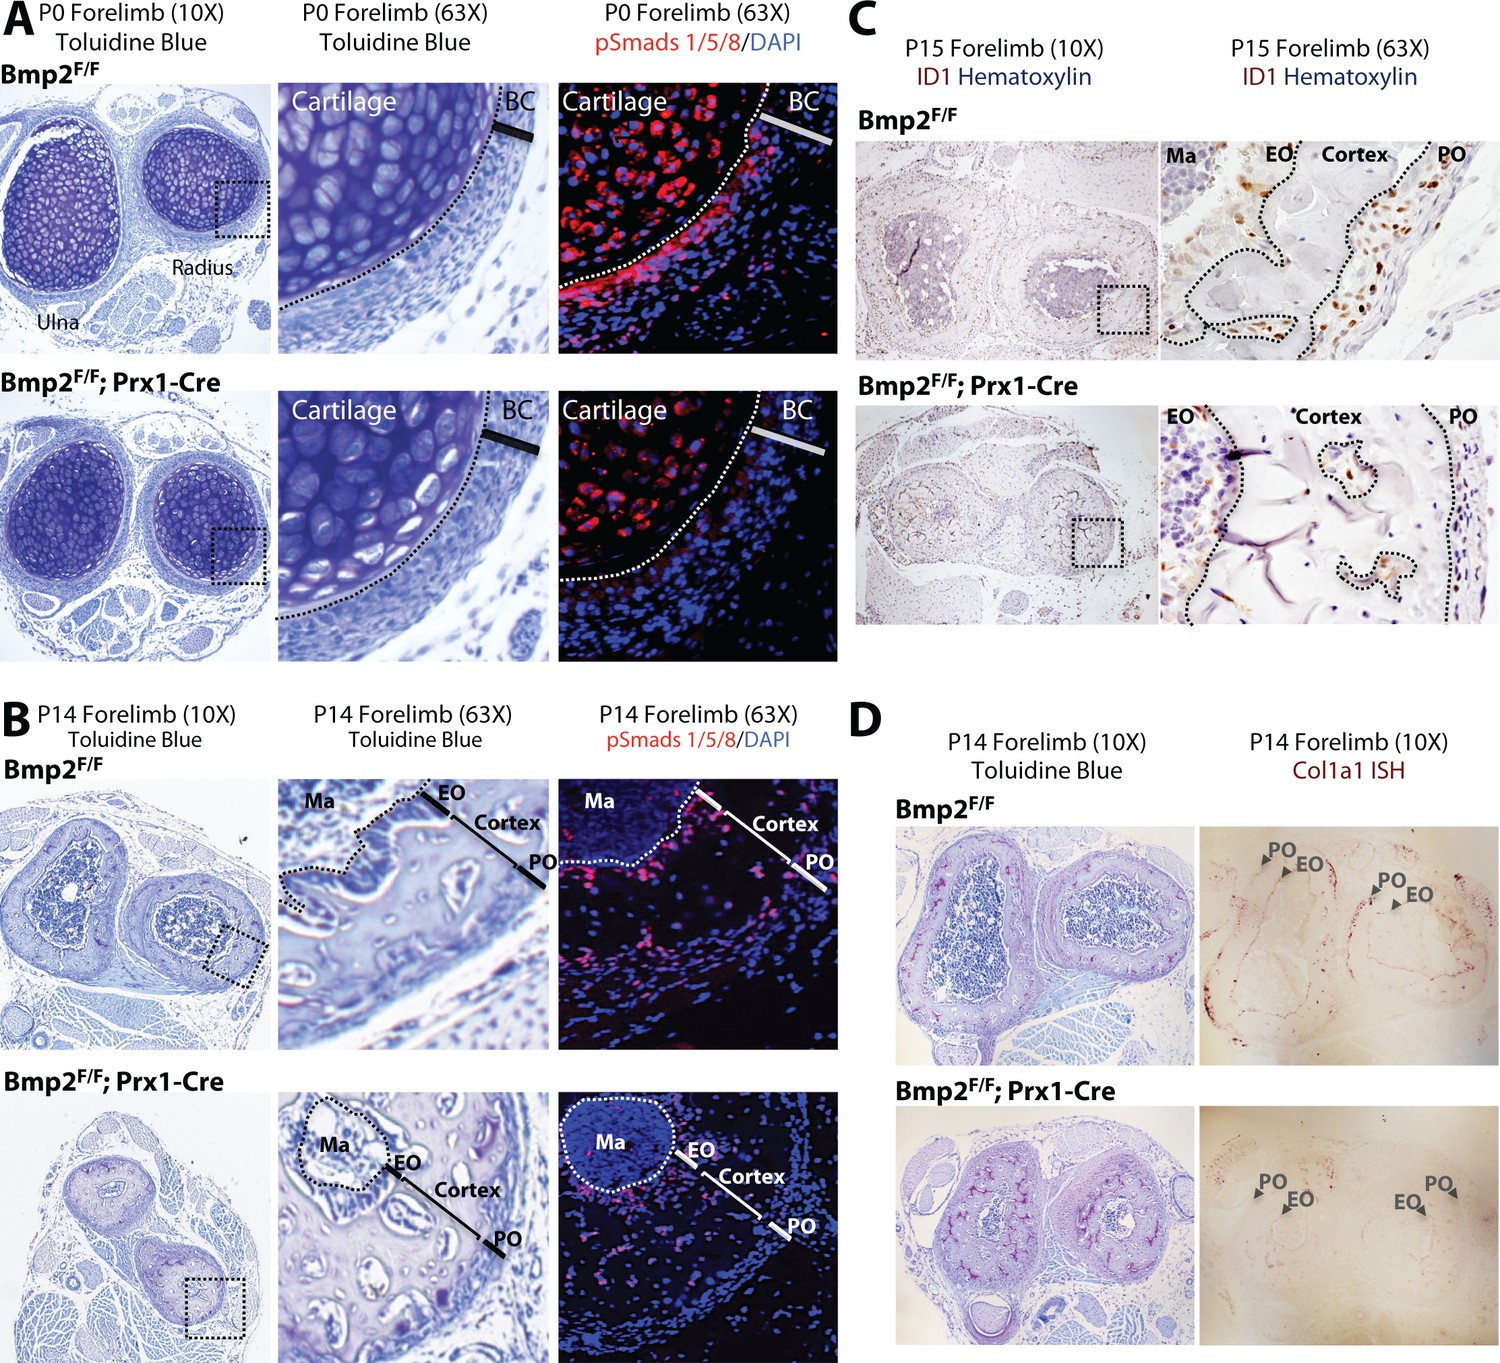
Bmp2 is essential for periosteal BMP signaling and periosteal expression of BMP target genes.
(a,b) Loss of phospho-Smad1/5+ cells in Bmp2 Prx1-cKO periosteum. Transverse serial sections of the radius and ulna from (a) newborn and (b) 2 week-old mice, imaged in brightfield following toluidine blue stain to visualize skeletal tissue (left panels) or by fluorescence microscopy following DAPI and immunostaining to visualize cells with phospho-activated Smads1/5 (right panels). Black boxes on left panels indicate regions expanded in two right panels. (c) Loss of ID1+ cells in Bmp2 Prx1-cKO periosteum. Transverse sections of the radius and ulna were imaged in brightfield following immunostaining to visualize cells expressing the BMP target gene, Id1. Black boxes on left panels indicate regions expanded in right panels. (d) Toluidine blue and in situ hybridization for Col1a1 in cross-sections of the radius/ulna from 2 week-old Bmp2 Prx1-cKO mice. Abbreviations: BC, bone collar/perichondrium; EO, endosteum; PO, periosteum; Ma, marrow. For all timepoints, n ≥ 3 histological sections were examined from equivalent skeletal sites of multiple littermate mice.
Figure 6
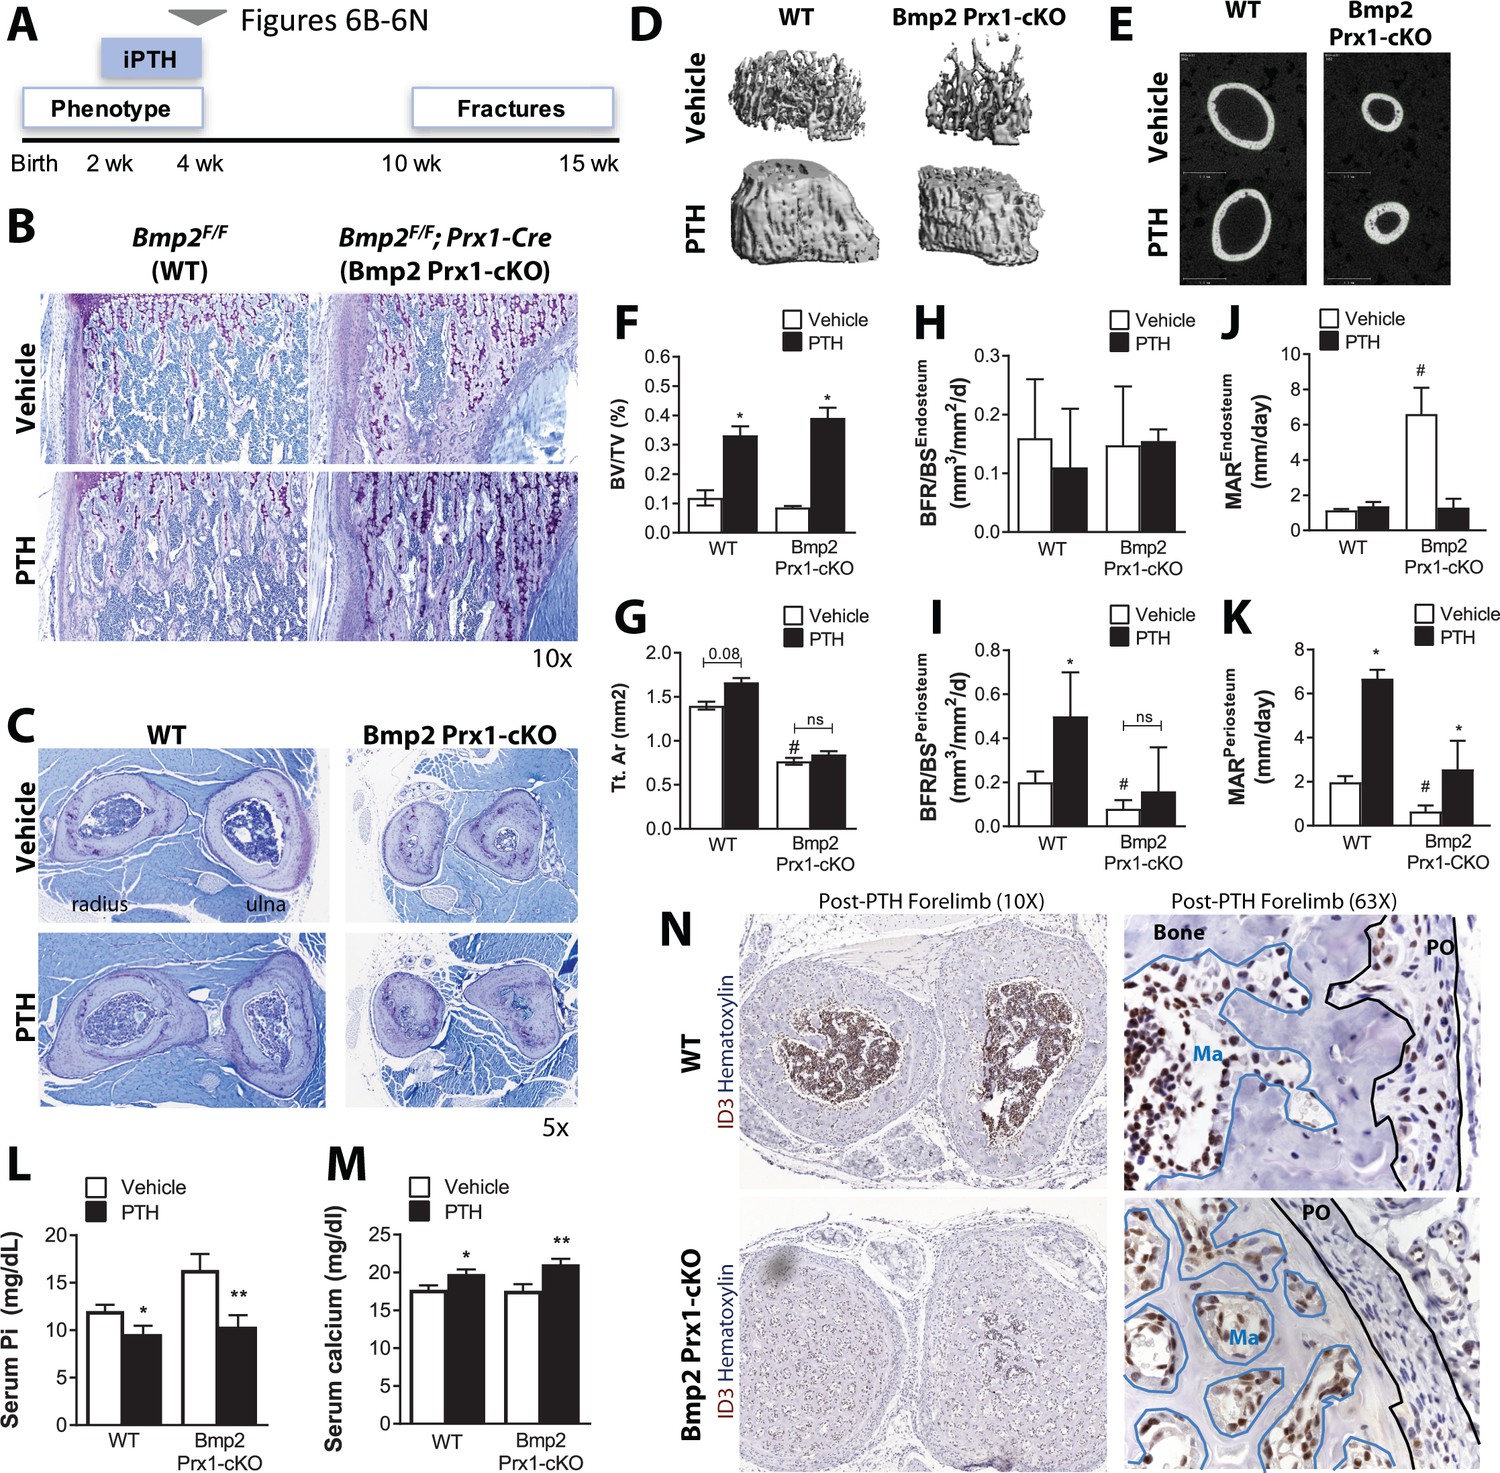
Bmp2 acts downstream of intermittent parathyroid hormone treatment in the juvenile periosteum.
Intermittent PTH1-34 therapy does not rescue periosteal growth in juvenile Bmp2 Prx1-cKO mice. (a) Juvenile mice were given intermittent PTH1-34 therapy (100 mg/kg, subcutaneous) for 14 days. (b) Longitudinal sections of the femur stained with toluidine blue to visualize trabecular bone architecture. (c) Transverse sections of the radius and ulna stained with toluidine blue to visualize cortical bone architecture. (d–g) Bone mass analyzed in the femur by microcomputed tomography (microCT). (d) Trabecular bone at the distal metaphysis and (e) cortical bone at the mid-diaphysis of the femur visualized by 3D reconstructions. Images represent the group mean and are shown to scale. (f) Ratio of bone volume (BV) to trabecular volume (TV). (g) Total cross-sectional area at the mid-diaphysis. Quantitative microCT data presented as mean ±s.d. where *p<0.05 vs. matched genotype vehicle control and #p<0.05 vs. WT vehicle control (n = 4–5 per group). (h,i) Dynamic histomorphometry assessing bone formation rate as a function of bone surface (BFR/BS) at (h) endosteal versus (i) periosteal surfaces. (j,k) Dynamic histomorphometry assessing mineral apposition rate (MAR) at (j) endosteal versus (k) periosteal surfaces. Dynamic histomorphometry (n = 4–5 per group) presented as mean ±s.d. where *p<0.05. BFRPO P-value=0.0503) vs. matched genotype vehicle control and #p<0.05 vs. WT vehicle control. (l,m) Elisa analysis measuring circulating (l) serum phosphate and (m) serum calcium in juvenile mice treated with intermittent PTH1-34 presented as mean ±s.d. where *p<0.05 vs. vehicle-treated Bmp2F/F or **p<0.05 vehicle-treated Bmp2 Prx1-cKO littermates. (n) Transverse sections of the radius/ulna with immunostaining to visualize cells expressing the BMP target gene, ID3. Abbreviations: PO, periosteum; Ma, marrow. n ≥ 3 histological sections were examined from multiple mice per cohort.
Figure 7
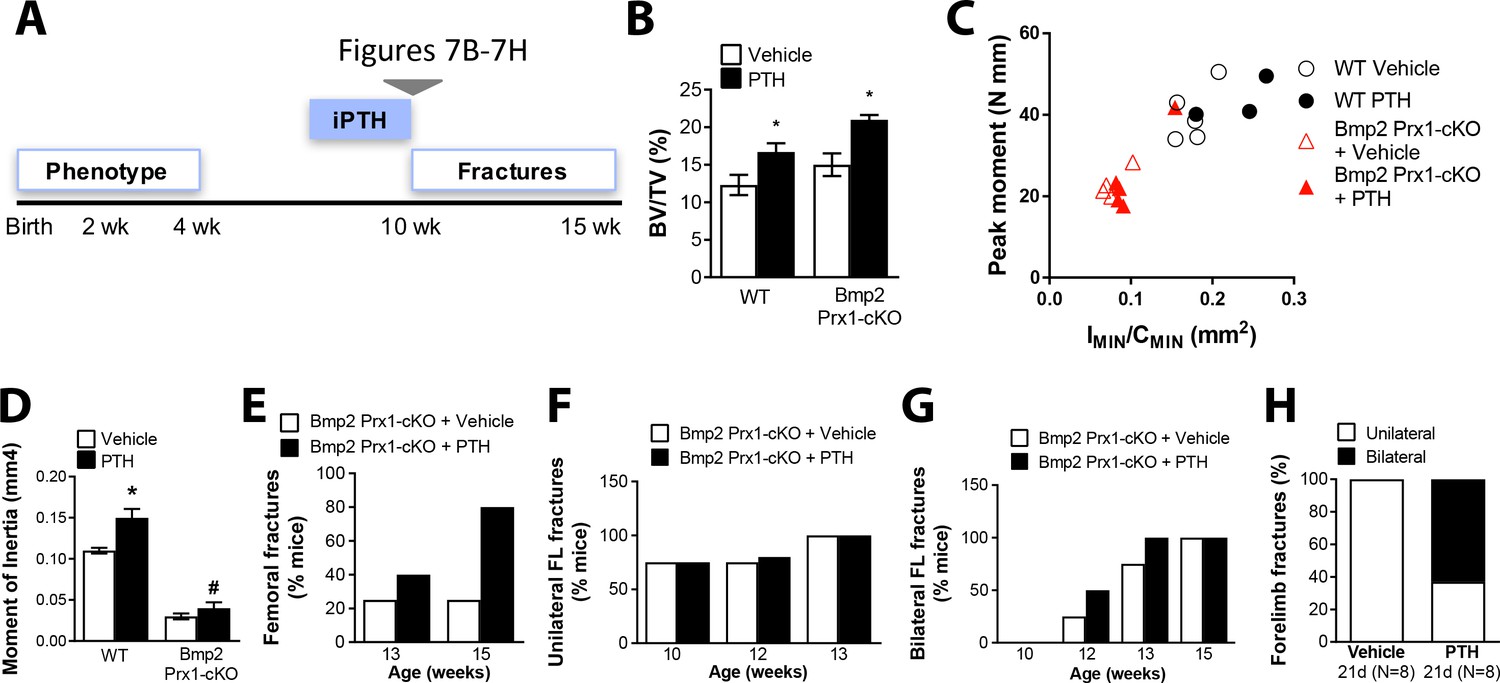
Bmp2 acts downstream of intermittent parathyroid hormone treatment in the adult periosteum.
Intermittent PTH1-34 therapy does not improve biomechanical stability or fracture repair in adult Bmp2 Prx1-cKO mice. (a) Adult mice were given intermittent PTH1-34 therapy (100 mg/kg, subcutaneous) for (b–g) 14 days or (h) 21 days. (b–d) Quantitative microCT and biomechanical analysis on adult mice treated 2 weeks with PTH1-34 (n = 3–5), presented as mean ±s.d. where *p<0.05 vs. matched genotype vehicle control. (b) Ratio of bone volume (BV) to trabecular volume (TV). (c) Peak moment as a function of IMIN/CMIN. (d) Predicted minimum moment of inertia. (e–h) Incidence of femoral or forelimb fractures in adult mice treated (e–g) two weeks (n = 4–5 per group) or (h) 21 days (n = 8 per group) with PTH1-34. Biomechanics are reported as mean ±s.d, where P-value was calculated using 1-way ANOVA and post-test Newman Keulus. All data points were included in the analysis. Remaining group comparisons were made by 2-way ANOVA and Tukey’s multiple comparison tests.
Figure 8
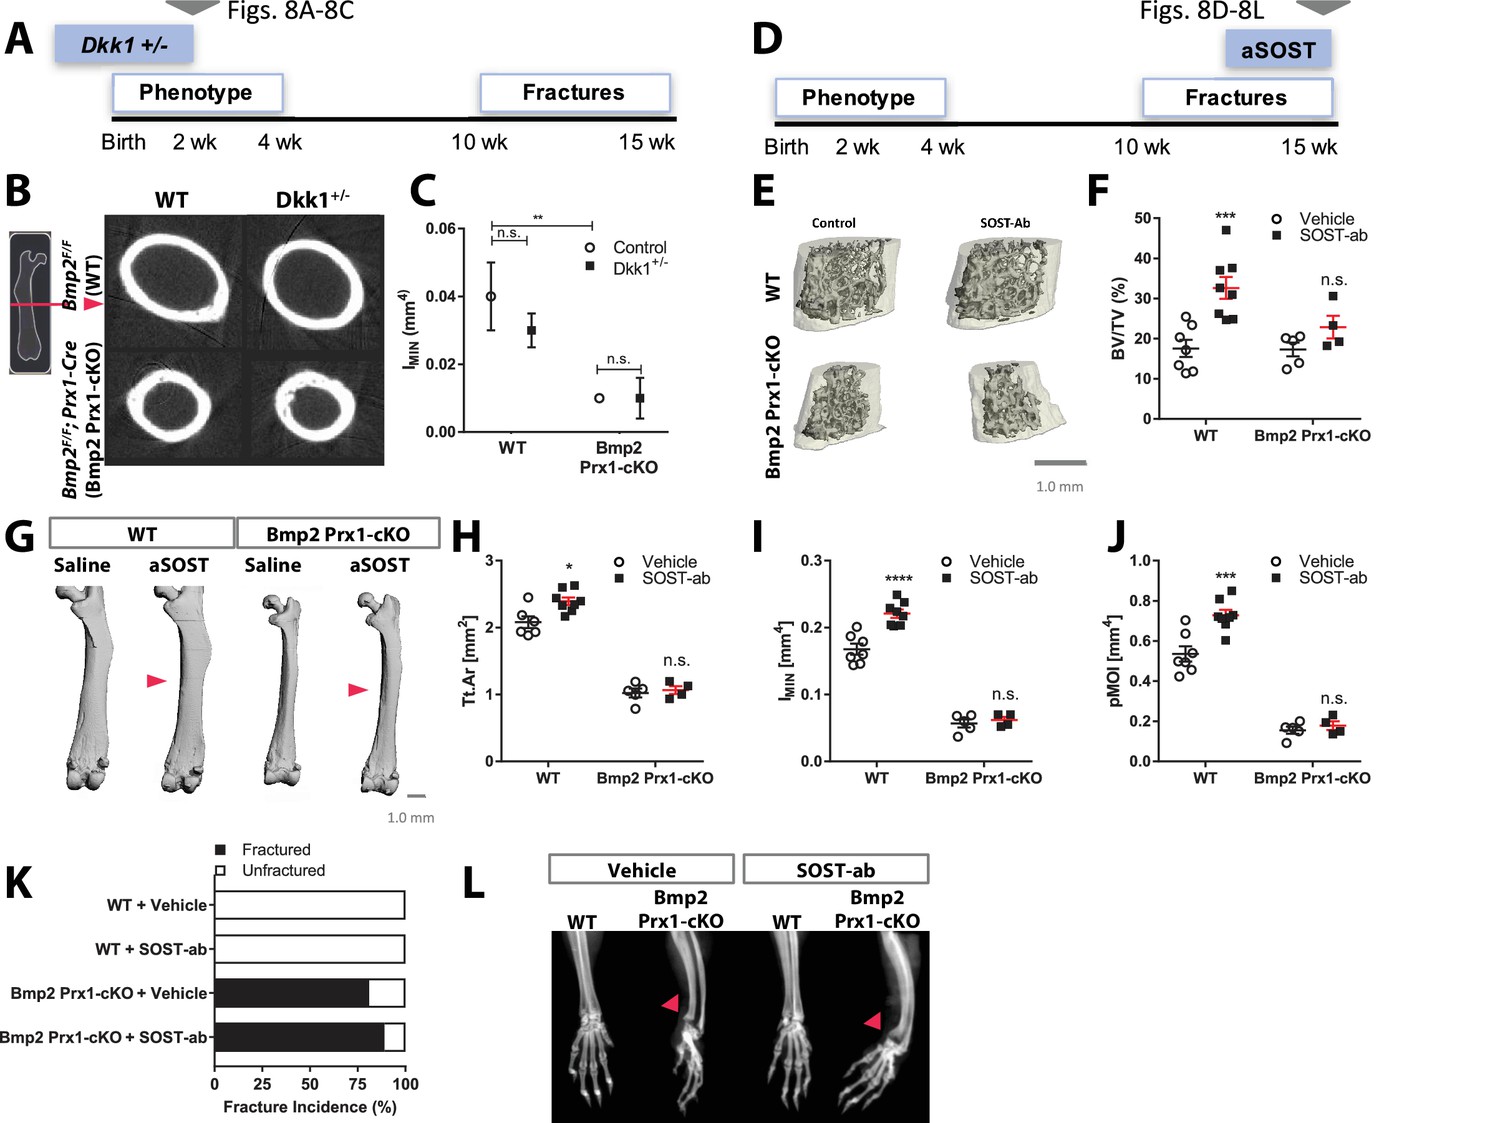
Bmp2 acts downstream of sclerostin neutralizing antibody in the periosteum.
(a–c) Haploinsufficiency of Dkk1 does not rescue periosteal growth in juvenile Bmp2 Prx1-cKO mice. Femoral bone mass was analyzed by microCT in juvenile mice (two weeks-old). (b) Transverse sections of the femur mid-diaphysis were visualized by 3D reconstructions. Images represent the group mean and are shown to scale. (c) Calculated areal moment of inertia. n = 6–8 shown as mean ±s.d. **p<0.005 compared using 2-way ANOVA. (d–l) Pharmacologic activation of Wnt pathway does not rescue periosteal growth or fracture repair in adult Bmp2 Prx1-cKO mice. WT or Bmp2 Prx1-cKO mice (13 weeks-old) were treated with sclerostin neutralizing antibody (SOST-ab, 20 mg/kg, two times/week for 2 weeks, subcutaneous). Femoral bone mass was analyzed by microCT. (e) Trabecular bone at the distal metaphysis and (g) cortical bone at the mid-diaphysis of the femur visualized by 3D reconstructions. Images represent the group mean. Scale bars, 1 mm. (f,h–j) Quantitative microCT data presented as mean ±s.d. *p<0.05, ***p<0.005, or ****p<0.00005. vs. matched genotype vehicle control (n = 4–8 per group), compared using 2-way ANOVA and Tukey multiple comparisons test. (f) Ratio of bone volume (BV) to trabecular volume (TV) at the distal femoral metaphysis. (h) Total cross-sectional area at the mid-diaphysis. (i) Polar moment of inertia at the mid-diaphysis. (j) Minimum moment of inertia at the mid-diaphysis. (k,l) X-ray imaging revealing non-union forelimb fractures in mice treated two weeks with SOST-ab (n = 17–24 wrists per group).
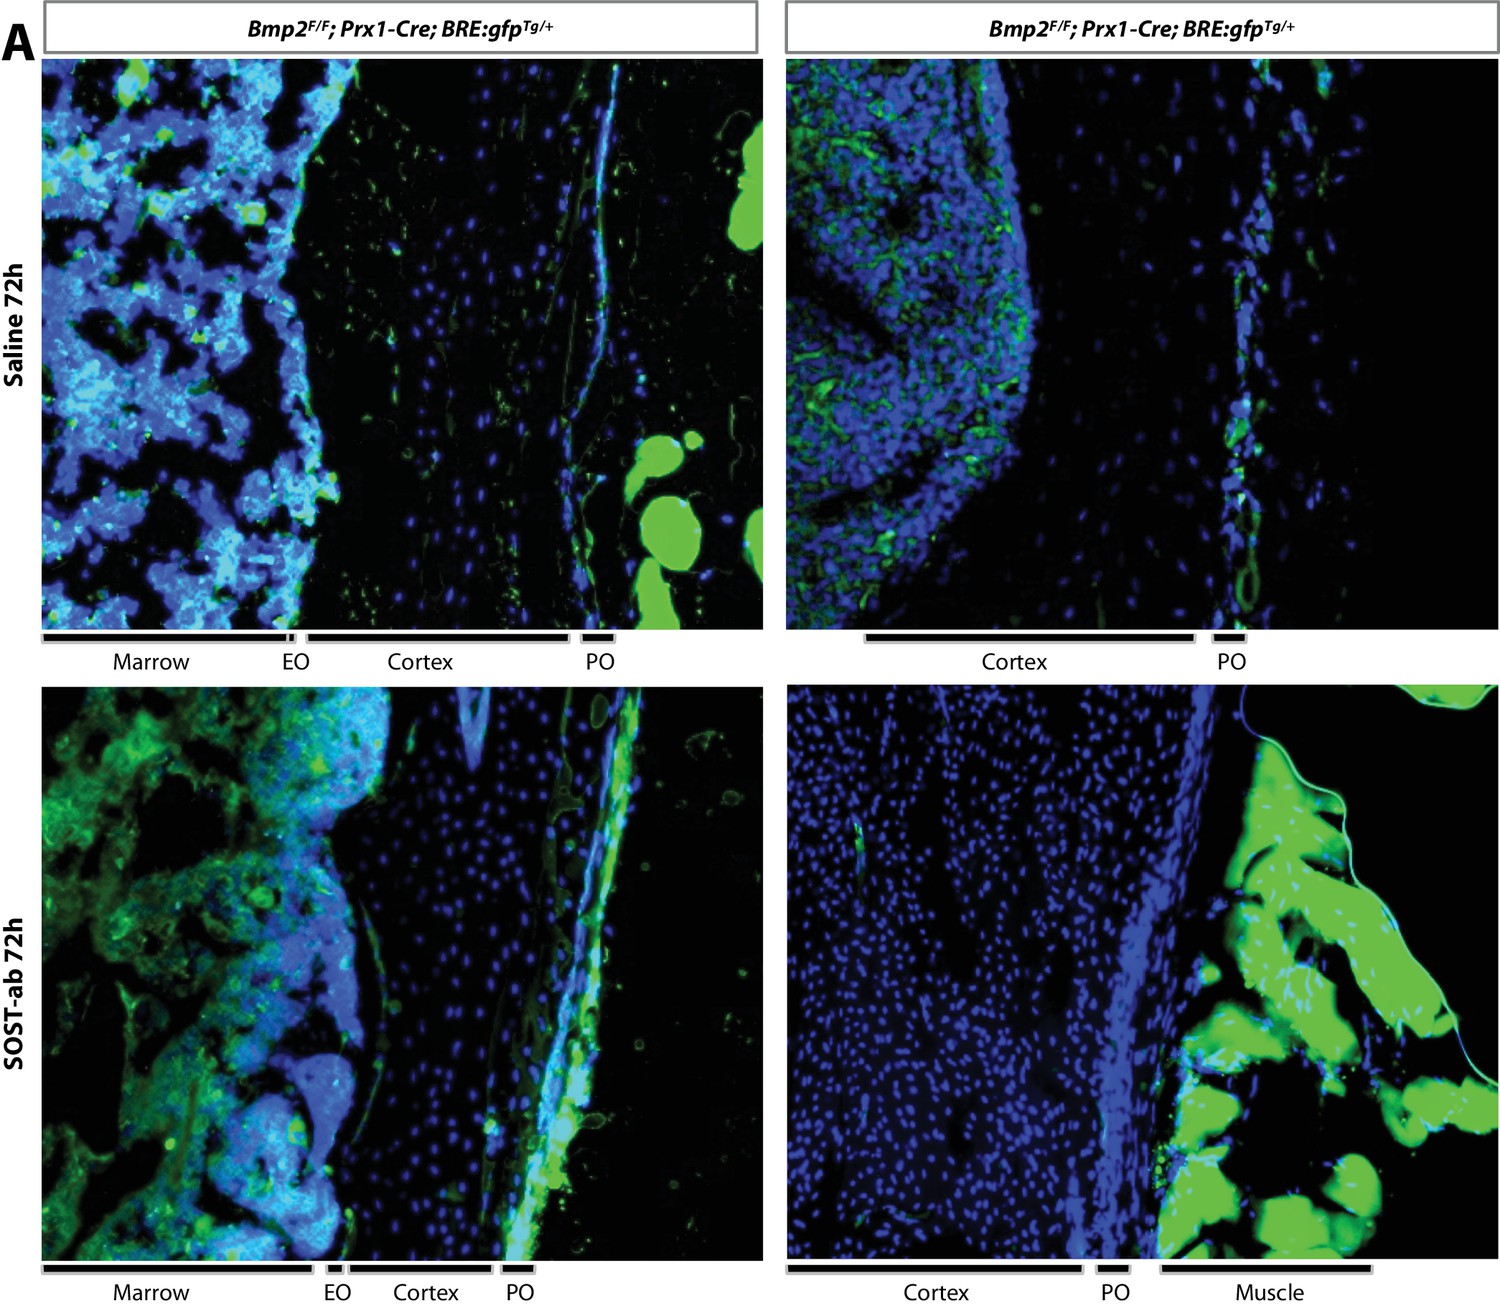
Figure 9 with 2 supplements

Bmp2 acts downstream of sclerostin neutralizing antibody to reactivate the developmental periosteal BMP signaling center.
(a,b) PTH1-34 and SOST-ab activate BMP signaling in bone and alkaline phosphatase activity in WT mice. Adult WT mice (4 months-old) were given a single injection of PTH1-34 (100 mg/kg, subcutaneous) or SOST-ab (20 mg/kg, subcutaneous). (a) Immunoblot for total and phospho-activated Smads1/5 in marrow-free bone tissue. Experiment was repeated twice. (b) Alkaline phosphatase activity (red) counterstained with DAPI (blue) were imaged on longitudinal sections of the femur (n = 2–3 mice per group). (c–e) SOST-ab activates BMP signaling in the periosteum in a Bmp2-dependent manner. BRE:gfp and a Cre-dependent tdTomato reporter were bred onto a Bmp2 Prx1-cKO background. (c–d) BRE:gfp (green) and (e) tdTomato (red) was visualized in femurs of adult mice (4 months-old) given 2 injections of (c, top) saline, (c, bottom) 2 injections of SOST-ab (20 mg/kg, subcutaneous) and sacrificed 72 hr after the first injection or (d–e) 4 injections of SOST-ab (20 mg/kg, two times/week for 2 weeks, subcutaneous). Abbreviations: Ma, marrow; CB, cortical bone; PO, periosteum.
Figure 9—figure supplement 1
Magnified images of BRE-gfp expression in cortical bone following SOST-ab treatment.
SOST-ab activates BMP signaling in the periosteum in a Bmp2-dependent manner. BRE:gfp and a Cre-dependent tdTomatoFlox reporter were bred onto a Bmp2 Prx1-cKO background. GFP (green) and DAPI (blue) were imaged on longitudinal sections of the femur. (a) BRE:gfp was visualized in adult mice (4 months-old) given 2 injections of SOST-ab (20 mg/kg) and sacrificed 72 hr after the first injection.
Figure 9—figure supplement 2

BRE-gfp expression relative to Prx1-Cre; TdTomato+/Flox lineage, with separated fluorescent channels.
(a–c) SOST-ab activates BMP signaling in the periosteum in a Bmp2-dependent manner. BRE:gfp and a Cre-dependent tdTomato reporter were bred onto a Bmp2 Prx1-cKO background. GFP (green), tdTomato (RFP), and DAPI (blue) were imaged on longitudinal sections of the femur. BRE:gfp or tdTomato were visualized in adult mice after two weeks of SOST-ab (20 mg/kg, two times/week for 2 weeks, subcutaneous).
Figure 10

Deposition of mineralized bone matrix is optimal when BMP2 and canonical Wnt signaling are balanced.
(a,b) Primary periosteal cells isolated from 4 week-old Bmp2F/F and Bmp2F/F; Prx1-Cre mice were analyzed by QPCR in three repeat experiments. Fold change mRNA is reported as mean ±s.d. compared by two-tailed student’s t-test where p*<0.001 vs. Bmp2F/F cells. Bmp4 expression was at the limit of detection. Primary BMSC were differentiated in osteogenic medium (OM) plus recombinant growth factors. (c) Calcified matrix was assessed on day 10 by alizarin red staining (2.5X, brightfield). Cultures were performed in duplicate using pooled cell populations from n = 2 Bmp2F/F or n = 4 Bmp2F/F; Prx1-Cre mice. (d) Quantification of alizarin red in (c). Error bars represent distribution of two independent experiments. (e) Primary BMSC cells from n = 3 Bmp2F/F and n = 4 Bmp2F/F; Prx1-Cre mice were differentiated as non-pooled cultures in OM plus recombinant growth factors as indicated. QPCR analysis on day three was reported as mean ±s.d. compared by two-tailed student’s t-test where P*<0.001 vs. Bmp2F/F cells in OM; P#<0.001 vs. Bmp2F/F; Prx1-Cre cells in OM; n = number of independent cultures per condition.
Figure 11 with 1 supplement
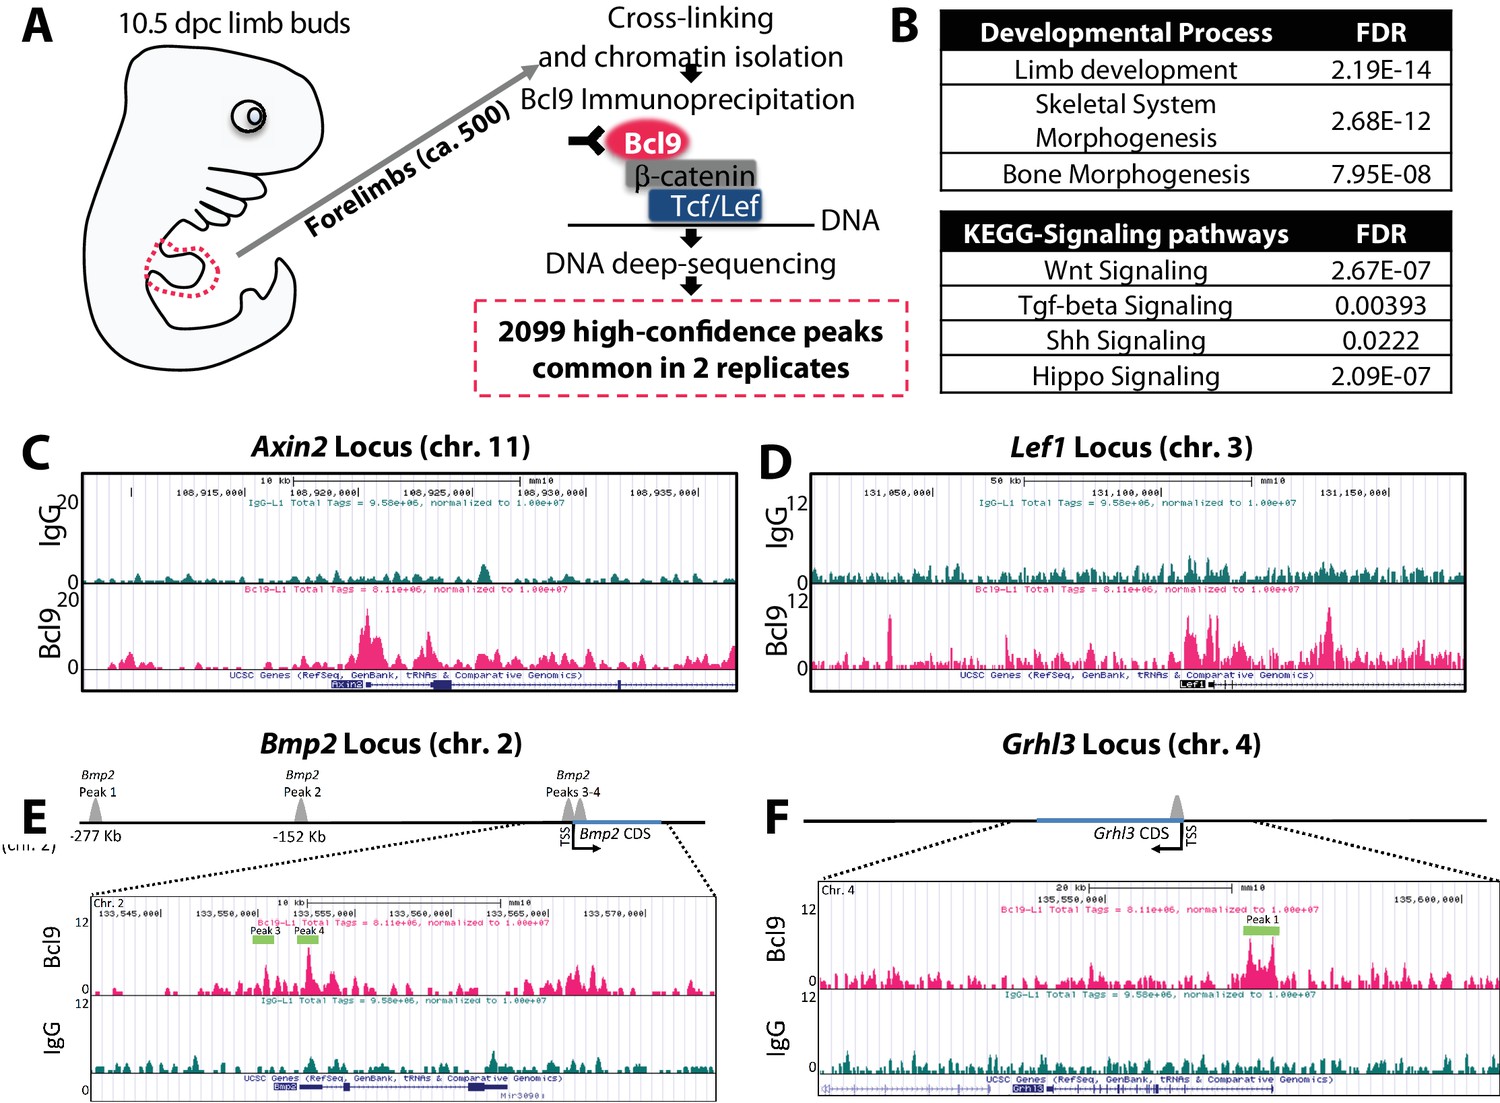
Bmp2 is a direct target gene of canonical Wnt pathway in osteoblast progenitors.
(a) Cartoon summarizing discovery of canonical WNT target genes by anti-Bcl9 chromatin immunoprecipitation from E10.5 mouse limb buds, deep sequencing, and bioinformatic analysis of peaks. 2099 high-confidence peaks passed statistical threshold in two independent experiments, with significant enrichment at genetic loci associated with (b) limb, skeletal, and bone development as well as Wnt, TGF-beta, Shh, and Hippo signaling pathways. High-confidence peaks surrounding genetic loci for (c) Axin2, (d) Lef1, (e) Bmp2, and (f) Grhl3. Bioinformatic and statistical analysis are described in methods.
Figure 11—figure supplement 1
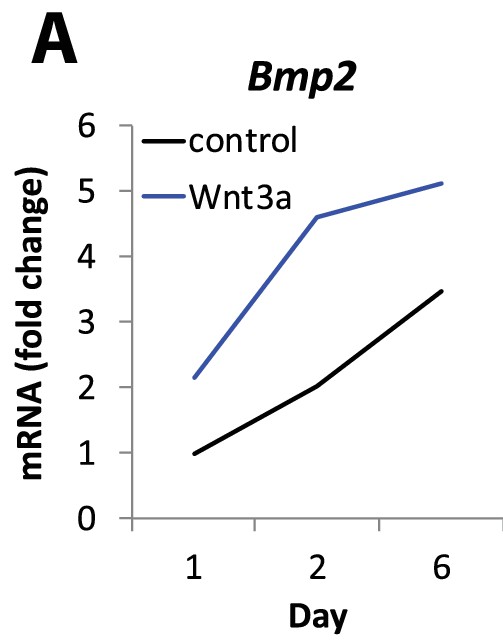
Bmp2 is upregulated by canonical Wnt pathway in osteoblast progenitors.
(a) Immortalized mouse E13.5 limb bud cells were cultured in OM ± recombinant Wnt3a (40 ng/ml). QPCR analysis for Bmp2 was performed at 24 hr, 48 hr, and 6d and expressed as fold change from untreated cells.
Figure 12
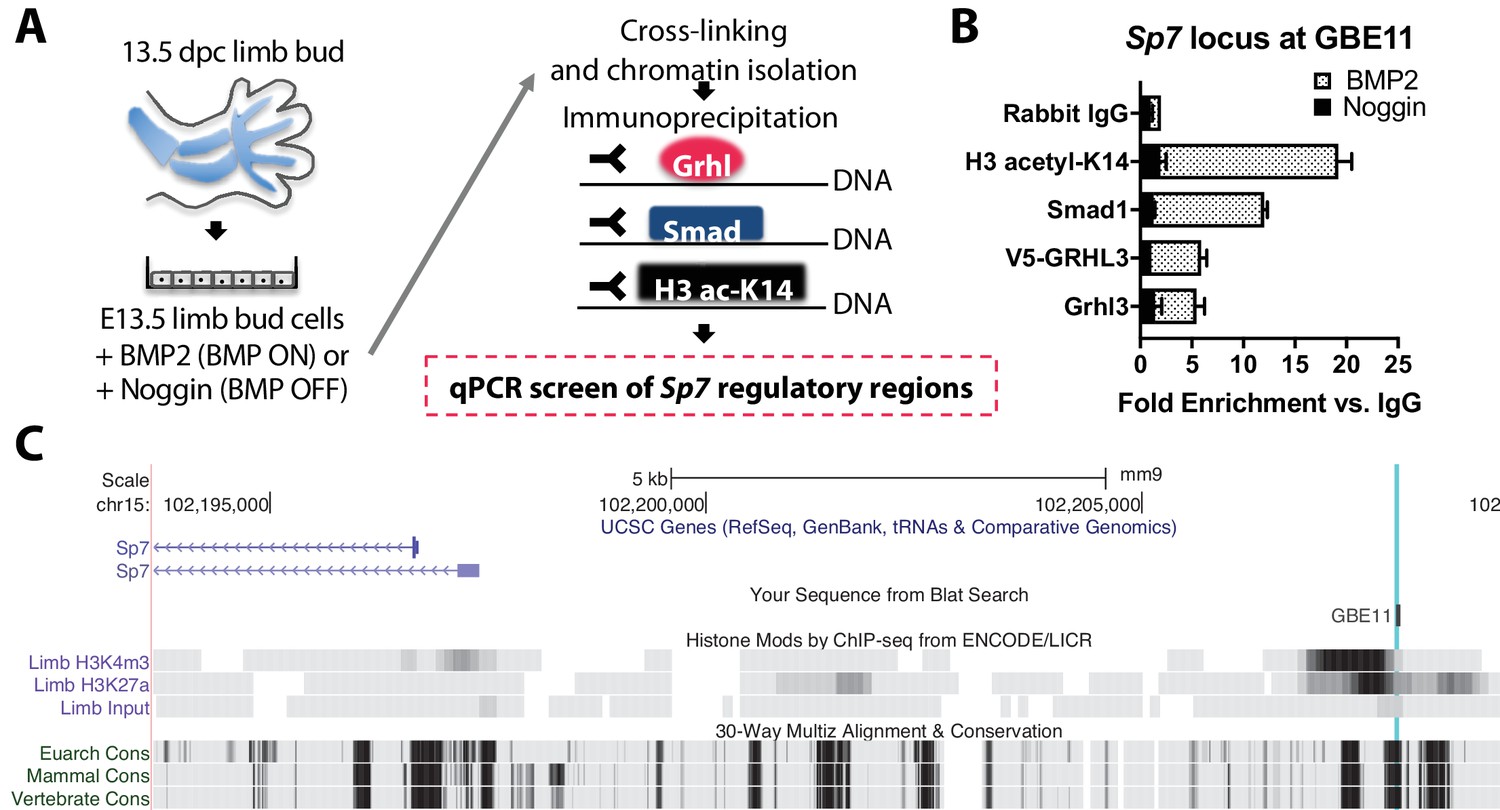
Bmp2 acts downstream of canonical Wnt pathway to specify Sp7+/Col1A1+ osteoblasts.
(a) Cartoon summarizing regulatory analysis of Sp7 locus by chromatin immunoprecipitation of H3-acetyl-K14, Smad1, endogenous Grhl3, or transiently expressed V5-GRHL3 from chromatin of immortalized E13.5 limb bud cell cultures grown in presence of recombinant BMP2 or Noggin. (b) QPCR analysis revealed BMP-dependent enrichment of these proteins at a putative consensus-binding motif for Grhl3 located at a (c) highly conserved genomic region ˜13 kb upstream of the Sp7 transcription start site. Data reflect mean ±distribution in two independent experiments.
Figure 13
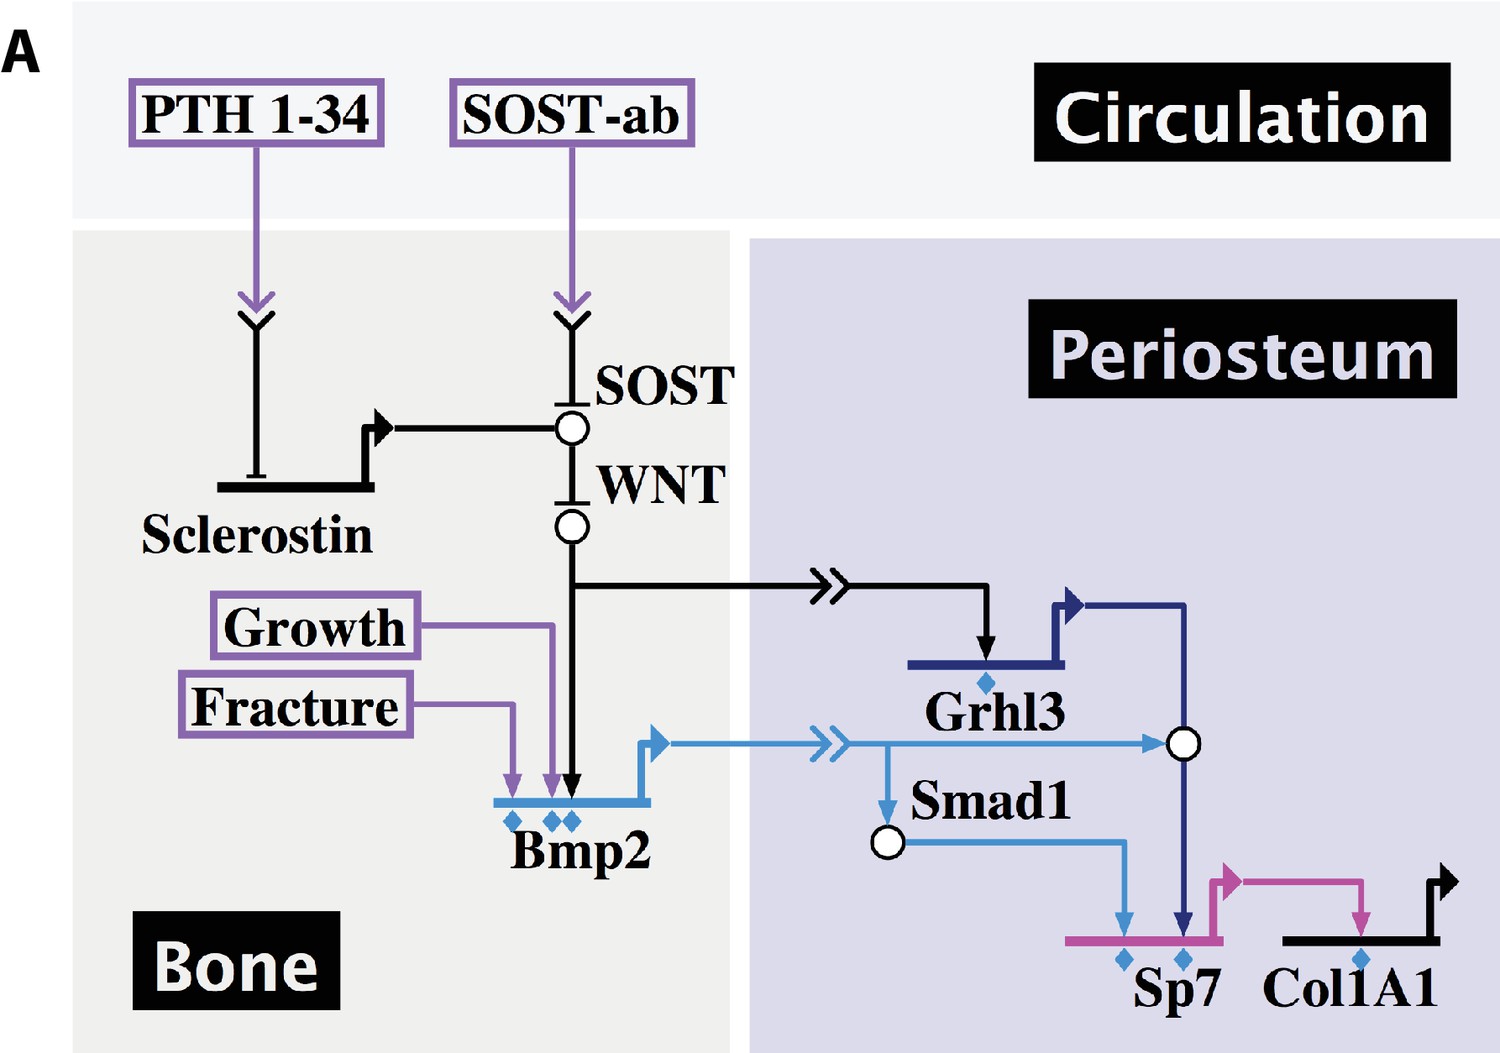
Developmental, reparative, and therapeutic signals converge on Bmp2 to specify osteoblasts in the periosteal niche.
(a) A proposed hierarchical and regionalized gene regulatory network, summarizing the source and identity of signals that regulate transcription of Bmp2 for downstream specification of Sp7+/Col1A1+ osteoblasts in the periosteal niche. Boxed regions, biological compartments; Boxed text, inputs evaluated in this study; Double arrows in a link, communication across territories; Flat footpads ending at genetic loci, transcriptional inhibition; Pointed footpads ending at genetic loci, transcriptional induction; Diamonds under footpads, evidence of direct cis-regulatory interaction provided by our study; White bubbles, protein/protein interactions. Made with Biotapestry.org.
Tables
Table 1
Skeletal phenotype analysis of Bmp2Flox/Flox; Col1a1-Cre mice shows that loss of Bmp2 in mature osteoblasts does not cause a periosteal growth defect.
Bone mass analyzed in the femur of juvenile 2 week-old mice by microCT. Data presented as mean ±s.d. with no statistical differences detected between WT and conditional knockout mice using 1-way ANOVA. Abbreviations: BV/TV, trabecular bone volume to total tissue volume; Tb.Th, trabecular thickness; Tb.Sp. trabecular spacing; Tb.N. trabecular number; Tt.Ar, total cross-sectional tissue area at the mid-diaphysis; Ct.Ar, cortical bone area; Ct.Ar/Tt.Ar, cortical bone area as a fraction of total tissue area; C.Th cortical thickness; IMIN, minimum moment of inertia.
| MicroCT femur, P14 | Bmp2Flox/Flox | Bmp2Flox/Flox; Col1a1-Cre |
|---|---|---|
| N | 4 | 4 |
| BV/TV (%) | 7.9 ± 1.0 | 7.5 ± 0.6 |
| Tb.Th (mm) | 0.026 ± 0.002 | 0.026 ± 0.006 |
| Tb.Sp. (mm) | 0.361 ± 0.037 | 0.399 ± 0.058 |
| Tb.N (1/mm) | 2.89 ± 0.307 | 2.63 ± 0.35 |
| Tt.Ar (mm2) | 1.17 ± 0.08 | 1.15 ± 0.078 |
| Ct.Ar (mm2) | 0.322 ± 0.052 | 0.301 ± 0.018 |
| Ct.Ar/Tt.Ar (%) | 27 ± 0.08 | 25 ± 0.08 |
| C.Th (mm) | 0.081 ± 0.006 | 0.078 ± 0.007 |
| Imin (mm4) | 0.040 ± 0.007 | 0.038 ± 0.002 |
Table 2
Skeletal phenotype of 2 week-old Bmp2Flox/Flox; Prx1-Cre mice.
Quantitative microCT data presented as mean ±s.d. where ***p<0.0005 vs. age-matched Bmp2F/F littermates when compared by 1-way ANOVA. (e) Static histomorphometry (n = 4), presented as mean ±s.d. *p<0.05 vs. age-matched Bmp2F/F littermates. Abbreviations: BV/TV, trabecular bone volume to total tissue volume; Tb.Th, trabecular thickness; Tb.Sp. trabecular spacing; Tb.N. trabecular number; Tt.Ar, total cross-sectional tissue area at the mid-diaphysis; Ct.Ar, cortical bone area; Ct.Ar/Tt.Ar, cortical bone area as a fraction of total tissue area; C.Th cortical thickness; Ma.Ar, marrow area; IMIN, minimum moment of inertia; TMD, tissue mineral density.
| MicroCT femur, P14 | Bmp2Flox/Flox | Bmp2Flox/Flox; Prx1-Cre |
|---|---|---|
| N | 4 | 4 |
| BV/TV (%) | 4.3 ± 1.0 | 6.6 ± 0.9 |
| Tb.Th (mm) | 0.02 ± 0.001 | 0.02 ± 0.001 |
| Tb.Sp. (mm) | 0.35 ± 0.04 | 0.26 ± 0.06 |
| Tb.N (1/mm) | 2.8 ± 0.3 | 3.9 ± 1.0 |
| Tt.Ar (mm2) | 1.02 ± 0.08 | 0.6 ± 0.03*** |
| Ct.Ar (mm2) | 0.24 ± 0.03 | 0.21 ± 0.01 |
| Ct.Ar/Tt.Ar (%) | 23 ± 0.2 | 36 ± 1.0*** |
| C.Th (mm) | 0.065 ± 0.07 | 0.06 ± 0.03 |
| Ma.Ar (mm2) | 0.46 ± 0.04 | 0.23 ± 0.02*** |
| Imin (mm4) | 0.02 ± 0.005 | 0.01 ± 0.001*** |
| TMD (mgHA/cm3) | 882.6 ± 20.6 | 858.7 ± 8.57 |
Table 3
Skeletal phenotype of juvenile Bmp2Flox/Flox; Prx1-Cre mice after intermittent PTH therapy.
Juvenile mice (two weeks-old) were given intermittent PTH1-34 therapy (100 mg/kg, subcutaneous) for 14 days. Bone mass was analyzed in the femur by microcomputed tomography (microCT). Trabecular bone at the distal metaphysis and cortical bone at the mid-diaphysis of the femur are presented as group mean ± s.d. and statistically compared by 2-way ANOVA. BV/TV, bone volume fraction; Conn.D, connectivity density; SMI, structure model index; Tb.N, trabecular number; Tb.Th, trabecular thickness; Tb.Sp, Trabecular separation; Tt.Ar, total cross-sectional area; Ct.Ar, cortical bone area; Ct.Ar/Tt.Ar, cortical area fraction; Ct.Th, average cortical thickness; Imin, minimum moment of inertia; Ma.V, marrow volume. Pa ≤ 0.05 vs. WT. Pb ≤0.05 vs. Vehicle.
| MicroCT femur, four wk | Bmp2Flox/Flox | Bmp2Flox/Flox; Prx1-Cre | ||
|---|---|---|---|---|
| Treatment | Vehicle | PTH | Vehicle | PTH |
| N | 4 | 5 | 5 | 5 |
| BV/TV (%) | 11.9 ± 7.4 | 33.2 ± 8.6b | 8.7 ± 1.2 | 39.2 ± 9.6b |
| Conn.D | 244.6 ± 232.1 | 438.7 ± 165 | 132.2 ± 60.5 | 702.8 ± 168b |
| SMI | 2.2 ± 0.9 | 0.1 ± 1.8 | 2.7 ± 0.2 | −0.6 ± 1.0b |
| Tb.N (1/mm) | 5.1 ± 2.1 | 8.3 ± 2.4b | 4.8 ± 0.5 | 10.8 ± 1.3b |
| Tb.Th (mm) | 0.04 ± 0.005 | 0.05 ± 0.009 | 0.034 ± 0.002a | 0.051 ± 0.006b |
| Tb.Sp (mm) | 0.2 ± 0.07 | 0.121 ± 0.05 | 0.2 ± 0.02 | 0.08 ± 0.02b |
| Ct.Ar (mm2) | 0.43 ± 0.04 | 0.60 ± 0.05b | 0.4 ± 0.03 | 0.5 ± 0.05b |
| Tt.Ar (mm2) | 1.4 ± 0.1 | 1.6 ± 0.2 | 0.7 ± 0.09a | 0.8 ± 0.1 |
| Ct.Ar/Tt.Ar (%) | 0.31 ± 0.01 | 0.38 ± 0.02b | 0.57 ± 0.02a | 0.63 ± 0.05 |
| Ct.Th (mm) | 0.1 ± 0.007 | 0.134 ± 0.004b | 0.15 ± 0.015a | 0.19 ± 0.01b |
| Ma.V (mm3) | 1.16 ± 0.7 | 1.2 ± 0.2 | 0.42 ± 0.09a | 0.37 ± 0.07 |
| Imin (mm4) | 0.06 ± 0.009 | 0.1 ± 0.02b | 0.03 ± 0.006a | 0.04 ± 0.01 |
Table 4
Skeletal phenotype of adult Bmp2Flox/Flox; Prx1-Cre mice after intermittent PTH therapy.
Ten week-old mice were given intermittent PTH1-34 therapy (100 mg/kg, subcutaneous) for 14 days. Bone mass was analyzed in the femur by microcomputed tomography (microCT). Trabecular bone at the distal metaphysis and cortical bone at the mid-diaphysis of the femur are presented as group mean ±s.d. and statistically compared by 2-way ANOVA. BV/TV, bone volume fraction; Tb.N, trabecular number; Tb.Th, trabecular thickness; Tb.Sp, Trabecular separation; Tt.Ar, total cross-sectional area; Ct.Ar, cortical bone area; Ct.Ar/Tt.Ar, cortical area fraction; Ct.Th, average cortical thickness; Ct.Po, cortical porosity; Ma.V, marrow volume; Imin, minimum moment of inertia. Pa ≤ 0.05 vs. WT. Pb ≤ 0.05 vs. Vehicle.
| MicroCT Femur, 10 wk | Bmp2Flox/Flox | Bmp2Flox/Flox; Prx1-Cre | ||
|---|---|---|---|---|
| Treatment | Vehicle | PTH | Vehicle | PTH |
| N | 5 | 5 | 5 | 5 |
| BV/TV (%) | 12.3 ± 3 | 16.7 ± 2b | 15.0 ± 3.0 | 21.0 ± 1.4b |
| Tb.N (1/mm) | 4.90 ± 0.5 | 5.50 ± 0.9 | 6.10 ± 0.7a | 5.70 ± 0.6 |
| Tb.Th (mm) | 0.04 ± 0.003 | 0.04 ± 0.005 | 0.04 ± 0.001 | 0.05 ± 0.003b |
| Tb.Sp (mm) | 0.20 ± 0.02 | 0.19 ± 0.05 | 0.16 ± 0.02 | 0.16 ± 0.02 |
| Tt.Ar (mm2) | 1.60 ± 0.01 | 1.90 ± 0.3 | 0.80 ± 0.08a | 0.90 ± 0.18 |
| Ct.Ar (mm2) | 0.76 ± 0.07 | 0.88 ± 0.07b | 0.58 ± 0.06a | 0.72 ± 0.1b |
| Ct.Ar/Tt.Ar (%) | 0.47 ± 0.04 | 0.46 ± 0.03 | 0.75 ± 0.01 | 0.80 ± 0.027 |
| Ct.Th (mm) | 0.19 ± 0.02 | 0.19 ± 0.005 | 0.25 ± 0.01a | 0.30 ± 0.014b |
| Ct. Po (%) | 3.58 ± 0.28 | 4.06 ± 0.1b | 3.38 ± 0.3 | 2.80 ± 0.18b |
| Ma.V (mm3) | 1.03 ± 0.16 | 1.21 ± 0.27 | 0.23 ± 0.03a | 0.21 ± 0.07b |
| Imin (mm4) | 0.11 ± 0.01 | 0.15 ± 0.03b | 0.03 ± 0.01a | 0.04 ± 0.02 |
Table 5
Human variants of BMP2 and GRHL3 are associated with increased risk of fractures.
We performed a phenomewide association study of BMP2 and a downstream effector GRHL3 in 61,062 individuals from DiscovEHR, a cohort linking exome sequence data to electronic health records (EHRs). Using a Bonferroni significance threshold of p<1.86e-7 for 268,192 association results, we observed three significant associations for BMP2 and six significant associations for GRHL3.
| Variant | Gene | Functional Prediction | HGVS amino acid | Phenotype | Odds Ratio (CI) | P- Value | MAF |
|---|---|---|---|---|---|---|---|
| 20:6770235:T:G | BMP2 | missense | p.Ser37Ala | Post-eruptive color changes of dental hard tissues | 15.44 (6.50–36.64) | 5.33E-10 | 0.01802 |
| 20:6778359:G:A | BMP2 | missense | p.Arg154Gln | Secondary hyperparathyroidism, not elsewhere classified | 18.88 (7.35–48.53) | 1.06E-09 | 0.00033 |
| 1:24336821:A:T | GRHL3 | synonymous | p.Pro202Pro:p.Pro156Pro:p.Pro207Pro:p.Pro202Pro | Fracture of thoracic vertebra | 12.72 (5.59–28.94) | 1.36E-09 | 0.00078 |
| 20:6778291:A:T | BMP2 | missense | p.Arg131Ser | Fracture of lower leg, including ankle | 16.05 (6.44–40.00) | 2.54E-09 | 0.00019 |
| 1:24342967:C:T | GRHL3 | missense | p.Thr454Met:p.Thr408Met:p.Thr459Met:p.Thr454Met | Atresia of bile ducts | 17.11 (6.34–46.18) | 2.07E-08 | 0.03395 |
| 1:24336694:T:C | GRHL3 | missense | p.Val160Ala:p.Val114Ala:p.Val165Ala:p.Val160Ala | Malignant neoplasm of parietal lobe | 8.72 (4.08–18.64) | 2.31E-08 | 0.04732 |
| 1:24344928:A:G | GRHL3 | missense | p.Asn484Ser:p.Asn438Ser:p.Asn489Ser:p.Asn484Ser | Malignant neoplasm of parietal lobe | 8.23 (3.90–17.38) | 3.24E-08 | 0.0484 |
| 1:24339645:C:G | GRHL3 | intronic | NA | Fracture of patella | 13.33 (5.11–34.81) | 1.22E-07 | 0.00109 |
| 1:24342967:C:T | GRHL3 | missense | p.Thr454Met:p.Thr408Met:p.Thr459Met:p.Thr454Met | Atresia of esophagus with tracheo-esophageal fistula | 9.76 (4.16–22.88) | 1.63E-07 | 0.03396 |
Key resources table
| Reagent type (species) or resource | Designation | Source or reference | Identifiers | Additional information |
|---|---|---|---|---|
| Gene (Mus musculus) | bone morphogenetic protein 2 (Bmp2) | MGI:MGI:88177 | ||
| Genetic reagent (Mus musculus) | Tg(Prrx1-cre)1Cjt; Bmp2tm1Cjt/Bmp 2tm1Cjt | PMID:17194222 | MGI:3700047; RRID:MGI:3700047 | |
| Genetic reagent (Mus musculus) | B6.Cg-Tg (Sp7-tTA,tetO-EGFP/cre)1Amc/J | PMID:16854976 | IMSR JAX:006361; RRID:IMSR_JAX:006361 | |
| Genetic reagent (Mus musculus) | B6.FVB-Tg(Col1a1-cre) 1Kry/Rbrc | PMID:12112477 | IMSR:RBRC05603; RRID:IMSR_RBRC05603 | |
| Genetic reagent (Mus musculus) | Bmp2tm1(KOMP) Vlcg/Bmp2+ | PMID:29198724 | MGI:5912401; RRID:MGI:5912401 | |
| Genetic reagent (Mus musculus) | BRE:gfp | PMID:18615729 | ||
| Genetic reagent (Mus musculus) | Dkk1tm1Lmgd/ Dkk1tm1Lmgd | PMID:17127040; PMID:11702953 | MGI:3618757; RRID:MGI:3618757 | |
| Genetic reagent (Mus musculus) | B6.Cg-Gt(ROSA)26 Sortm9(CAG-tdTomato) Hze/J | Jackson Laboratory | IMSR JAX:007909; RRID:IMSR_JAX:007909 | |
| Cell line (Mus musculus) | MLB13 Clone 14 | PMID:7532346; PMID:8302904 | ||
| Transfected construct (H. sapien) | V5-tagged GRHL3 | Center for Cancer Systems Biology | PlasmID_clone: HsCD00376192 | |
| Antibody | anti-Id1 (rabbit polyclonal) | Santa Cruz | Santa Cruz Biotechnology:sc-488; RRID:AB_631701 | Immunostaining (1:100) |
| Antibody | anti-Id3 (mouse polyclonal) | Santa Cruz | Santa Cruz Biotechnology:sc-490; RRID:AB_2123010 | Immunostaining (1:100) |
| Antibody | anti-pSmad1/5/8 (rabbit monoclonal) | Cell Signaling Technologies | Cell Signaling Technology:9511; RRID:AB_331671 | Western (1:1000); Immunostaining (1:50) |
| Antibody | anti-Smad1 (rabbit polyclonal) | Cell Signaling Technologies | Cell Signaling Technology:9743; RRID:AB_2107780 | Western (1:1000); ChIP (1:25) |
| Antibody | anti-alpha-Tubulin (mouse monoclonal) | Sigma-Aldrich | Sigma-Aldrich:T6074; RRID:AB_477582 | Western (1:1000) |
| Antibody | anti-V5-tag (mouse monoclonal) | Abcam | Abcam Cat:ab27671; RRID:AB_471093 | ChIP (1:250) |
| Antibody | anti-GRHL3 (rabbit polyclonal) | Thermo Fisher | Thermo Fisher Scientific:PA5-41616; RRID:AB_2606412 | ChIP (1:100) |
| Antibody | anti-H3acK14 (rabbit polyclonal) | Millipore | Millipore:06–599; RRID:AB_2115283 | ChIP (1:100) |
| Antibody | anti-Bcl9 (rabbit polyclonal) | Abcam | Abcam:ab37305; RRID:AB_2227890 | ChIP (1 μg) |
| Software, algorithm | Biotapestry | Biotapestry.org; PMID:15907831; PMID:18757046; PMID:27134726 |
Additional files
-
Transparent reporting form
- https://doi.org/10.7554/eLife.42386.028
Download links
A two-part list of links to download the article, or parts of the article, in various formats.
Downloads (link to download the article as PDF)
Open citations (links to open the citations from this article in various online reference manager services)
Cite this article (links to download the citations from this article in formats compatible with various reference manager tools)
Reactivation of a developmental Bmp2 signaling center is required for therapeutic control of the murine periosteal niche
eLife 8:e42386.
https://doi.org/10.7554/eLife.42386


