Different genetic mechanisms mediate spontaneous versus UVR-induced malignant melanoma
- QIMR Berghofer Medical Research Institute, Australia
- Harry Perkins Institute of Medical Research, Australia
- Edith Cowan University, Australia
Figures
Figure 1
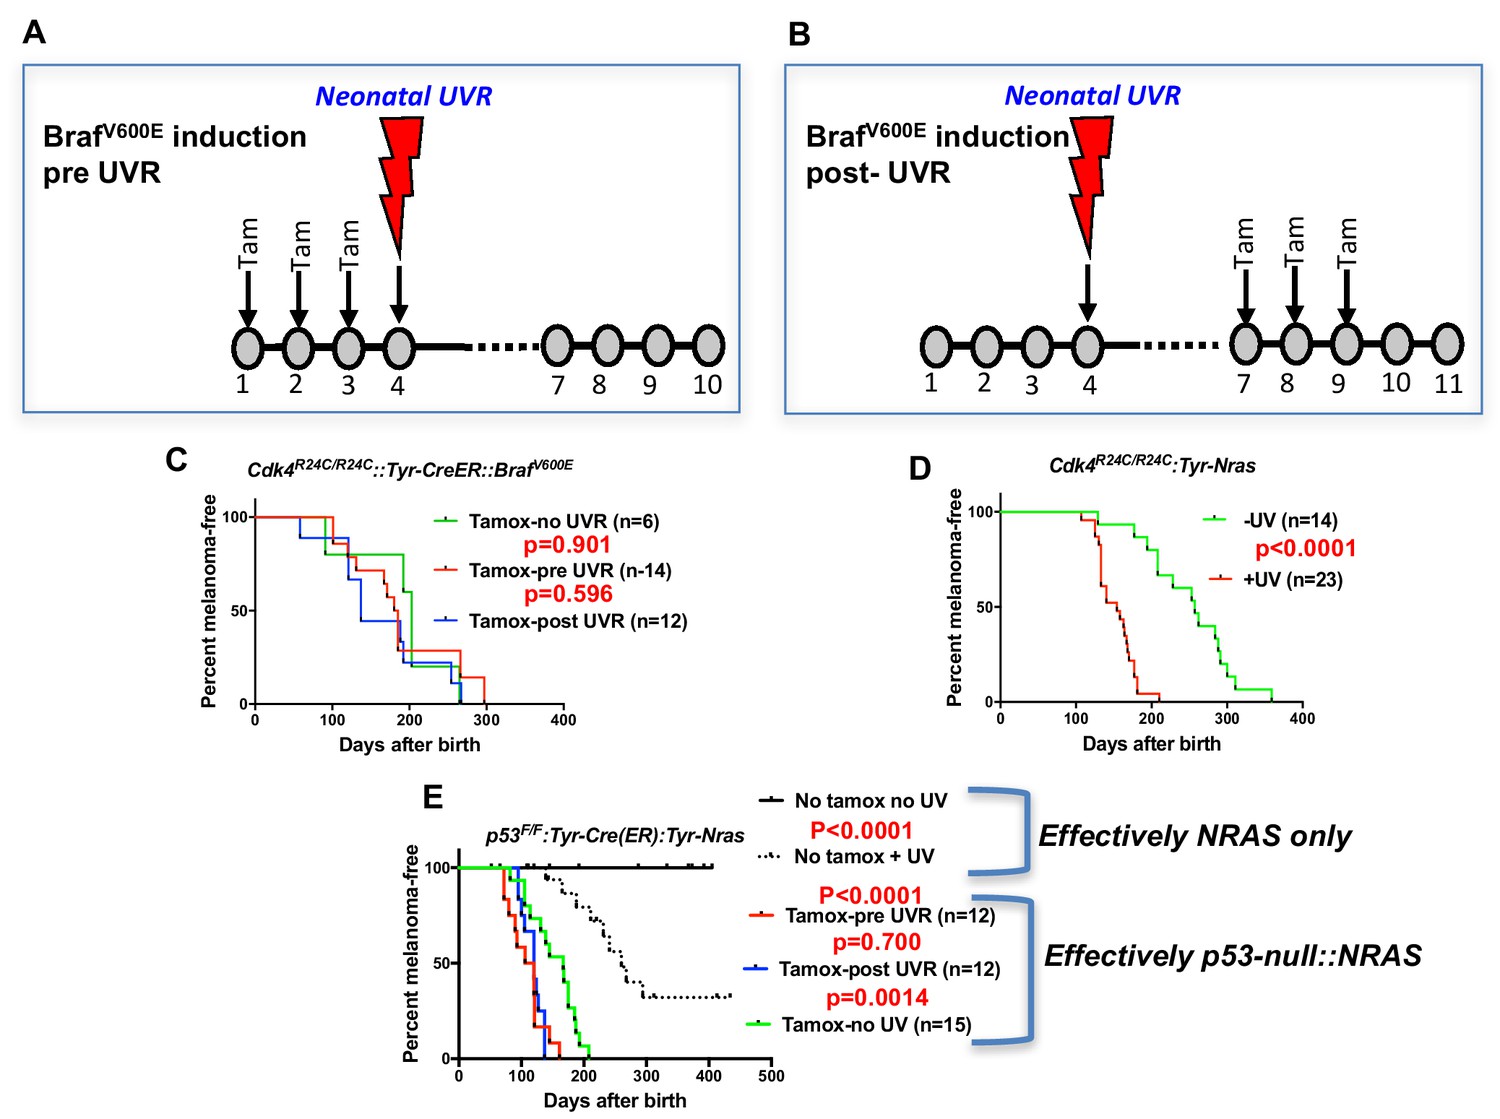
UVR-induced melanoma induction in different transgenic models.
Schematic representation of timing of Tamoxifen application for induction of BRAFV600E. Tam = tamoxifen (A) before UVR exposure, (B) after UVR exposure. (C–E) Comparison of UVR-induced MM-free survival between genotypes. Kaplan-Meier curves show the time to spontaneous and UVR-induced MM development. The age of onset (days after birth) was defined by the appearance of the first melanoma. Animals that died without developing MM were censored. (C) Cdk4R24C/R24C::BRAFV600E with mutation induction before and after neonatal UVR, (D) Cdk4R24C/R24C::Tyt-NRASQ61K mice, (E) Trp53F/F::Tyr-Cre::TyrNRASQ61K. Here we have included non tamox-treated animals which carry the effective genotype of Tyr-NRAS only, as shown to the right of the graph. Green, blue, and red lines show melanoma-free survival after various timings of tamox treatment. We aimed to study at least 20 mice in each group. 20 animals per group is sufficient to detect a difference in penetrance of 40% with statistical power of 80%.
Figure 2
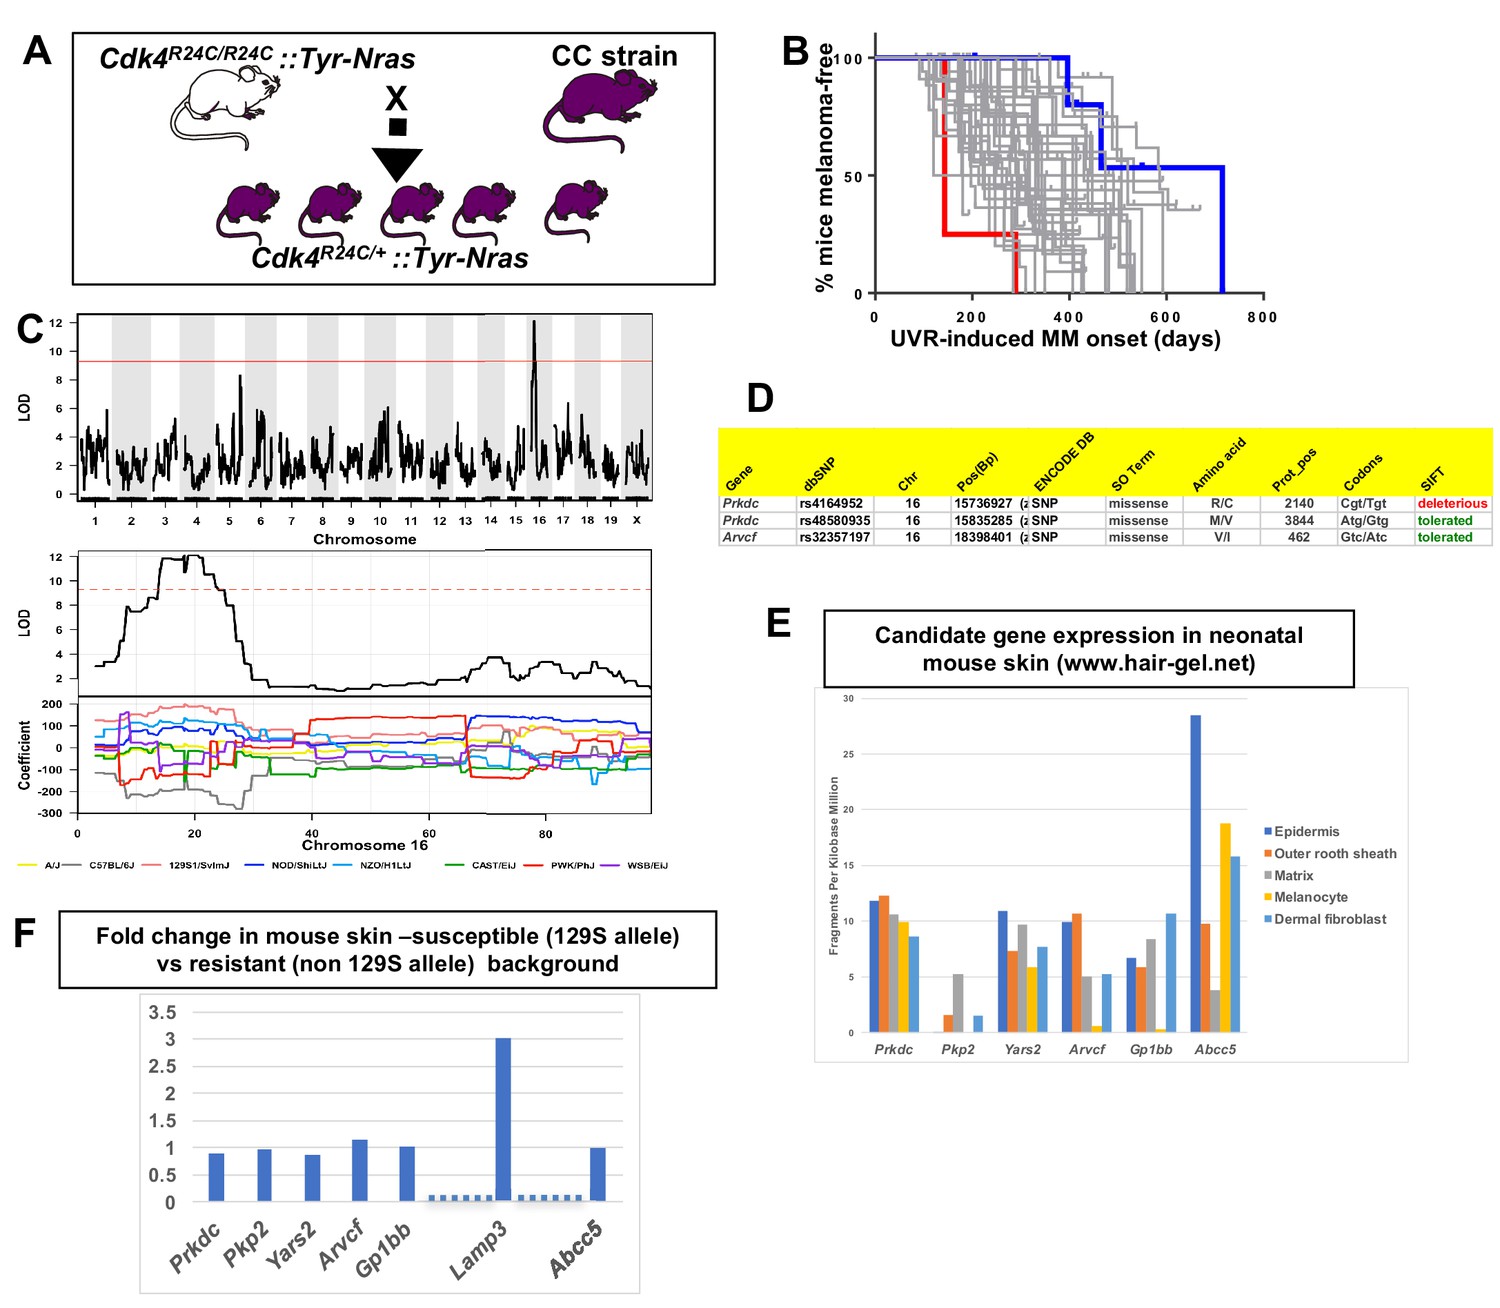
Mapping genes for spontaneous melanoma.
(A) Schematic representation of breeding protocol to generate mice carrying 50% of their genome from the relevant CC strain. (B) Kaplan-Meier MM free survival curve showing age of onset on MM for all 38 strains. Strain in red shows he fastest age of onset. Note that there are four mice in the cohort, each onset value represents two mice. Blue shows slowest median age of onset. (C) Top panel shows genome-wide scan based on spontaneous MM age of onset in 38 CC strains. The average age of melanoma onset per strain was based upon onset for at least five mice for every strain. Significance of differences between groups calculated using the Log rank (Mantel Cox) test. Genotyping, construction of CC strain haplotypes, and linkage analysis was performed as described in Ram and Morahan (2017). The x-axis shows the chromosomal position and the y-axis shows the 2log10(P) values; the P-values were derived from the linkage haplotype data. Bottom panel shows plot of LOD scores along chromosome 16, with plot of the calculated log-odds ratio of eight founder alleles over the chromosome where the founders are color-coded. (C) Genes within the −1 -Log10(P) interval carrying putative protein changing mutations. (D) Genes containing potentially regulatory intronic, 5’or 3’ UTR variants. (E) Expression level of genes in the HAIR-GEL skin gene expression database (28). Y axis denotes FPKM (Fragments Per Kilobase Million). (F) Gene expression fold changes in mouse skin from 129S (which carries the susceptibility allele) compared to C57BL/6, NOD, and FVB, which do not. Based on gene expression values from RNA sequencing. Lamp3 is separated from the other genes since it is the only one in the figure not located near a 129S-specific regulatory SNP defined in the ENCODE database.
Figure 3
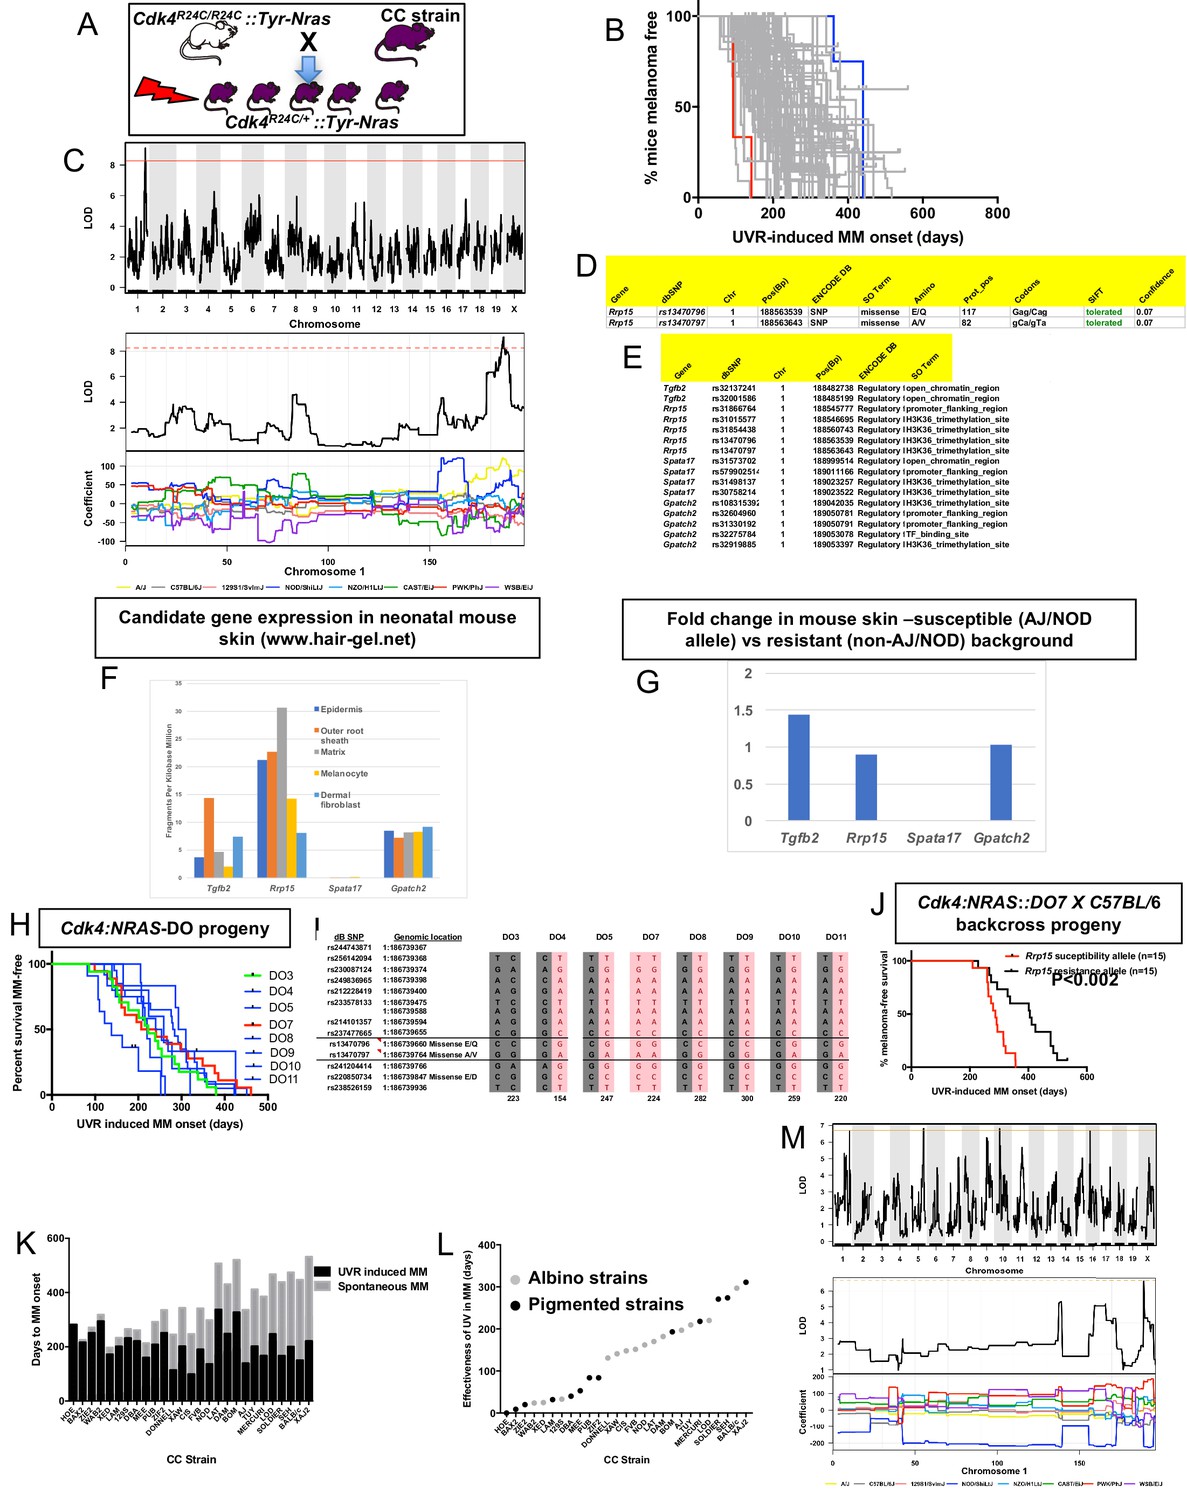
Mapping genes for UVR-induced melanoma.
(A) Schematic representation of breeding protocol to generate mice CC progeny. Pups were exposed to a single UVR exposure at post-natal day 3. (B) Kaplan-Meier MM free survival curve showing age of onset on MM for all 38 strains. Strain in red shows the fastest age of onset. There are two data points (four mice) for this strain cohort, but each onset value represents two mice that developed MM at the same time. Blue shows slowest median age of onset. (C) Top panel shows genome-wide scan based on neonatal UVR-induced MM age of onset in 70 CC strains. The average age of melanoma onset per strain was based upon onset for at least five mice for every strain. Significance of differences between groups calculated using the Log rank (Mantel Cox) test. Genotyping, construction of CC strain haplotypes, and linkage analysis was performed as described in Ram and Morahan (2017). The x-axis shows the chromosomal position and the y-axis shows the 2log10(P) values; the P-values were derived from the linkage haplotype data. Bottom panel shows plot of LOD scores along chromosome 1, with plot of the calculated log-odds ratio of eight founder alleles over the chromosome where the founders are colour-coded. (D) Genes within the −1 -Log10(P) interval carrying putative protein changing mutations. (E) Genes containing potentially regulatory intronic, 5’or 3’ UTR variants. (F) Expression level of genes in the HAIR-GEL skin gene expression database (28). Y axis denotes FPKM (Fragments Per Kilobase Million). (G) Gene expression fold changes in mouse skin from susceptible (AJ, NOD, FVB) compared to resistant (C57BL/6, 129S) strains. Based on gene expression values from RNA sequencing of the skin. (H) Kaplan-Meier curve for UVR-induced MM free survival for Cdk4::NRAS::DO progeny for each of 8 DO strains. Red = homozygous for the AJ/NOD susceptibility allele at the Rrp15 locus, blue-heterozygous, and green strains do not carry the allele. (I), Haplotypes for the parental DO mice at the Rrp15 locus used to predict progeny genotype in Figure 3H. Pink boxes with re text = Rrp15 susceptibility allele. Dark boxes denote the Rrp15 resistance allele. (J) Kaplan-Meier curve for UVR-induced MM age of onset for Cdk4::NRAS::DO7 progeny after two backcrosses onto C57BL/6. P-value calculated using the Log Rank test. (K) Plot depicting relationship between average age of onset spontaneous and UVR-induced MM for a subgroup of CC strains. (L) Plot depicting ‘effectiveness’ of UVR in exacerbating melanoma (spontaneous minus UVR-induced MM) onset from each strain. Grey dots - albino strains, black dots - pigmented strains. (M) Top panel shows genome-wide scan based on neonatal UVR ‘effectiveness’ in inducing MM. Bottom panel shows plot of LOD scores along chromosome 1, with plot of the calculated log-odds ratio of eight founder alleles over the chromosome where the founders are colour-coded. The brown line denotes ‘suggested’ linkage (FDR < 0.01), whereas an FDR < 0.001 is defined as significant linkage.
Figure 4
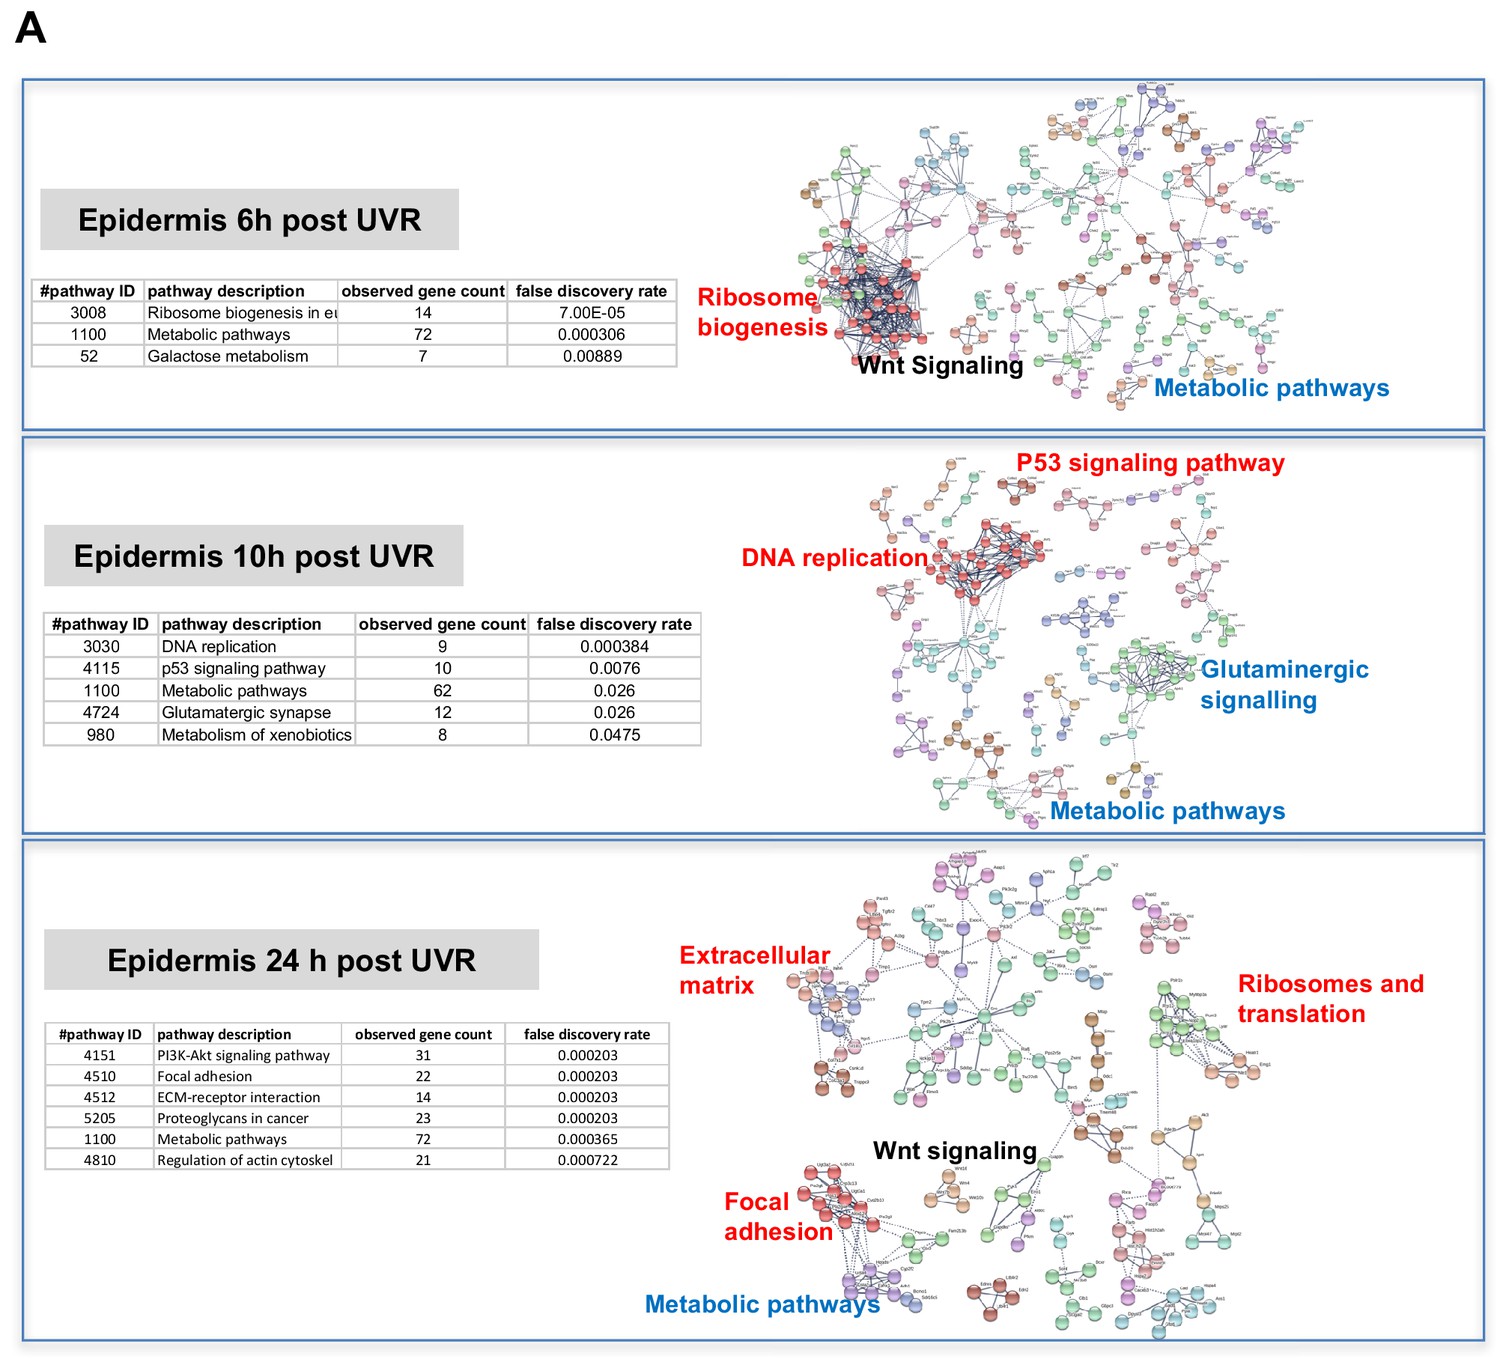
Gene expression networks induced by UVR.
(A) Gene network analysis showing at various time-points after neonatal UVR the top 500 genes (all p<0.05) deregulated in UVR-treated neonatal epidermis versus untreated (from the same mouse on the side blocked with electrical tape). Based on three mice (control) and three mice (+UV) per time-point. Pathways labelled in red were upregulated after UVR, and those in blue downregulated. For those labelled in black some genes were up and some downregulated.
Figure 5
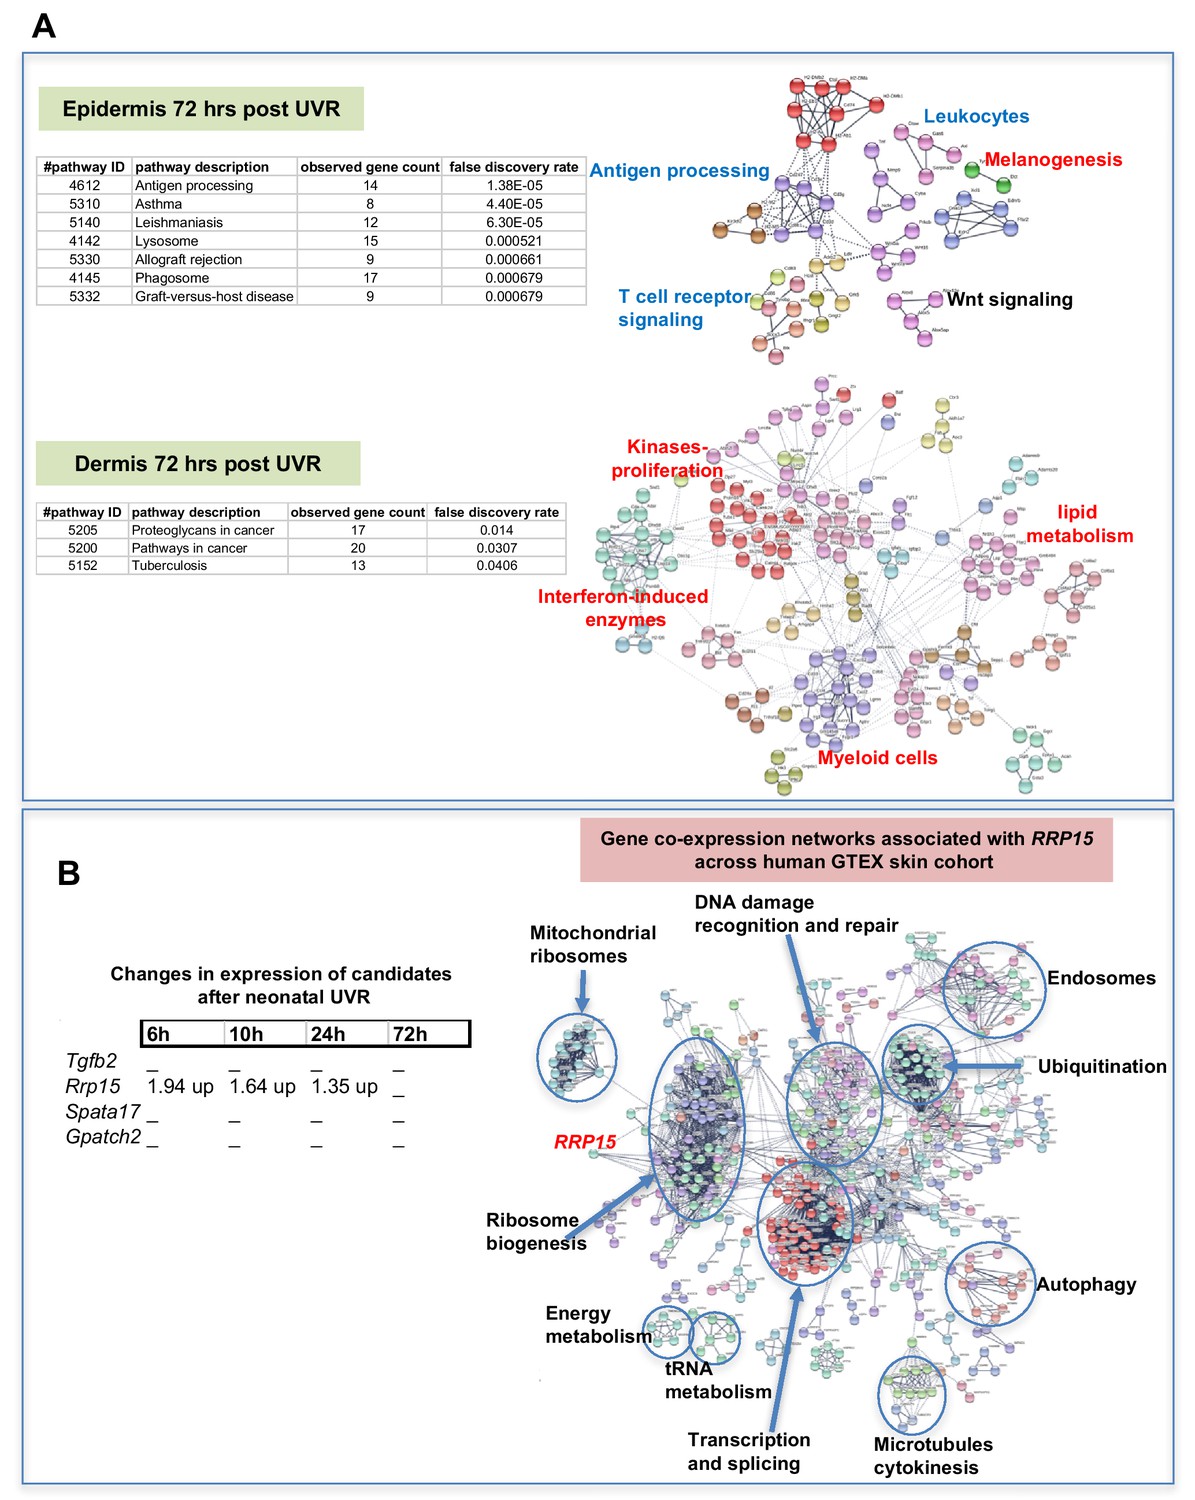
Gene expression networks induced by UVR.
(A) Gene network analysis showing at epidermis (top panel), and dermis (bottom panel) 72 hr after neonatal UVR, the top 500 genes (all p<0.05) deregulated in UVR-treated neonatal epidermis versus untreated (from the same mouse on the side blocked with electrical tape). Pathways labelled in red were upregulated after UVR, and those in blue downregulated. For those labelled in black some genes were up and some downregulated. (B) Fold change of expression of candidate genes after neonatal UVR. The only gene within the candidate region on chr.1 changed after neonatal UVR was Rrp15. To the right is a network of genes correlated with RRP15 expression across the sun-exposed site human skin GTEx cohort (Genenetwork.org). Networks of the top 500 genes correlated with RRP15 were constructed at a confidence value of 0.9 using STRING (https://string-db.org).
Figure 6

Immune and melanocyte proliferative responses post UVR in different mouse strains.
(A) Parameters measured post UVR in different mouse strains. Top bar graph shows number of cells (stained with anti-CPD antibody) positive for pyrimidine dimers at 1 (D1), 4 (D4) and 7 (D7) in whole skin after neonatal UVR. Second bar graph shows the number of epidermal melanocytes (stained with anti-Sox10 antibody) per field. Third graph shows the number of dermal neutrophils (stained with anti-myeloperoxidase) per field. Fourth graph shows the number of dermal macrophages (stained with anti-F4/80 antibody) per field. For each replicate time-point cells were counted from at least three mice, with at least 10 fields counted per mouse. (B) Levels of each measured parameter post UVR presented as a heatmap. Strains are separated according to whether they carry the Rrp15 susceptibility allele (NOD, AJ, FVB) or not (DBA, 129S, (B6). For each parameter, groups were treated separately and analysed for significant differences between groups using the Mann-Whitney U test using PRISM. (C) Heatmap using the same data as in the previous heatmap, but this time strains are listed according to age of onset of melanoma (fastest to slowest), and each parameter analysed for Pearson correlation co-efficient with age of onset of melanoma using PRISM. P-value for a two-tailed test based on 95% confidence interval. Final row shows correlation Pearson r value and p value for the correlation. (D) Both panels show myeloperoxidase (MPO) staining of neonatal FVB mouse skin at 24 hr post UVR. Yellow arrows denote neutrophils, which were present in PBS-treated skin but not skin treated with neutrophil depleting Ly6g antibody. (E) Graph shows average number of neutrophils per field in UVR treated skin with (n = 17) or without (n = 15) treatment with neutrophil depleting antibody. p-value calculated using the Mann Whitney U test. Mice were collected from over a number of litters, with each litter divided in two to randomly establish treatment and control groups. (F) Kaplan-Meier analysis of melanoma free survival in neonatal UVR-treated mice. We aimed to study at least 20 mice in each group. 20 animals per group is sufficient to detect a difference in penetrance of 40% with statistical power of 80%. Actual numbers analysed n = 18 for the neutrophil-depleted group, and n = 15 for the control group. Significance of differences between groups calculated using the Log rank (Mantel Cox) test. There was no significant difference in melanoma age of onset whether or not neonates were treated with neutrophil depleting Ly6g antibody.
Figure 7
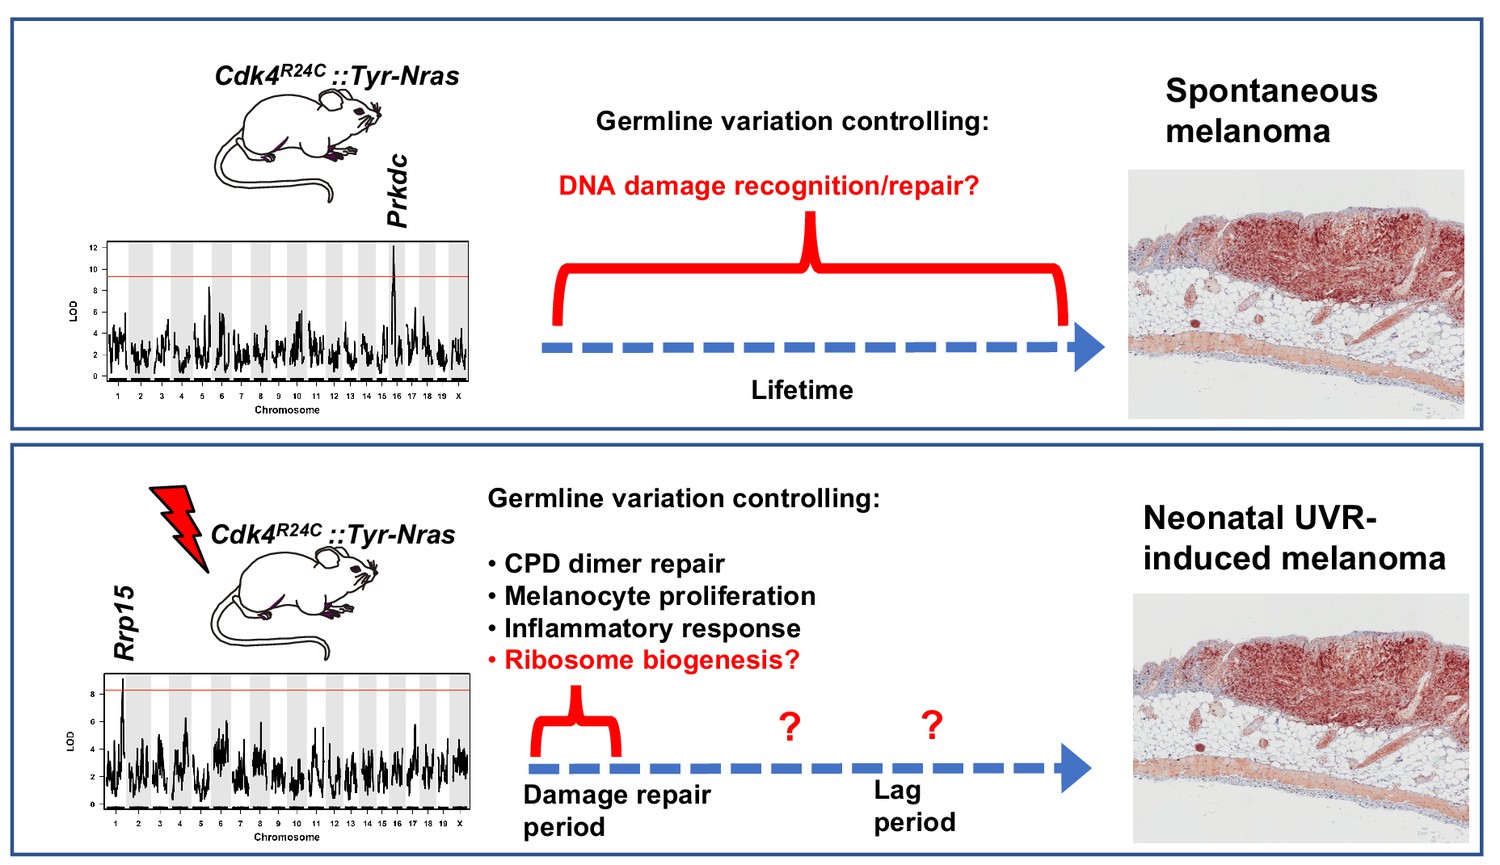
Schematic representation showing candidate genes within QTLs regulating melanoma age of onset in mice.
Figure also shows putative mechanisms which accelerate melanoma in either the spontaneous or UVR-induced contexts. Germline gene variation influencing double strand break recognition and repair probably throughout the life of the animals controls spontaneous MM development. Germline gene variation influencing ribosome function and protein synthesis either during the acute damage repair period after neonatal UVR, or perhaps during the lag period leading to tumour initiation, explain acceleration of MM by UVR.
Tables
Key resources table
| Reagent type (species) or resource | Designation | Source or reference | Identifiers | Additional information |
|---|---|---|---|---|
| Gene (Mus musculus) | Cdk4-R24C | PMID:11606789 | crossed onto FVB/N background | |
| Gene (Homo sapiens) | NRAS-Q61K | PMID:11606789 | crossed onto FVB/N background | |
| Gene (M. musculus) | p53F/F | PubMed: 10783170 | 008361 - B6;129S4-Trp53<tm5Tyj>/J - The Jackson Laboratory | crossed onto FVB/N background |
| Gene (M. musculus) | Braf-V600E | PMID: 17299132 | 017837 - B6.129P2(Cg)-Braf<tm1Mmcm>/J - The Jackson Laboratory | crossed onto FVB/N background |
| Gene (M. musculus) | Tyr-Cre ER | 16676322 | 012328 - B6.Cg-Tg(Tyr-cre/ERT2)13Bos/J - The Jackson Laboratory | crossed onto FVB/N background |
| Genetic reagent (M. musculus) | Collaborative Cross resource | Geniad Pty Ltd, and the Animal Resource Centre (ARC), Western Australia | Mice descended from eight founders generated as recombinant inbred stock | |
| Genetic reagent (M. musculus) | Diversity Outbred mouse resource | Geniad Pty Ltd, and the Animal Resource Centre(ARC), Western Australia | Mice descended from eight founders generated as outbred stock | |
| Biological sample (M. musculus) | skin samples from mouse subjects | Animal Resource Centre(ARC), Western Australia | C57B6, NOD, A/J, 129s mouse strains | |
| Antibody | anti F4/80 from CD68 rat monoclonal antibody | Abcam | Abcam 6640, CI: A3-1 (Cambridge,UK) | for macrophages. 1:400 dilution |
| Antibody | anti Sox10 goat polyclonal | Santa Cruz Biotechnologies | SC-17342 (N-20) Santa Cruz Biotechnology (Dallas Tx, USA) | for melanocytes. 1:200 dilution |
| Antibody | Monoclonal anti-thymine dimer, Clone H3 | Sigma Aldrich | Anti-Thymine dimer Clone H3 (T1192), Sigma Aldrich (St Louis, MO, USA) | for Cyclobutane pyrmidine dimers. 1:400 dilution |
| Antibody | Anti-Ly6G Rat anti-neutrophil monoclonal antibody | Abcam | Anti-Ly6G rat monoclonal antibody Abcam ab2557:Clone NIMP-R14 (Cambridge, UK) | for Neutrophil staining (1:400 dilution) and depletion (undiluted) |
| Antibody | Anti-MPO | Abnova | Abnova rabbit anti-MPO Clone 14328 (Taipei, Taiwan) | for Neutrophils after neutrophil depletion 1:100) |
| Sequence-based reagent | Vector NovaRed Peroxidase Substrate kit | Vector Laboratories | SK-4800, Vector Laboratories (CA, USA) | |
| Commercial assay or kit | Mouse expression array | Illumina | Illumina TotalPrep RNA amplification, Illumina MouseWG-6 v2.0 Expression Beadchips | |
| Commercial assay or kit | RNA sequencing | Illumina | Illumina mRNA kit, Illumina HiSeq with 50bp single reads | RNA-seq samples mapped to mouse genome MM10 using TopHat2 |
| Commercial assay or kit | RNA isolation kit | Qiagen | Rneasy Kit | |
| Software, algorithm | Geneminer platform | Geneminer | http://130.95.9.22/Geniad2/ | Ram R, Morahan G. Using Systems Genetics to Understanding the Etiology of Complex Disease. Methods Mol Biol 2017;1488:597-606. |
| Other | UVB lamps for irradiation | Phillips | 6 lamps TL100W 12RS UVB lamps |
Additional files
-
Supplementary file 1
Schematic representation of SNPs across the interval 4 Mb either side of Rrp15.
Pink haplotypes represent the AJ/NOD allele, grey one or more of the other six founders, and clear regions were unable to be inferred. Results listed for 20 SNPs across 8 DO strains (DO1-DO11).
- https://doi.org/10.7554/eLife.42424.010
-
Supplementary file 2
List of normalized gene expression values for adult mouse skin.
Unprocessed raw counts based on Fragments per kilo base per million mapped reads. Table shows results for whole skin from 8 weeks old mice of the following strains; AJ, NOD, 129S, FVB, and C57BL/6
- https://doi.org/10.7554/eLife.42424.011
-
Supplementary file 3
Fold change of genes at various time-points post neonatal UVR.
Significantly up or down regulated genes based on analysis of either whole epidermis or whole dermis gene expression using Illumina MouseWG-6 v2.0 Expression BeadChips. At least three mice (control), and three mice (+UV) were used for each time-point.
- https://doi.org/10.7554/eLife.42424.012
-
Supplementary file 4
List of significant pathways upregulated in neonatal murine skin at various times after UVR.
To generate interconnected networks based on correlations, gene lists were clustered using STRING (http://string-db.org/) based on the top 500 genes differentially under or overexpressed after neonatal UVR exposure. The terms are sorted by their enrichment value shown as statistically in terms of false discovery rate.
- https://doi.org/10.7554/eLife.42424.013
-
Transparent reporting form
- https://doi.org/10.7554/eLife.42424.014
Download links
A two-part list of links to download the article, or parts of the article, in various formats.
Downloads (link to download the article as PDF)
Open citations (links to open the citations from this article in various online reference manager services)
Cite this article (links to download the citations from this article in formats compatible with various reference manager tools)
Different genetic mechanisms mediate spontaneous versus UVR-induced malignant melanoma
eLife 8:e42424.
https://doi.org/10.7554/eLife.42424


