Panton–Valentine leucocidin is the key determinant of Staphylococcus aureus pyomyositis in a bacterial GWAS
- University of Oxford, John Radcliffe Hospital, United Kingdom
- Oxford University Hospitals NHS Foundation Trust, John Radcliffe Hospital, United Kingdom
- Angkor Hospital for Children, Cambodia
- East Tennessee State University Quillen College of Medicine, United States
- Cambridge University Hospitals NHS Foundation Trust, United Kingdom
- John Radcliffe Hospital, United Kingdom
- Liverpool School of Tropical Medicine, United Kingdom
- Nagasaki University, Japan
- University of Oxford, United Kingdom
- Faculty of Tropical Medicine, Mahidol University, Thailand
Figures
Figure 1 with 1 supplement
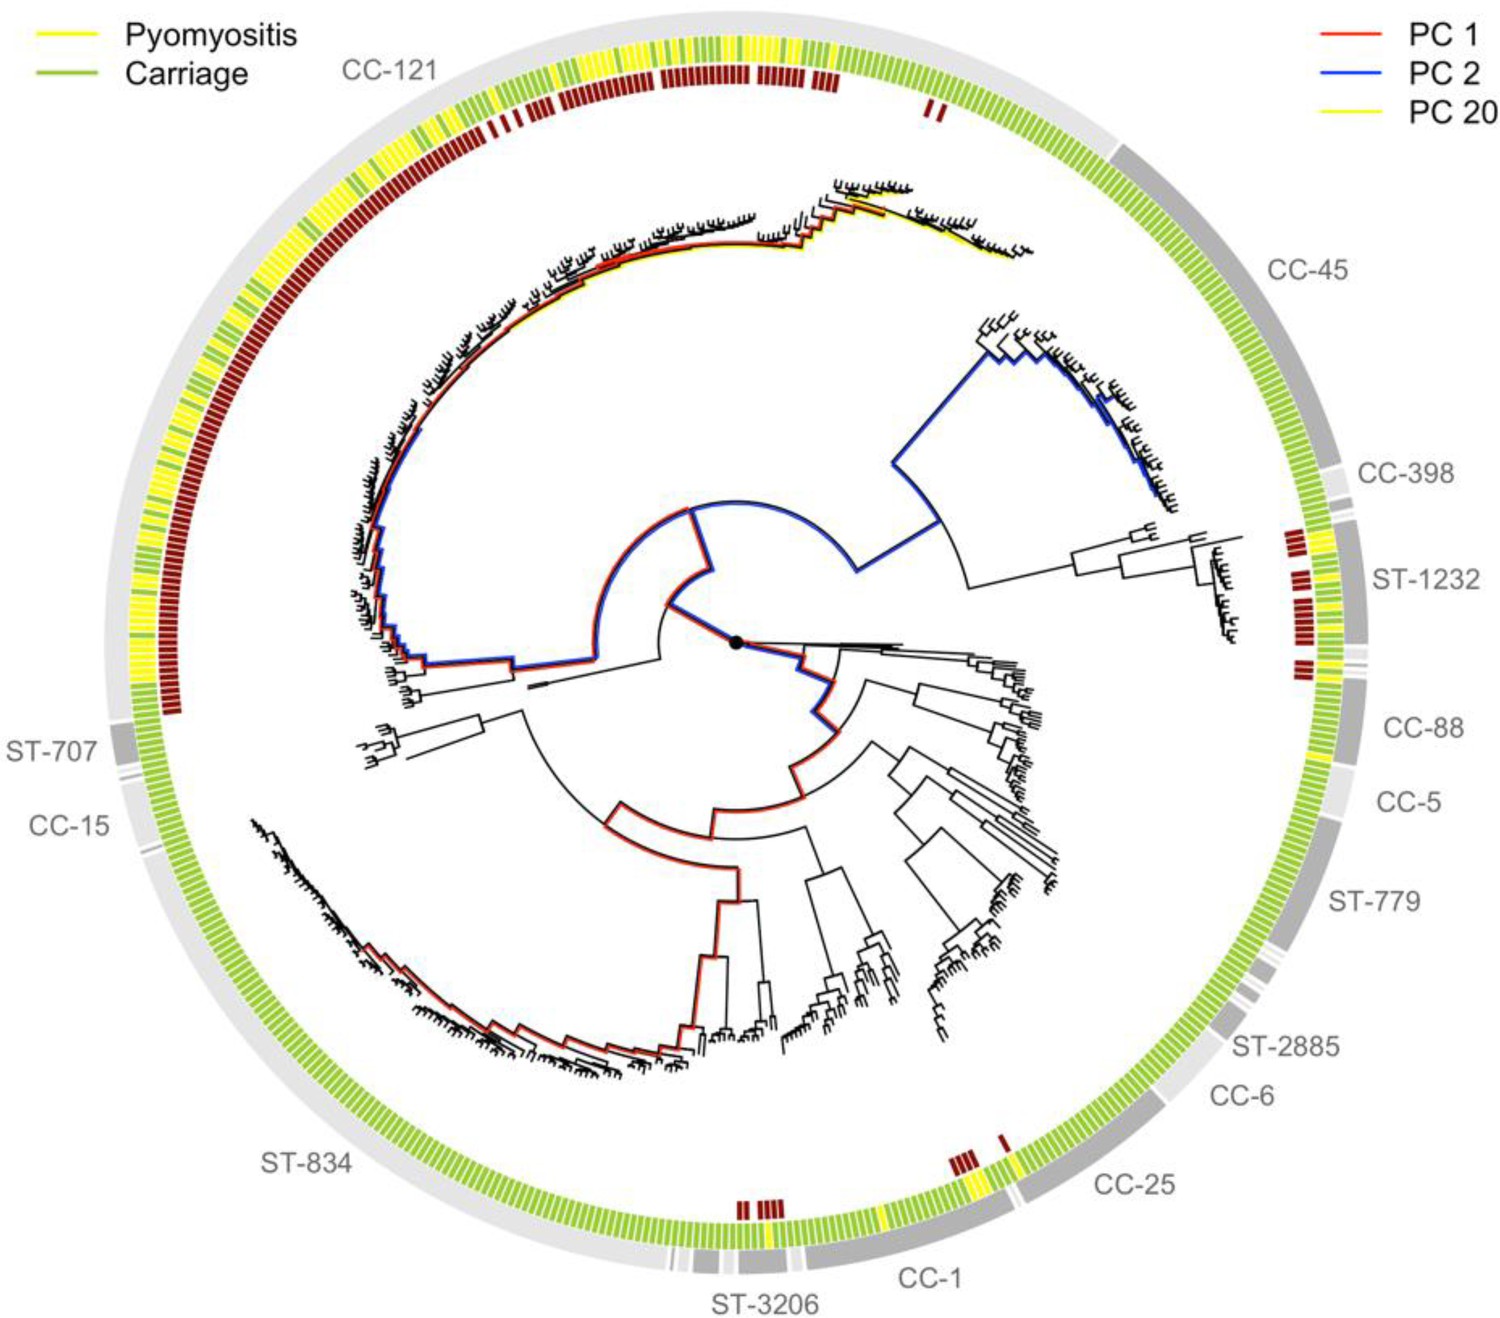
Phylogeny of S. aureus cultured from children in Cambodia shows strong strain-to-strain variation in pyomyositis prevalence.
The phylogeny was estimated by maximum likelihood from SNPs mapping to the USA300 FPR3757 reference genome. Multi-locus sequence type (ST) or clonal complex (CC) groups are shown (outer grey ring). Case/control status is marked in the middle ring: pyomyositis (gold, n = 101) or nasal carriage (green, n = 417). Branches of the phylogeny that correspond to the three principal components (PCs) significantly associated with case/control status (PCs 1, 2 and 20) are marked in red, blue and yellow, respectively. Branch lengths are square root transformed to aid visualization. The presence of the kmers most strongly associated with pyomyositis is indicated by red blocks in the inner ring.
Figure 1—figure supplement 1
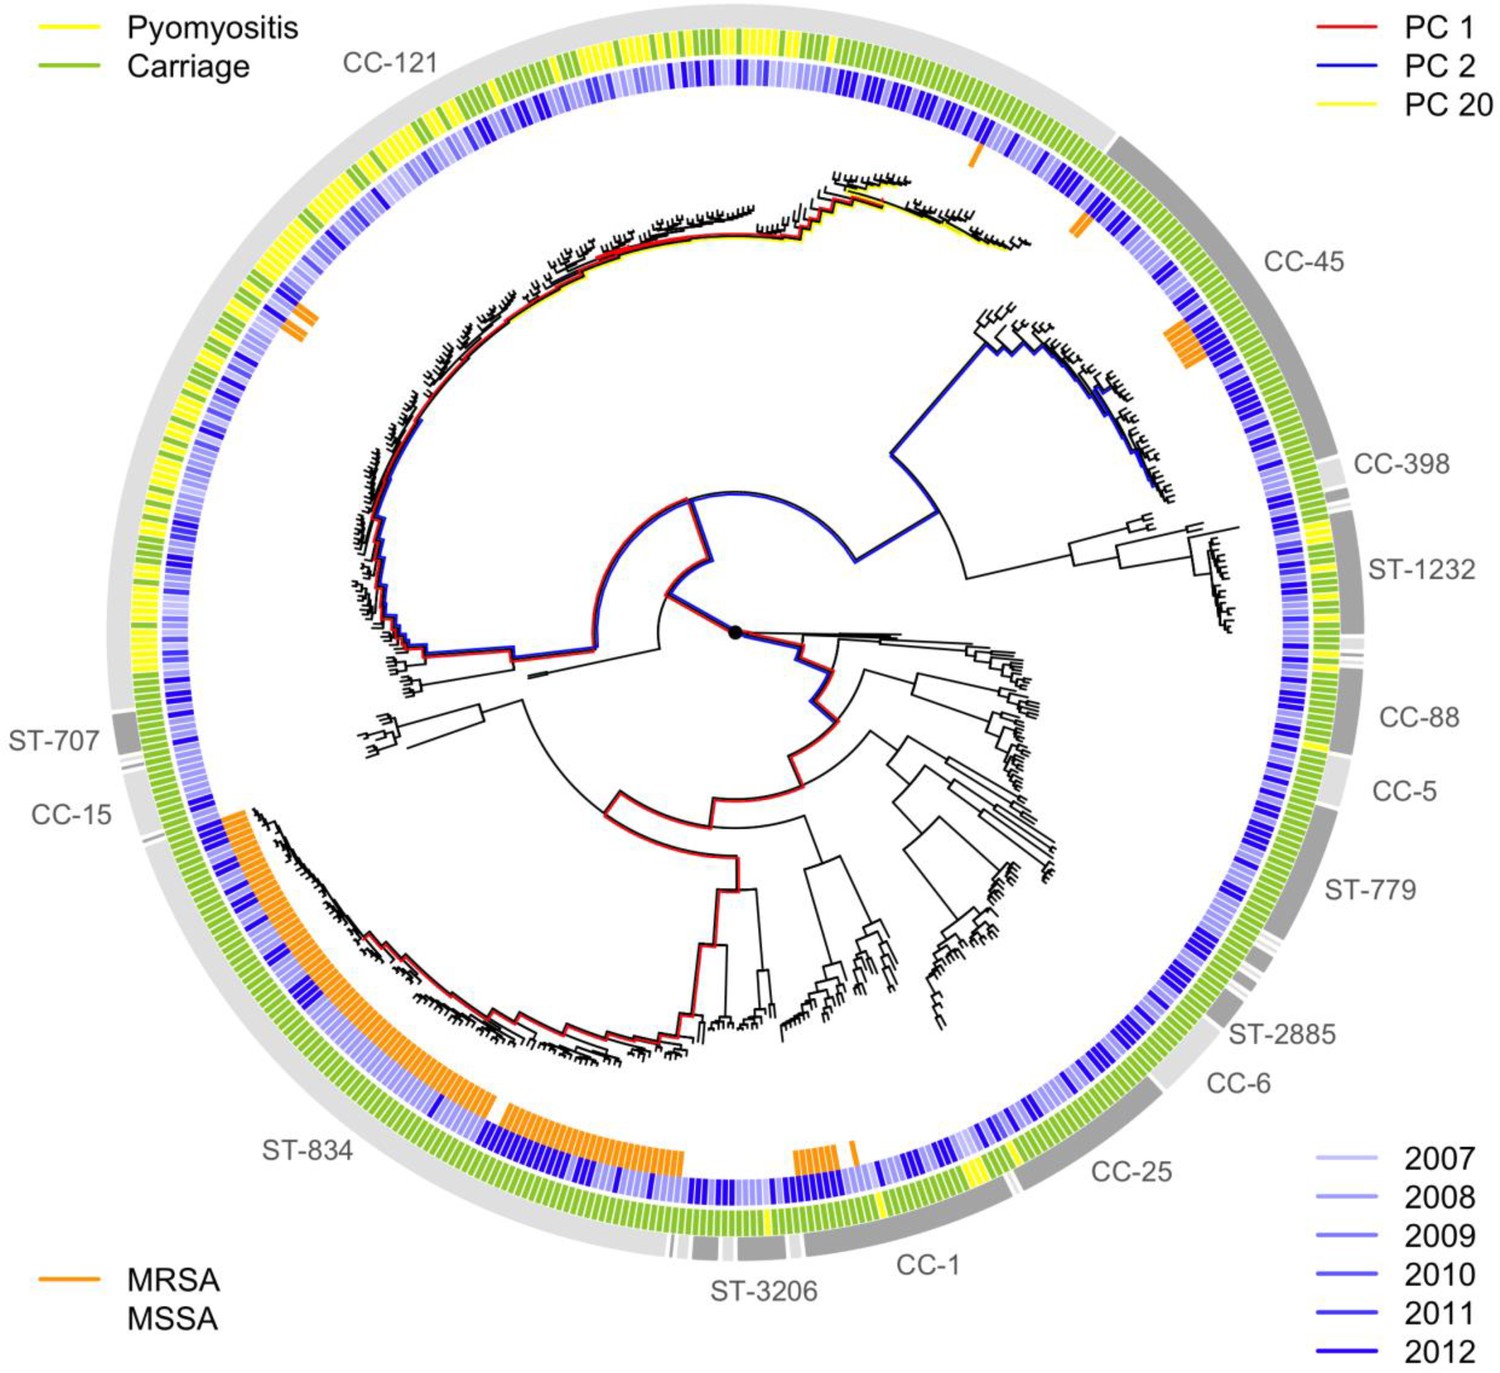
Sampling frequencies of the major strains were stable over time.
The year of sampling (2007–2008, blue shaded lines) and MRSA status (orange lines) are illustrated around the phylogeny of the bacteria sampled from pyomyositis cases (gold lines) and asymptomatic carriage controls (green lines). The three PCs most significantly associated with case/control status are also shown (PCs 1, 2 and 20 by red, blue and yellow branches respectively). Branch lengths are square root transformed to aid visualization.
Figure 2 with 4 supplements
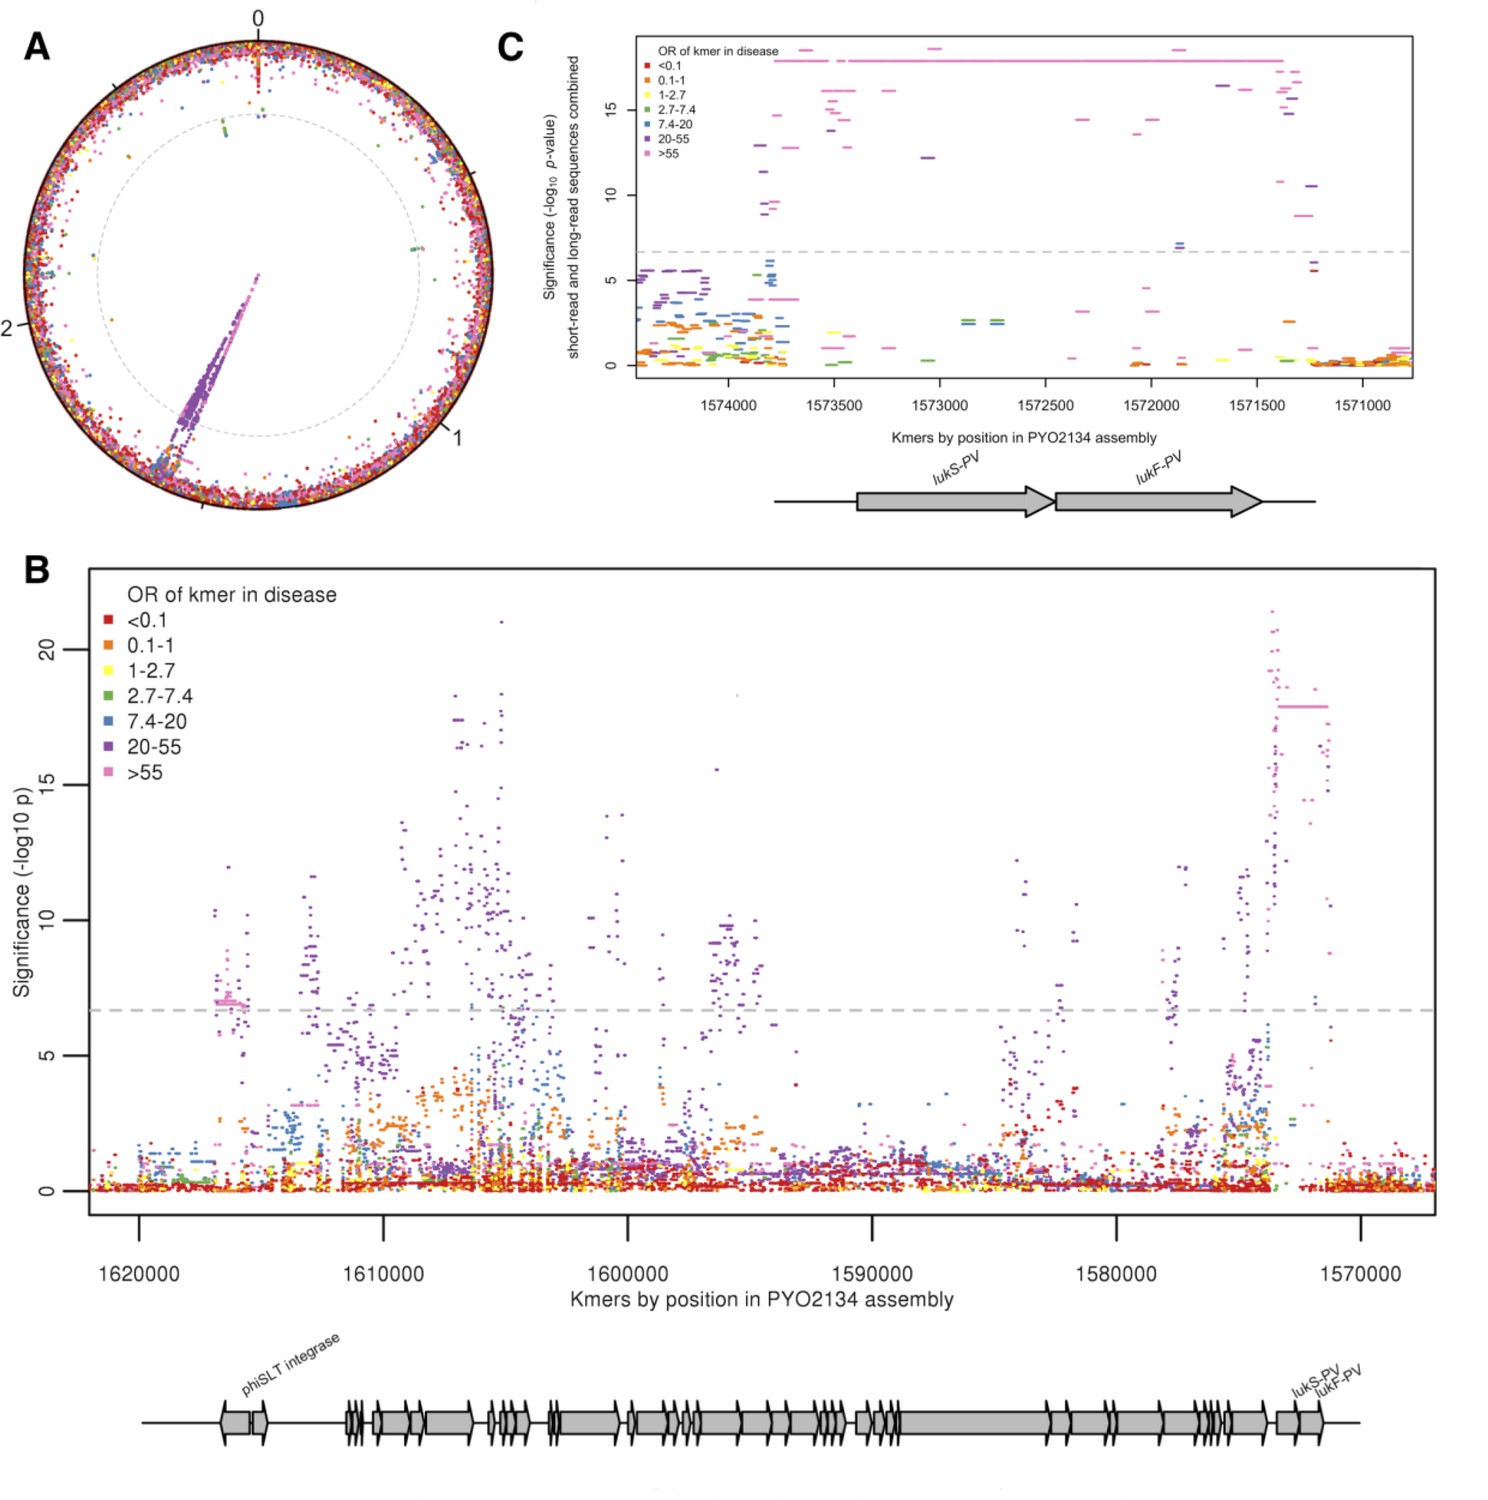
Kmers associated with pyomyositis.
(A) All kmers (n = 10,744,013) were mapped to the genome assembly of one CC121 pyomyositis bacterium (PYO2134). Each point represents a kmer, plotted by the mapped location and the significance of the association with disease (-log10 p value). Kmers are coloured by the odds ratio (OR) of kmer presence for disease risk. A Bonferroni-adjusted threshold for significance is plotted in grey. (B) The region between 1.57–1.62 MB in greater detail. Grey arrows depict coding sequences, determined by homology to USA300 FPR3757. (C) Associations for kmers mapping to region 1,571–1574 kB is plotted. Kmer presence determined from hybrid assembly using short and long-read data. Grey arrows depict coding sequences, determined by homology to USA300 FPR3757.
Figure 2—figure supplement 1
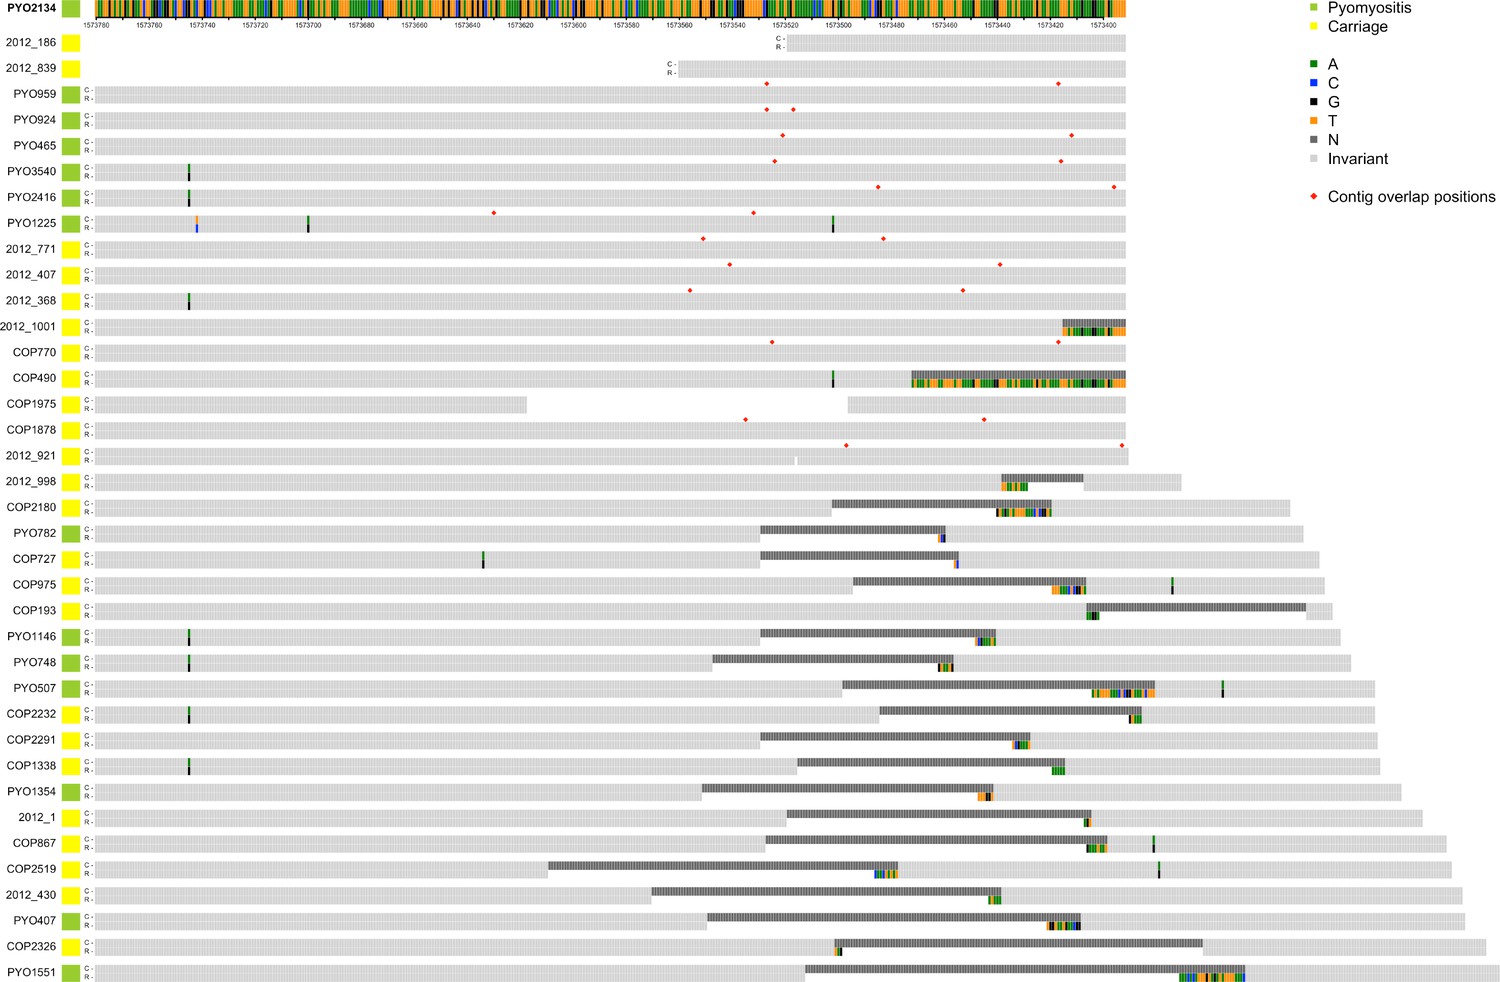
Alignments of reference genome PYO2134 assembly (R) with 37 de novo assemblies of Illumina short-read sequencing (C) which feature either ambiguities (Ns) or contig boundaries in the region 389 bp upstream of PVL coding sequence.
Contig boundaries, when overlapping, are marked with a red diamond. Ns in the assembly are marked in dark grey. Polymorphisms are colour-coded by base.
Figure 2—figure supplement 2
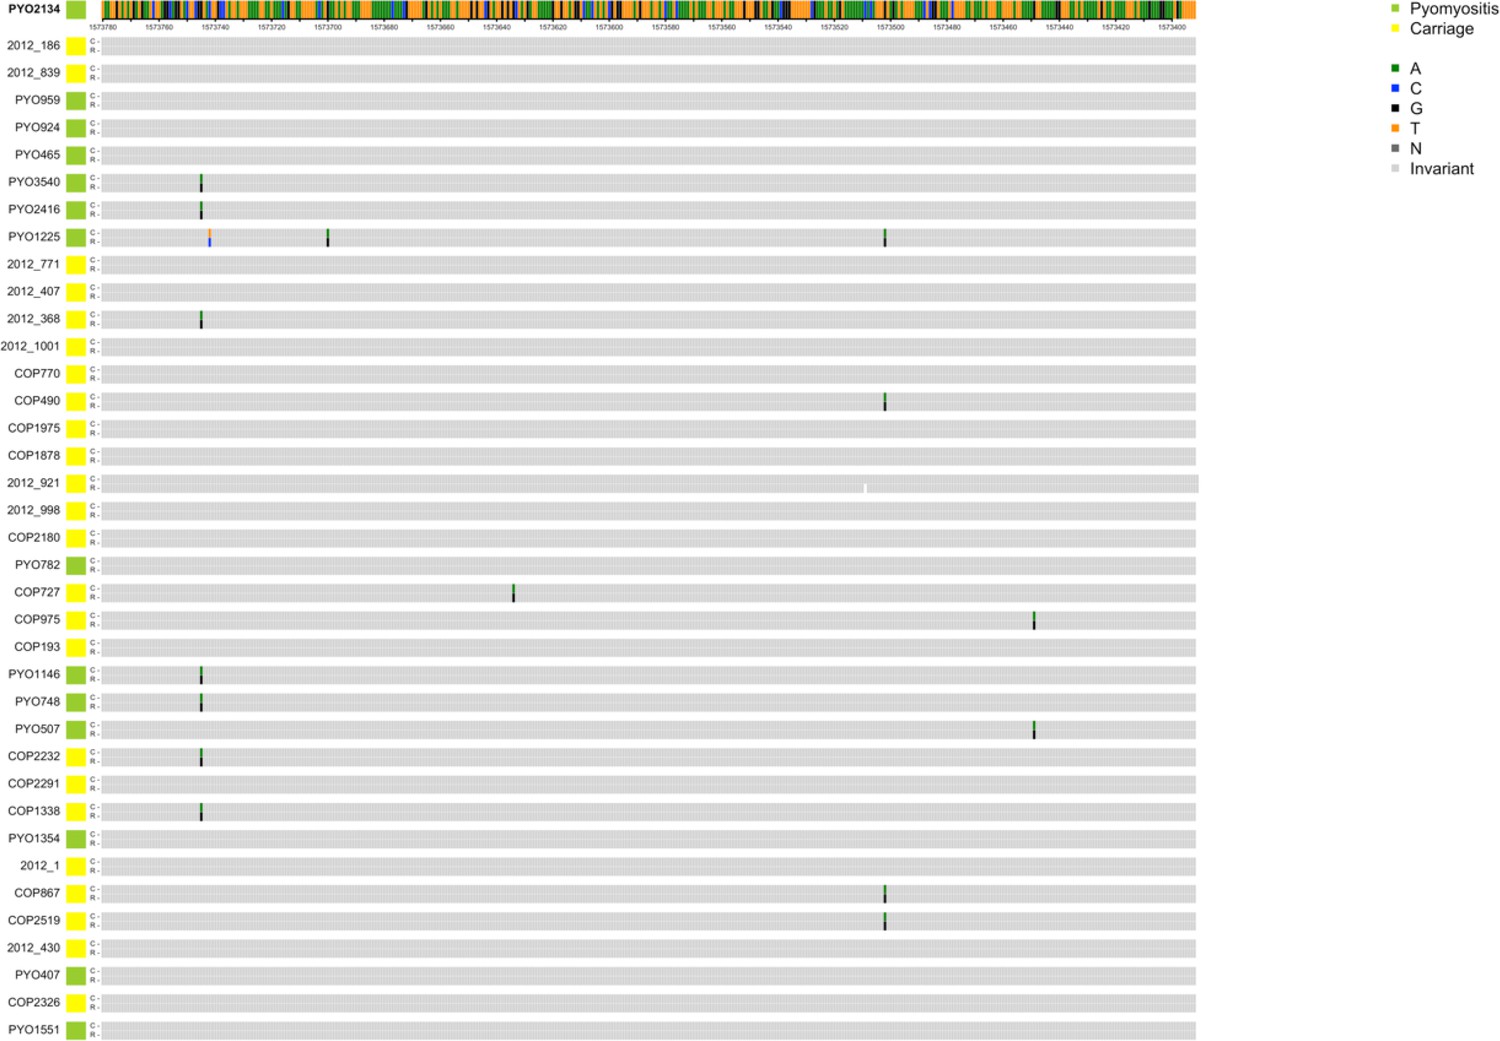
Alignments of reference genome PYO2134 assembly (R) with 37 de novo assemblies of Illumina short-read sequencing (C) which feature either ambiguities (Ns) or contig boundaries in the region 389 bp upstream of PVL coding sequence.
Contig boundaries, when overlapping, are marked with a red diamond. Ns in the assembly are marked in dark grey. Polymorphisms are colour-coded by base.
Figure 2—figure supplement 3
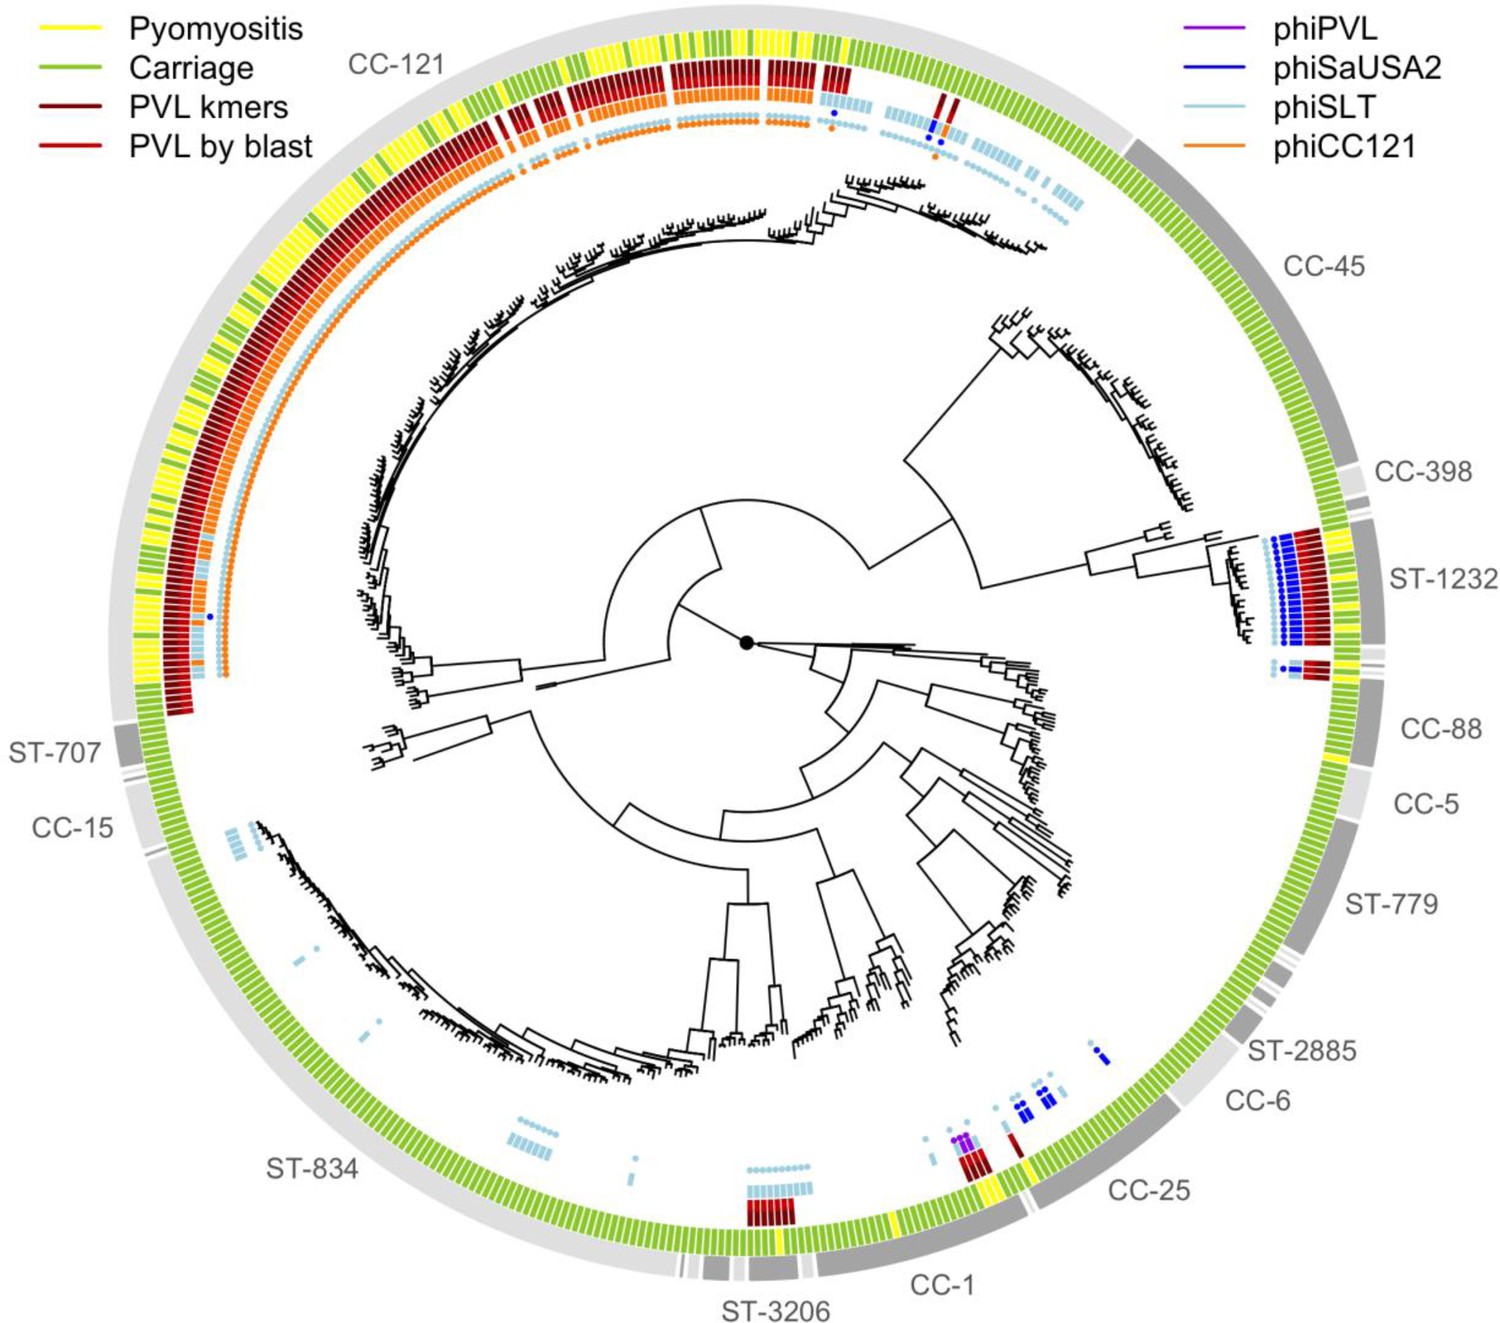
Presence of PVL and potential PVL carrying phages across the population.
Multi-locus sequence type (ST) or clonal complex (CC) groups are shown (outer grey ring). Case/control status is marked in the next outermost ring: pyomyositis (gold, n = 101) or nasal carriage (green, n = 417). Branch lengths are square root transformed to aid visualization. The presence of kmers mapping to the PVL coding sequence (dark red) or of >98% coverage of PVL coding sequence in de novo assembly found by BLAST (red) are marked in the next rings. Phages with >95% coverage on BLAST of the de novo assembly are marked by points (phiPVL in purple, φSaUSA2 in dark blue, φSLT in light blue and φCC121 in orange), and bars are used to mark the phage with the greatest sequence homology.
Figure 2—figure supplement 4

Significant association between case/control status and the presence of kmers mapping to PVL was consistent across early and late subsets.
Results from repeat kmer GWAS using early and late sub-groups of cases and controls, as well as results from original GWAS of the entire group. We report the presence of kmers mapping across the PVL locus in each subset. Forest plot showing the effect sizes (box) with 95% CI (whiskers) determined by LMM for kmers mapping to PVL kmer in each subset, and in the complete study (diamond centred on effect size extending across 95% CI). The statistical significance of association with case/control status after controlling for population structure is shown for each subset and the complete study.
Additional files
-
Supplementary file 1
Isolates included in this study.
- https://doi.org/10.7554/eLife.42486.010
-
Supplementary file 2
All significant kmers from short-read sequencing assembly, evidence of association, frequency, location on mapping to the study reference PYO2134, best match on BLAST (blastn) to all S. aureus coding sequences in Genbank, and best match on BLAST (blastn) to the NCBI database.
- https://doi.org/10.7554/eLife.42486.011
-
Supplementary file 3
Presence of high risk kmers and relative coverage of PVL coding sequence and common PVL positive phages found by BLAST (blastn) of short read assemblies.
- https://doi.org/10.7554/eLife.42486.012
-
Supplementary file 4
List of all isolates, and site of isolation (carriage or invasive disease) and year of isolation.
These isolate names match those used in sequence data deposition on SRA.
- https://doi.org/10.7554/eLife.42486.013
-
Transparent reporting form
- https://doi.org/10.7554/eLife.42486.014
Download links
A two-part list of links to download the article, or parts of the article, in various formats.
Downloads (link to download the article as PDF)
Open citations (links to open the citations from this article in various online reference manager services)
Cite this article (links to download the citations from this article in formats compatible with various reference manager tools)
Panton–Valentine leucocidin is the key determinant of Staphylococcus aureus pyomyositis in a bacterial GWAS
eLife 8:e42486.
https://doi.org/10.7554/eLife.42486


