Venous endothelin modulates responsiveness of cardiac sympathetic axons to arterial semaphorin
- Children’s Hospital Los Angeles, University of Southern California Keck School of Medicine, United States
- University of California, San Francisco, United States
- Medical University of South Carolina, United States
Figures
Figure 1
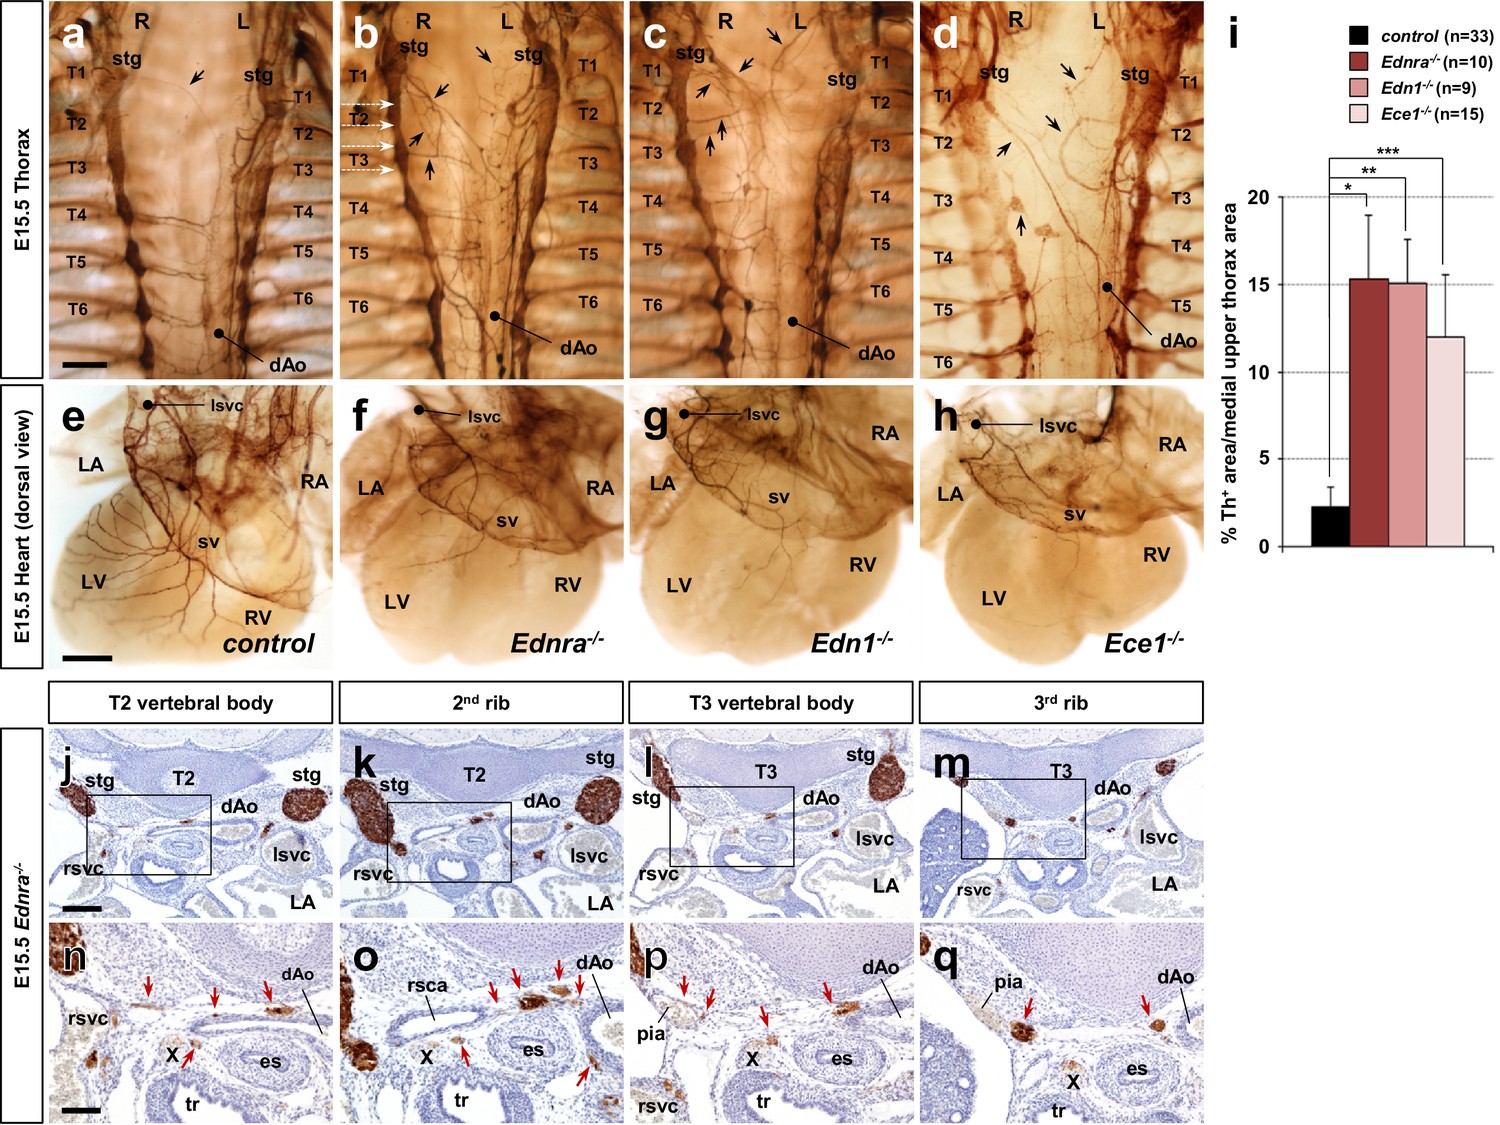
Edn1-Ednra signaling mutant STGs project ectopically.
(a–h) Wholemount Th immunostaining visualizing sympathetic projections from STGs in E15.5 thoraxes (a–d) and hearts (e–h) from Ednra-/- (b, f), Edn1-/- (c, g), Ece1-/- (d, h) and a control (a, e) embryos. Black arrows denote ectopic medial projections from Edn1-Ednra signaling-deficient STGs to the thoracic aorta (b–d), which is associated with reduced cardiac sympathetic innervations (f, g, h) (Manousiouthakis et al., 2014); very rare projections from the STG to the dorsal aorta occur in control embryos (arrow in a). (i) A compiled representation of Th+ area in the medial upper thorax area in E15.5 endothelin signaling component mutant embryos. For the embryos of each litter, the proportion of Th+ pixel area within the upper thoracic body wall area (between C7 and T4 vertebrae) between sympathetic chains was measured. Analysis included results of 5 Ednra litters (7 controls, 10 Ednra-/-), 4 Edn1 litters (9 controls, 9 Edn1-/-), and 7 Ece1 litters (18 controls, 15 Ece1-/-). Error bars; mean ± sd. *p=8.49E-22, **p=8.22E-25, ***p=1.71E-19. (j–q) Serial transverse sections of an E15.5 Ednra-/- embryo at the levels corresponding to the white dotted arrows in (b) (from the top: T2 vertebral body, the second rib, T3 vertebral body, and the third rib) were immunostained for Th (brown) and counterstained with hematoxylin (blue). (n–q) Magnified views of bracketed areas in j–m). Red arrows point to ectopic medial projections from STG that are associated with thoracic arteries. dAo, descending aorta; es, esophagus; LA, left atrium; lsvc, left superior vena cava; LV, left ventricle; pia, posterior intercostal artery; RA, right atrium; rsvc, right superior vena cava; RV, right ventricle; stg, stellate ganglion; sv, sinus venosus; T, thoracic segment; tr, trachea; X, Xth cranial nerve. Scale bars, 200 μm (a–d), 100 μm (e–h), 200 μm (j–m), 100 μm (n–q).
Figure 2
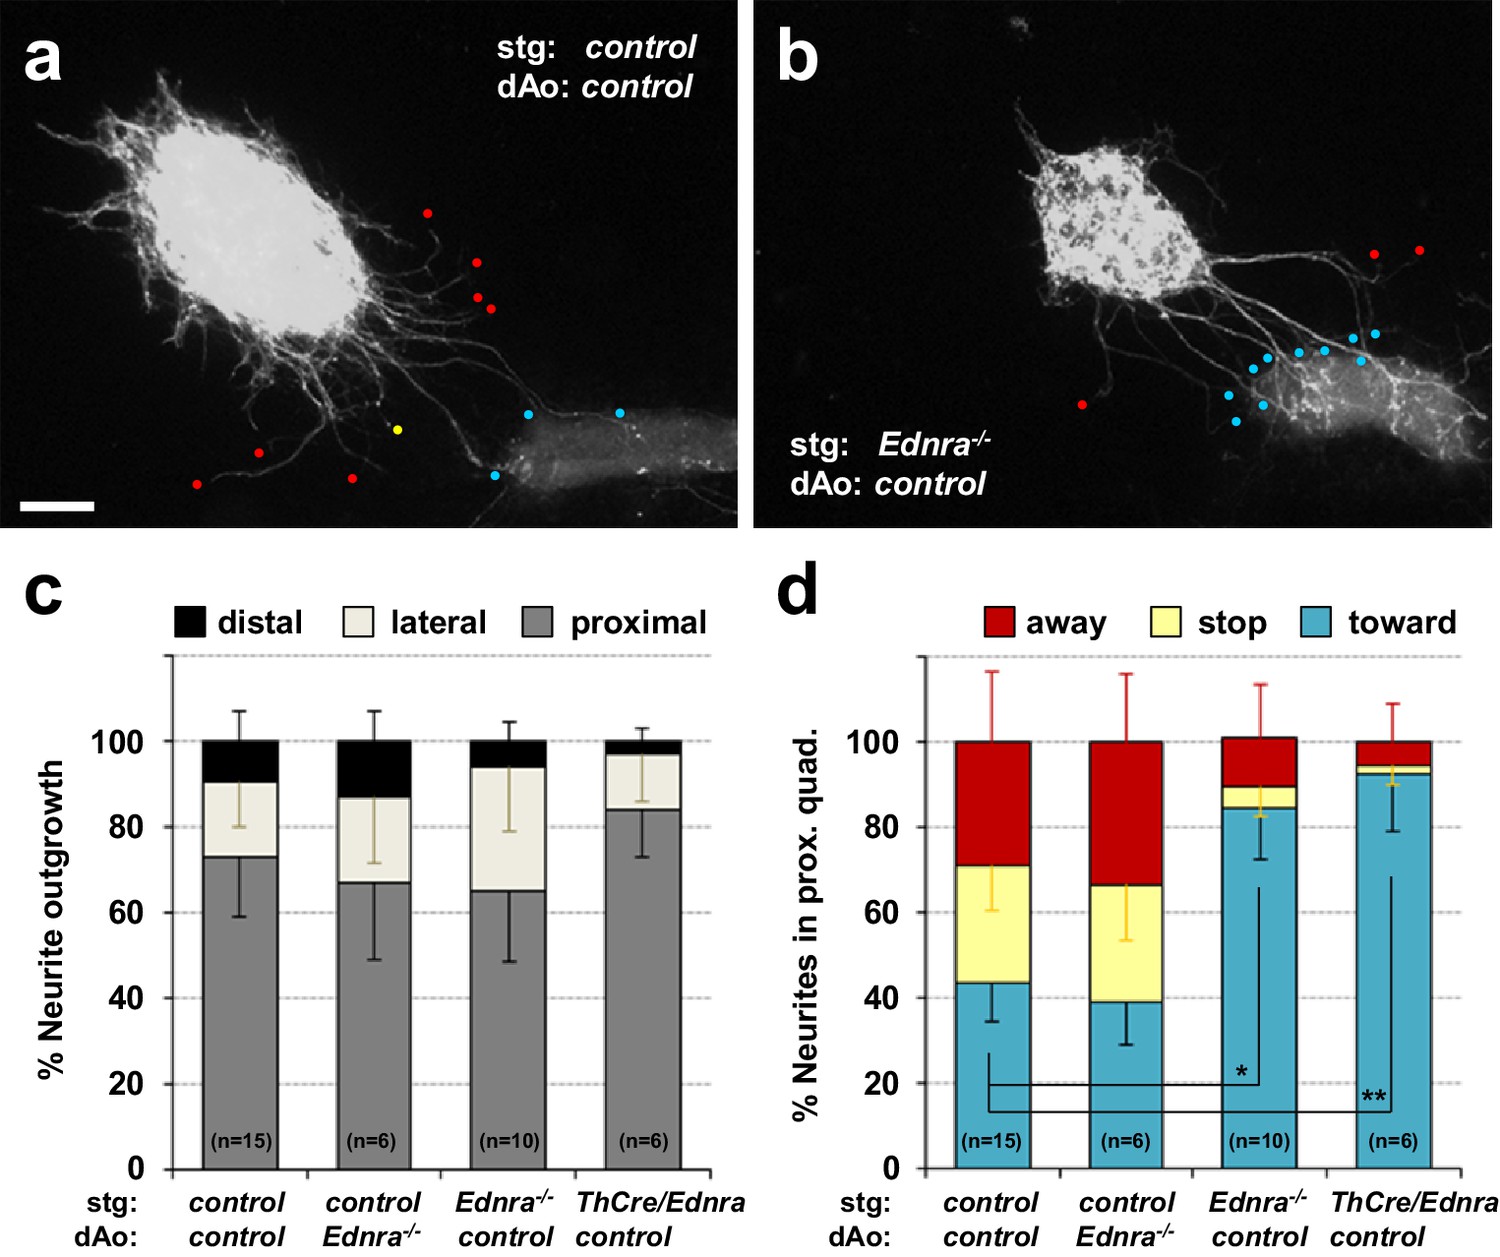
Lack of repulsive response to arterial segments in Ednra-deficient STGs in vitro.
(a–b) Neurite outgrowths from E14.5 control STG (a) and Ednra-/- STG (b) cocultured with thoracic descending aorta segments (dAo) dissected from littermate control embryos were visualized by wholemount Th immunostaining. Red, yellow and blue dots denote neurites that have turned away from, have stopped extending toward, or have grown into the vascular segment (proximal quadrant), respectively. (c) A compiled representation of directional outgrowth (pixel area in the proximal quadrant) from the STG in terms of relative neurite outgrowth projecting proximally, laterally, or distally to the dAo. For each experiment, total neurite outgrowth from the STG (sum of all four quadrants) was defined as 100%, and neurite outgrowth in each quadrant is shown as a fraction of total outgrowth. (d) A compiled representation of growth tip directions of neurites within the proximal quadrant shown in (c). Total number of growth tips scored in each proximal quadrant was defined as 100%, and the number of growth tips directing away, stopped, or growing toward the co-cultured dAo segments are shown as a fraction of total neurites in the proximal quadrant. (c–d) Analysis includes results of control:control (n = 15), control:Ednra-/- (n = 6), Ednra-/-:control (n = 10) and Th-Cre/Ednra:control (n = 6) pairs from seven different litters. A total of 183 growth tips in the proximal quadrants were scored from the analysis and compiled in d). Error bars; mean ±s.e.m.; *p=1.53E-08, **p=7.67E-08. Scale bar, 50 μm (a–b).
Figure 3

Reduced expression of Plxna4 in Ednra-deficient STGs.
(a) Quantitative real-time PCR analysis for class three semaphorin receptor and co-receptor genes. Total RNA was extracted from individual E14.5 STG isolated from total seven different litters, reverse transcribed, and evaluated for gene expression as described in Methods. Normalized averaged absolute values for control STGs (n = 15) were scaled at 1.0. Error bars; mean ±s.e.m.; *p=0.002, **p=0.0016, ***p=0.095. (b–m) Serial histological sections of Ednra-/- (c, f–g, j–m) and littermate control (b, d–e, h–i) immunostained for Th (b–c) or immunofluorescence labeled for Th (green) or Plexin-A4 (magenta). Magnified views from an adjacent section of the bracketed areas in b) including the right superior vena cava (rsvc) and left superior vena cava (lsvc) are shown in (d-e and h–i), respectively. Magnified views from an adjacent section of the bracketed areas in (c) including the right superior vena cava (rsvc), left superior vena cava (lsvc), and a posterior intercostal artery (pia) are shown in (f–g), (j–k) and (l-m), respectively. A control pia is not shown because there are no axon misprojections to the pia in normal embryos. White arrowheads point to expression of Plexin-A4 in Th+ cardiac sympathetic axons that are associated with venous routes. Yellow arrows denote lack of Plexin-A4 in Th+ sympathetic axons that are misprojecting along arteries. aAo, ascending aorta; pia, posterior intercostal artery. Scale bars, 200 μm (b–c), 25 μm (d–g), 50 μm (h–k), 50 μm (l–m).
Figure 4

The Plxna4 locus contains several bona fide, conserved MEF2C sites and expression is induced by endothelin signaling in a MEF2C-dependent manner.
(a) Schematic diagram of conserved MEF2C binding sites in the Plxna4 locus. The Plxna4 locus is shown in the center with transcriptional start site (TSS, bent arrow) and exons (vertical black lines) shown. The track shown above the locus schematic represents a genome browser view of MEF2C binding peaks in the Plxna4 locus obtained from MEF2 ChIP-seq in E15.5 mouse neurons. The red (upstream) and orange (intronic) peaks shown below the locus schematic represent VISTA browser tracks of evolutionary conserved regions in the Plxna4 locus containing conserved MEF2 binding sites in mouse, human, and opossum. rVista alignment of mouse and human genomic sequences showing a detailed view of the MEF2 binding sequences are indicated below. (b) Relative endothelin-dependent induction of Plxna4 gene expression in neural crest cells sorted and isolated from Mef2c-deficient and control embryo explants treated with Edn1 and measured by RNA-sequencing. Error bars; mean ± s.d.. (c–d) Wholemount Th immunostaining visualizing sympathetic projections from STG in E15.5 thoraxes from Mef2cKO (d) and a littermate control (c) embryos. Black arrows denote ectopic medial projections from Mef2C-deficient STGs to the thoracic aorta (d). (e–f) Serial histological sections of Mef2cNCKO mutant embryo (f, i–l) and littermate control (e, g–h) immunostained for Th (e–f) or immunofluorescence labeled for Th (green) or Plexin-A4 (magenta) (g–l). Magnified view from an adjacent section of the bracketed areas in (e) including the left superior vena cava (lsvc) is shown in (g–h). Magnified views from an adjacent section of the bracketed areas in (f) including the left superior vena cava (lsvc), and an aortic arch (AA) are shown in (i–j) and (k–l), respectively. White arrowheads point to expression of Plexin-A4 in Th+ cardiac sympathetic axons that are associated with venous routes. Yellow arrows denote lack of Plexin-A4 in Th+ sympathetic axons that are associated with arteries. Scale bars, 200 μm (c–d, e–f), 50 μm (g–l).
Figure 5 with 1 supplement

Ednra and Plxna4 interact genetically.
(a–d) Wholemount immunostaining visualizing the dorsal surface of hearts from a 7-week-old Th-Cre; Ednrafl/+; Plxna4+/- double heterozygote (c), a Th-Cre; Ednrafl/- mutant (d), and single heterozygote controls Th-Cre; Ednrafl/+ (a) and Plxna4+/- (b). a littermate control (a). (e–x) 300 μm vibratome sections immunofluorescence labeled for HCN4 (cyan), Th (magenta) and SYP (yellow) visualizing sympathetic presynaptic morphologies in the SA node (e–p) and left ventricular myocardium (q–x) of an adult mice. ca, coronary (circumflex) artery, ivc, inferior vena cava. Scale bars, 500 μm (a–d), 50 μm (e–x).
Figure 5—figure supplement 1
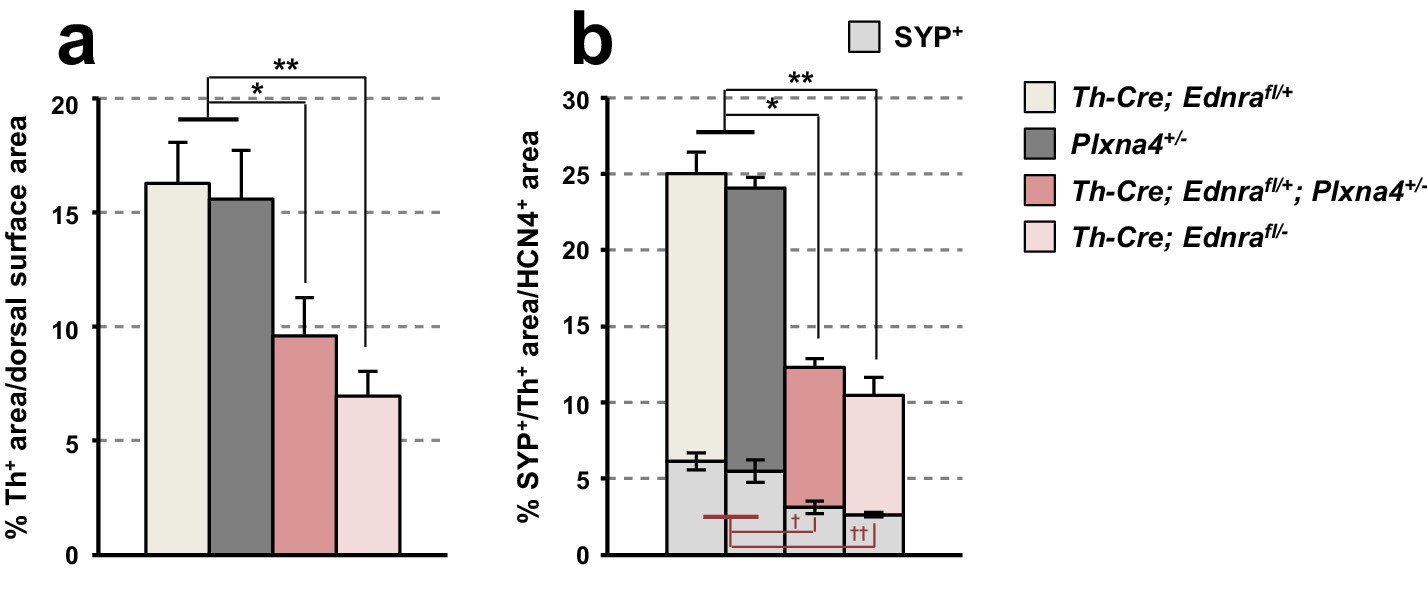
Quantitative assessment of Ednra and Plxna4 genetic interaction.
(a) A compiled representation of Th+ area on the heart dorsal surface of 6–7 week old Th-Cre; Ednrafl/+; Plxna4+/- double heterozygote (n = 7), Th-Cre; Ednrafl/- mutant (n = 4), and littermate single heterozygote controls Th-Cre; Ednrafl/+ (n = 3) and Plxna4+/- (n = 6). For each Th immunostained heart, the proportion of Th+ pixel area within the dorsal surface area was measured. Error bars; mean ± sd. *p=9.98E-06, **p=4.04E-06. (b) A compiled representation of the Th+ area (taller bars) and the SYP+ area of the Th+ area (lower grey bars) within the HCN4+ area of 6–7 week old Th-Cre; Ednrafl/+; Plxna4+/- double heterozygote (n = 3), Th-Cre; Ednrafl/- mutant (n = 3), and littermate single heterozygote controls Th-Cre; Ednrafl/+ (n = 3) and Plxna4+/- (n = 3). For each confocal image, the proportion of SYP+ area within Th+ area in the HCN4+ pixel area was measured. Error bars; mean ± sd. *p=4.87E-04, **p=1.23E-04, †p=1.47E-06, ††p=1.69E-06.
Figure 6 with 1 supplement

Ednra-Plxna4 double-heterozygous mice exhibit diminished cardiac sympathetic nerve activity.
(a–c) Changes in heart rate following amphetamine (a;<2 min, (b;>10 min) and isoproterenol (c) administration measured in indicated 7-week-old single heterozygotes, double heterozygotes, conditional Ednra mutants, and their littermate wildtype controls. Error bars; mean ± s.e.m.; *p=8.95E-05, **p=4.88E-04, ***p=2.55E-05. (d) A compiled representation of the low-frequency: high-frequency domain (LF/HF) ratio at the baseline, post-amphetamine and post-isoproterenol administration in mice of the indicated genotypes. Frequency-domain was extracted from power spectral analysis of heart rate variability (HRV) shown in Figure 6—figure supplement 1. Error bars; mean ± s.e.m.; *p=0.0001, **p=0.0002, ***p=1.02E-06, †p=0.03, ††p=0.077, †††p=8.39E-05. NS, not significant.
Figure 6—figure supplement 1
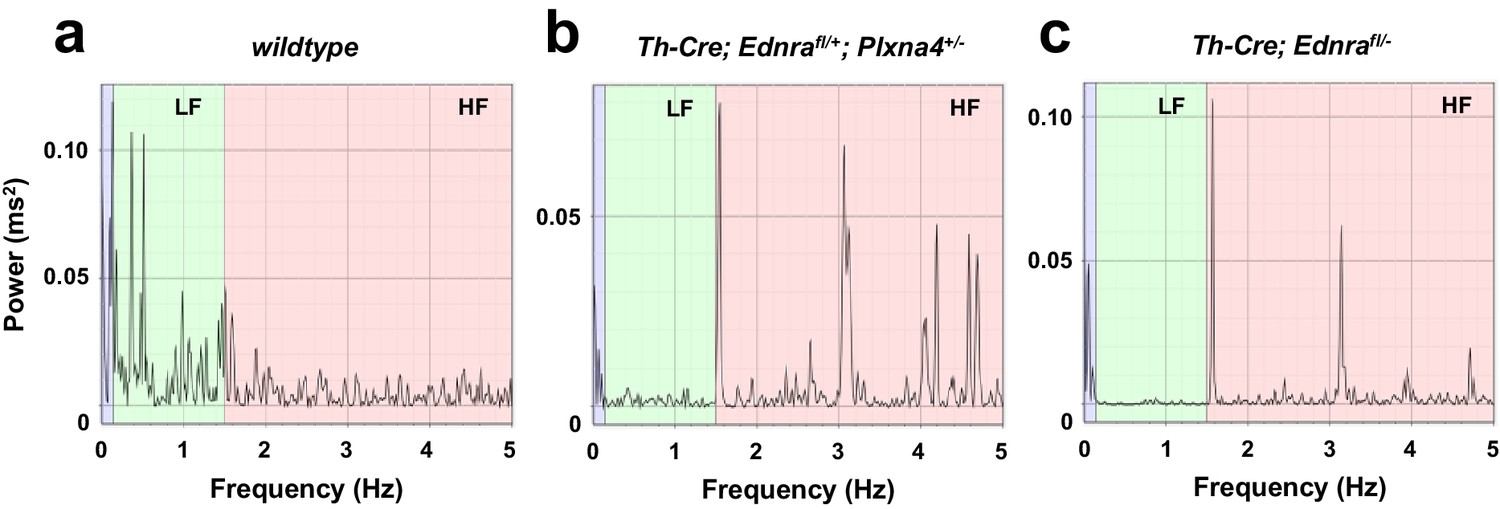
Reduced baseline sympathetic activity in Ednra-Plxna4 trans-heterozygous heart.
(a–c) Power spectrum plots of baseline heart rate fluctuation in Th-Cre; Ednrafl/+; Plxna4+/- (b), Th-Cre; Ednrafl/- (c) mutants, and a littermate control (a). The cardiac interbeat intervals in very-low-frequency (0–0.15 Hz; purple), low-frequency (0.15–1.5 Hz; green), and high-frequency (1.5–5 Hz; pink) domains demonstrate that sympathetic nerve activity drives the interval spectrum towards the low frequency component in wildtype (a), whereas reduced sympathetic nerve inputs shift the spectrum to the high-frequency domain in Th-Cre; Ednrafl/+; Plxna4+/- (b) and Th-Cre; Ednrafl/- (c) mutants.
Figure 7

Normal SCG axonal projections along the external carotid arteries in Ednra-Plxna4 trans-heterozygotes.
(a–h) Transverse sections from E14.5 Ednra+/-; Plxna4+/- (b, f), Plxna4-/- (c, g), Ednra-/- (d, h) mutant embryos and a littermate control embryo at the level of carotid artery bifurcation (a–d) and the upper larynx (e–h) stained with Th showing sympathetic axons from the SCG extending along the external carotid artery in the trans heterozygote. Black arrows point to normal projections of SCG axons along the external carotid arteries (e, f). Red arrows indicate ectopic (random) sprouts from the SCG in Plxna4-/- mutant embryo (c). Arrowheads denote reduced or defective SCG projections along the external carotid arteries (d, g–h). eca, external carotid artery; ica, internal carotid artery; scg, superior cervical ganglion. Scale bar, 100 μm (a–h).
Figure 8 with 1 supplement

Ednra-deficient STGs show reduced repulsive response to Sema3a in vitro.
(a–h) Neurite outgrowth from explanted STG co-cultured with COS cell aggregates were visualized by whole mount Th staining. STG dissected from E14.5 embryos of the genotypes indicated at left were cultured in the proximity of untransfected-COS cell aggregates (a–d) or in between untransfected and Ad-GFP-2A-mSema3a- transfected-COS cell aggregates (e–h). Sema3a expression of transfected-COS cell aggregates are confirmed by GFP expression (green; e–h). The repulsive effect was measured by neurite outgrowth length towards the untransfected-COS aggregate as positive numbers and towards Sema3a-transfected-COS aggregates as negative numbers, as indicated in (i). To control for experimental variation, the distance between the STG and the COS aggregates (d1) was defined as 1.0 or −1.0 and each neurite outgrowth length toward either COS aggregate (d2) was normalized as a relative value (d). (j) A compiled dot-whisker plot representation of the repulsive response of STG to Sema3a. Each dot represents the averaged neurite outgrowth from each STG towards untransfected-COS (grey dots) or Sema3a-transfected-COS (green dots) aggregates in each experimental culture. The number of experimental replicates for each STG genotype is as indicated, and analysis includes the total counts of 98 wildtype, 31 Ednra+/-, 24 Plxna4+/-, 91 Ednra+/-; Plxna4+/-, 102 Ednra-/-, 57 Th-Cre/Ednra and 51 Plxna4-/- STG neurites. *p=5.93E-08, **p=7.12E-10, ***p=3.48E-08, ****p=4.97E-07.
Figure 8—figure supplement 1
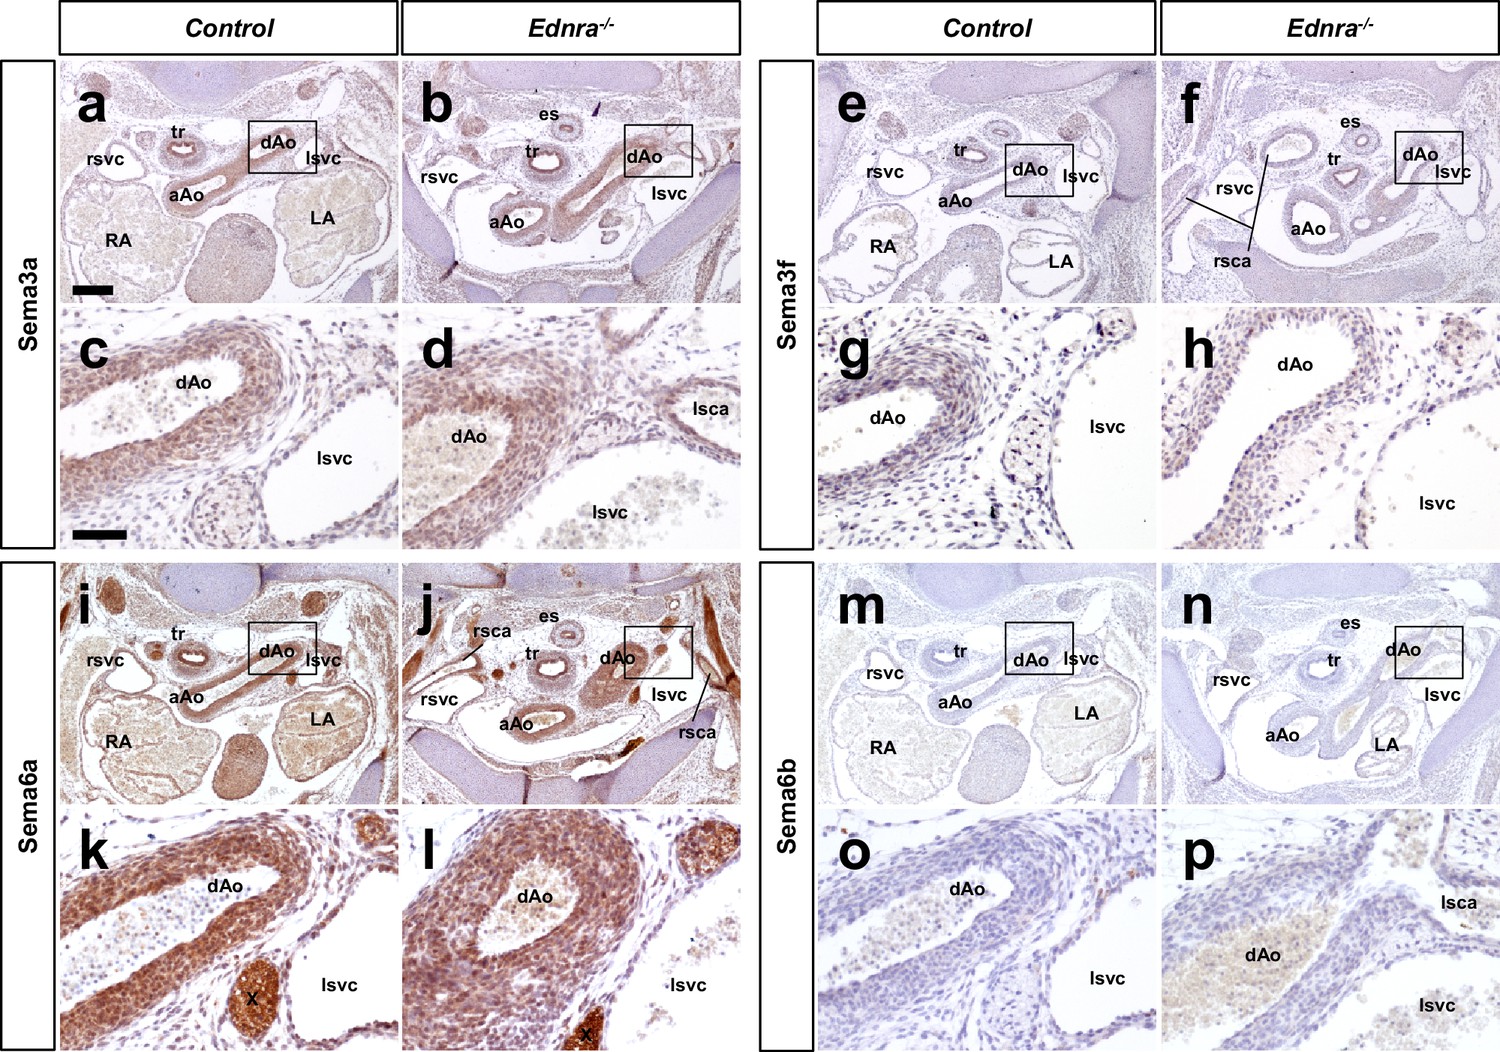
Semaphorins are expressed in arteries but not veins.
(a–h) Transverse sections from an E14.5 Ednra-/- mutant (b, f, j, n) and littermate control (a, e, i, m) embryos at the thoracic levels stained with Sema3a (a–b), Sema3f (e–f), Sema6a (i–j) and Sema6b (m–n) that are known to serve as ligands for Plxna4. High magnification views of bracketed areas are shown in (c–d), (g–h), (k–l), and (o–p), respectively. Scale bars, 200 μm (a–b, e–f, i–j, m–n), 50 μm (c–d, g–h, k–l, o–p).
Figure 9
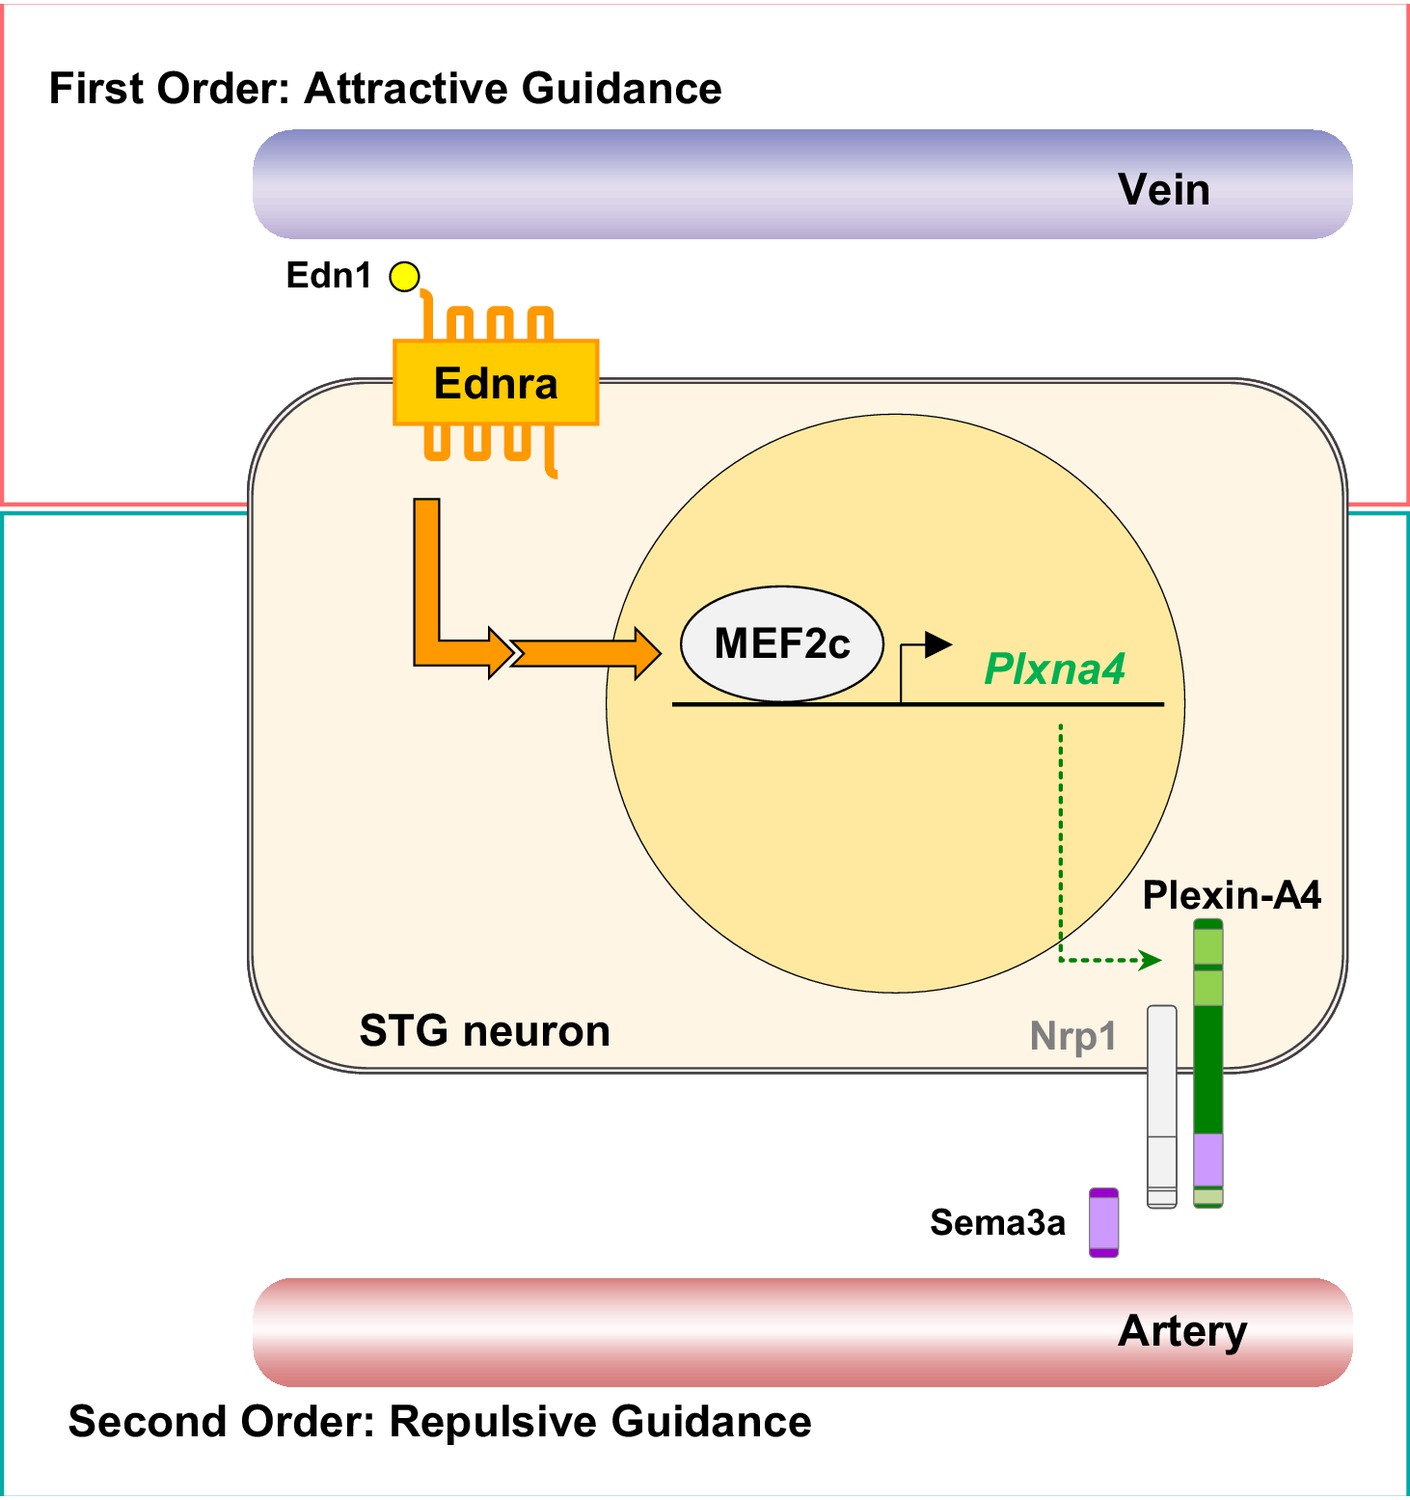
A model of second-order axon guidance for cardiac sympathetic axons.
An Ednra-expressing STG neuron located in the vicinity of distinct vascular trajectories (vein and artery) sees venous-derived endothelin as a primary attractive guidance cue and initiates axonal extension toward the vein (First Order). Endothelin (Edn1-Ednra) signaling induces MEF2C transcription factor binding to MEF2C response element(s) in the Plxna4 gene promoter to upregulate expression of Plxna4 gene in venous-associated Ednra+ STG neurons. Plexin-A4 then serves as a repulsive guidance receptor for arterial Sema3a (Second Order), which further restricts endothelin-dependent axonal extension along the venous routes by keeping Ednra+ axons from being attracted toward arterial trajectories.
Tables
Key resources table
| Reagent type (species) or resource | Designation | Source or reference | Identifiers | Additional information |
|---|---|---|---|---|
| Genetic reagent (M. musculus) | Ednrafl, ETAflox | PMID: 14585980 | MGI:2687362, RRID:IMSR_RBRC06323 | |
| Genetic reagent (M. musculus) | MEF2Cfl, Mef2cloxP | PMID: 17336904 | MGI:3718323 | |
| Genetic reagent (M. musculus) | Edn1-, EdnRA-, ET-1- | PMID: 8152482 | MGI:1857637 | |
| Genetic reagent (M. musculus) | Ece1-, ECE-1 - | PMID: 9449665 | MGI:2158947, RRID:IMSR_RBRC06166 | |
| Genetic reagent (M. musculus) | Plxna4-, PLA4 KO, PlexinA4- | PMID: 15721238 | MGI:3579185, RRID:MMRRC_030407-MU | |
| Genetic reagent (M. musculus) | ThCre, Th::Cre | PMID: 1785595 | MGI:5607431, RRID:MMRRC_029177-UCD | |
| Genetic reagent (M. musculus) | Wnt1Cre, Tg(Wnt1-cre/Esr1)10Rth | PMID: 9843687 | MGI:2447684 | |
| Cell line (Cercopithecus aethiops) | COS-7 | ATCC | CRL-1651, RRID: CVCL_0224 | LOT: 5784927 Originally tested negative for Mycoplasma, Bacterial and fungal contamination (purchase date:6/30/2016). Cells have not independently authenticated for each passage used for experiments and data collection. Cells were not independently tested for mycoplasma contamination. |
| Antibody | Sheep polyclonal anti-Tyrosine Hydroxylase | Millipore | AB1542, RRID:AB_90755 | IHC (1:400) |
| Antibody | Rabbit polyclonal anti-Plexin A4 | Novus Biological | MBP1-85128, RRID:AB_11013411 | IHC (1:400) |
| Antibody | Rabbit polyclonal anti-Semaphorin 3A | Abcam | ab23393, RRID: AB_447408 | IHC (1:300) |
| Antibody | Rabbit polyclonal anti-Semaphorin 3F | Abcam | an203394, RRID:AB_2783521 | IHC (1:500) |
| Antibody | Rabbit polyclonal anti-Semaphorin 6A | Abcam | ab72369 | IHC (1:200) |
| Antibody | Mouse monoclonal anti-Semaphorin 6B | SCBT | sc-390928, RRID:AB_2783522 | IHC (1:200) |
| Antibody | Rabbit polyclonal anti-HCN4 | Abcam | ab69054, RRID: AB_1861080 | IHC (1:500) |
| Antibody | Mouse monoclonal anti-SYP | SCBT | sc-17750, RRID: AB_628311 | IHC (1:500) |
| Recombinant DNA reagent | Ad-GFP-2A-mSema3A | VectorBio | ADV-271580 | |
| Sequence-based reagent | qRT-PCR primers (hprt) | primer bank ID: 7305155a1 | ||
| Sequence-based reagent | qRT-PCR primers (nrp1) | primer bank ID: 6679134a1 | ||
| Sequence-based reagent | qRT-PCR primers (plxna3) | primer bank ID: 667939a1 | ||
| Sequence-based reagent | qRT-PCR primers (plxna4) | primer bank ID: 28461143a1 | ||
| Commercial assay or kit | RNaseOUT | Thermofisher | 10777019 | |
| Commercial assay or kit | Trizol LS | Thermofisher | 10296028 | |
| Commercial assay or kit | RNeasy Micro Kit | Qiagen | 74004 | |
| Commercial assay or kit | Ovation RNA-Seq System V2 | NuGEN | ||
| Commercial assay or kit | Encore Rapid Library System | NuGEN | ||
| Chemical compound, drug | amphetamine | Sigma A5880 | ||
| Chemical compound, drug | isoproterenol | Sigma I6504 | ||
| Chemical compound, drug | propranolol | Sigma P0884 | ||
| Software, algorithm | Fiji - Image J | https://imagej.net/Fiji | RRID:SCR_003070 | |
| Software, algorithm | CASAVA (v1.8.2) | Illumina | RRID:SCR_001802 | |
| Software, algorithm | tophat v1.3 | Trapnell et al. (2009) | doi:10.1093/ bioinformatics/btp120 | |
| Software, algorithm | U-Seq version 8.0.2 | Nix et al. (2008) | doi:10.1186/1471 -2105-9-523 | |
| Software, algorithm | LabChart 8 | AD Instruments | RRID:SCR_001620 |
Additional files
-
Transparent reporting form
- https://doi.org/10.7554/eLife.42528.014
Download links
A two-part list of links to download the article, or parts of the article, in various formats.
Downloads (link to download the article as PDF)
Open citations (links to open the citations from this article in various online reference manager services)
Cite this article (links to download the citations from this article in formats compatible with various reference manager tools)
Venous endothelin modulates responsiveness of cardiac sympathetic axons to arterial semaphorin
eLife 8:e42528.
https://doi.org/10.7554/eLife.42528


