Circular synthesized CRISPR/Cas gRNAs for functional interrogations in the coding and noncoding genome
- Goethe University Frankfurt - Medical Faculty, University Hospital, Germany
- Goethe University, Germany
- Fraunhofer Institute for Molecular Biology and Applied Ecology IME, Germany
- University of California, San Diego, United States
- Frankfurt Cancer Institute, Germany
- Cardio-Pulmonary Institute, Germany
Figures
Figure 1 with 1 supplement

The 3Cs technology - covalently-closed-circular-synthesized (3Cs) CRISPR/Cas gRNA reagents.
(A) The general 3Cs workflow. The individual steps of the protocol (grey arrows), time requirements (on top of arrow) and used or expected DNA yields (below arrow) are highlighted. Time requirements are separated by total versus hands-on time (grey scaled bars). Please note that the protocol contains two possible break points (red stop signs) at which purified phages can be stored at 4°C (break point #1) or bacterial pellets/purified plasmid DNA can be stored at −20°C (break point #2). In more detail, f1-origin containing double-stranded CRISPR/Cas plasmids are converted to dU-containing circular ssDNA. Guide RNA sequence (orange triangle) containing oligonucleotides (orange arrows) are annealed to ssDNA, and extended and ligated by T7 DNA polymerase and T4 ligase, respectively. Heteroduplex dU-3Cs-DNA is transformed into base-excision-repair-sufficient bacteria to deplete template DNA (grey strand) and to amplify the newly synthesized DNA (orange) selectively. (B) Lentiviral CRISPR/Cas plasmids (pLentiGuide, pLentiCRISPRv2) and the mammalian cDNA expression plasmid pcDNA3 (positive control) were converted to dU-containing circular ssDNA and analyzed by gel electrophoresis. Although identical in size, circular ssDNA appears as a single band and migrates faster than the corresponding dsDNA form. (C) The lentiviral circular ssDNA of panel (B) was annealed with a pool of six oligonucleotides, encoding six GFP-targeting gRNAs, to generate a pool of 3Cs-dsDNA and analyzed by gel electrophoresis. A successful 3Cs in vitro reaction is indicated by three distinct 3Cs-dsDNA product bands (Huang et al., 2012). (D) Bar graph showing the degree of template remnants in the final 3Cs products in the presence and absence of additional Uridine in the phage culture medium as well as an I-SceI clean-up step. The gRNA libraries from panel (C) were sequenced by NGS before and after I-SceI restriction enzyme digest. Although the effect of Uridine is marginal, an enzymatic digest with I-SceI removes template plasmid remnants. (E, F) gRNA distribution displayed as raw read count data points (E) and normalized values in box plot format (F). The coefficient of variation was calculated by dividing the standard deviation by the mean of the library’s read counts and is displayed as percentage above the box plot (F). Data were derived from the NGS data shown in panel (D). The final GFP-targeting 3Cs-gRNA library is free of sequence bias, as demonstrated by the low coefficient of variation of 33.18%, and by the uniform sequence distribution ((E), also see Figure 1—figure supplement 1H). (G) GFP-expressing hTERT–RPE1 cells were transduced with lentiviral 3Cs-gRNA constructs (non-targeting control gRNA (non-human target sequences (NHT)), a single GFP-targeting 3Cs-gRNA (GFP#1) or a pool of six GFP-targeting 3Cs-gRNAs (GFP#1–6)), and selected with puromycin before GFP gene editing was analyzed by T7 endonuclease I assay (Guschin et al., 2010). Individual band intensities were quantified (black numbers). An empty control (–) served as the reference. (H) A dose-dependent reduction of GFP fluorescence was determined by the flow cytometry of GFP-expressing hTERT–RPE1 cells and transduced with increasing volumes of lentiviral supernatant containing a pool of six GFP-targeting 3Cs-gRNAs (GFP#1–6). Error bars represent standard deviations (SDs) over three biological replicates (n = 3). (I) Immunoblot analysis of hTERT–REP1 cells treated as in panel (G) demonstrates that GFP-targeting 3Cs-gRNAs induce a 3- to 4-fold reduction in total GFP protein levels over three biological replicates (n = 3, for quantification see also Figure 1—figure supplement 1I).
Figure 1—figure supplement 1
Determining 3Cs parameters, I-SceI template remnant removal, and the GFP library.
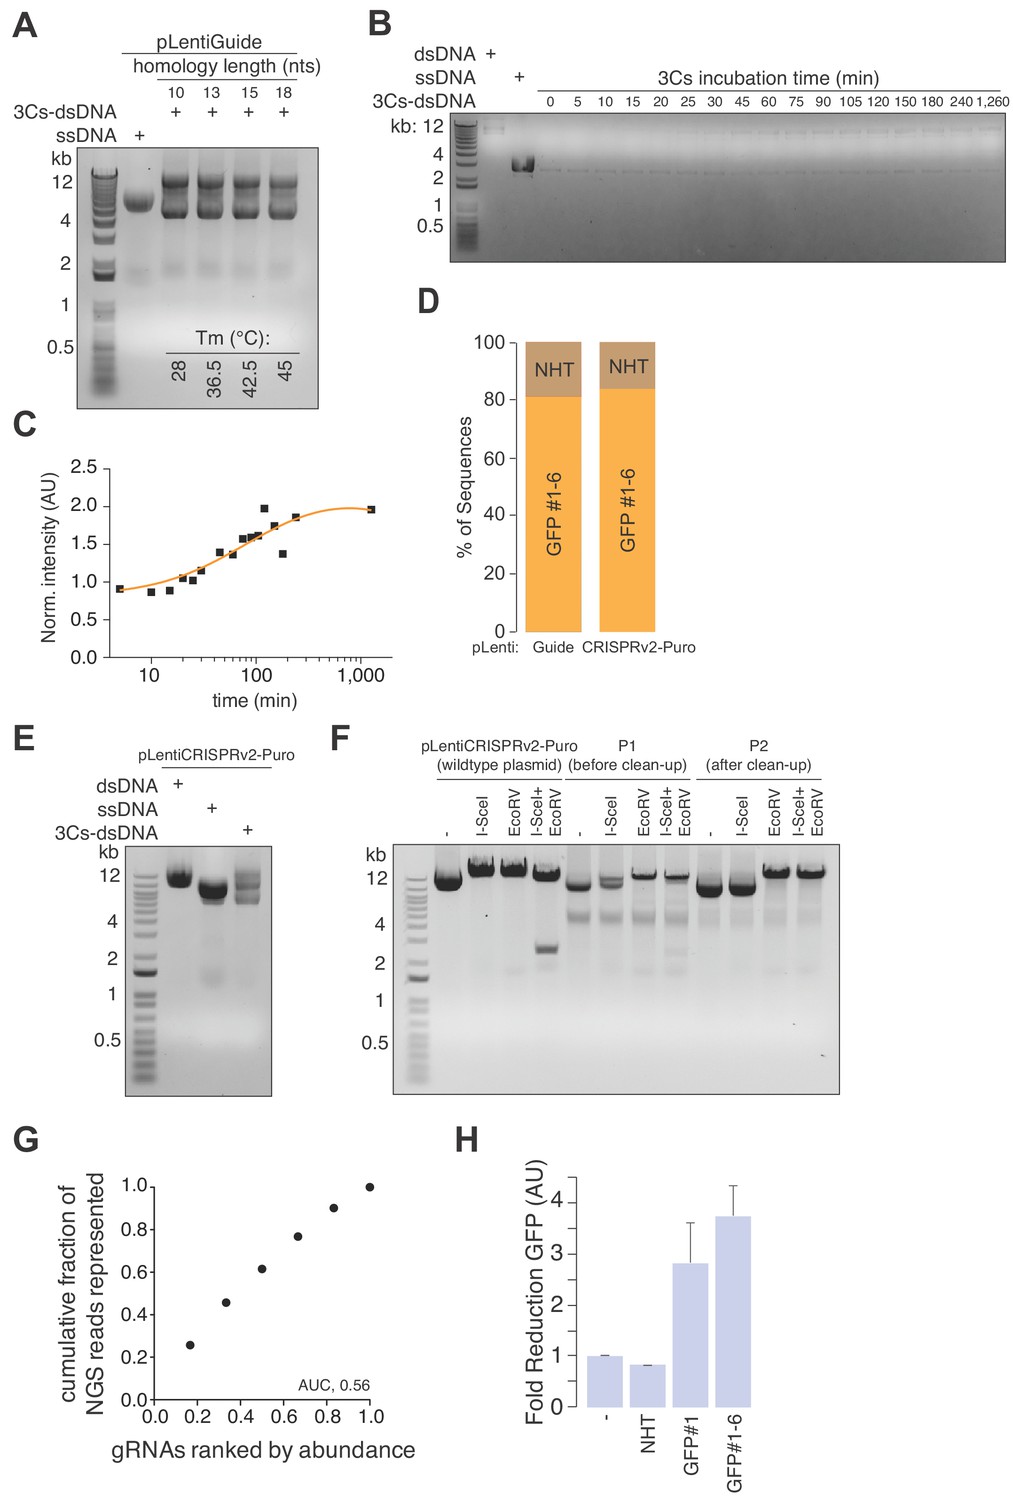
(A) Lentiviral circular ssDNA of pLentiGuide was annealed with gRNA-encoding oligonucleotides of increasing homology (5′ and 3′, 10 to 18 nucleotides (nts)) and annealing temperatures (28°C to 45°C) to produce 3Cs-dsDNA, which was analyzed by gel electrophoresis. (B, C) 3Cs-dsDNA was generated efficiently within a few hours of incubation. Lentiviral circular ssDNA of pLentiGuide was annealed with a single oligonucleotide (18 nts, 45°C) to produce 3Cs-dsDNA. Individual time points were collected by removing 2 µl of the reaction mixture and transferring them to −20°C before all samples were analyzed by gel electrophoresis (B). To visualize the kinetics of 3Cs reactions, 3Cs-dsDNA band intensities were determined and normalized to time point 0 before plotting against the time of their harvest, revealing (C) time-dependent 3Cs-dsDNA generation. Overnight 3Cs reactions have been performed routinely, but 2 hr of incubation time is sufficient. (D) 3Cs-dsDNA generated on templates pLentiGuide and plentiCRISPRv2-Puro with a pool of six GFP-targeting gRNA oligonucleotides was transformed and individual colonies were analyzed by SANGER sequencing to identify template remnants (NHT) and gRNA-containing (GFP#1–6) plasmids. (E–F) Removal of template remnants with an I-SceI restriction digest. Circular ssDNA of pLentiGuide containing an I-SceI restriction site as a gRNA placeholder sequence was annealed with a pool of six GFP-targeting gRNA oligonucleotides for 3Cs-dsDNA generation (E). Template remnant removal by I-SceI digest (F). (G) NGS data derived from Figure 1D were used to generate Lorenz curves and to determine the area under the curve (AUC). The AUC value of 0.56 indicates a uniform distribution of GFP-targeting gRNA sequences. (H) Bar graph showing the reduction of immunoblot GFP–protein intensities related to Figure 1I. Error bars represent the standard deviation over two biological replicates (n = 2).
Figure 2 with 1 supplement
3Cs is a robust technology that uncouples sequence diversity from sequence distribution.
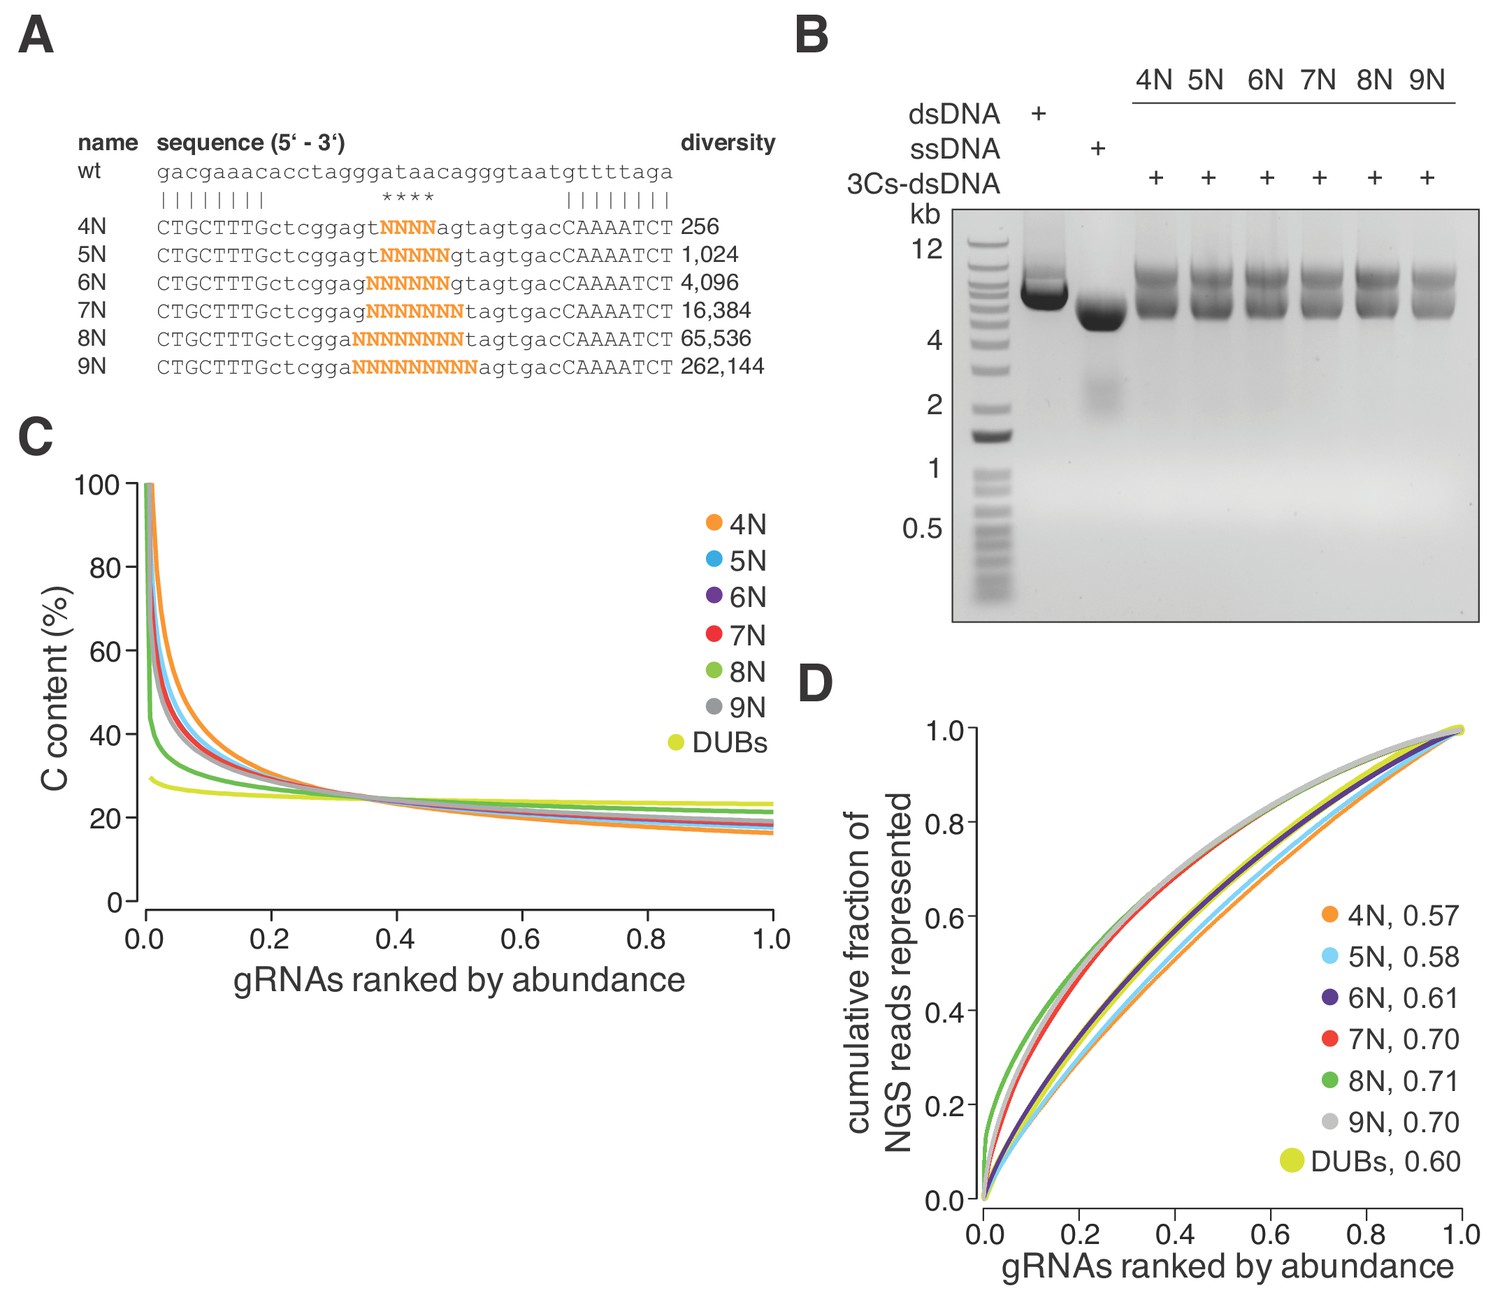
(A) To determine the sequence distribution of 3Cs-gRNA libraries with increasing gRNA diversity, an increasing number of randomized nucleotides (orange) were incorporated into 3Cs oligonucleotides to mimic gRNA diversities ranging from 256 to 262,144 sequences (4–9N libraries). A range of four to nine randomized nucleotides (orange) were introduced into an NHT gRNA sequence. Randomization of the central nucleotides ensures the replacement of the template I-SceI restriction site in order to prevent the digestion of correctly synthesized 3Cs synthesis products. (B) The 3Cs synthesis products of the combination of randomized primers and pLentiGuide were resolved by gel electrophoresis. (C) The Scatter plot displays ranked gRNA abundances per library against the gRNA cytosine content (C). The gRNA libraries that are shown are derived from (A) and (B) and the library with gRNAs targeted against DUBs (DUBs library). All libraries were processed by I-SceI-dependent removal of template plasmid remnants and subjected to NGS and computational analysis. Importantly, all gRNA libraries were complete, irrespective of their individual gRNA diversity. However, the partially randomized gRNA libraries displayed a strong C bias within the most abundant gRNA sequences. In fact, the top 5% of most abundant gRNAs had a C content of above 60%. The DUBs library did not show this C bias, strongly suggesting incomplete phosphoramidite mixing during oligonucleotide synthesis as the main cause of the C bias. (D) Lorenz curves displaying the cumulative fraction of represented NGS reads versus the gRNAs ranked by abundance of each partially randomized (4–9N) and nonrandomized (DUB) library revealed a uniform distribution of gRNA sequences. Area under the curve values (AUC, number next to library name) confirm the uniform gRNA distribution of these libraries and demonstrate that 3Cs uncouples sequence diversity from sequence distribution.
Figure 2—figure supplement 1
Quality control and gRNA distributions of the randomized libraries.
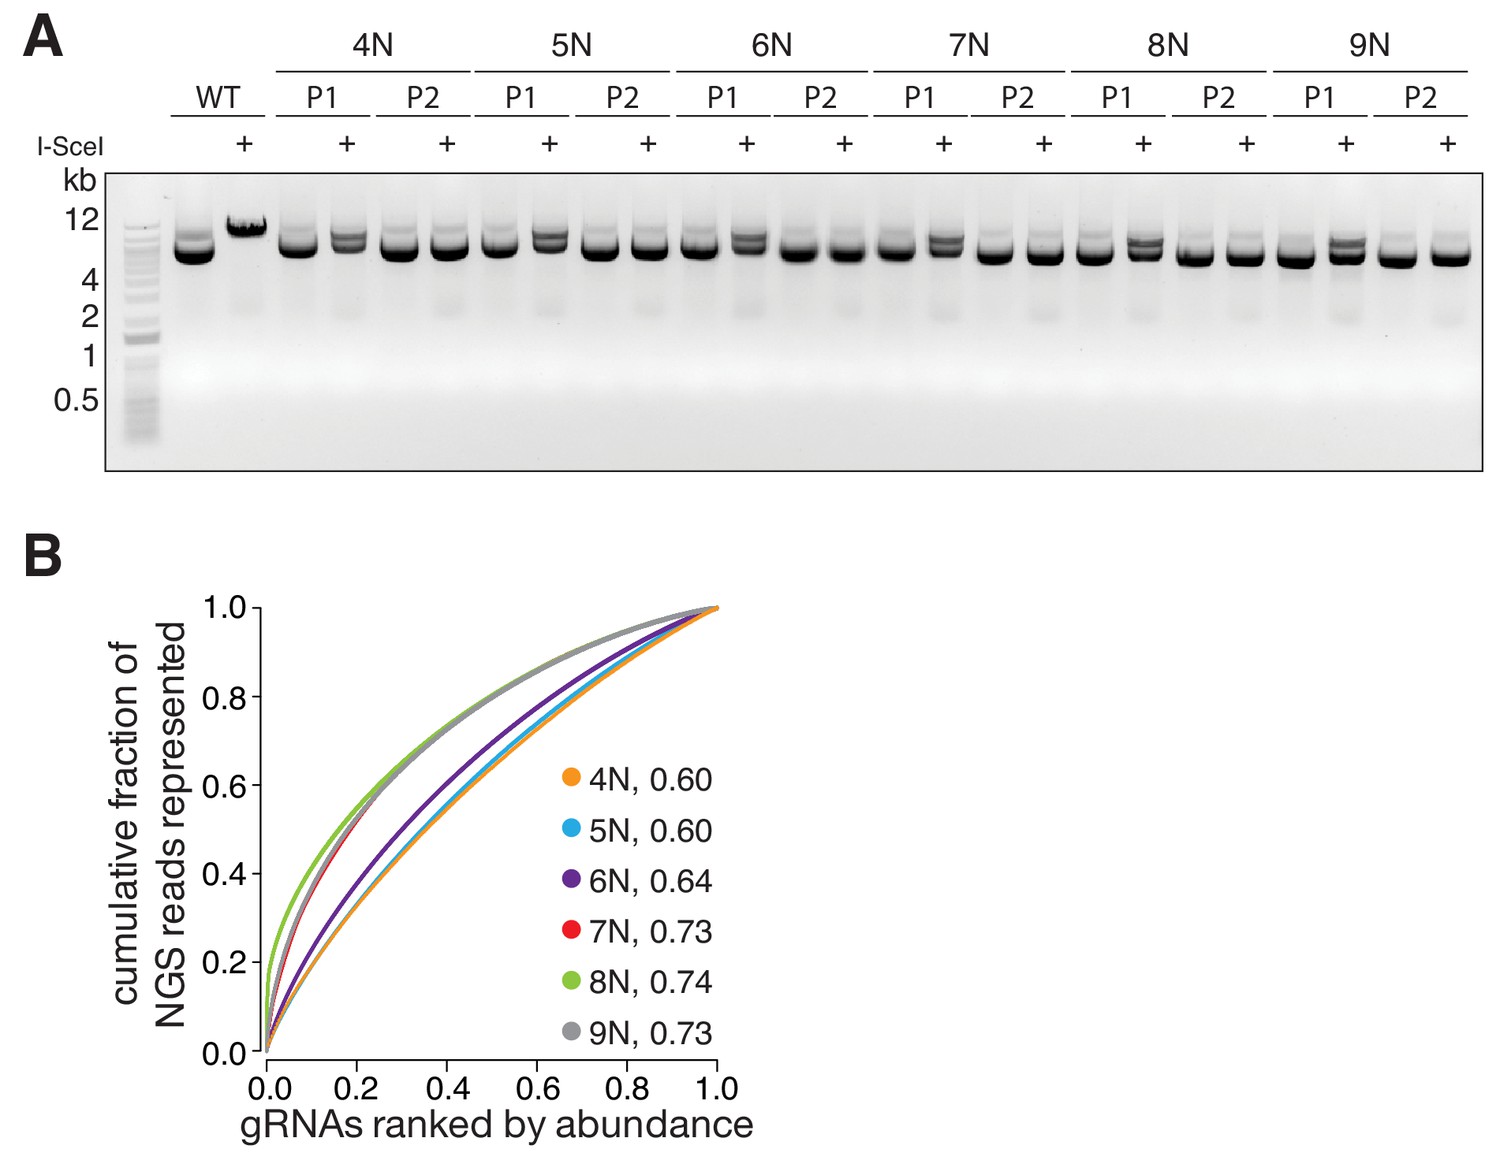
(A) Gel electrophoresis of P1 3Cs libraries, generated with randomized nucleotide positions (related to Figure 2A). Template pLentiCRISPRv2 is linearized by I-SceI digests, whereas only P1 libraries are partially I-SceI digested. P2 libraries are unaffected by I-SceI digests, demonstrating their high purity. (B) The distribution of the randomized nucleotide libraries, derived from panel (A), visualized with Lorenz curves. The AUC values indicate that 3Cs uncouples sequence distribution from sequence diversity.
Figure 3 with 3 supplements
3Cs reagents are of high fidelity — the essentiality of human DUBs for cell fitness.
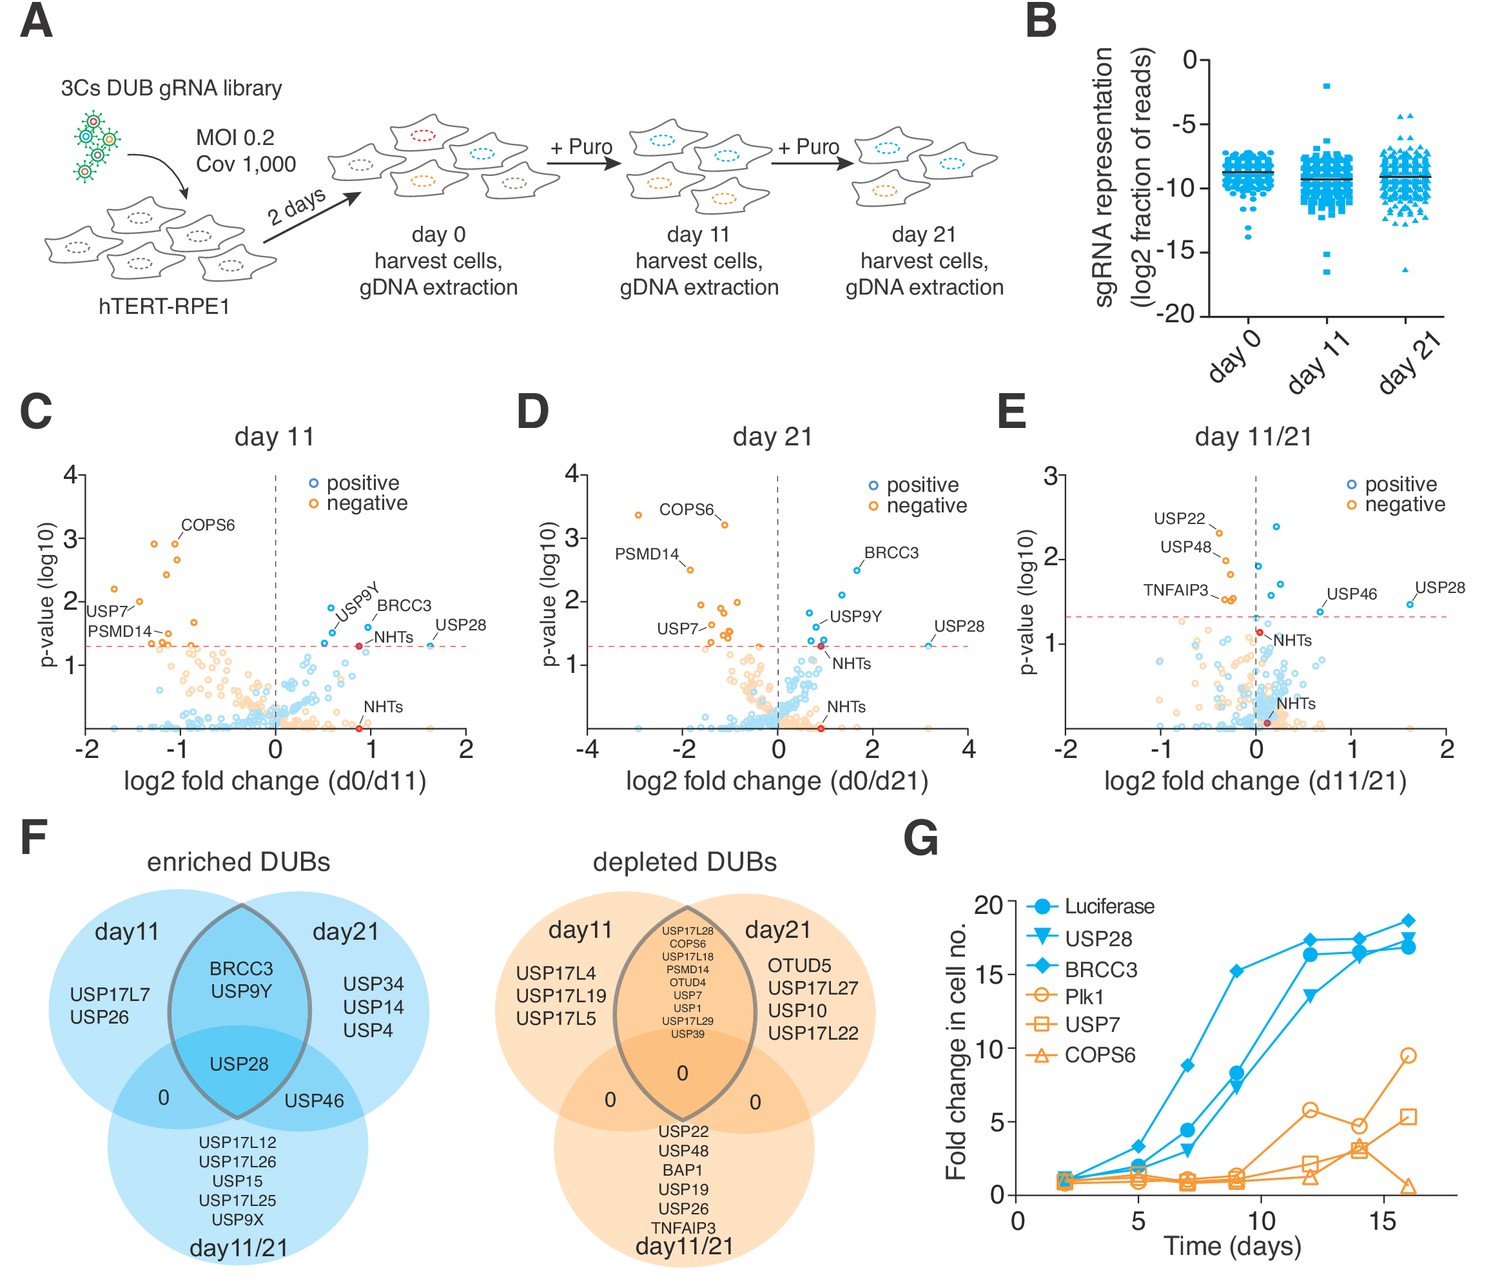
(A) Schematic of the performed CRISPR screen. Highlighted are the experimental conditions under which the screen was performed (MOI of 0.2, library coverage of 1,000). In brief, hTERT–RPE1 cells were transduced with lentivirus for 48 hr in duplicates, after which the cells of one duplicate were harvested (day 0) to extrapolate the baseline gRNA distribution. Simultaneously, cells of the second duplicate were subject to puromycin selection for 11 days, after which time all cells were harvested (day 11), counted and plated back in low density to the original library representation of 1,000-fold coverage. Plated cells remained in cycling conditions until day 21, when all cells were collected (day 21). After harvesting the cells, their genomic DNA was extracted and processed for gRNA NGS. (B) Graph showing the distribution of individual sgRNAs. Means ± standard deviation are highlighted. (C–E) Volcano plots visualizing log2-fold changes of gene phenotypes and their associated p-values. Data are derived from MAGeCK analyses, corresponding to day 11 (C), day 21 (D) and day11/21 (E). The dashed red line shows p=0.05 with points above the line having p<0.05 and points below the line having p>0.05. Data points with p>0.05 are displayed as translucent symbols. Genes of interest are highlighted. (F) Venn diagram of significantly enriched (blue) or depleted (orange) DUBs. The time point overlap visualizes DUB genes with time independent (overlap of three) and time dependent (overlap of two) proliferation phenotypes. (G) Fold increase in cell number after shRNA-mediated depletion of target genes. Data are means of duplicates.
Figure 3—figure supplement 1
The 3Cs DUB gRNA screens are highly reproducible.
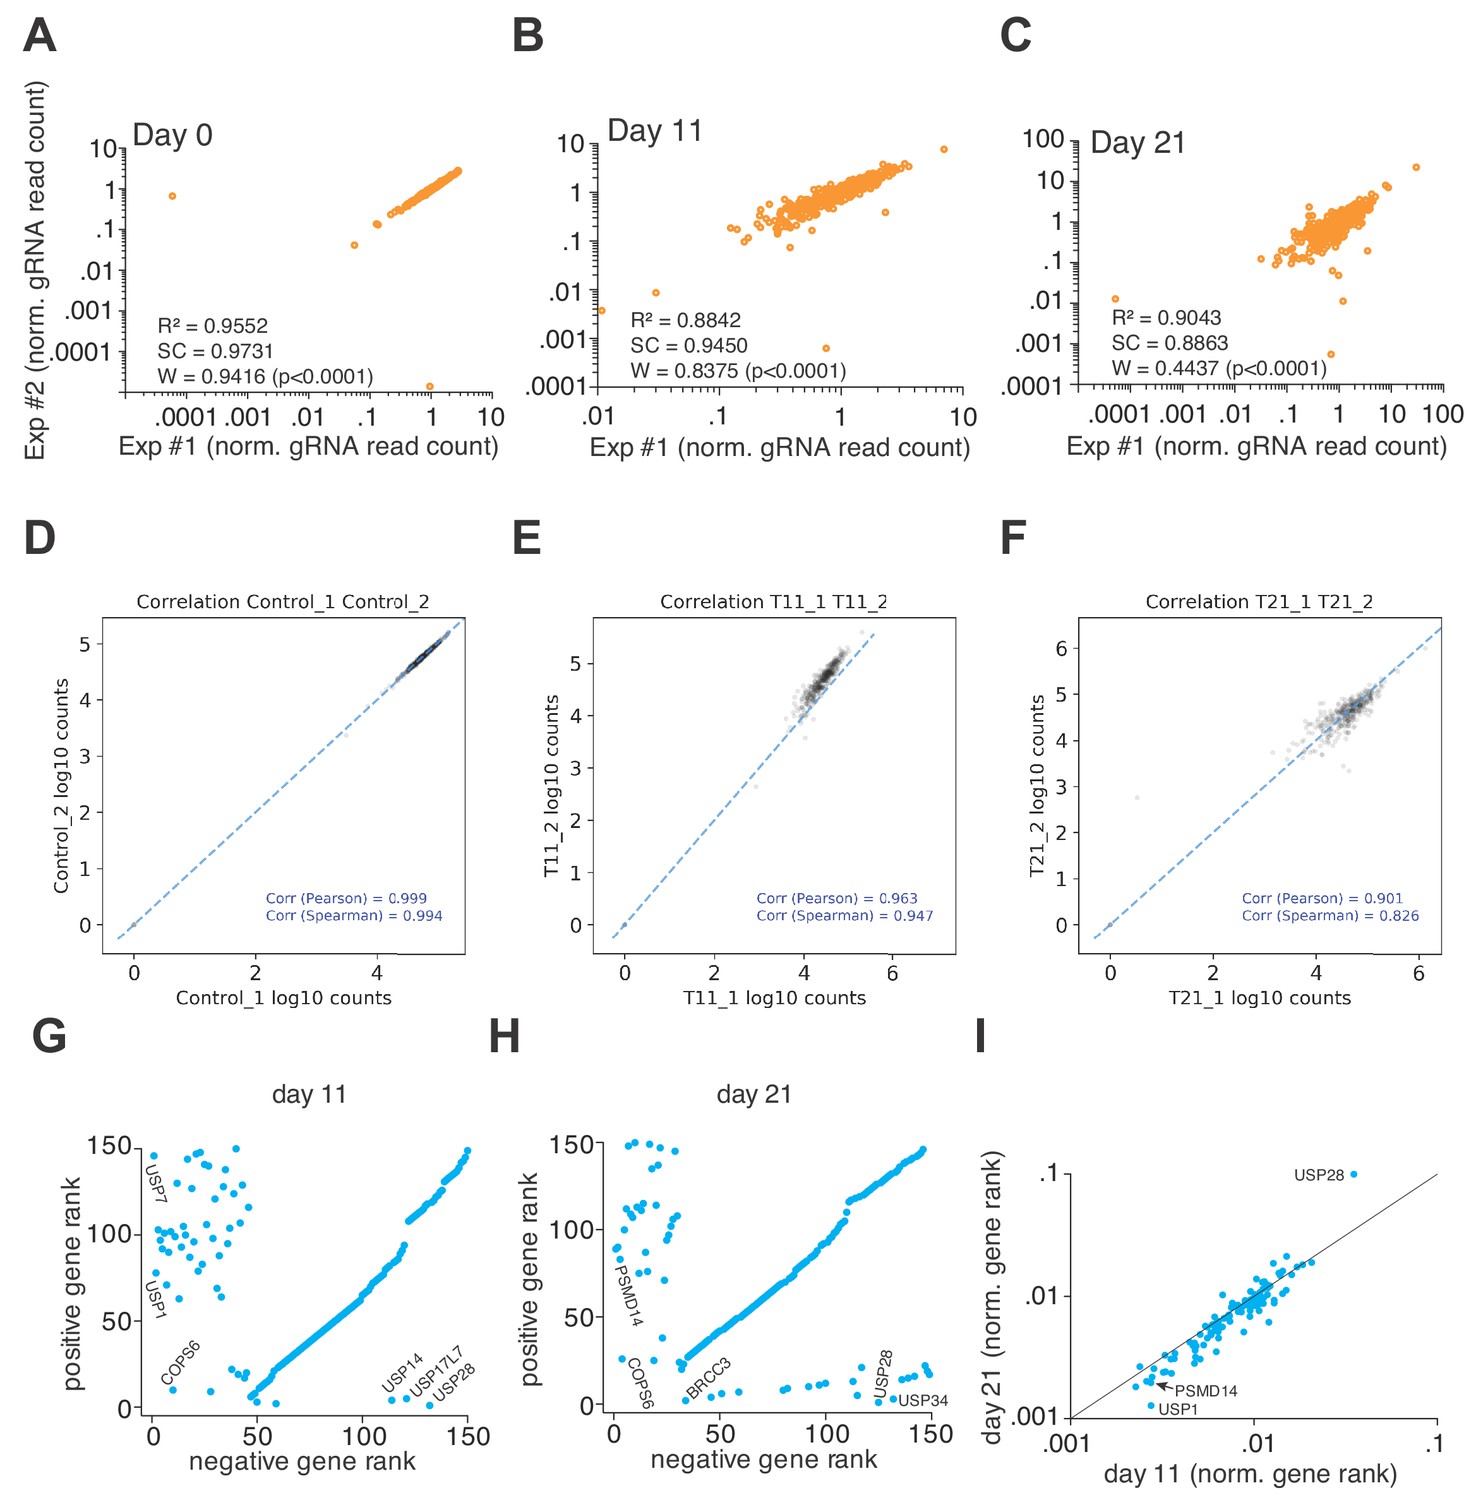
(A–C) 3Cs DUB gRNA screens are highly reproducible, as visualized by scatter plots comparing biological replicates (Exp#1/Exp#2) of normalized gRNA read counts at each time point: day 0 (A), days 11 (B) and day 21 (C). High linear regression (R2 between 0.8842 and 0.9552), spearman correlation (SC between 0.8863 and 0.9731), and Shapiro–Wilk confidence (W between 0.4437 and 0.9416), including highly significant statistical testing (p<0.0001), demonstrate high biological reproducibility. (D–F) gRNA read count tables of 3Cs DUB gRNAs were used as input for PinAPL-Py to perform positive and negative computational analyses. Experimental reproducibility is visualized by individual scatter plot at each time point: day 0 (D), day 11 (E), and day 21 (F). Please note, PinAPL-Py computes Pearson and Spearman correlations, both of which values are above 0.8 for all time points and biological replicates, demonstrating high experimental reproducibility. (G–H) Scatter plot of MAGeCK-derived positive and negative gene ranks, corresponding to data in Figure 3E. Genes of interest are highlighted. (I) Scatter plot showing normalized gene ranks at day 11 versus day 21. Data corresponding to Figure 3E.
Figure 3—figure supplement 2
3Cs facilitates the generation of shRNA libraries.
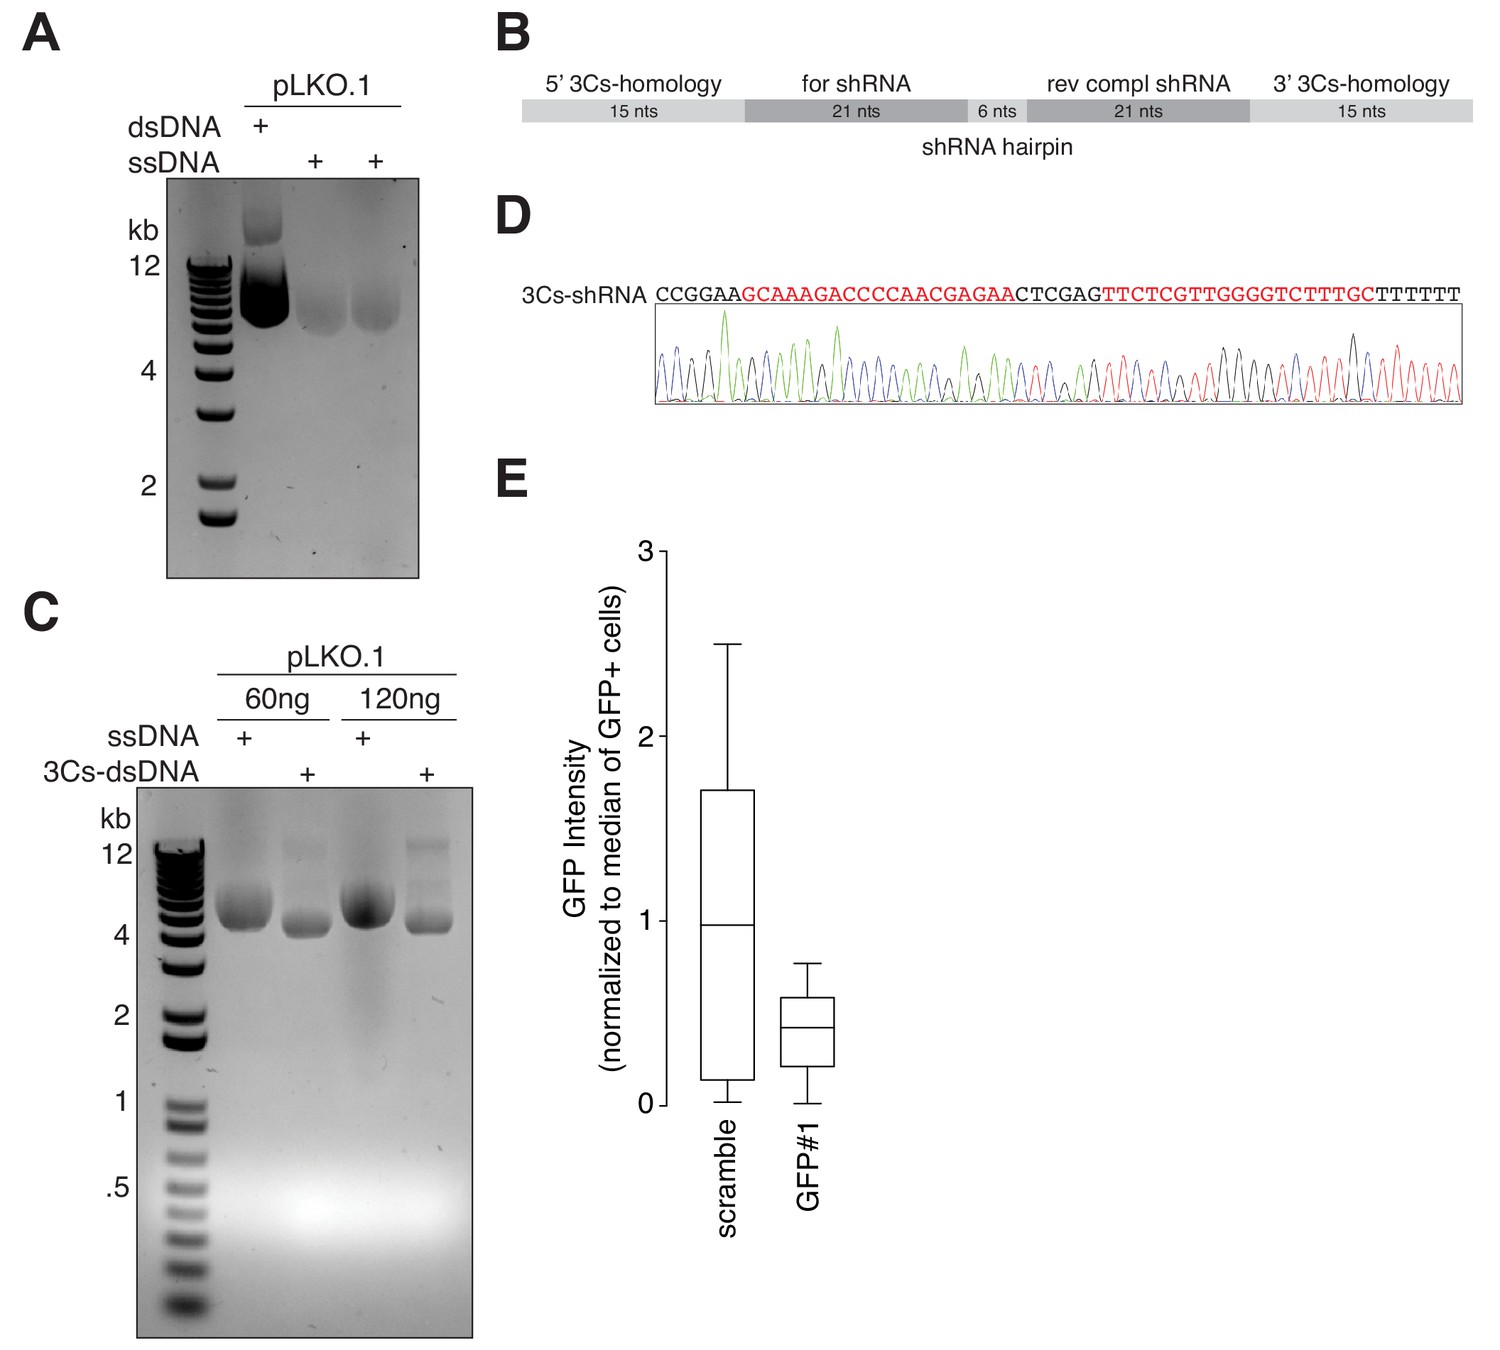
(A) Gel electrophoresis of ssDNA from the conventional shRNA-expressing lentiviral plasmid pLKO.1. (B) 3Cs-shRNA oligonucleotide design. Regions with homology to pLKO.1 are shown in light grey, whereas complementary shRNA sequences are displayed in dark grey. 3Cs-shRNAs have a length of 78 nucleotides. (C) Two different amounts of pLKO.1 circular ssDNAs (60 ng and 120 ng) were annealed with a single 3Cs-shRNA oligonucleotide, encoding a GFP-targeting shRNA, to produce 3Cs-dsDNA, which was analyzed by gel electrophoresis. (D) 3Cs-dsDNA derived as for panel (C) was amplified in E. coli. SANGER-sequencing of the amplified plasmid DNA confirmed the successful integration of the GFP-targeting shRNA sequences (highlighted in red). (E) GFP-expressing hTERT–RPE1 cells were transduced with either a scrambled or a GFP-targeting shRNA and analyzed by flow-cytometry in biological replicates (n = 2). Please note, the GFP intensity was reduced by more than 60%, indicating functionality of 3Cs-shRNA reagents.
Figure 3—figure supplement 3
A 3Cs E2 shRNA library.
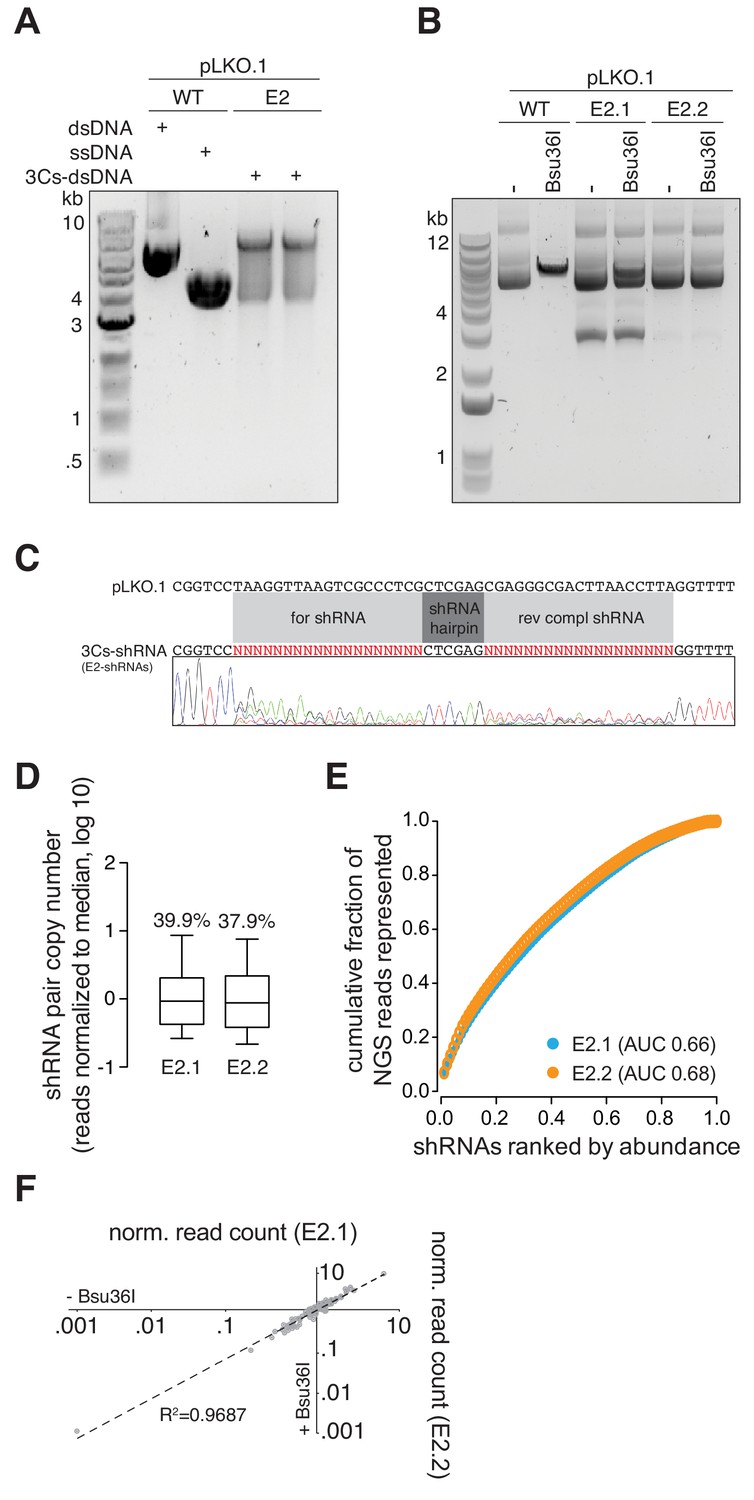
(A) A 3Cs synthesis with ssDNA template of pLKO.1 and a pool of 3Cs oligonucleotides, encoding for shRNAs targeting all human ubiquitin E2 ligases (each E2 with two shRNAs), yielded 3Cs-dsDNA that is resolved by gel electrophoresis. (B) Like 3Cs-gRNA reagents, 3Cs-shRNA reagents are subjected to the removal of template remnants by performing an initial (E2.1) and an analytical (E2.2) Bsu36I restriction enzyme digest. Please note the absence of the 3-kb DNA fragment from the E2.2 library. (C) SANGER sequencing of the final E2 3Cs-shRNA library (E2.2) confirmed a randomization of forward- and reverse-complement shRNA sequences. (D) Initial and final E2 3Cs-shRNA libraries were subjected to high-throughput sequencing. Individual shRNA distributions were displayed as a box plot with their respective coefficients of variation (CV, percent number above the box plots). (E) The distribution of both pools visualized as Lorenz curves, comparing E2.1 and E2.2. Data derived from panel (D). Importantly, while effectively removing template plasmid remnants, the Bsu36I digest does not affect the distribution of 3Cs-shRNAs. (F) Scatter plot of normalized read counts of data derived from panel (D), visualizing individual shRNA abundance before (–) and after (+) Bsu36I digest. The Pearson correlation coefficient of R2 is 0.9687, demonstrating high correlation of individual shRNA abundances and no effect of the clean-up digestion on the final distribution.
Figure 4
A truly genome-wide (TGW) CRISPR/Cas 3Cs-gRNA library to interrogate the coding and noncoding genome.
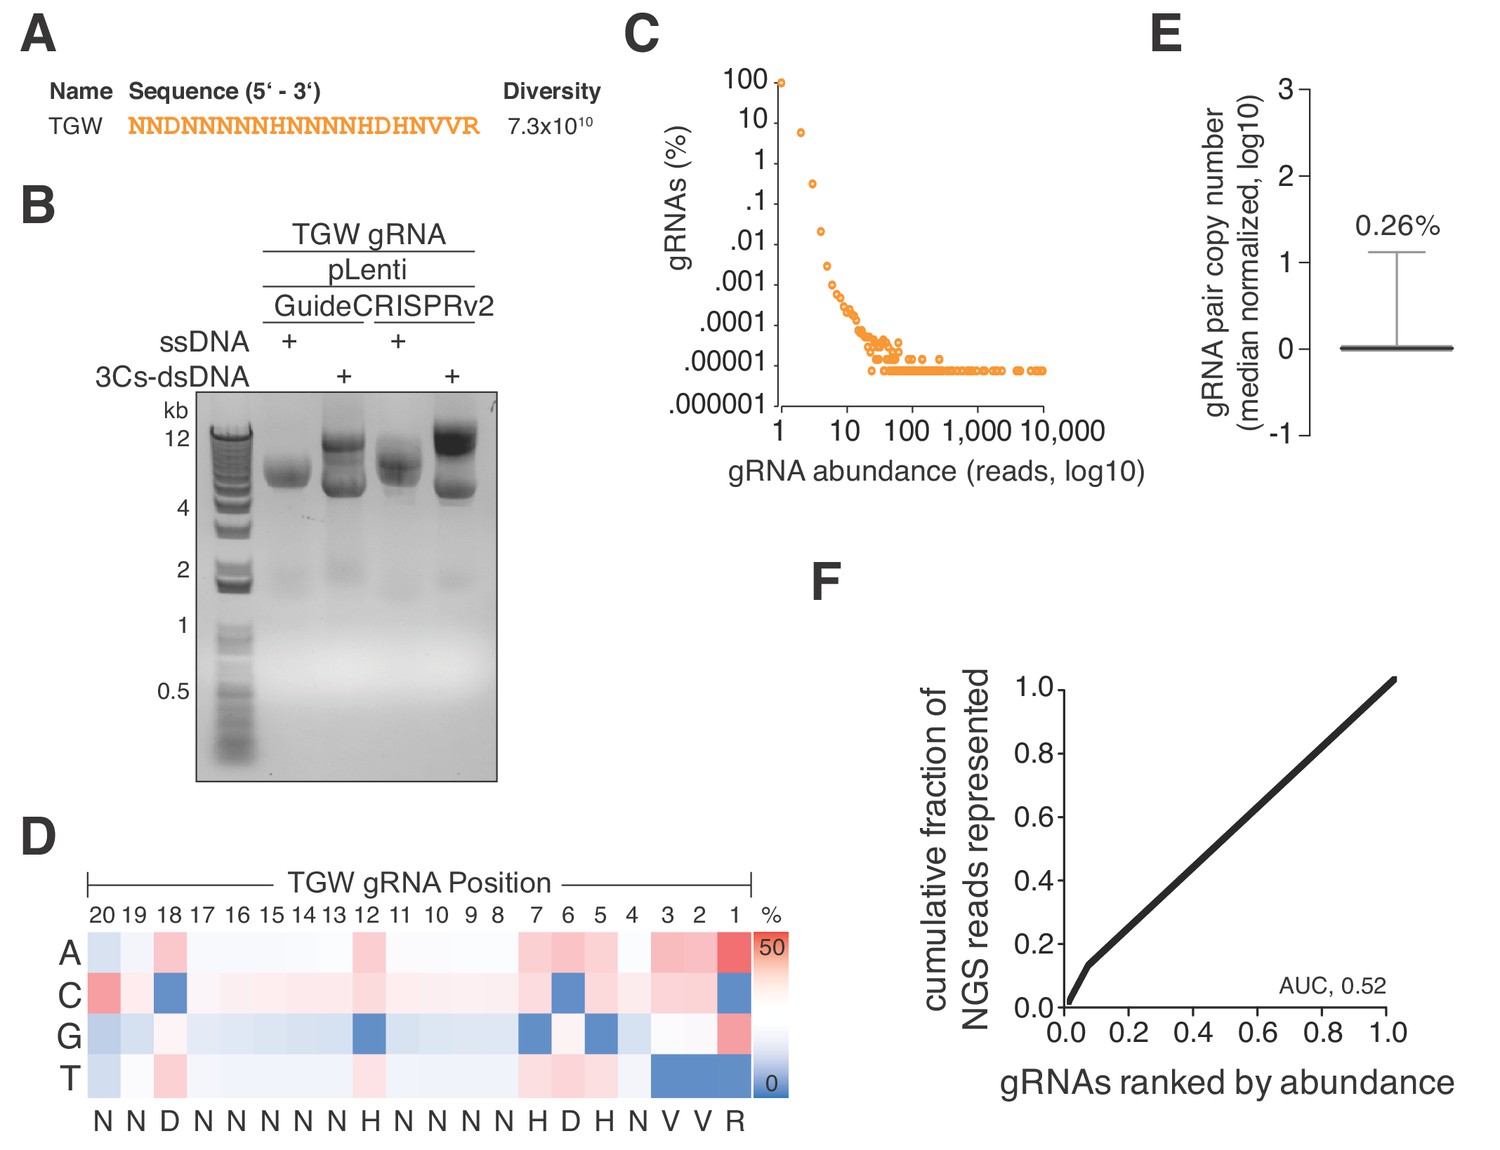
(A) Previously reported SpCas9 nucleotide preferences were translated into a degenerated oligonucleotide sequence (TGW) representing a total sequence diversity of 7.3 × 10¹⁰ (Doench et al., 2014). (B) The TGW oligonucleotide shown in panel (A) was used in a 3Cs reaction on template ssDNA derived from pLentiGuide and plentiCRISPRv2 plasmids to generate 3Cs-dsDNA, which was analyzed by gel electrophoresis. (C) Scatter plot visualizing TGW library NGS data from 14,448,469 total reads. Displayed are the log10 values of gRNA abundance (reads) against the log10 of the respective percentage of identified TGW gRNAs. 94.2% of all identified gRNAs were found only once (see also Supplementary file 9). (D) High-throughput sequencing data from panel (C) were used to compute the nucleotide frequency at each gRNA nucleotide position in order to determine the nucleotide profile of the TGW library. The identified nucleotide frequencies closely resemble the pattern of the degenerated TGW oligonucleotide from panel (A). Color code represents nucleotide frequency as indicated by the color gradient on the right. (E) Box plot of TGW gRNA distribution with data derived from panel (C). The coefficient of variation of 0.26% suggests a uniform distribution of represented sequences. (F) The gRNA distribution of the TGW library as derived from panel (C) plotted as a Lorenz curve. TGW NGS data derived from pane; (C). The area under the curve (AUC) of 0.52 suggests a uniform distribution of gRNA sequences.
Figure 5 with 2 supplements
TGW-based identification of coding and noncoding sequences that are associated with doxorubicin resistance.
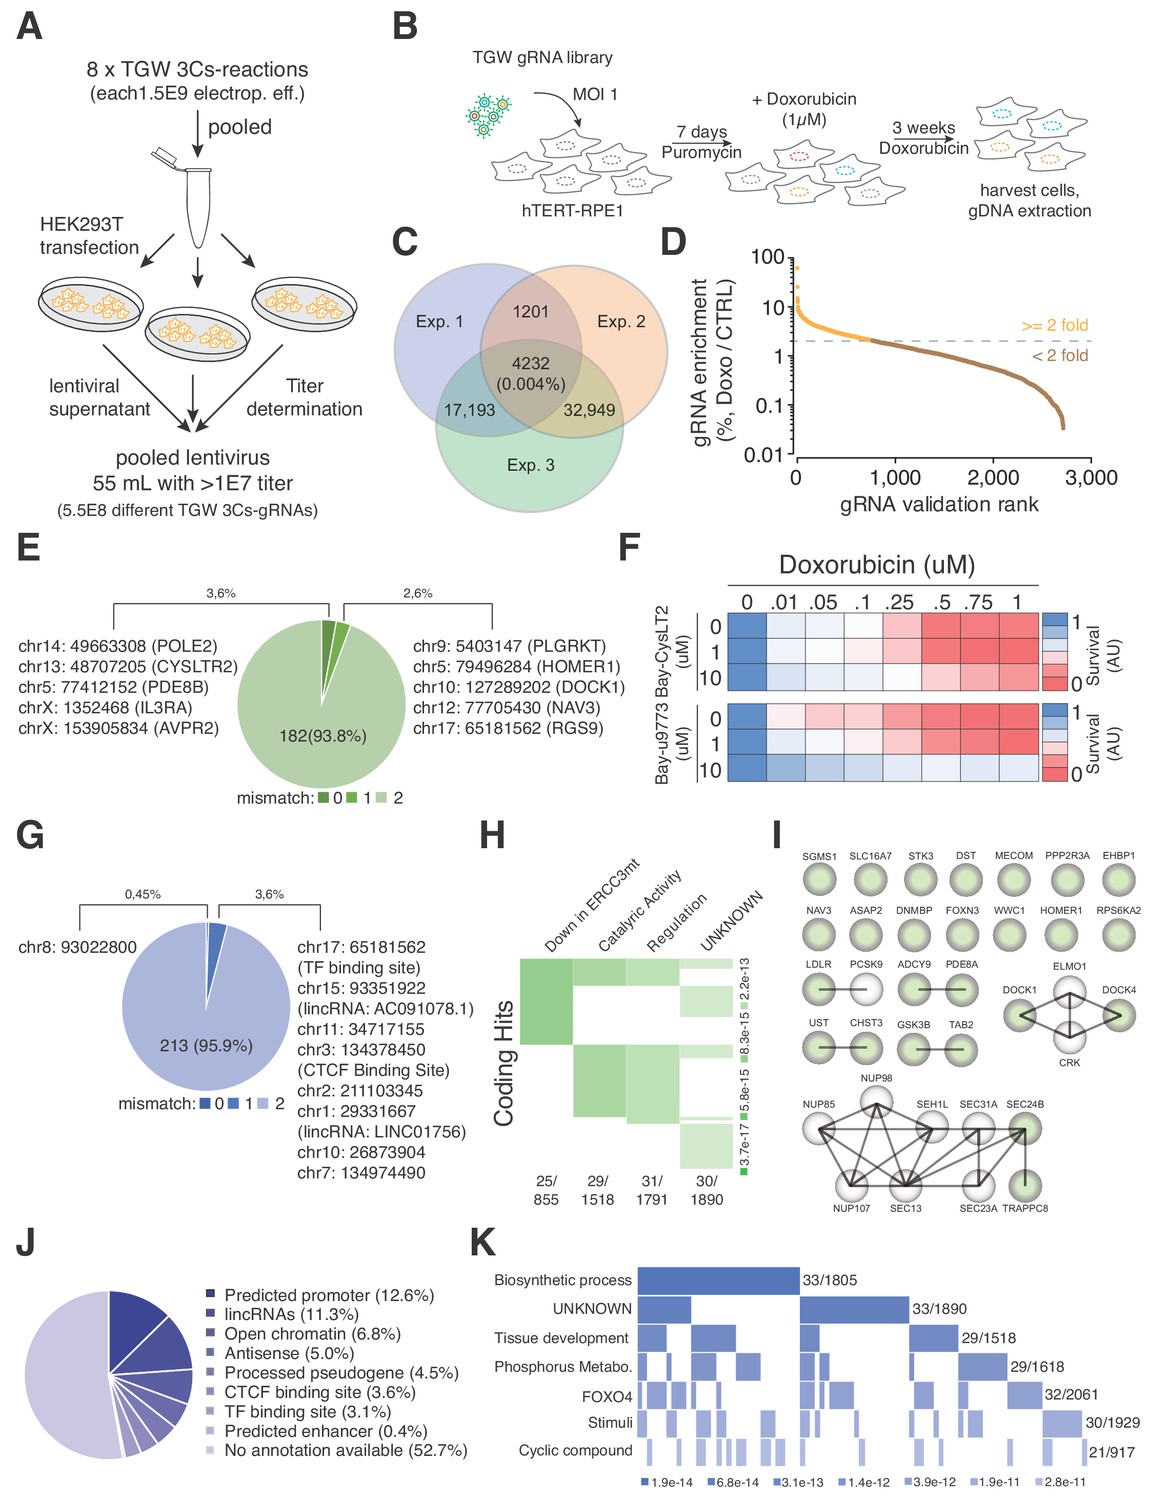
(A) Scheme illustrating the workflow used to generate the pooled lentivirus of the TGW library. The DNA of eight independent TGW 3Cs syntheses was pooled and used to transfect HEK293T cells to produce 5.5 × 10⁸ infectious lentiviral particles. (B) Experimental workflow of the doxorubicin screen in hTERT–RPE1 cells. hTERT–RPE1 cells were transduced with TGW lentivirus with an MOI of 1, selected with puromycin for 7 days, and treated with 1 µM doxorubicin. After three weeks of continuous doxorubicin treatment, all surviving cells were collected and processed for further analysis. (C) Genomic DNA derived from three independent experiments (n = 3), performed according to the scheme illustrated in panel (B), was used to perform NGS and gRNA sequence identification. Computational analysis identified an experimental overlap of 4,232 gRNAs (see also Supplementary file 10). (D) A 3Cs library containing the experimental overlap of 4,232 gRNAs (the validation library) was generated and screened with an experimental coverage of 1,000 and an MOI of 0.1 (similar to the workflow shown in panel (B); see also Figure 5—figure supplement 2). NGS of all surviving cells and computational analysis identified 795 gRNAs that were enriched more than two-fold (orange) when compared to an untreated control. (E) Pie chart visualizing the distribution of coding target regions with respect to SpCas9 off-target rate (0 to 2 mismatches). A total of 192 gRNAs (22.38% of 795 gRNAs) could be mapped to coding regions. Color code represents degree of nucleotide mismatch. (F) Chemical inhibition of cells rescued by CysLTR2 from doxorubicin-mediated toxicity. hTERT–RPE1 cells were treated for 4 d with increasing concentrations of doxorubicin and two chemical inhibitors of CysLTR2 (Bay-CysLT2 and Bay-u9773) before cellular viability was determined by AlamarBlue assays. Averaged values over three biological replicates (n = 3) in arbitrary units (AU) are displayed. (G) Pie chart visualizing the distribution of noncoding target regions with respect to SpCas9 off-target rate (0 to 2 mismatches). A total of 222 gRNAs (27.92% of 795 gRNAs) could be mapped to noncoding regions. Color codingshows the degree of nucleotide mismatch. (H) Molecular signature analysis of coding gRNA target sites identifies a set of genes that are downregulated in cells expressing mutant forms of ERCC3 as the top hit. From among the 178-coding gRNA target site-associated genes, 25 genes are part of the ERCC3 group (which has a total of 855 genes) with high confidence (p=3.7e-17). (I) A list of the 25 ‘down in ERCC3 mutated cells’ genes (light green), as well as their known first- and second-degree interacting genes (grey), identifies cytokinesis (DOCK1/4 genes) and vesicle transport (SEC24B/TRAPPC8 genes) gene interactions. Interaction data adapted from String 10.5. (J) Pie chart visualizing the distribution of noncoding gRNA target site annotations, including their frequency (as percentages of total noncoding hits). Please note: for 52.7% of all noncoding gRNA target sites, no annotation is available. (K) Molecular signature analysis of noncoding gRNA target sites, using adjacently located genes (one for each, 5′ and 3′). 33 genes, out of the 211 genes analyzed, are part of the ‘Biosynthetic process’ group (which includes a total of 1,805 genes) with high confidence (p=3.4e-10).
Figure 5—figure supplement 1
Doxorubicin is toxic in hTERT-RPEI cells and TGW replicates correlate.
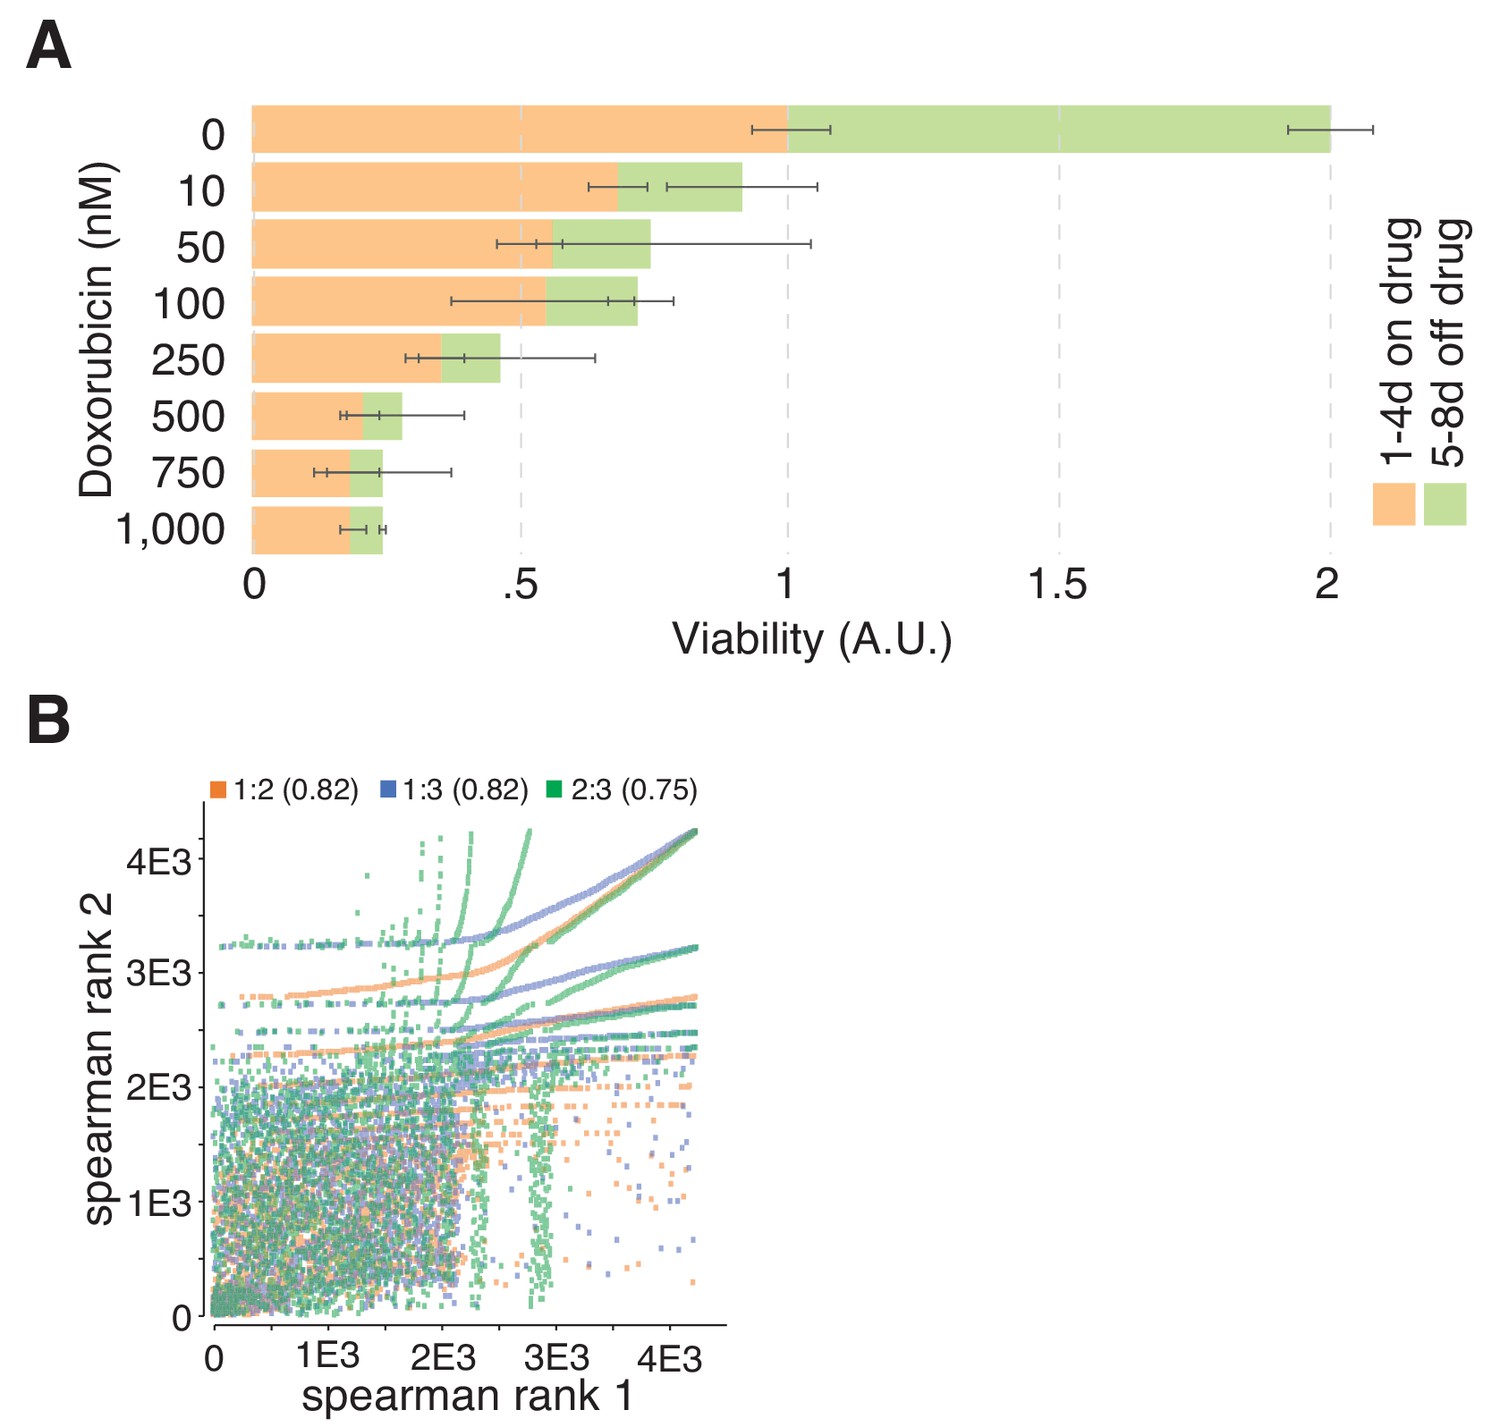
(A) Doxorubicin toxicity in hTERT–RPE1 cells. Cells were incubated for four consecutive days with increasing concentrations of doxorubicin before cellular viability was assessed by AlamarBlue assay (orange). To quantify cellular recovery after 4 d of doxorubicin treatment, cells were exposed to doxorubicin with increasing concentrations ranging from 0 to 1,000 nM for four consecutive days, after which the treatment was stopped and the cells were cultivated for another 4 d without doxorubicin. After a total of 8 d, cellular viability was determined with an AlamarBlue assay (green). Concentrations of doxorubicin above 250 nM induced robust and irreversible toxicity in hTERT–RPE1 cells. Error bars represent standard deviations (SD) over two biological replicates (n = 2). (B) Scatter plot correlating the abundance of the identified TGW gRNAs between biological replicates of the TGW validation screen with 4,232 gRNAs. gRNA read counts of each experiment were normalized towards the sum of all reads per sample and ranked according to their experimental abundance. Spearman correlations of ranked gRNA abundances between experimental replicates were computed. Colors indicate the correlation between experiments: orange (Exp. 1:2), blue (Exp. 1:3), and green (Exp. 2:3) and numbers indicate the respective Spearman correlation efficient (R2 values between 0.75 and 0.82).
Figure 5—figure supplement 2
Quality control of the TGW validation library.
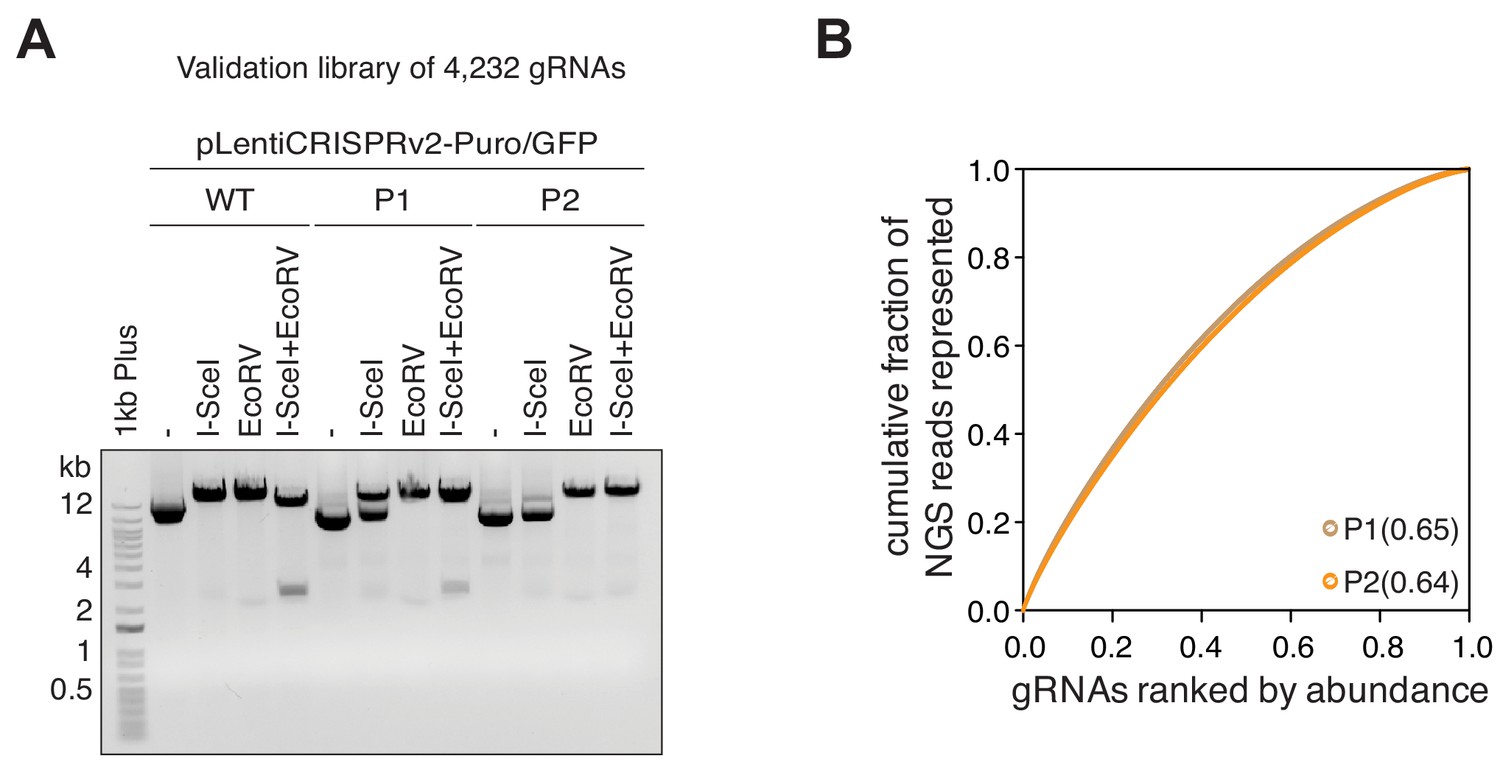
(A) Gel electrophoresis visualizing the quality of P1 and P2 preparations of the TGW validation library (4,232 gRNAs). Please note the absence of the 3-kb DNA fragment in the final (P2) validation library. (B) The distributions of the TGW validation library P1 and P2 preparations visualized as Lorenz curves. The pre-I-SceI-digested library (P1) and the post-I-SceI-digested library (P2) have similar gRNA distributions. The low area under the curve (AUC) values of 0.65 (P1) and 0.64 (P2) indicate that the I-SceI clean-up digestion does not affect the distribution of gRNAs in the final product.
Figure 6 with 1 supplement
Optimized TGW (oTGW) libraries for functional interrogations in the coding and noncoding genome.
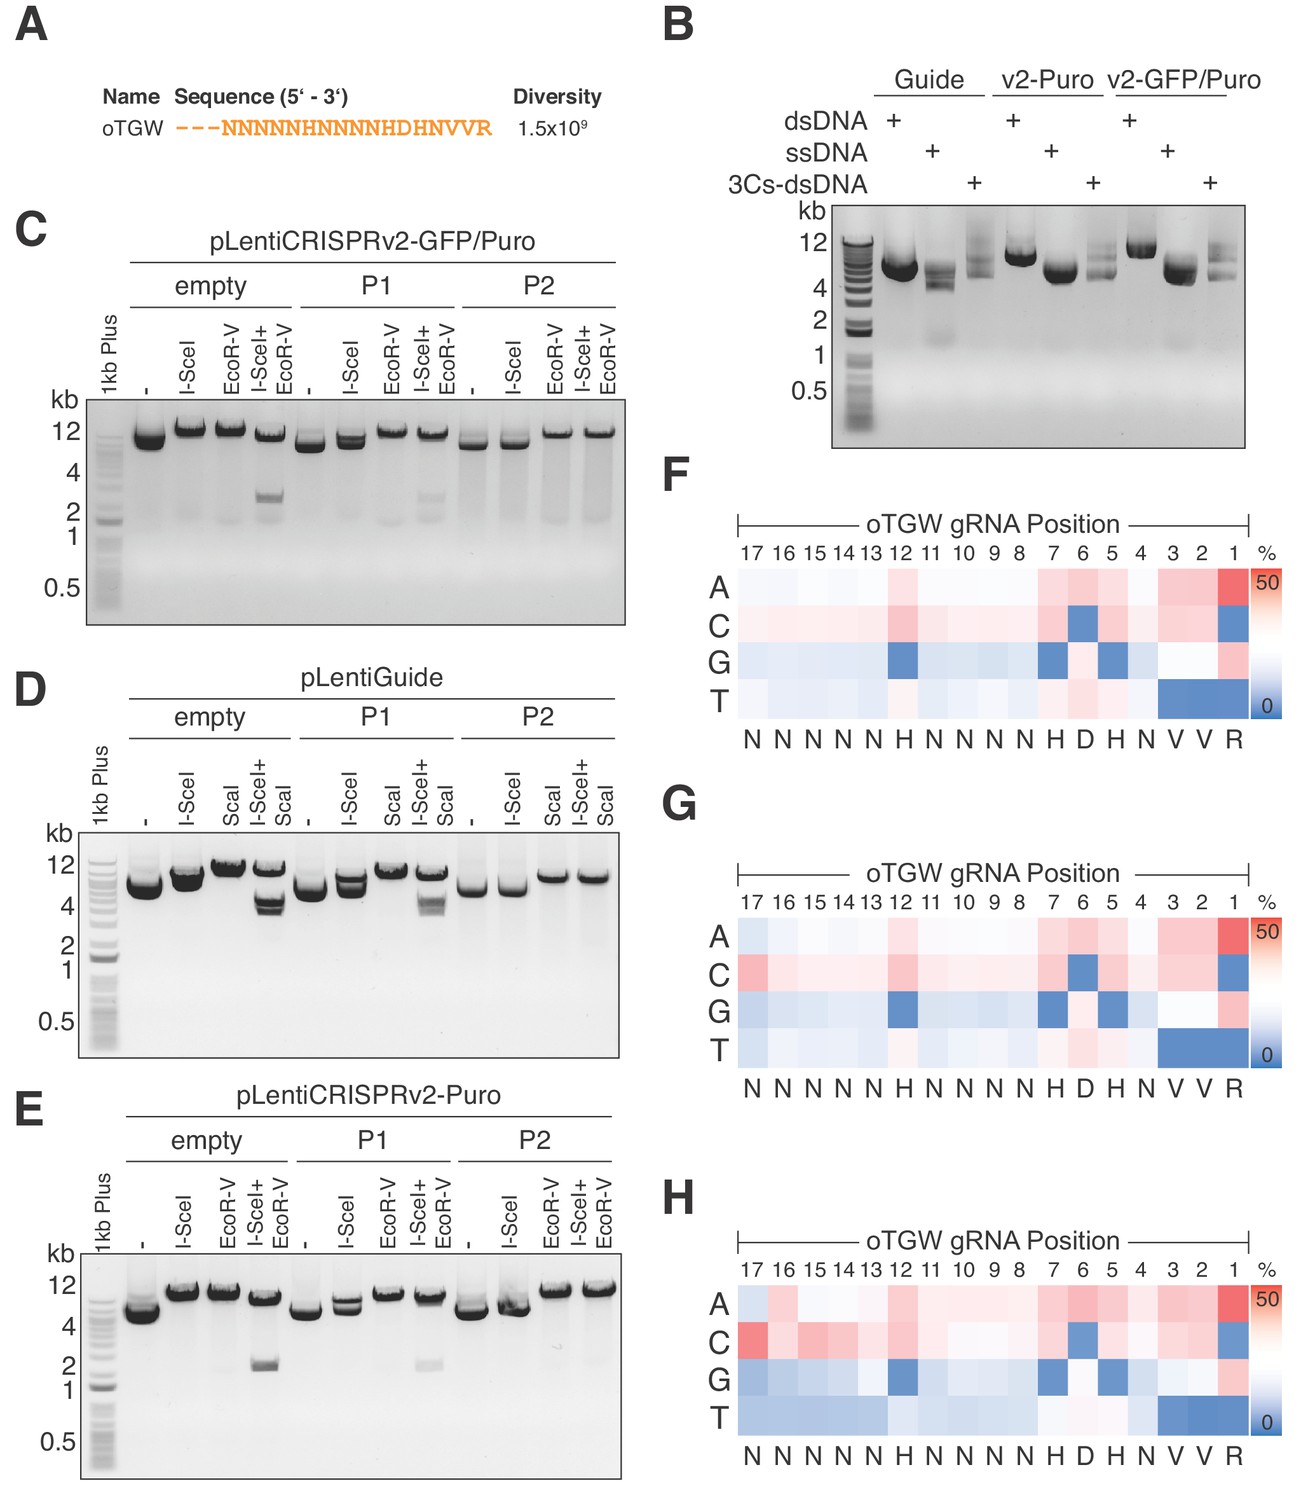
(A) oTGW oligonucleotide sequence, based on reported SpCas9 nucleotide preferences. The truncation of three 5′ nucleotides results in 17-mer gRNAs with a total oligonucleotide diversity of 1.5 × 10⁹. (B) oTGW 3Cs-dsDNA was synthesized on a ssDNA-template of pLentiGuide, pLentiCRISPRv2-Puro and pLentiCRISPRv2-GFP/Puro. 3Cs products are analyzed by gel electrophoresis on a 0.8% TAE/agarose gel. (C–E) Removal of template plasmid remnants with an I-SceI restriction enzyme digest. oTGW 3Cs-dsDNA was electroporated with efficiencies above 6.31 × 10⁹ and amplified for DNA purification (P1). A subsequent I-SceI restriction enzyme digest and an electroporation of P1 yielded the final 3Cs libraries containing no detectable template plasmid (P2). An analytical restriction enzyme digest with I-SceI and EcoRV removes a 2.5-kb DNA fragment from the template plasmid (empty) and to a minor degree from P1 DNA pools. No 2.5-kb fragment could be observed in the final P2 DNA library pools, demonstrating the high purity of the final libraries (see also Figure 6—figure supplement 1). (F–H) High-throughput sequencing data derived from panels (C–E) were used to compute the nucleotide frequency of each gRNA nucleotide position, which are visualized as heat maps. The identified nucleotide frequencies closely resemble the pattern of the degenerated oTGW oligonucleotide shown in panel (A). Color coding illustrates the nucleotide frequencies (0% in blue to 50% in red).
Figure 6—figure supplement 1
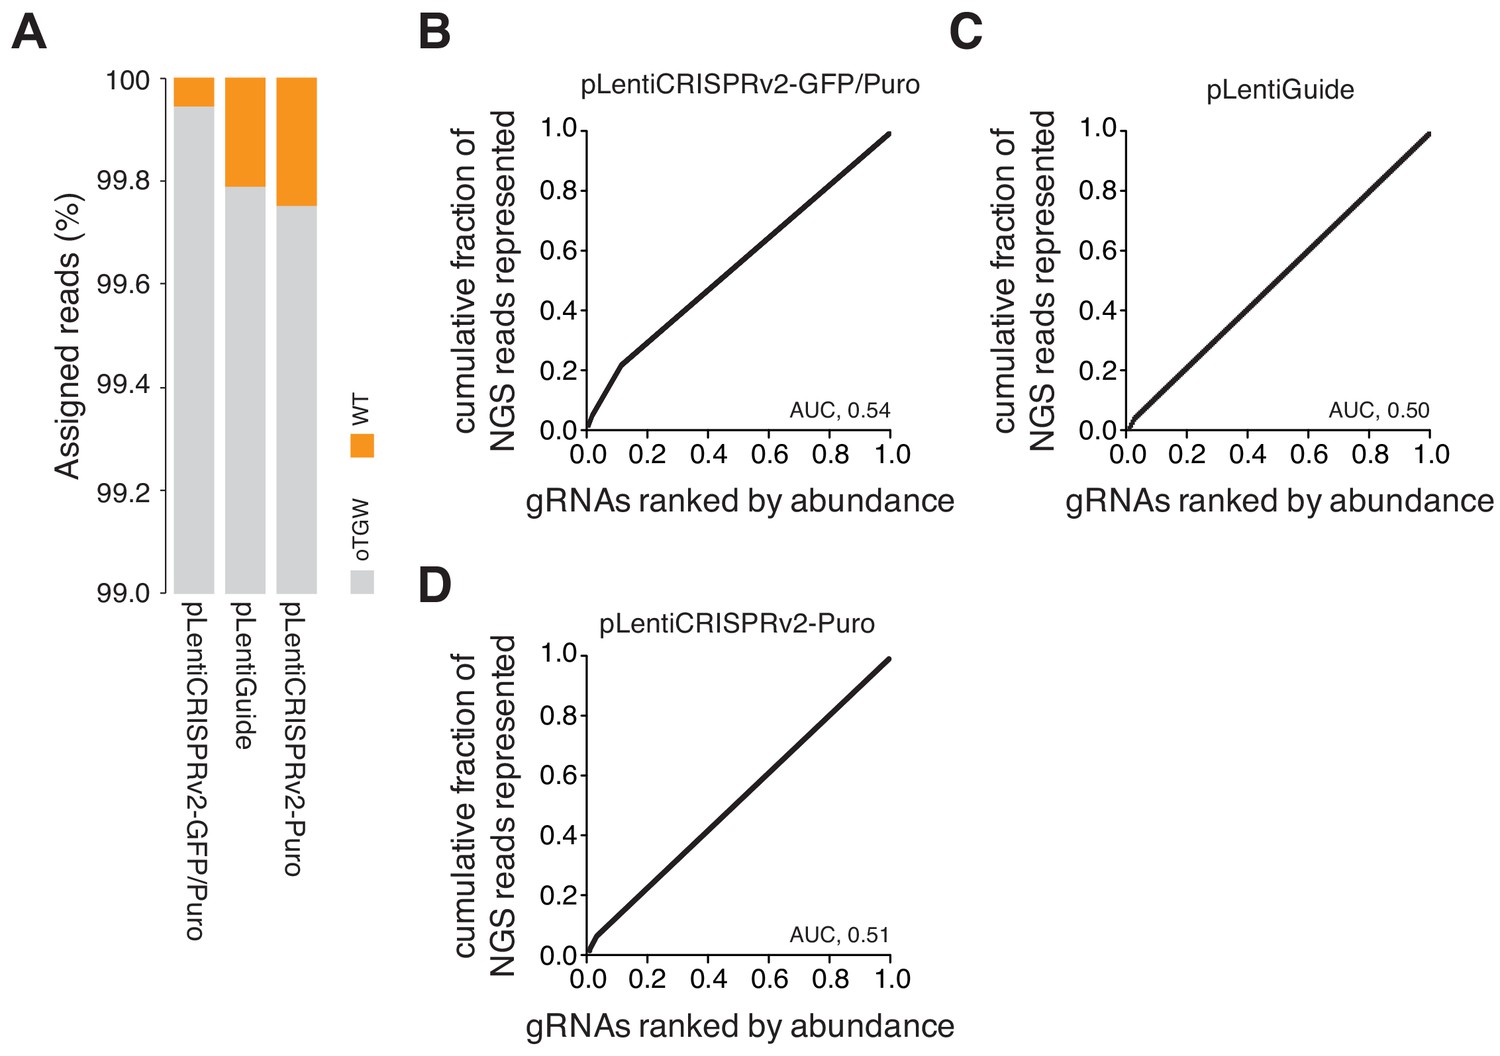
oTGW quality control.
(A) Bar graph visualizing the low rate of template plasmid remnants in the final oTGW gRNA libraries. The rate of template plasmid remnants is below 0.3% in all libraries. NGS data derived from Figure 6F–H. (B–D) The distribution of each oTGW library visualized as a series of Lorenz curves. Please note the low AUC values of between 0.5 and 0.54, demonstrating the uniform gRNA distributions of the represented gRNAs.
Tables
Key resources table
| Reagent type (species) or resource | Designation | Source or reference | RRID identifiers |
|---|---|---|---|
| Cell line (human) | HEK293T | ATCC | RRID:CVCL_0063 |
| Cell line (human) | hTERT-RPE1 | ATCC | RRID:CVCL_4388 |
| Cell line (human) | RPE1 | Ian Cheeseman | |
| Antibody | Anti-GFP (B-2) | Santa Cruz Biotechnology | RRID:AB_627695 |
| Antibody | Anti-alpha Tubulin | DSHB | RRID:AB_2315509 |
| Antibody | Goat anti-Mouse IgG (H + L) Secondary Antibody | Thermo Fisher Scientific | RRID:AB_228307 |
| Antibody | Goat anti-Rabbit IgG (H + L) Secondary Antibody | Thermo Fisher Scientific | RRID:AB_228341 |
| Bacteria (E. coli) | K12 CJ236 | NEB (E4141) | |
| Bacteria (E. coli) | 10 beta | NEB (C3020K) | |
| Recombinant DNA reagent | pLentiGuide | Addgene (52963) | |
| Recombinant DNA reagent | pLentiCRISPRv2 | Addgene (52961) | |
| Recombinant DNA reagent | PLKO.1 | Addgene (8453) | |
| Recombinant DNA reagent | pPax2 | Addgene (12260) | |
| Recombinant DNA reagent | pMD2.G | Addgene (12259) | |
| Commercial kit | E.Z.N.A. M13 DNA Mini Kit | Omega Bio-Tek (D69001-01) | |
| Commercial kit | GeneJET Gel extraction kit | Thermo Fisher (K0692) | |
| Commercial kit | Plasmid Maxi Kit | Qiagen (12163) | |
| Commercial kit | PureLink Genomic DNA Mini Kit | Invitrogen (K1820-01) | |
| Chemical compound, drug | Ampicillin | Roth (K029.2) | |
| Chemical compound, drug | Chloramphenicol | Roth (3886.1) | |
| Chemical compound, drug | Kanamycin | Roth (T832.3) | |
| Chemical compound, drug | NaCl | Roth (31434) | |
| Chemical compound, drug | ATP | NEB (756) | |
| Chemical compound, drug | DTT | Cell Signaling Technology Europe (7016) | |
| Chemical compound, drug | dNTP mix | Roth (0178.1/2) | |
| Chemical compound, drug | Penicillin-streptomycin | Sigma-Aldrich (P4333) | |
| Chemical compound, drug | Hygromycin | Capricorn Scientific (HYG-H) | |
| Chemical compound, drug | Lipofectamin 2000 | Thermo Fisher (11668019) | |
| Chemical compound, drug | Polybrene | Sigma Aldrich (H9268) | |
| Chemical compound, drug | Doxorubicin | Selleckchem (S1208) | |
| Chemical compound, drug | Bay-CysLT2 | Cayman Chemical (10532) | |
| Chemical compound, drug | Bay-u9773 | Tocris Bioscience (3138) | |
| Other | T4 DNA ligase | NEB (M0202) | |
| Other | T7 DNA polymerase (unmodified) | NEB (M0274) | |
| Other | 2 mm electroporation cuvette | BTX (45–0125) | |
| Other | Gene Pulser electroporation system | BioRad (164–2076) | |
| Other | I-SceI | NEB (R0694) | |
| Other | DMEM | Thermo Fisher (41965–039) | |
| Other | DMEM/F12 | Thermo Fisher (11320–074) | |
| Other | FBS | Thermo Fisher (10270) | |
| Other | M13KO7 helper phage | NEB (N0315) | |
| Other | Polyethylene glycol | Roth (263.2) | |
| Other | SOC outgrowth medium | Thermo Fisher (15544034) | |
| Other | 2YT medium | Roth (6676.2) | |
| Other | T4 polynucleotide kinase | NEB (M0201) | |
| Other | T7 endonuclease | NEB (M0302) | |
| Other | OneTaq DNA polymerase | NEB (M0480) | |
| Other | Next High-Fidelity 2x PCR Master Mix | NEB (M0541) | |
| Other | NextSeq 500 | Illumina | |
| Software, algorithm | bcl2fastq | Illumina | RRID:SCR_015058 |
| Software, algorithm | cutadapt v.1.15 | Martin, 2011 | RRID:SCR_011841 |
| Software, algorithm | CasOFFinder v2.4 | Bae et al., 2014 | |
| Software, algorithm | SnpEff 4.3T | Cingolani et al., 2012 | RRID:SCR_005191 |
| Software, algorithm | MAGeCK | Li et al., 2014 |
Additional files
-
Supplementary file 1
3Cs-gRNA GFP library - NGS analysis including total read counts.
- https://doi.org/10.7554/eLife.42549.016
-
Supplementary file 2
List of 4–9N 3Cs libraries - NGS analysis including total read counts per library.
- https://doi.org/10.7554/eLife.42549.017
-
Supplementary file 3
3Cs-gRNA DUB library - NGS analysis including total read counts of DUB library.
- https://doi.org/10.7554/eLife.42549.018
-
Supplementary file 4
3Cs-gRNA DUB screen - NGS analysis including total read counts and normalizations.
- https://doi.org/10.7554/eLife.42549.019
-
Supplementary file 5
3Cs-gRNA DUB screen - NGS analysis using MAGeCK.
- https://doi.org/10.7554/eLife.42549.020
-
Supplementary file 6
3Cs-gRNA DUB screen - NGS analysis using PinAPL-Py.
- https://doi.org/10.7554/eLife.42549.021
-
Supplementary file 7
List of 3Cs-shRNA E2 library sequences and total NGS read counts.
- https://doi.org/10.7554/eLife.42549.022
-
Supplementary file 8
Number of TGW and oTGW target sequences per human chromosome and total oTGW NGS read counts per library.
- https://doi.org/10.7554/eLife.42549.023
-
Supplementary file 9
3Cs TGW library – list of total NGS read counts.
- https://doi.org/10.7554/eLife.42549.024
-
Supplementary file 10
List of 4232 3Cs TGW gRNA sequences derived from the doxorubicin screen.
- https://doi.org/10.7554/eLife.42549.025
-
Supplementary file 11
3Cs-gRNA TGW validation screen - NGS analysis including raw read counts, normalizations and ratios.
- https://doi.org/10.7554/eLife.42549.026
-
Supplementary file 12
Annotation list of validated coding TGW hits.
- https://doi.org/10.7554/eLife.42549.027
-
Supplementary file 13
Annotation list of validated noncoding TGW hits.
- https://doi.org/10.7554/eLife.42549.028
-
Supplementary file 14
List of coding hits - molecular signature analysis.
- https://doi.org/10.7554/eLife.42549.029
-
Supplementary file 15
List of noncoding hits - molecular signature analysis.
- https://doi.org/10.7554/eLife.42549.030
-
Supplementary file 16
List of DNA oligonucleotides.
- https://doi.org/10.7554/eLife.42549.031
-
Supplementary file 17
Raw sequencing counts of the six randomized libraries.
- https://doi.org/10.7554/eLife.42549.032
-
Supplementary file 18
DUB library raw sequencing counts.
- https://doi.org/10.7554/eLife.42549.033
-
Supplementary file 19
DUB screen raw sequencing read counts, includes day 0, day 11, and day 21 for two replicates.
- https://doi.org/10.7554/eLife.42549.034
-
Supplementary file 20
Raw sequencing counts of the E2-shRNA library.
- https://doi.org/10.7554/eLife.42549.035
-
Supplementary file 21
Raw sequencing reads of the TGS screen triplicates.
- https://doi.org/10.7554/eLife.42549.036
-
Supplementary file 22
Raw sequencing reads of the TGW screen validation library.
- https://doi.org/10.7554/eLife.42549.037
-
Supplementary file 23
Raw sequencing reads of CTRL and treatment samples of the TGW validation screen.
- https://doi.org/10.7554/eLife.42549.038
-
Transparent reporting form
- https://doi.org/10.7554/eLife.42549.039
Download links
A two-part list of links to download the article, or parts of the article, in various formats.
Downloads (link to download the article as PDF)
Open citations (links to open the citations from this article in various online reference manager services)
Cite this article (links to download the citations from this article in formats compatible with various reference manager tools)
Circular synthesized CRISPR/Cas gRNAs for functional interrogations in the coding and noncoding genome
eLife 8:e42549.
https://doi.org/10.7554/eLife.42549


