PUMILIO hyperactivity drives premature aging of Norad-deficient mice
- University of Texas Southwestern Medical Center, United States
- Nationwide Children's Hospital, United States
- The Ohio State University, United States
- Howard Hughes Medical Institute, University of Texas Southwestern Medical Center, United States
Figures
Figure 1 with 2 supplements
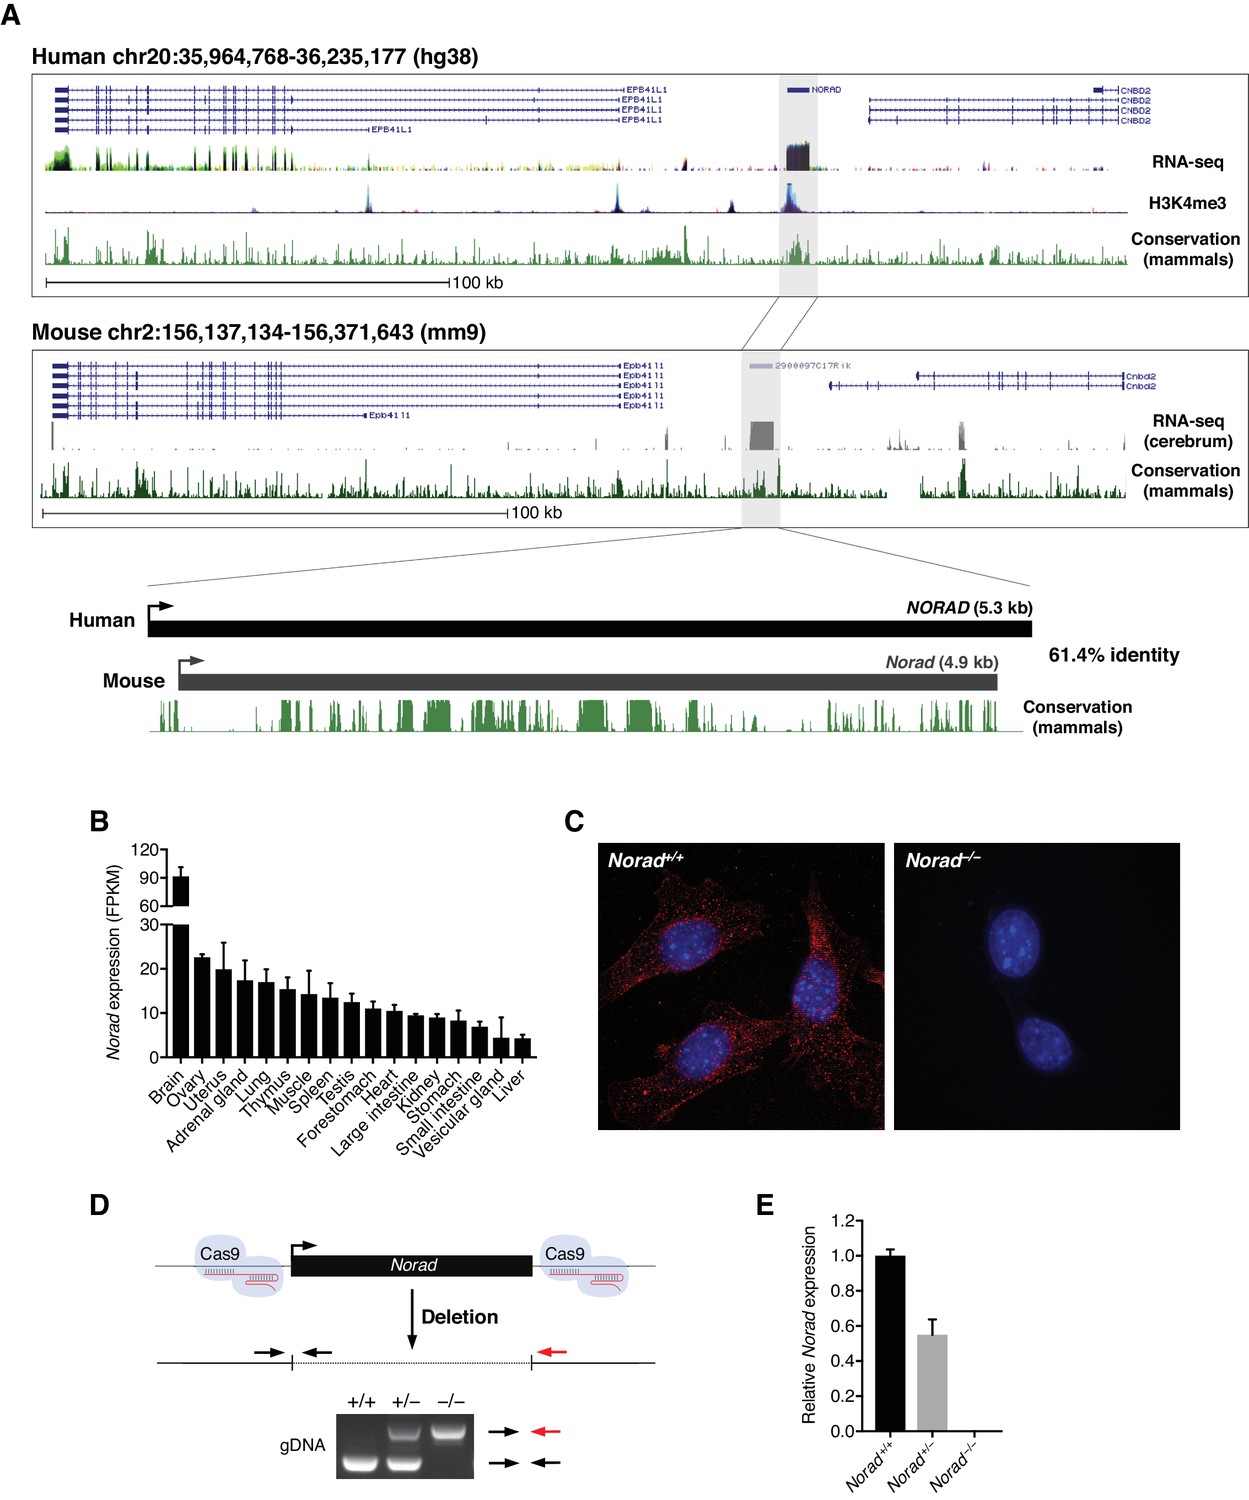
Deletion of the mouse Norad ortholog.
(A) Syntenic regions of human and mouse chromosomes 20 and 2, respectively, harboring Norad orthologs. The following UCSC Genome Browser tracks are shown: human and mouse Refseq genes, human ENCODE regulation track with overlay of RNA-seq data from 9 cell lines and H3K4me3 data from 7 cell lines, mammalian conservation for both human and mouse (Phastcons), and mouse ENCODE UW RNA-seq data from mouse cerebrum. (B) Norad expression across 17 mouse tissues based on RNA-seq data from the Mouse Transcriptomic BodyMap (Li et al., 2017). (C) RNA FISH in immortalized MEFs of the indicated genotypes demonstrates predominantly cytoplasmic localization of Norad. (D) Schematic of CRISPR/Cas9-mediated genome-editing strategy used to delete Norad in mice. Genotyping PCR strategy and a representative genotyping result are shown. (E) Norad expression in primary MEF lines of the indicated genotypes, determined by qRT-PCR (n = 3 biological replicates). Data are represented as mean ± SD in (B) and (E).
Figure 1—figure supplement 1
Deletion of the mouse Norad ortholog.
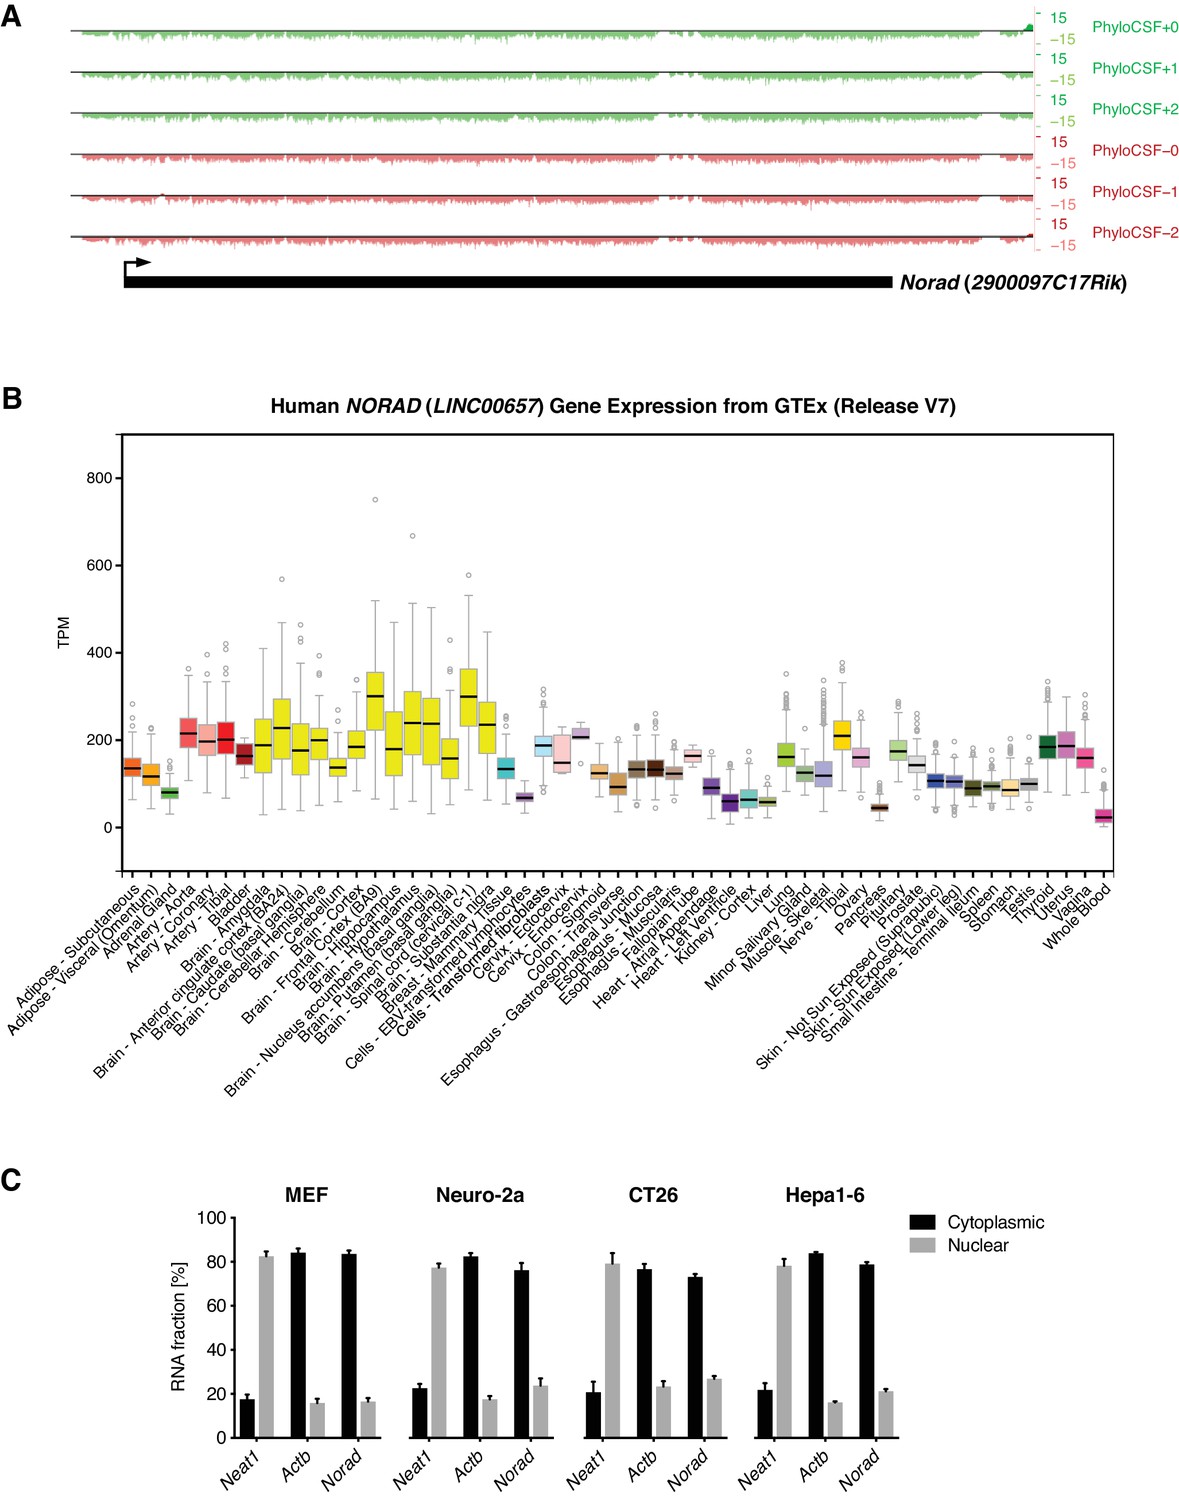
(A) Low protein-coding potential of Norad (2900097C17Rik). PhyloCSF tracks from the UCSC Genome Browser (mm10) shown for all three reading frames on both strands. (B) NORAD (LINC00657) expression in human tissues. RNA-seq data from the Genotype-Tissue Expression (GTEx) Project (Release V7) plotted as transcripts per million (TPM). (C) Predominantly cytoplasmic localization of Norad in the indicated mouse cell lines. Subcellular localization was determined by cellular fractionation with subsequent qRT-PCR of Norad, Neat1 (nuclear control), or Actb (cytoplasmic control) (n = 3 biological replicates). Data are represented as mean ± SD in (C).
Figure 1—figure supplement 2
Deletion of the mouse Norad ortholog.
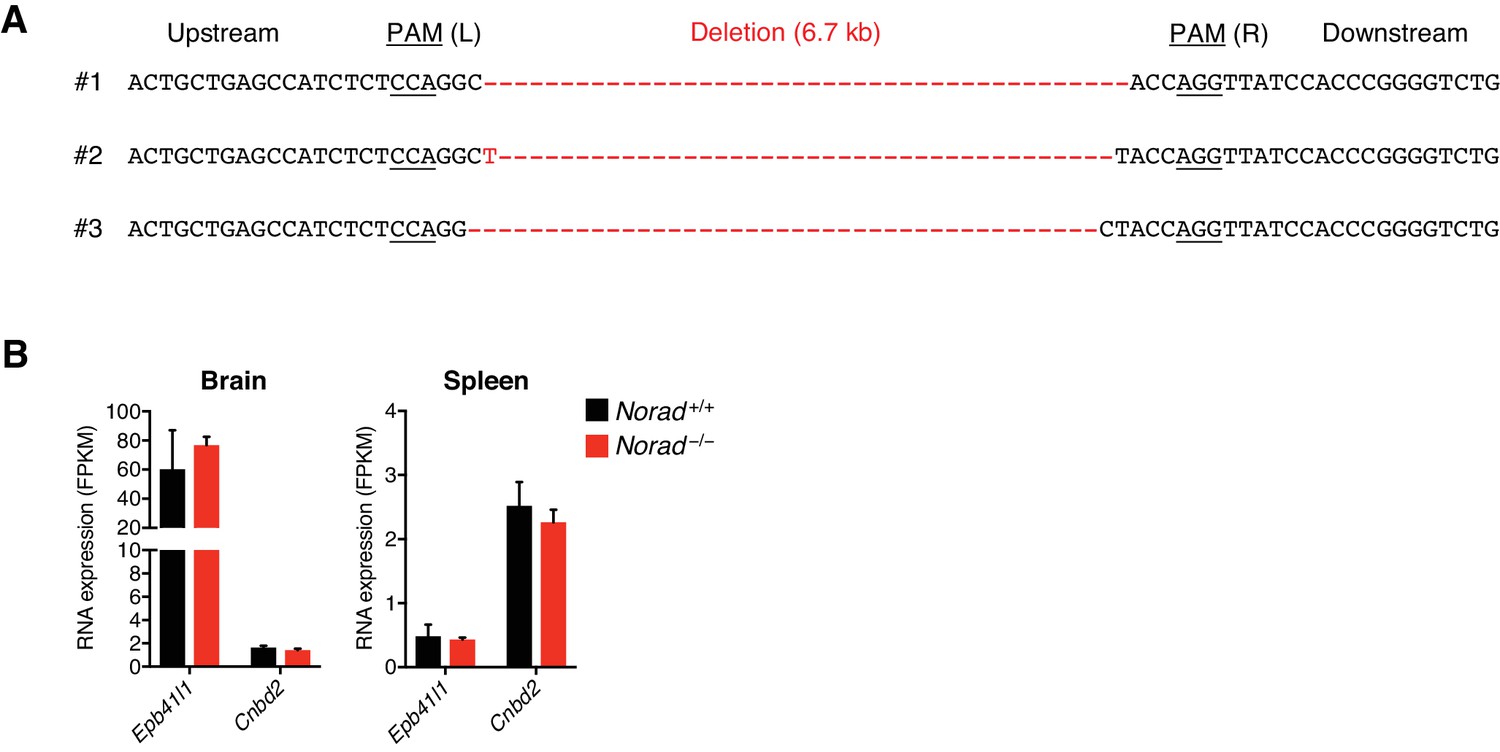
(A) Sequences of genomic deletions induced by genome editing in Norad–/– mice. (B) Expression levels of the indicated genes neighboring Norad in brain and spleen as determined by RNA-seq (n = 3 mice per genotype). Data are represented as mean ± SD in (B).
Figure 2 with 1 supplement
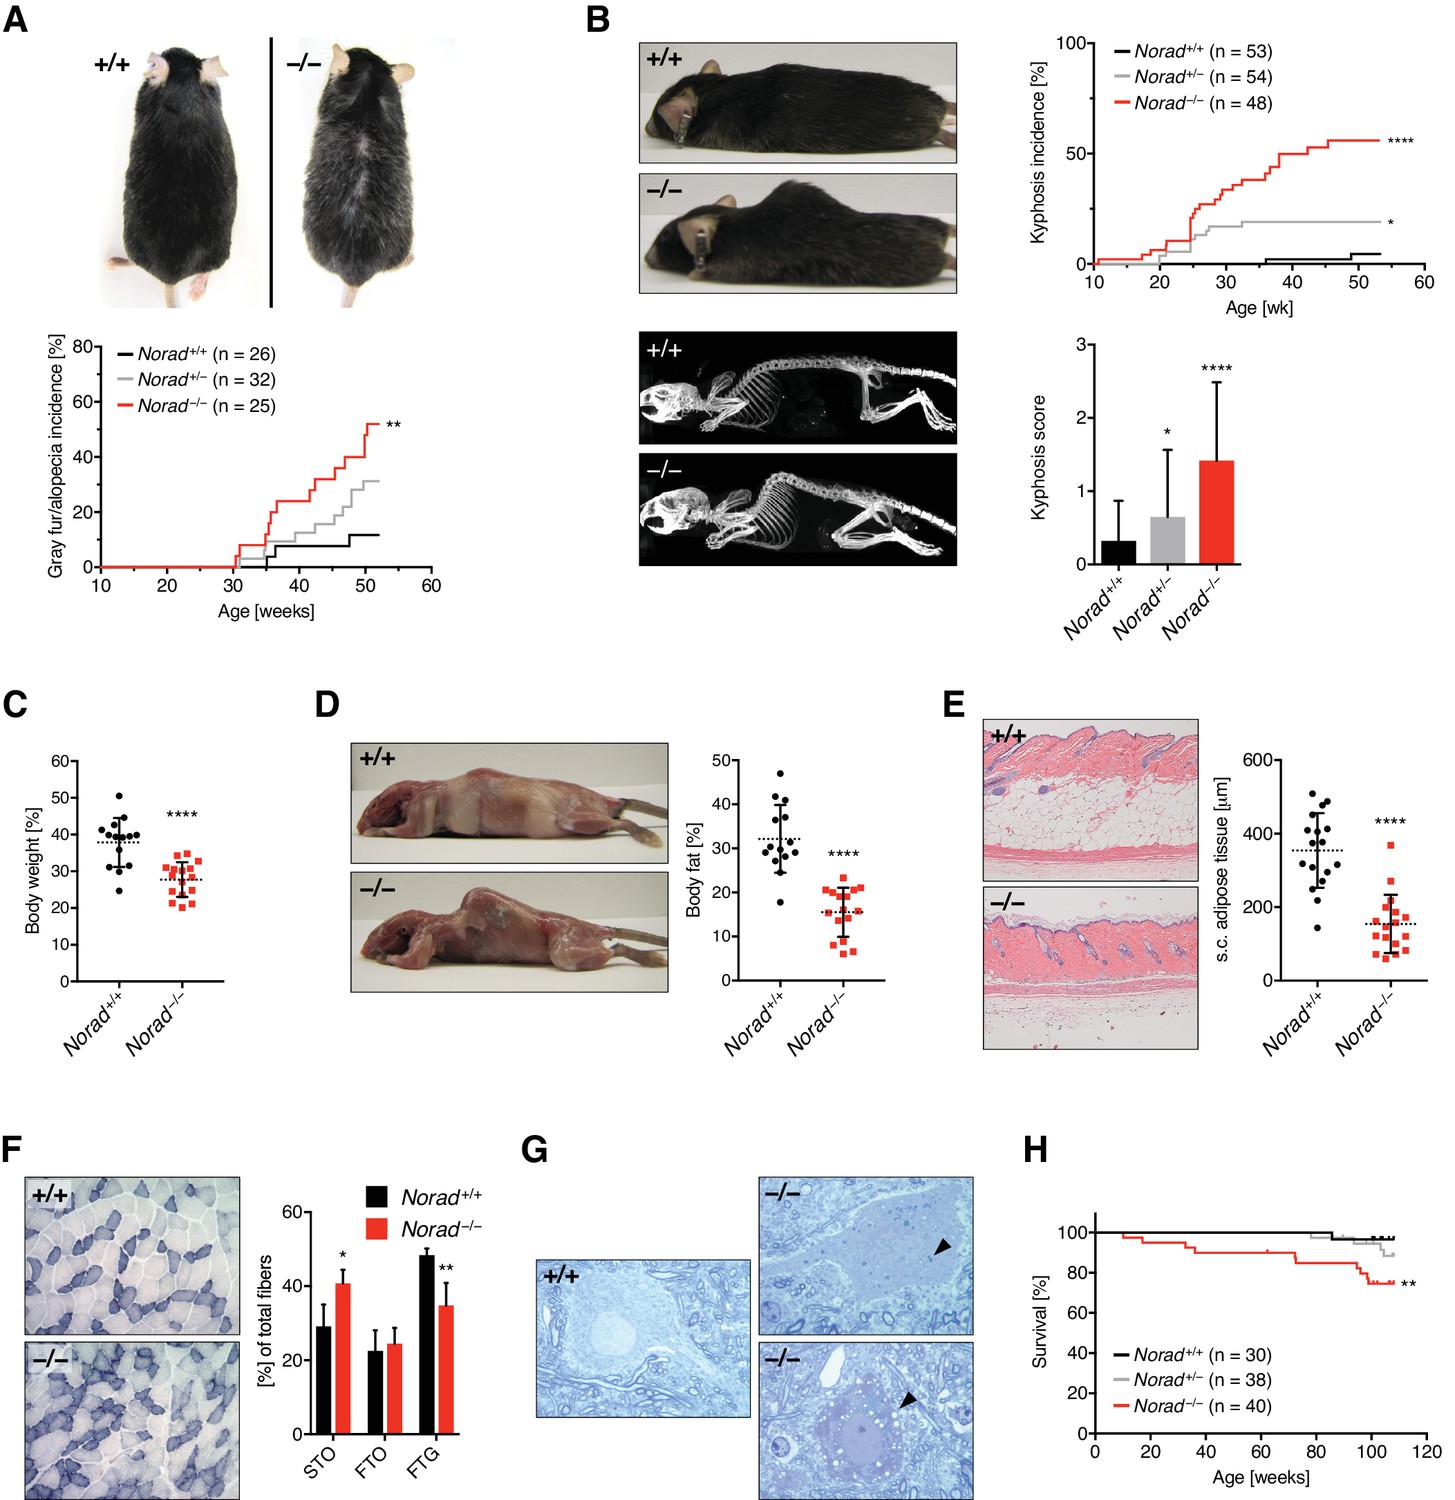
Norad loss-of-function results in a degenerative phenotype resembling premature aging.
(A) Increased alopecia and gray fur in Norad–/– males. Representative 12-month-old male mice shown. (B) Kyphosis in Norad–/– mice. Kyphosis severity was scored from 0-3 using an established scheme (Guyenet et al., 2010). Upper right graph shows kyphosis incidence (score ≥ 2), lower right graph shows average kyphosis score at 12 months of age. Representative photographs and x-ray images of 12-month-old mice are shown. (C) Body weight of 12-month-old Norad–/– mice with a kyphosis score ≥ 2 compared to randomly-selected Norad+/+ controls (n = 14-16 mice per genotype). (D) Body fat percentage of mice from panel (C), quantified using NMR. Photographs show representative 12-month-old mice with skin removed to demonstrate loss of fat depots. (E) Subcutaneous (s.c.) fat thickness in 12-month-old Norad–/– mice with a kyphosis score ≥ 2 compared to randomly selected Norad+/+ controls (n = 17 mice per genotype). Representative H and E-stained skin sections shown. (F) Increased oxidative muscle fibers in 12-month-old Norad–/– mice. Fiber types in gastrocnemius muscle were grouped into slow twitch oxidative (STO), fast twitch oxidative (FTO), or fast twitch glycolytic (FTG) based on their high, intermediate or low SDH activity (n = 4 mice per genotype). Representative images of SDH histochemistry of gastrocnemius middle zones are shown. (G) Aging-related changes in the CNS of 12-month-old Norad–/– mice. Semi-thin sections of spinal cord demonstrate the presence of motor neurons with an accumulation of lipofuscin (arrowhead, upper right panel) or vacuoles (arrowhead, lower right panel) in Norad–/– mice. (H) Overall survival of mice of the indicated genotypes over a 2-year period. Data are represented as mean ± SD in (B)-(F), and p values were calculated using log-rank test in (A), (B), and (H) or Student’s t test in (B)-(F). *p ≤ 0.05, **p ≤ 0.01, ****p ≤ 0.0001.
Figure 2—figure supplement 1
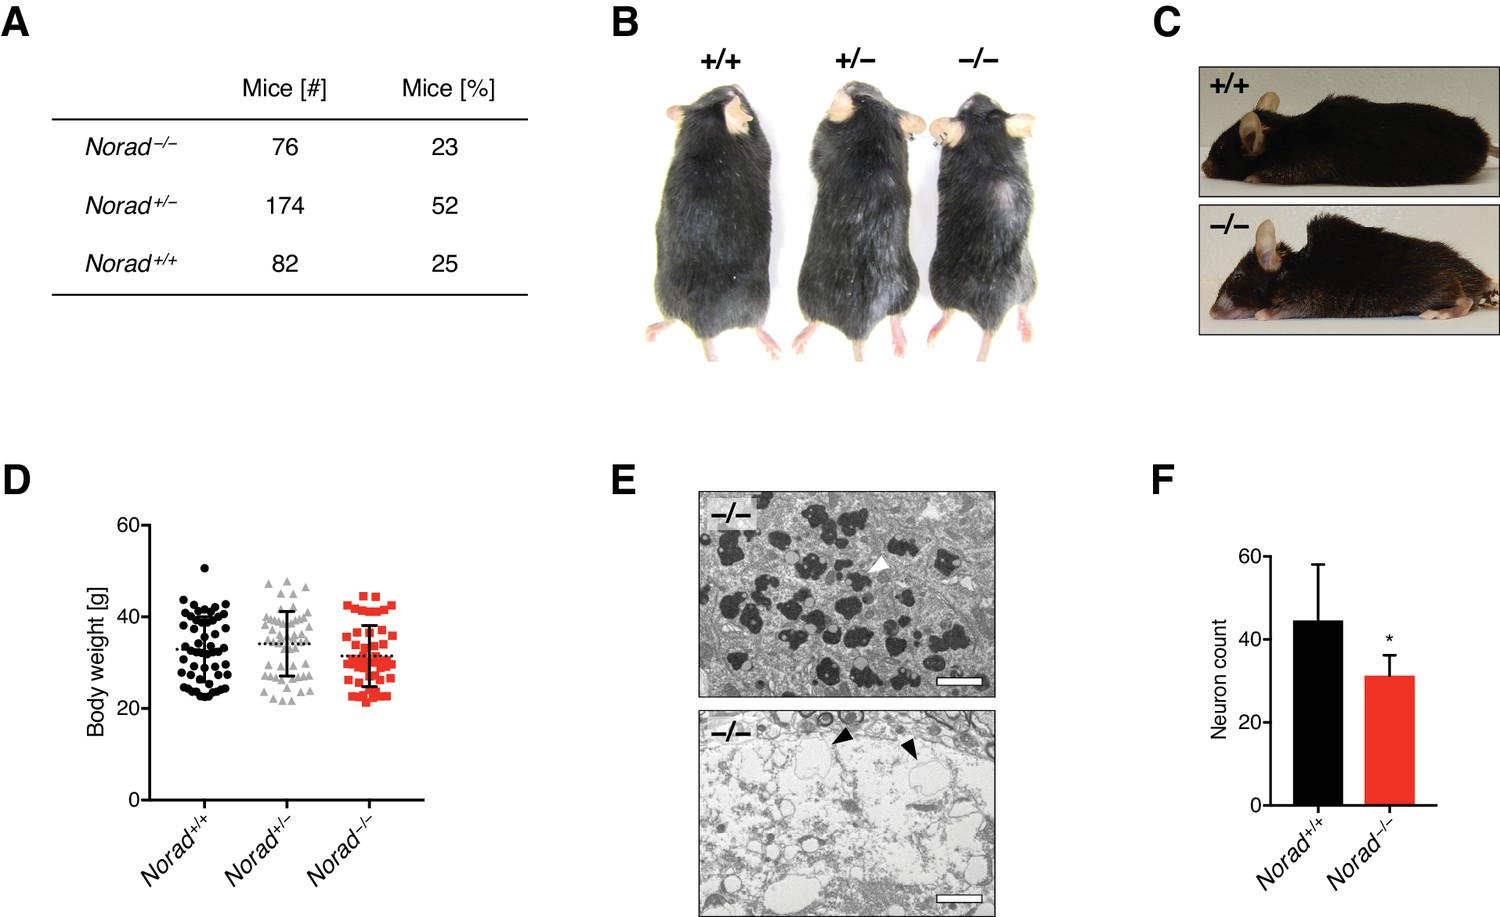
Norad loss-of-function results in a degenerative phenotype resembling premature aging.
(A) Distribution of genotypes obtained from Norad+/– intercrosses. (B) Representative 12-month-old male Norad+/+, Norad+/– and Norad–/– littermates showing dose-dependent alopecia and graying of fur. (C) Pronounced kyphosis in a 34-month-old Norad–/– mouse compared to an age-matched wild-type control. (D) Body weight of 12-month-old mice of the indicated genotypes independent of the kyphosis score (n = 48-54 mice per genotype). (E) Electron micrographs of spinal cord motor neurons in 12-month-old Norad–/– mice showing an accumulation of lipofuscin (arrowhead, upper panel) and vacuoles (arrowhead, lower panel). Scale bars 2 μm. (F) Reduction of neuronal density in spinal cord of 12-month-old Norad–/– mice. For each genotype, neurons were quantified in a total of seven sections derived from five independent mice. Data are represented as mean ± SD in (D) and (F) and p value was calculated using Student’s t test. *p ≤ 0.05.
Figure 3
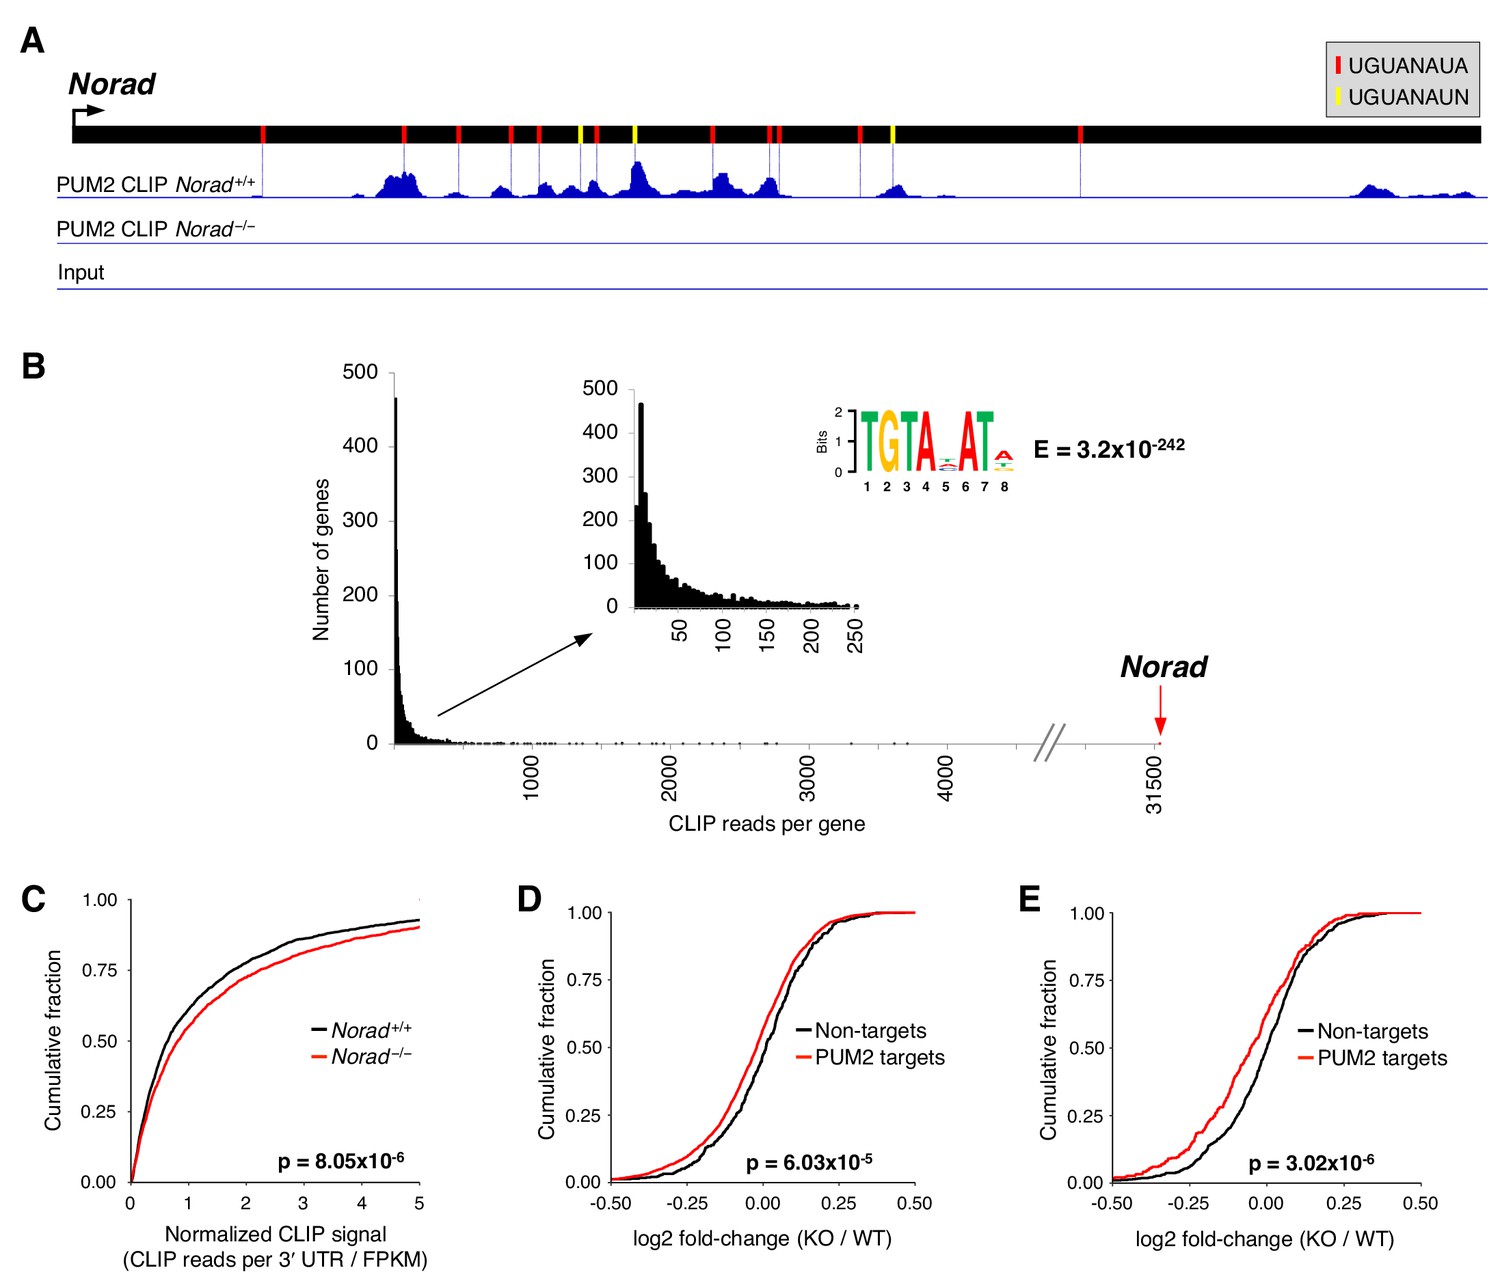
PUMILIO hyperactivity in Norad-deficient mice.
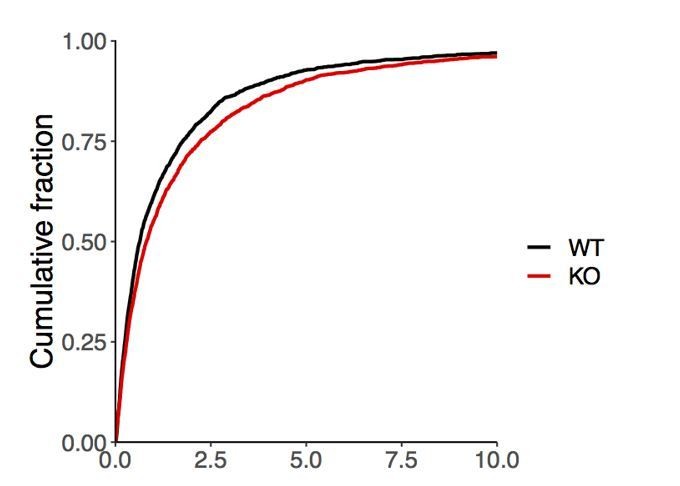
(A) Normalized brain PUM2 CLIP reads mapped to Norad visualized using the Integrative Genomics Viewer (scale = 0–1260). Positions of perfect or relaxed PREs indicated with red or yellow lines, respectively. (B) Norad is the preferred PUM2 target RNA in mouse brain. The sum of all normalized reads in CLIP clusters in the 3’ UTR of each PUM2 target RNA was calculated and data were plotted as a histogram showing numbers of genes with a given number of total CLIP reads. The web logo above the graphs shows the most significantly enriched motif identified by MEME-ChIP analysis (Bailey et al., 2009) in CLIP clusters in 3’ UTRs. (C) Increased PUM2 target occupancy in Norad–/– brains. Cumulative distribution function (CDF) plot showing the normalized CLIP signal (total CLIP reads in clusters in the 3’ UTR normalized to the RNA-seq-determined expression level of the gene) for PUM2 target genes detected in both Norad+/+ and Norad–/– brains. (D) CDF plot comparing fold-changes of PUM2 CLIP targets detected in Norad–/– brains to non-targets with similar expression and 3’ UTR lengths. Fold-changes calculated using Norad–/– vs. Norad+/+ brain RNA-seq data. (E) As in (D) but only PUM2 CLIP targets with at least a 2-fold increase in normalized CLIP signal in Norad–/– vs. Norad+/+ brain were plotted. p values calculated by Kolmogorov-Smirnov test for (C)-(E).
Figure 4 with 1 supplement

Norad deficiency leads to genomic instability.
(A) DNA FISH for two representative chromosomes (chr. 2 and 16) was performed on cultured lymphocytes or freshly isolated splenocytes from mice of the indicated genotypes and ages. Frequency of cells with a non-modal number of chromosomes was determined by scoring 100 interphase nuclei per sample (n = 4 mice per genotype per time-point). Images show examples of on mode (upper panel) or off mode (lower panel) cells. (B) Representative time-lapse images of metaphase-to-anaphase transitions of Hoechst-stained primary MEFs show anaphase bridges and lagging chromosomes (arrowheads). Time stamp indicates hr:min elapsed. Graph represents data from a total of 128 Norad+/+ and 158 Norad–/– mitoses analyzed in independent MEF lines per genotype. (C) GSEA showing repression of indicated gene ontology (GO) gene sets in RNA-seq data from Norad–/– spleens. FDR, false discovery rate; NES, normalized enrichment score calculated by GSEA algorithm (Subramanian et al., 2005). (D) GO analysis was performed using genes that were significantly downregulated in Norad–/– spleens (EdgeR p ≤ 0.05) using DAVID. Significantly enriched biological processes (BP) are depicted in the graph. (E) CDF plot comparing fold-changes of PUM2 CLIP targets detected in Norad–/– brains with at least two PREs and expressed at FPKM ≥ 1 in spleen to non-targets with similar expression and 3’ UTR lengths. Fold-changes calculated using Norad–/– vs. Norad+/+ spleen RNA-seq data. Data are represented as mean ± SD in (A) and (B), and p values were calculated using Student’s t test. *p ≤ 0.05, **p ≤ 0.01, ***p ≤ 0.001, ****p ≤ 0.0001. p value in (E) was calculated by Kolmogorov-Smirnov test.
Figure 4—figure supplement 1
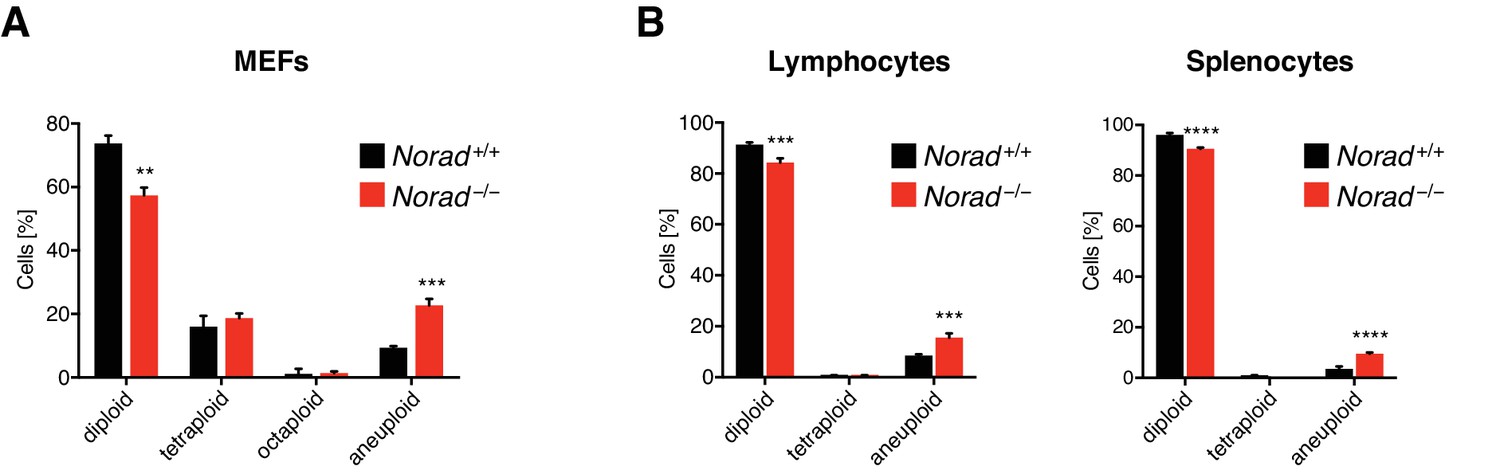
Norad deficiency leads to genomic instability.
(A) Aneuploidy and polyploidy in primary MEFs. DNA FISH for two representative chromosomes (chr. 2 and 16) was performed to determine the frequency of diploid, polyploid, and aneuploid cells. Only cells with chromosome numbers differing from 2n or a multiple of 2n were regarded as aneuploid. 120 interphase nuclei per cell line were scored (n = 3 independent MEF lines per genotype). (B) Rare polyploidy in lymphocytes and splenocytes from 12-month-old Norad–/– mice. Additional data from the experiment in Figure 4A is shown (12-month time-point). In only very rare cases (≤ 0.5%) were cells tetraploid for the two tested chromosomes. Data are represented as mean ± SD and p values were calculated using Student’s t test. **p ≤ 0.01, ***p ≤ 0.001, ****p ≤ 0.0001.
Figure 5 with 2 supplements
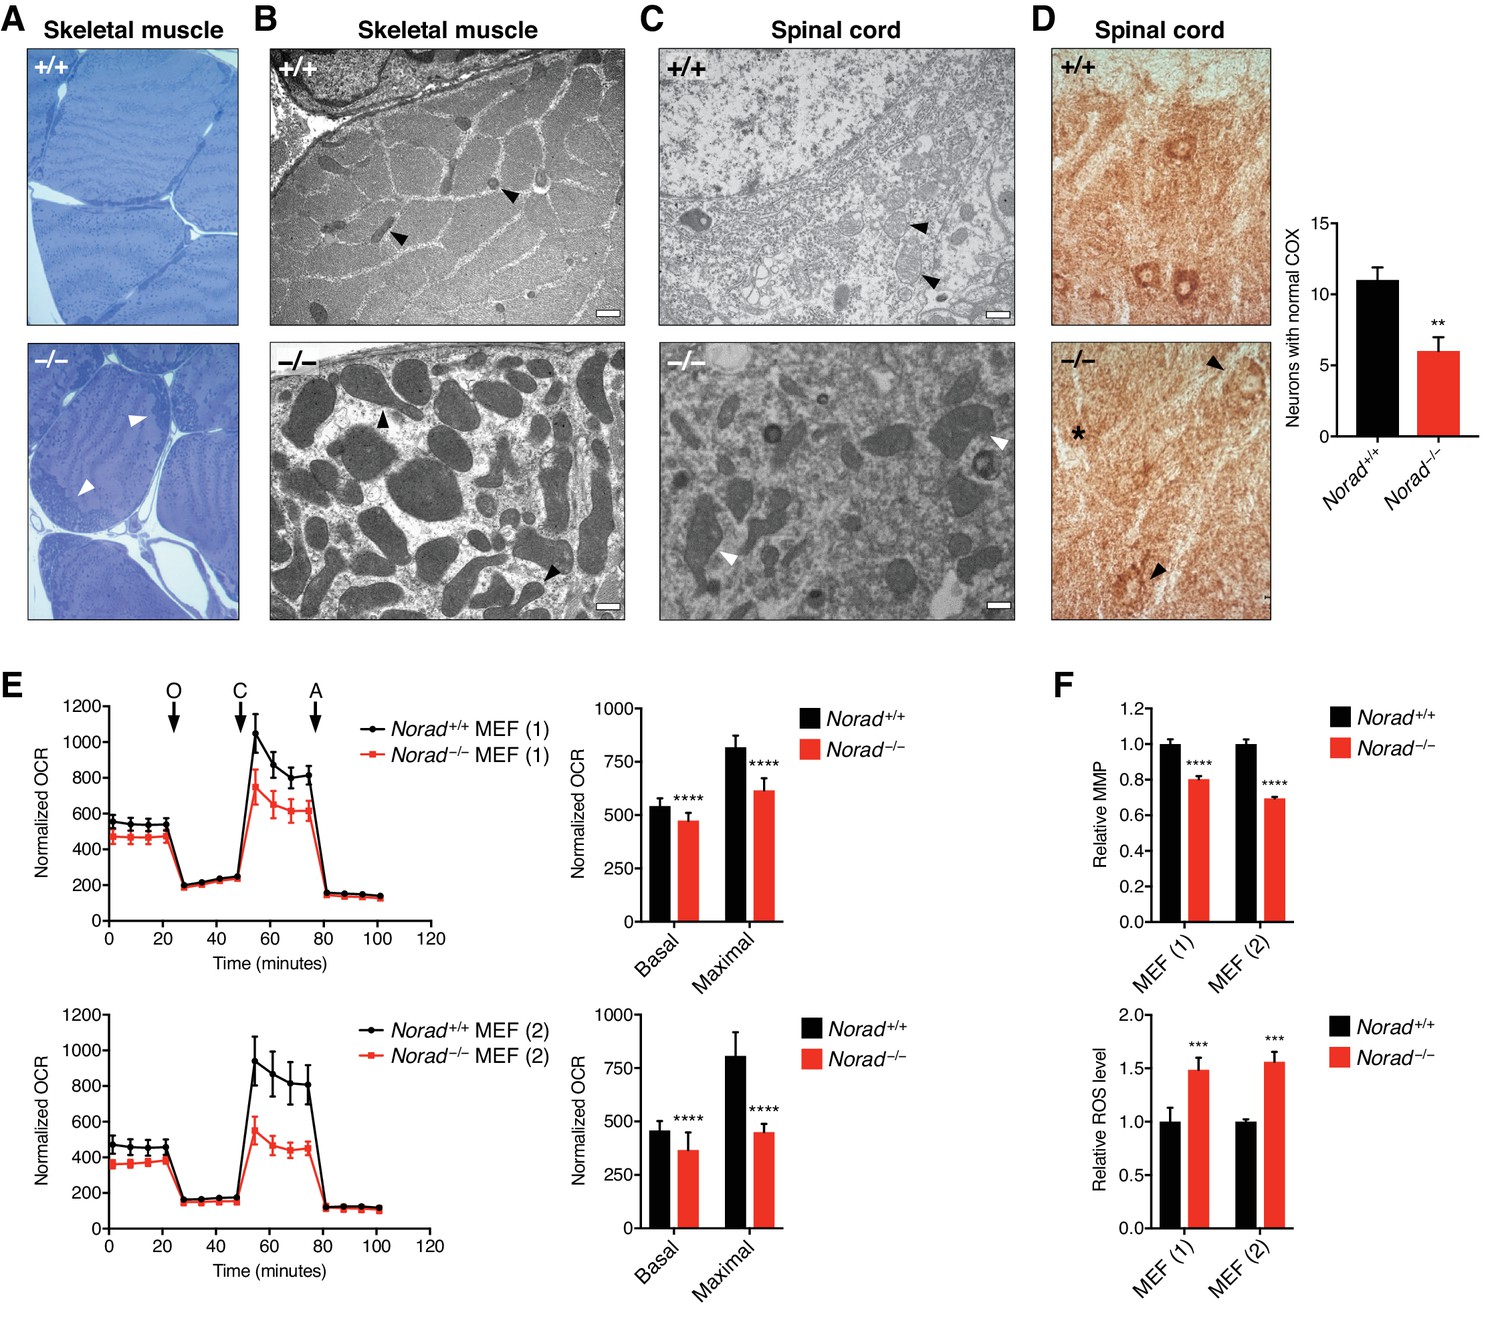
Loss of Norad results in mitochondrial dysfunction.
(A) Subsarcolemmal accumulation of mitochondria (arrowheads) in skeletal muscle of 12-month-old Norad–/– mice. Semi-thin sections of soleus muscle were stained with toluidine blue. (B)-(C) Electron micrographs of soleus muscle (B) and spinal motor neurons (C) showing mitochondrial morphology in 12-month-old Norad+/+ and Norad–/– mice. Black or white arrowheads highlight mitochondria in each image. Scale bars 500 nm. (D) Reduced COX activity in the CNS of 12-month-old Norad–/– mice. Spinal cord motor neurons were analyzed using COX histochemistry, and neurons with normal COX activity were counted (n = 7-8 sections total from 4 mice per genotype). Representative images are shown with arrowhead and asterisk pointing to neurons with decreased or absent COX activity, respectively. (E) Impaired respiration in immortalized Norad–/– MEFs. Normalized oxygen consumption rates (OCR) (OCR/total protein) were determined in two littermate pairs of Norad+/+ and Norad–/– MEFs using Seahorse analysis (n = 22-24 biological replicates per MEF pair, O = oligomycin, C = CCCP, A = antimycin A). Basal and maximal respiration was determined from measurement 4 and 12, respectively. (F) Reduced mitochondrial membrane potential (MMP) and elevated ROS levels in immortalized Norad–/– MEFs. MMP and ROS levels were assessed in two littermate pairs of Norad+/+ and Norad–/– MEFs using flow cytometry (n = 3 biological replicates per MEF pair). Data are represented as mean ± SD in (D)-(F), and p values were calculated using Student’s t test. **p ≤ 0.01, ***p ≤ 0.001, ****p ≤ 0.0001.
Figure 5—figure supplement 1

Loss of Norad results in mitochondrial dysfunction.
(A) Increased mtDNA content in gastrocnemius muscle of 12-month-old Norad–/– mice. mtDNA was quantified by qPCR and normalized to nuclear DNA (n = 6 mice per genotype). (B) COX histochemistry demonstrating the presence of rare muscle fibers with greatly reduced COX activity in gastrocnemius muscle of 12-month-old Norad–/– mice (arrowhead). (C) Oxidative damage in the CNS of 12-month-old Norad–/– mice. Lipid peroxidation and DNA/RNA oxidation were analyzed in sections of brain stem and cerebellum using 4-HNE immunohistochemistry or 8-OHdG/8-OHG immunofluorescence, respectively. (D) Increased protein oxidation in the CNS of 12-month-old Norad–/– mice, as determined by 3-nitrotyrosine (3-NT) ELISA (n = 3 mice per genotype for brain, n = 4 mice per genotype for spinal cord). Data are represented as mean ± SD in (A) and (D) and p values were calculated using Student’s t test. *p ≤ 0.05, ***p ≤ 0.001.
Figure 5—figure supplement 2
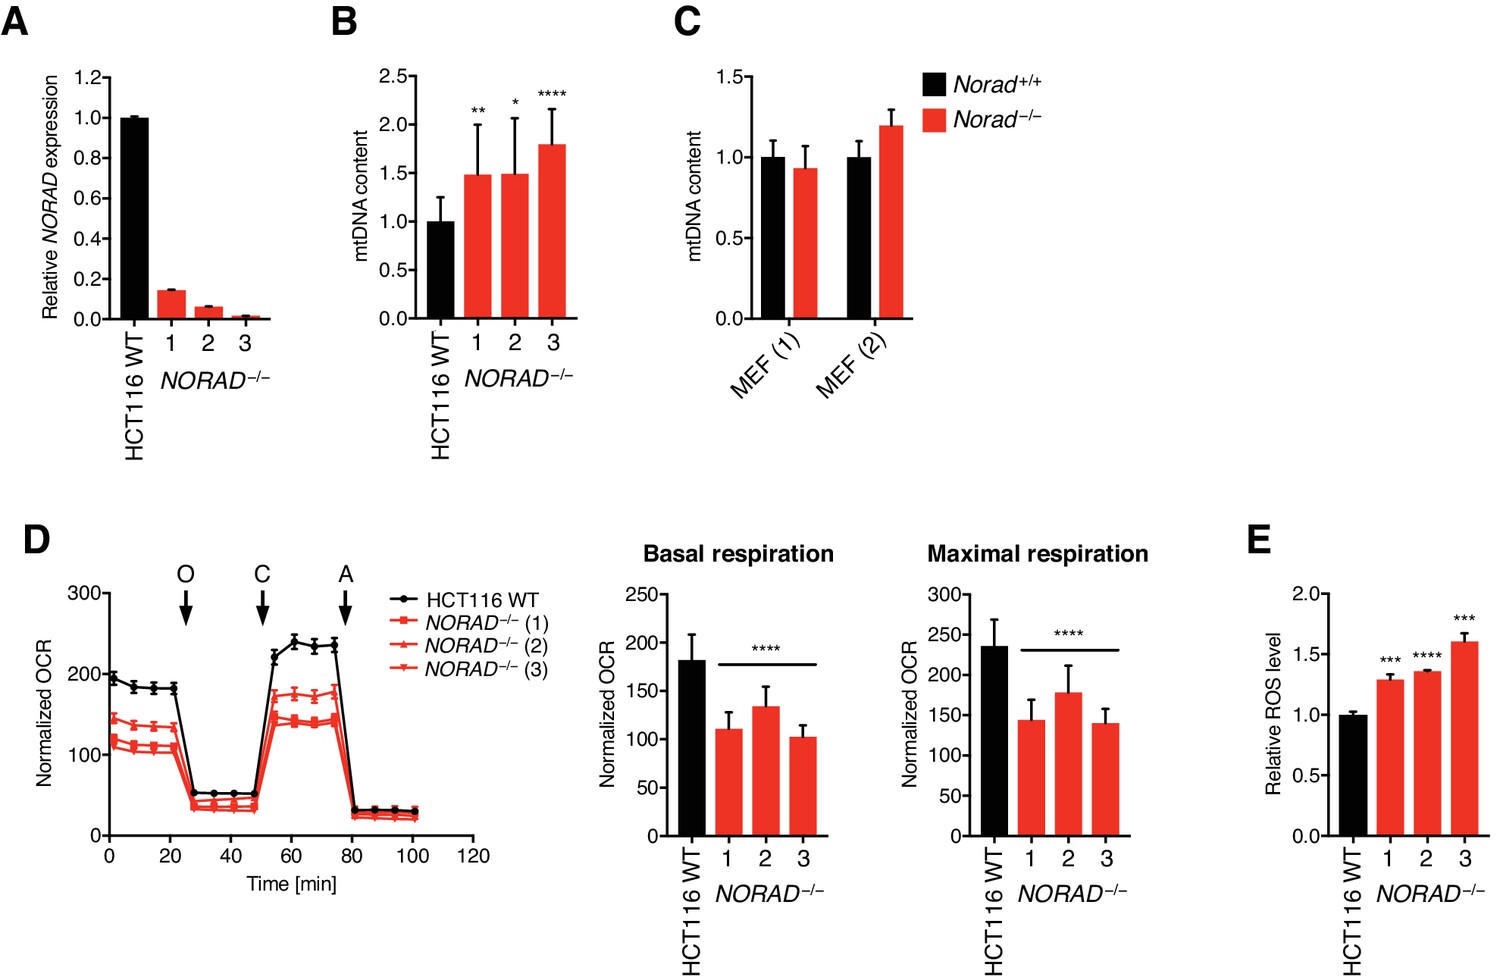
Loss of NORAD results in mitochondrial dysfunction and increased ROS levels in human HCT116 cells.
(A) NORAD levels were quantified in previously described HCT116 knockout cell lines (Lee et al., 2016) using qRT-PCR. (B) Increased mtDNA content in NORAD–/– HCT116 cells. mtDNA was quantified by qPCR and normalized to nuclear DNA (n = 11–13 biological replicates per condition). (C) Immortalized Norad–/– MEFs do not exhibit elevated mtDNA content. mtDNA was quantified by qPCR and normalized to nuclear DNA (n = 3 biological replicates per MEF line). (D) Impaired respiration in NORAD–/– HCT116 cells. Normalized oxygen consumption rate (OCR) (OCR/total protein/mtDNA content) was determined using Seahorse analysis (n = 14–16 biological replicates per condition, O = oligomycin, C = CCCP, A = antimycin A). Basal and maximal respiration was determined from measurement 4 and 12, respectively. (E) ROS levels were assessed in the indicated cell lines using flow cytometry (n = 3 biological replicates per condition). Data are represented as mean ± SD in (A)-(E) except (D, left graph) which is represented as mean ± SEM for clarity due to the number of overlapping lines, and p values were calculated using Student’s t test. *p ≤ 0.05, **p ≤ 0.01, ***p ≤ 0.001, ****p ≤ 0.0001.
Figure 6 with 1 supplement
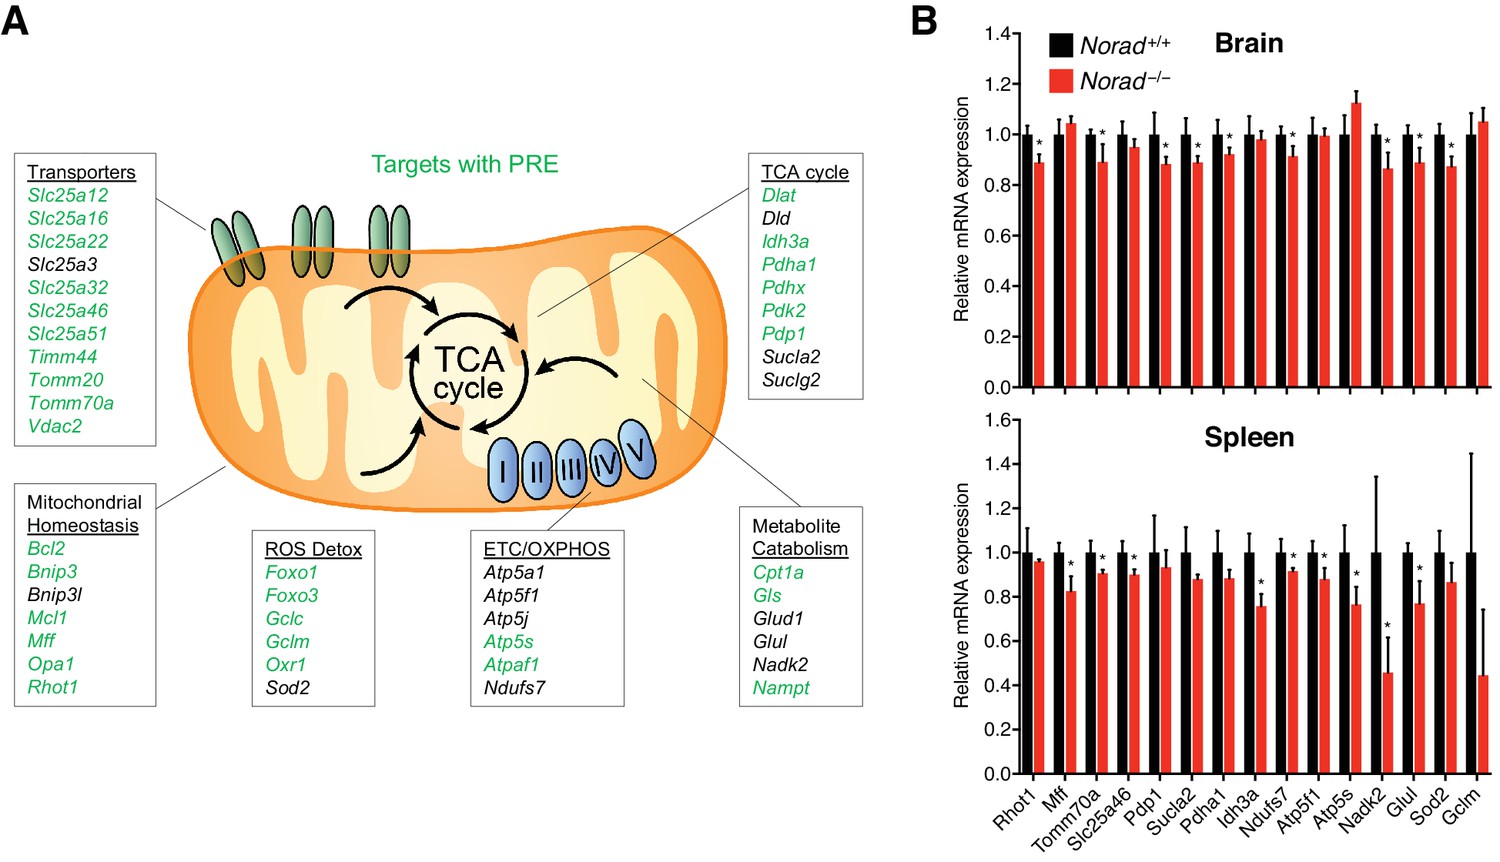
Loss of Norad results in the repression of key mitochondrial PUM2 target genes.
(A) Selected PUM2 CLIP targets with important mitochondrial functions. Green text indicates the presence of a relaxed PRE (UGUANAUN) within 100 nucleotides of a 3’ UTR PUM2 CLIP cluster. (B) Downregulation of mitochondrial PUM2 target genes in Norad–/– brain and spleen. Expression levels were determined by qRT-PCR (n = 4 mice per genotype). Data are represented as mean ± SD in (B), and p values were calculated using Student’s t test. *p ≤ 0.05.
Figure 6—figure supplement 1
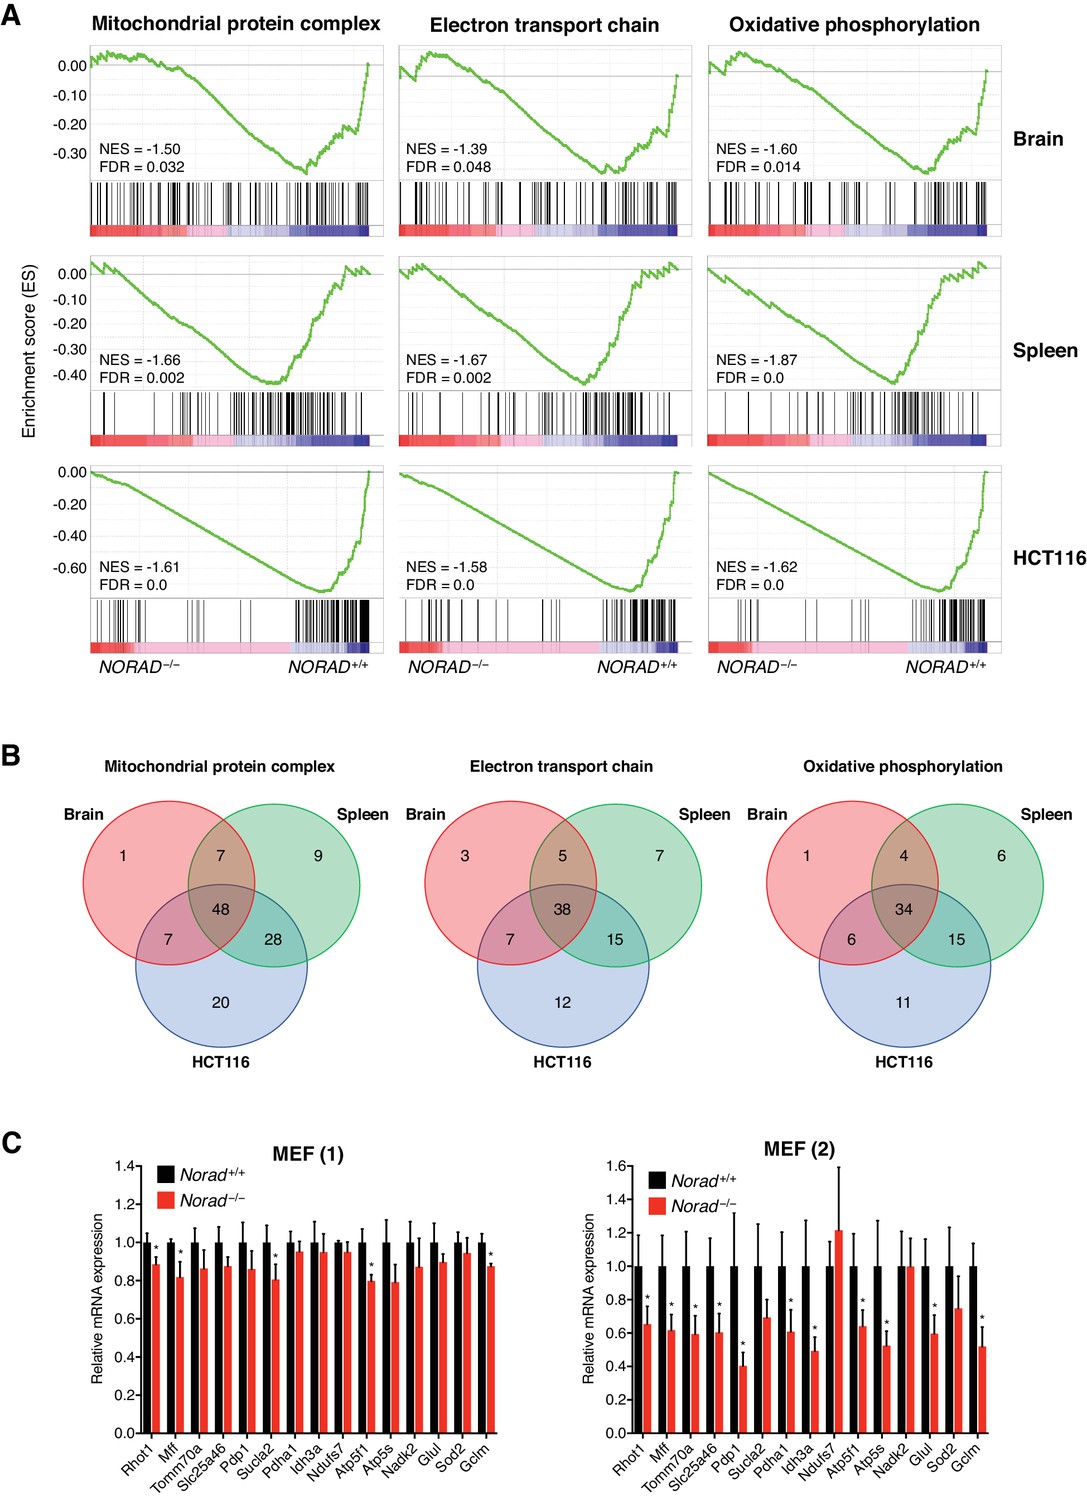
Repression of mitochondrial PUM2 target genes in Norad–/– cells and tissues.
(A) GSEA showing repression of indicated gene ontology (GO) gene sets in RNA-seq data from Norad–/– brain and spleen and human NORAD–/– HCT116 cells (Lee et al., 2016). FDR, false discovery rate; NES, normalized enrichment score calculated by GSEA algorithm (Subramanian et al., 2005). (B) Venn diagrams showing the overlap of genes within each gene set that show a negative rank metric score (calculated by GSEA algorithm) in the indicated datasets. (C) Downregulation of mitochondrial PUM2 target genes in immortalized Norad–/– MEFs. Expression levels were determined by qRT-PCR (n = 3 biological replicates for each MEF pair). Data are represented as mean ± SD in (C), and p values were calculated using Student’s t test. *p ≤ 0.05.
Figure 7 with 3 supplements
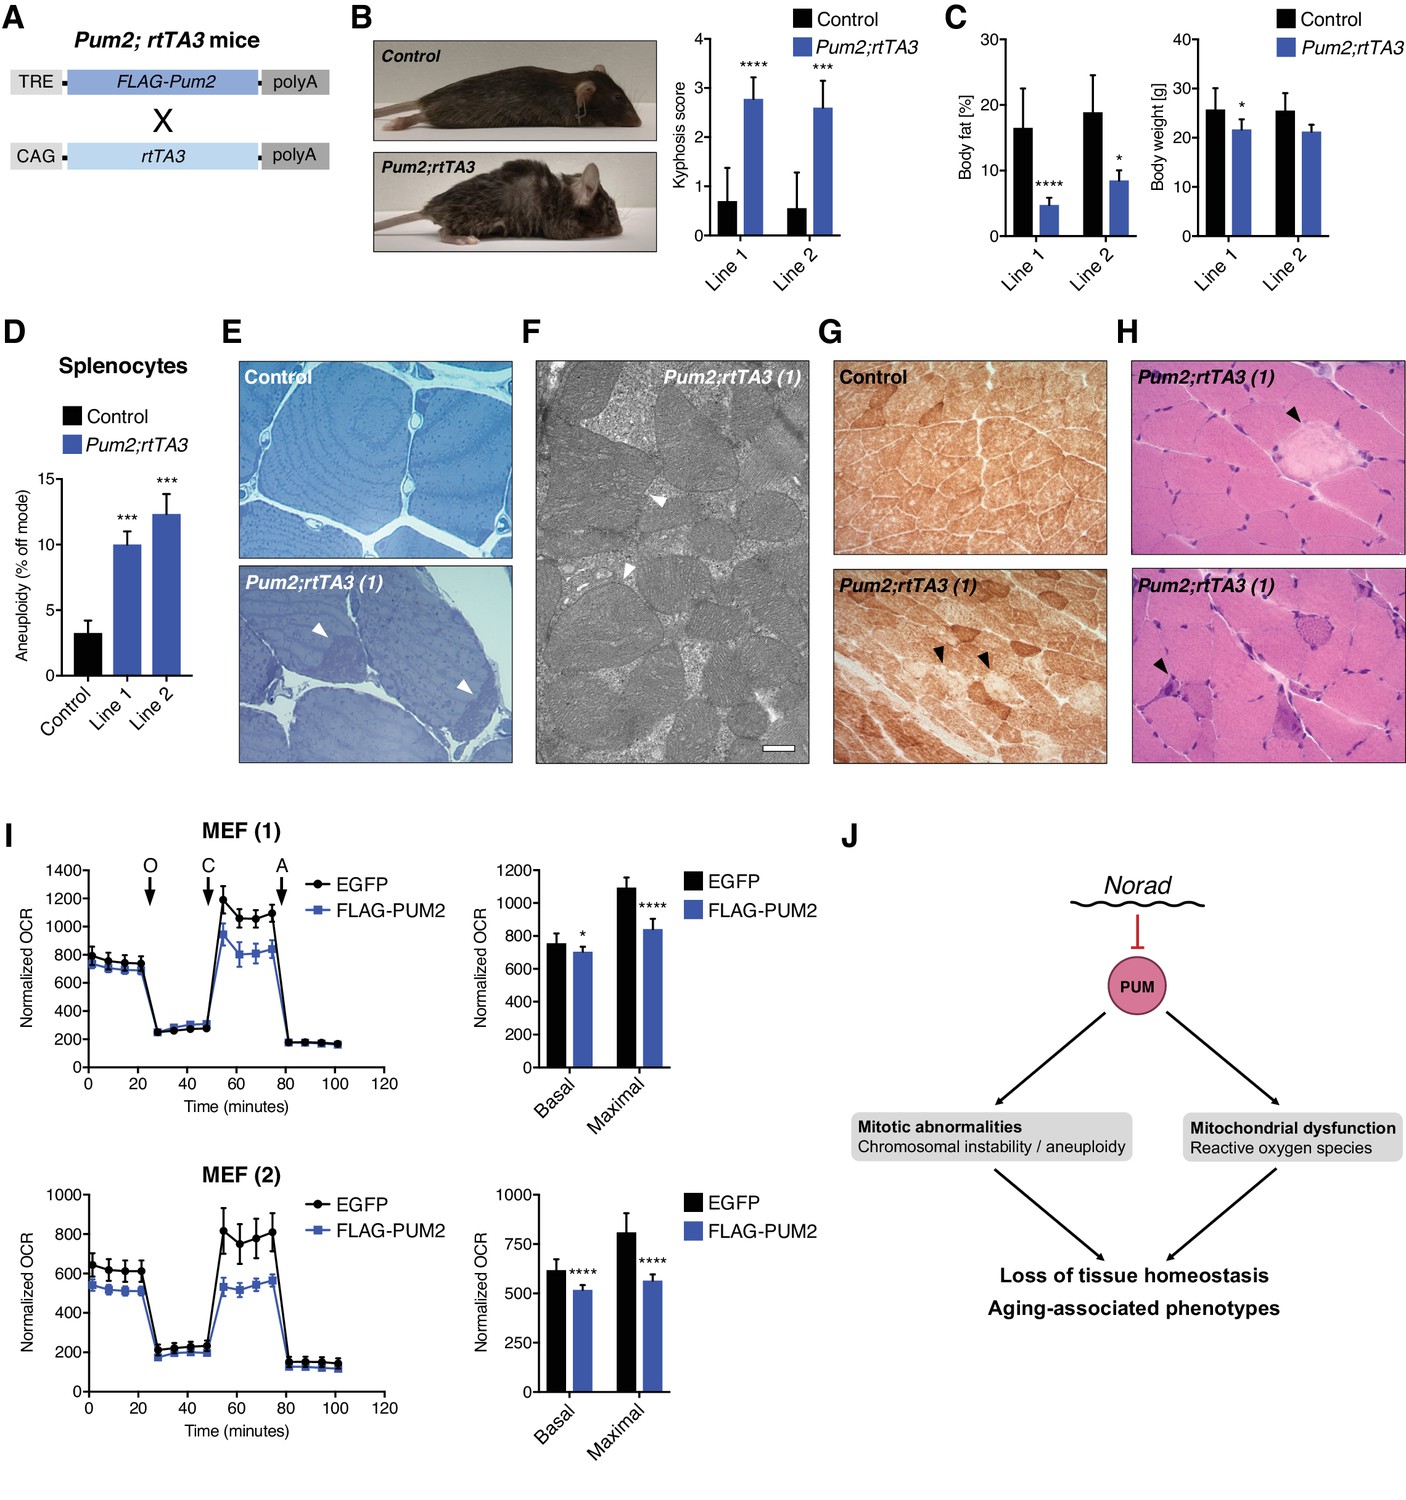
Enforced PUM2 expression phenocopies Norad loss of function.
(A) Schematic depicting transgenes in doxycycline (dox)-inducible Pum2 mice (TRE, TET responsive element; CAG, CAG promoter; rtTA3, reverse tetracycline-controlled transactivator 3; polyA, polyadenylation site). (B) Kyphosis in Pum2; rtTA3 mice. Kyphosis scores were determined in two independent transgenic lines after 1.5-2 months of dox treatment. Dox-treated littermate matched wild-type and single transgenic rtTA3 and Pum2 mice were used as controls (n = 5-10 mice per genotype per transgenic line). (C) Reduced body fat and weight in Pum2; rtTA3 mice after 1.5-2 months of dox treatment. Whole-body fat was quantified using NMR. Controls as in (B). (n = 7-12 (line 1) or 3-5 (line 2) mice per genotype). (D) Increased aneuploidy in Pum2; rtTA3 splenocytes. DNA FISH was performed and quantified using freshly-isolated splenocytes after 2 months of dox treatment as in Figure 4A. Controls represent dox-treated single transgenic rtTA3 and Pum2 mice from line 1. 100 interphase nuclei per mouse were scored (n = 3-4 mice per genotype). (E) Subsarcolemmal accumulation of mitochondria (arrowheads) in skeletal muscle of Pum2; rtTA3 (line 1) mice after 1.5 months of dox treatment. Representative dox-treated Pum2 single transgenic control shown. Semi-thin sections of soleus muscle were stained with toluidine blue. (F) Representative electron micrograph showing abnormally enlarged mitochondria with distorted cristae (arrowheads) in skeletal muscle (soleus) of dox-treated Pum2; rtTA3 (line 1) mice. Scale bar 500 nm. (G) COX histochemistry showing reduced COX activity in gastrocnemius muscle from a dox-treated Pum2; rtTA3 (line 1) mouse compared to littermate-matched dox-treated Pum2 single transgenic control. Arrowheads indicate muscle fibers with extreme reduction in COX activity. (H) Histologic analysis of H and E-stained sections of gastrocnemius muscle showing necrotic fibers (upper panel, arrowhead) and basophilic regenerating fibers (lower panel, arrowhead) in dox-treated Pum2; rtTA3 (line 1) mice. (I) Impaired respiration in immortalized MEFs transiently overexpressing FLAG-PUM2. Normalized oxygen consumption rates (OCR) (OCR/total protein) were analyzed in two different Norad+/+ MEF lines with either FLAG-PUM2 or EGFP overexpression using Seahorse analysis (n = 10-12 biological replicates per MEF line, O = oligomycin, C = CCCP, A = antimycin A). Basal and maximal respiration was determined from measurement 4 and 12, respectively. (J) Proposed mechanism for the aging-associated phenotypes associated with disruption of the Norad-PUMILIO axis. Data are represented as mean ± SD in (B)-(D) and (I), and p values were calculated using Student’s t test. *p ≤ 0.05, ***p ≤ 0.001, ****p ≤ 0.0001.
Figure 7—figure supplement 1
Enforced PUM2 expression phenocopies Norad loss of function.
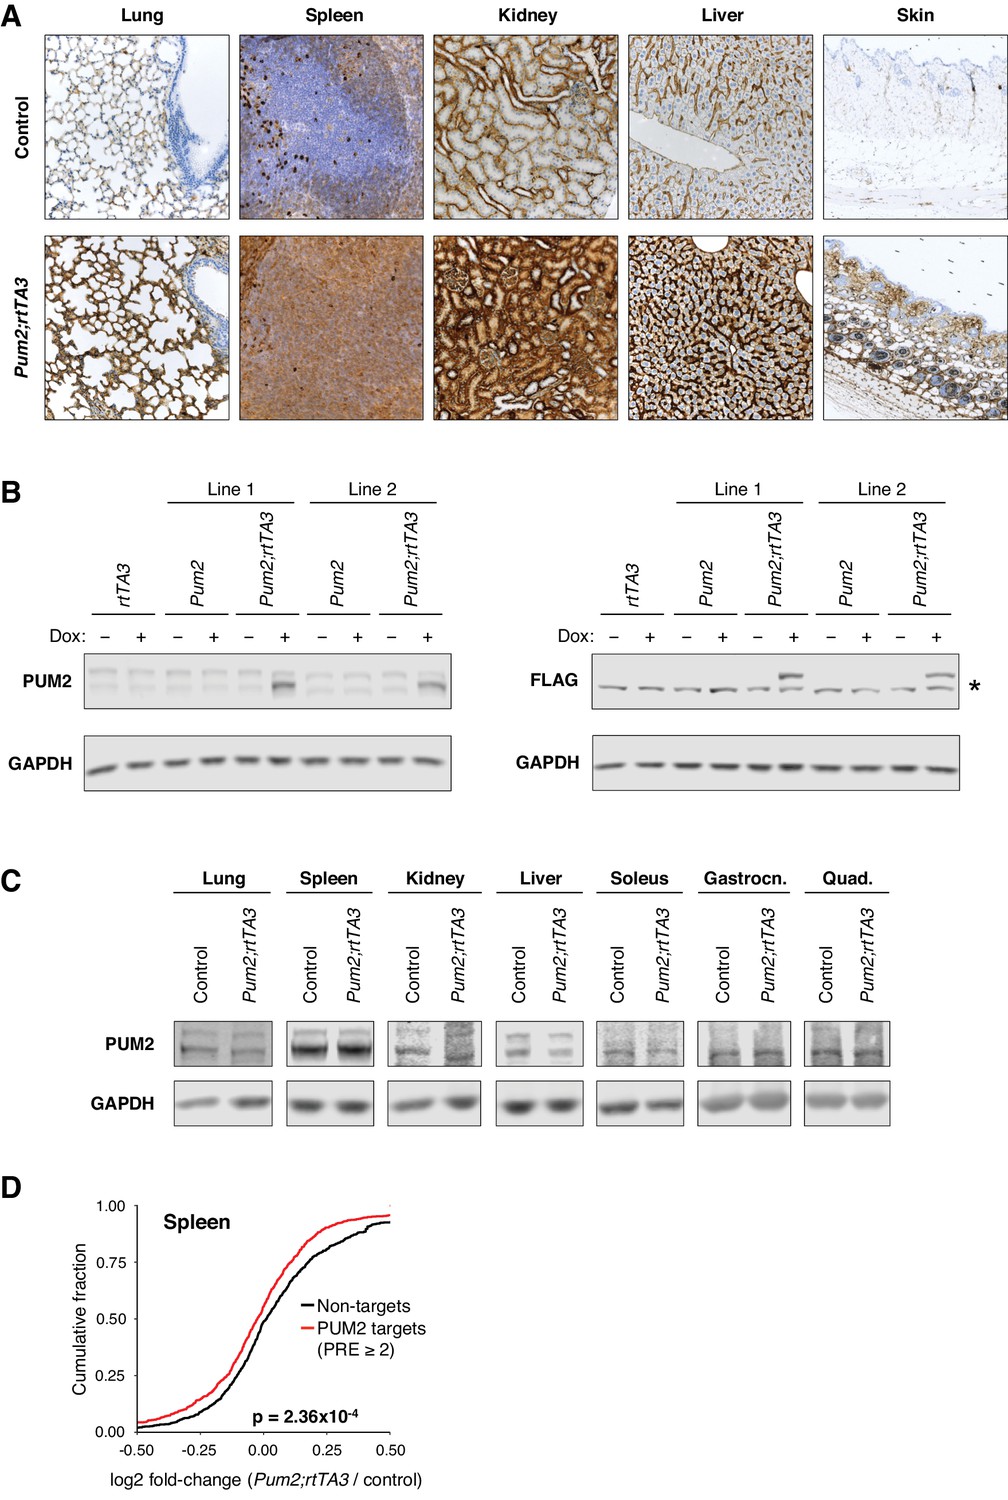
(A) Images of FLAG IHC in selected tissues from Pum2 single transgenic control or Pum2; rtTA3 (line 1) mice after 3.5–6.5 weeks of dox treatment. (B) Western blots showing total PUM2 (left) and FLAG-PUM2 (right) protein levels in MEF lines of indicated genotypes after 3 (line 2) or 4 (line 1) days of dox treatment. The doublet evident on the PUM2 blot is the result of alternative splicing of the Pum2 transcript, while the transgene specifically produces the smaller isoform. On the FLAG western, * indicates non-specific band. (C) Western blots showing total PUM2 protein levels in selected tissues from rtTA3 single transgenic control or Pum2; rtTA3 (line 1) mice after 3.5 weeks of dox treatment. (D) CDF plot comparing fold-changes of PUM2 CLIP targets detected in Norad–/– brains with at least two PREs and expressed at FPKM ≥ 1 in spleen to non-targets with similar expression and 3’ UTR lengths. Fold-changes calculated using spleen RNA-seq data from Pum2; rtTA3 mice vs. littermate-matched wild-type and single-transgenic Pum2 controls after 4 weeks of dox treatment.
Figure 7—figure supplement 2
Enforced PUM2 expression phenocopies Norad loss of function.
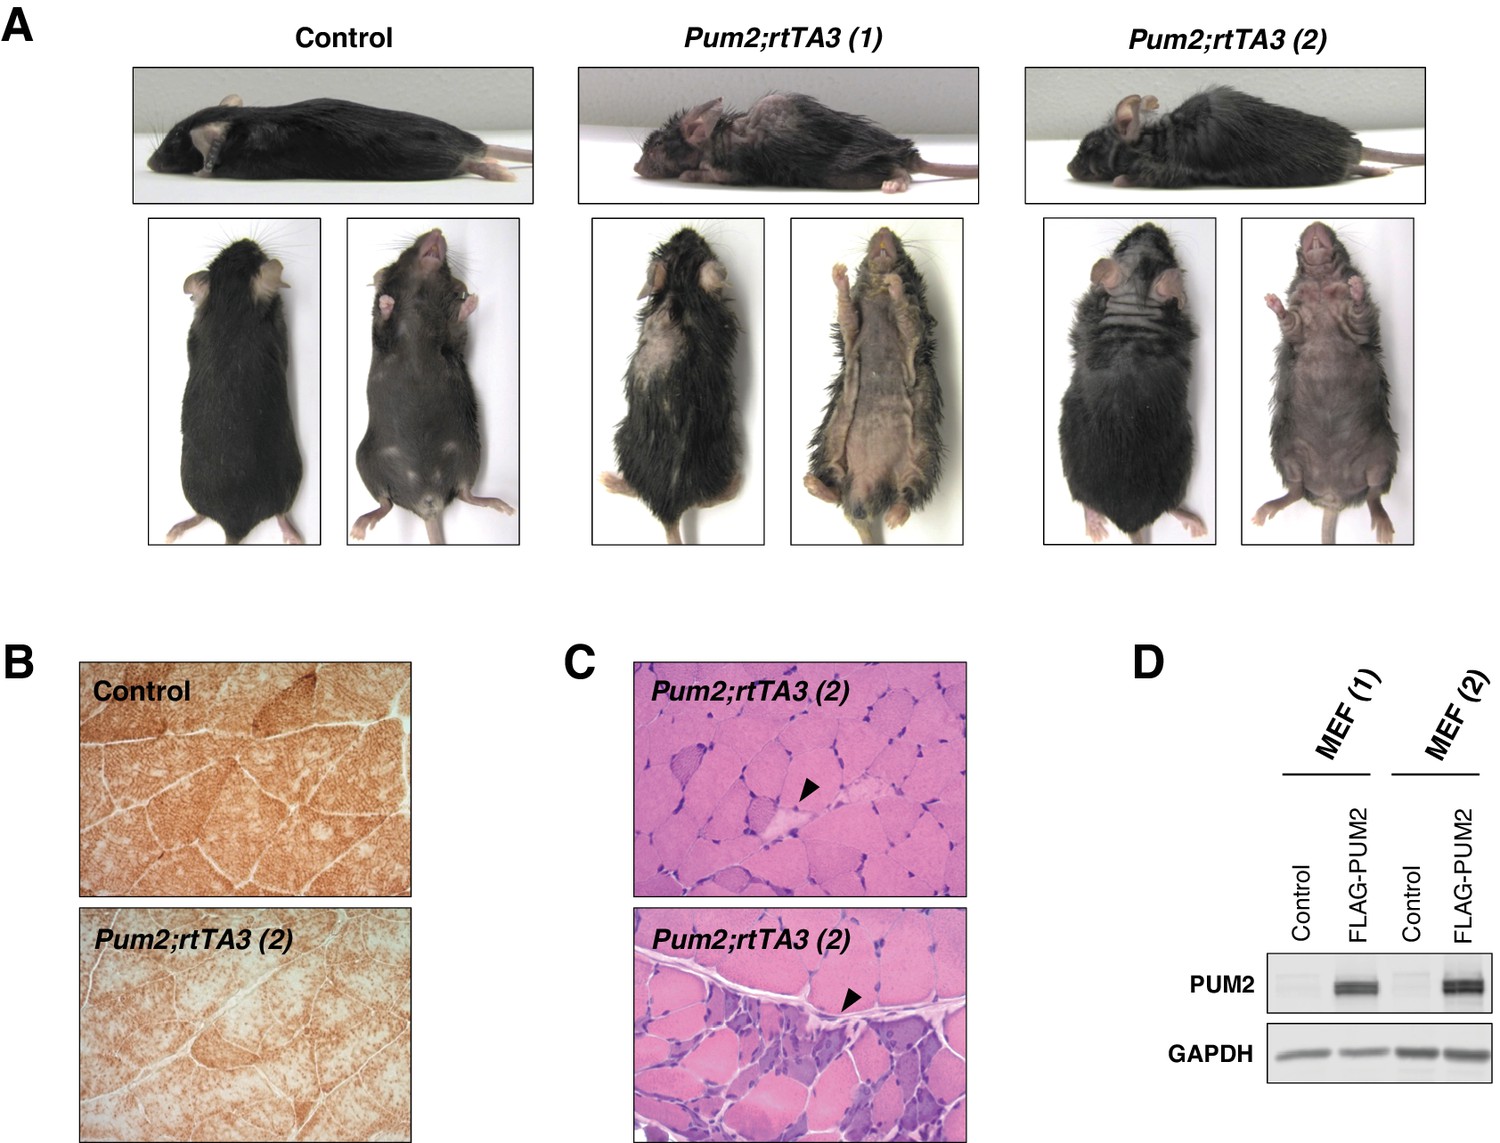
(A) Kyphosis and alopecia in Pum2; rtTA3 mice from two independent transgenic founders or a wild-type control after 2 months of dox treatment. (B) COX histochemistry showing globally reduced COX activity in gastrocnemius muscle of Pum2; rtTA3 (line 2) mice after 2 months of dox treatment compared to a dox-treated Pum2 single transgenic control. (C) Histologic analysis of H and E-stained sections of gastrocnemius muscle showing necrotic fibers (upper panel, arrowhead) and basophilic regenerating fibers (lower panel, arrowhead) in dox-treated Pum2; rtTA3 (line 2) mice. (D) Western blot showing expression of FLAG-PUM2 in transfected immortalized wild-type MEFs.
Figure 7—figure supplement 3

PUMILIO overexpression results in mitochondrial dysfunction in human HCT116 cells.
(A) Western blot of PUM1/2 in HCT116 cells with PUMILIO overexpression (OE). All samples originate from the same blot with irrelevant lanes cropped (indicated by the black line). (B) Increased mtDNA content in HCT116 cells with PUM1/2 overexpression. mtDNA was quantified by qPCR and normalized to nuclear DNA (n = 11-13 biological replicates per condition). (C) Impaired respiration in HCT116 cells with PUM1/2 overexpression. Normalized oxygen consumption rate (OCR) (OCR/total protein/mtDNA content) was determined using Seahorse analysis (n = 14-16 biological replicates per condition, O = oligomycin, C = CCCP, A = antimycin A). Basal and maximal respiration was determined from measurement 4 and 12, respectively. The quantification of the mtDNA content (B) and OCR (C) in HCT116 cells with PUM1/2 overexpression was performed at the same time as the respective experiments in NORAD–/– HCT116 cells (Figure 5 – figure supplement 2B,D). Therefore, the same HCT116 WT controls as in Figure 5 - figure supplement 2 are shown in this figure. Data are represented as mean ± SD in (B) and (C) except (C, left graph) which is represented as mean ± SEM. p values were calculated using Student’s t test. **p ≤ 0.01, ****p ≤ 0.0001.
Author response image 1
Tables
Key resources table
| Reagent type (species) or resource | Designation | Source or reference | Identifiers | Additional information |
|---|---|---|---|---|
| Gene (Mus musculus) | Norad (2900097C17Rik) | NA | Ensembl: ENSMUSG00000102869 | |
| Gene (Homo sapiens) | NORAD (LINC00657) | NA | Ensembl: ENSG00000260032 | |
| Genetic reagent (Mus musculus) | Norad-/- mice | This paper; see Materials and methods section Generation of mice with Norad deletion or enforced PUM2 expression | ||
| Genetic reagent (Mus musculus) | Pum2 (TRE-FLAG-Pum2) mice | This paper; see Materials and methods section Generation of mice with Norad deletion or enforced PUM2 expression | ||
| Genetic reagent (Mus musculus) | rtTA3 (CAG-rtTA3) mice | The Jackson Laboratory | Stock# 016532 | |
| Genetic reagent (Mus musculus) | C57BL/6J mice | UTSW Breeding Core | ||
| Cell line (Mus musculus) | Norad-/- primary MEFs | This paper; see Materials and methods section Generation and culture of mouse embryonic fibroblasts (MEF) | ||
| Cell line (Mus musculus) | Norad+/- primary MEFs | This paper; see Materials and methods section Generation and culture of mouse embryonic fibroblasts (MEF) | ||
| Cell line (Mus musculus) | Norad+/+ primary MEFs | This paper; see Materials and methods section Generation and culture of mouse embryonic fibroblasts (MEF) | ||
| Cell line (Mus musculus) | Norad-/- immortalized MEFs | This paper; see Materials and methods section Generation and culture of mouse embryonic fibroblasts (MEF) | ||
| Cell line (Mus musculus) | Norad+/+ immortalized MEFs | This paper; see Materials and methods section Generation and culture of mouse embryonic fibroblasts (MEF) | ||
| Cell line (Mus musculus) | rtTA3 primary MEFs | This paper; see Materials and methods section Generation and culture of mouse embryonic fibroblasts (MEF) | ||
| Cell line (Mus musculus) | Pum2 primary MEFs | This paper; see Materials and methods section Generation and culture of mouse embryonic fibroblasts (MEF) | ||
| Cell line (Mus musculus) | Pum2;rtTA3 primary MEFs | This paper; see Materials and methods section Generation and culture of mouse embryonic fibroblasts (MEF) | ||
| Cell line (Mus musculus) | Neuro-2a | ATCC | CCL-131 | |
| Cell line (Mus musculus) | CT26 | ATCC | CRL-2638 | |
| Cell line (Mus musculus) | Hepa1-6 | ATCC | CRL-1830 | |
| Cell line (Homo sapiens) | HCT116 | ATCC | CCL-247 | |
| Cell line (Homo sapiens) | NORAD-/- HCT116 | Lee et al. (2016) | ||
| Cell line (Homo sapiens) | PUM1 OE HCT116 | Lee et al. (2016) | ||
| Cell line (Homo sapiens) | PUM2 OE HCT116 | Lee et al. (2016) | ||
| Antibody | Anti-PUM2 (polyclonal goat) | Santa Cruz | sc-31535 | eCLIP |
| Antibody | Anti-PUM2 (monoclonal rabbit) | Abcam | ab92390 | WB (1:4000) |
| Antibody | Anti-PUM1 (monoclonal rabbit) | Abcam | ab92545 | WB (1:4000) |
| Antibody | Anti-GAPDH (monoclonal rabbit) | Cell Signaling | #2118 | WB (1:5000) |
| Antibody | Anti-FLAG (polyclonal rabbit) | Cell Signaling | #2368 | WB (1:1000) |
| Antibody | IRDye 800CW anti-rabbit (donkey) | Licor | 925–32213 | WB (1:10000) |
| Antibody | Anti-FLAG M2 (monoclonal mouse) | Sigma-Aldrich | F1804 | IHC |
| Antibody | Anti-4-HNE (polyclonal rabbit) | Abcam | ab46545 | IHC |
| Antibody | Anti-DNA/RNA Damage (monoclonal mouse) | Abcam | ab62623 | IF |
| Antibody | Anti-Digoxigenin (monoclonal mouse) | Roche | 11333062910 | RNA FISH |
| Antibody | Anti-Mouse IgG, Cy3 (polyclonal goat) | EMD Millipore | AP124C | RNA FISH |
| Recombinant DNA reagent | pTRE-Tight-FLAG-Pum2 | This paper; see Materials and methods section Generation of mice with Norad deletion or enforced PUM2 expression | ||
| Recombinant DNA reagent | pCAG-FLAG-Pum2 | This paper; see Materials and methods section FLAG-PUM2 overexpression in MEFs | ||
| Recombinant DNA reagent | pcDNA3-EGFP | This paper; see Materials and methods section FLAG-PUM2 overexpression in MEFs | ||
| Recombinant DNA reagent | pX330-U6-Chimeric_BB- CBh-hSpCas9 | Addgene | #42230 | |
| Sequence-based reagent | Mouse IDetect Point Probe Chr. 2 (red) | Empire Genomics | IDMP1002-R | DNA FISH |
| Sequence-based reagent | Mouse IDetect Point Probe Chr. 16 (green) | Empire Genomics | IDMP1016-1-G | DNA FISH |
| Sequence-based reagent | Norad (2900097C17Rik) TaqMan assay | Applied Biosystems | Mm04242407_s1 | qPCR |
| Sequence-based reagent | NORAD custom TaqMan assay | Lee et al. (2016) | N/A | qPCR |
| Commercial assay or kit | Total ROS ID Detection Kit | Enzo Life Sciences | ENZ-51011 | |
| Commercial assay or kit | 3-nitrotyrosine (3-NT) ELISA | Mybiosource | MBS262795 | |
| Chemical compound, drug | Tetramethylrhodamine ethyl ester (TMRE) | Enzo Life Sciences | ENZ-52309 | |
| Software, algorithm | Prism 7 | GraphPad Software | ||
| Software, algorithm | NGS QC Toolkit (v2.3.3) | Patel and Jain, 2012 | ||
| Software, algorithm | Tophat2 (v2.0.12) | Kim et al., 2013 | ||
| Software, algorithm | HISAT2 (v2.1.0) | Pertea et al., 2016 | ||
| Software, algorithm | FeatureCount (v1.4.6) and (v1.6.0) | Liao et al. (2014) | ||
| Software, algorithm | EdgeR (v3.8.6) and (v3.24.0) | Robinson et al. (2010) | ||
| Software, algorithm | Stringtie (v1.2.2) | Pertea et al., 2015 | ||
| Software, algorithm | BEDtools | Quinlan and Hall (2010) | ||
| Software, algorithm | Gene set enrichment analysis | Subramanian et al. (2005) | ||
| Software, algorithm | Database for Annotation, Visualization and Integrated Discovery (DAVID) | Huang et al., 2009a |
Additional files
-
Supplementary file 1
PUM2 eCLIP clusters in Norad+/+ and Norad–/– brain.
Genomic coordinates refer to mm10.
- https://doi.org/10.7554/eLife.42650.020
-
Supplementary file 2
Sequences of oligonucleotides used in this study.
- https://doi.org/10.7554/eLife.42650.021
-
Transparent reporting form
- https://doi.org/10.7554/eLife.42650.022
Download links
A two-part list of links to download the article, or parts of the article, in various formats.
Downloads (link to download the article as PDF)
Open citations (links to open the citations from this article in various online reference manager services)
Cite this article (links to download the citations from this article in formats compatible with various reference manager tools)
PUMILIO hyperactivity drives premature aging of Norad-deficient mice
eLife 8:e42650.
https://doi.org/10.7554/eLife.42650


