Connexin-43-dependent ATP release mediates macrophage activation during sepsis
- University of Bern, Switzerland
Figures
Figure 1 with 2 supplements
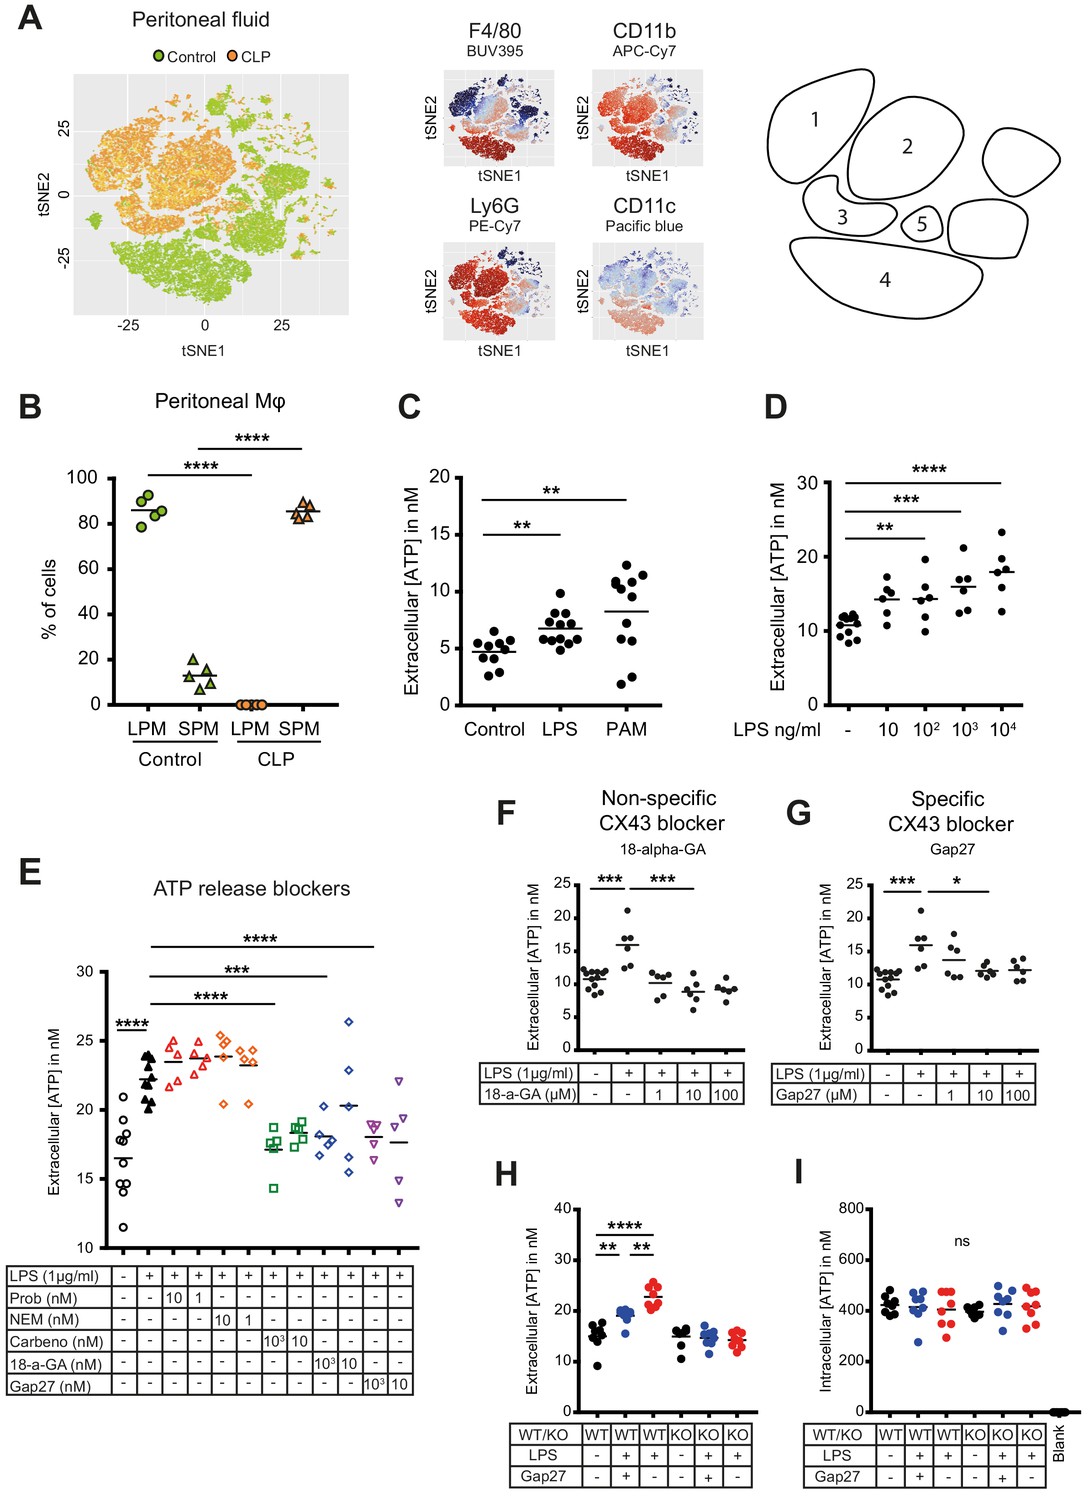
Small peritoneal macrophages release ATP during sepsis via Connexin-43 hemichannels.
(A) Intraperitoneal cell fractions characterised by flow cytometry in controls (green) and 10 hr after caecal ligation and puncture (CLP, orange) in a tSNE plot of viable (AmCyanlow) CD45high cells. Populations were defined based on F4/80 (BUV395), CD11b (APC/Cy7), Ly6G (PE-Cy7) and CD11c (Pacific blue). In response to CLP, elevated levels of neutrophils (1)/(2) (F4/80low, CD11bhigh, Ly6Ghigh) and small (infiltrating) peritoneal macrophages (3) (F4/80int, CD11bint) were observed but not large (resident) peritoneal macrophages (4) (F4/80high, CD11bhigh) or dendritic cells (5) (F4/80low, CD11blow, Ly6Glow, CD11chigh) (N = 5 animals per group). (B) Relative frequency of large (resident) peritoneal macrophages (LPM) and small (infiltrating) peritoneal macrophages (SPM) in the peritoneal cavity of controls (green) and 10 hr after CLP (orange) (N = 5 animals per group, one-way ANOVA). (C) Extracellular ATP levels in the supernatant of peritoneal macrophages after 30 min stimulation with LPS (TLR-4 agonist) or Pam3CSK4 (PAM, TLR-2 agonist). Cells were isolated from C57 Bl/6 WT mice (each dot is representative of an independent biological replicate, representative of more than five independent experiments, unpaired t-test). (D) Dose-dependent ATP release by peritoneal macrophages in response to LPS as quantified by a luciferin-luciferase assay (N = 12 (control) and 6 (LPS))*. (E) LPS-induced ATP release by macrophages can be blocked by carbenoxolone ((Carbeno) combined pannexin/connexin blockade), 18-alpha-GA (18-a-GA) global connexin blockade), Gap27 (specific blockade of Connexin 43 (CX43)) but not by probenecid ((Prob) pannexin channel blocker) and N-Ethylmaleimide ((NEM) blockade of vesicular exocytosis) (N = 10 (negative and positive controls) and 5 (blockers))*. (F–G) Non-specific (18-a-GA) and specific (Gap27) blocking of connexin hemichannels decreases LPS-induced ATP release from WT peritoneal macrophages in a dose-dependent manner (N = 12 (negative control) and 6 (treated groups), negative and positive controls were the same for both experiments)*. (H) LPS-induced ATP release from WT compared to MAC-CX43 KO peritoneal macrophages with and without specific CX43 blocking (N = 8)*. (I) LPS-induced ATP release has no impact on intracellular ATP levels (N = 8)*. *Data represent independent biological replicates, compared by unpaired t-test and are representative of three or more independent experiments.
Figure 1—figure supplement 1
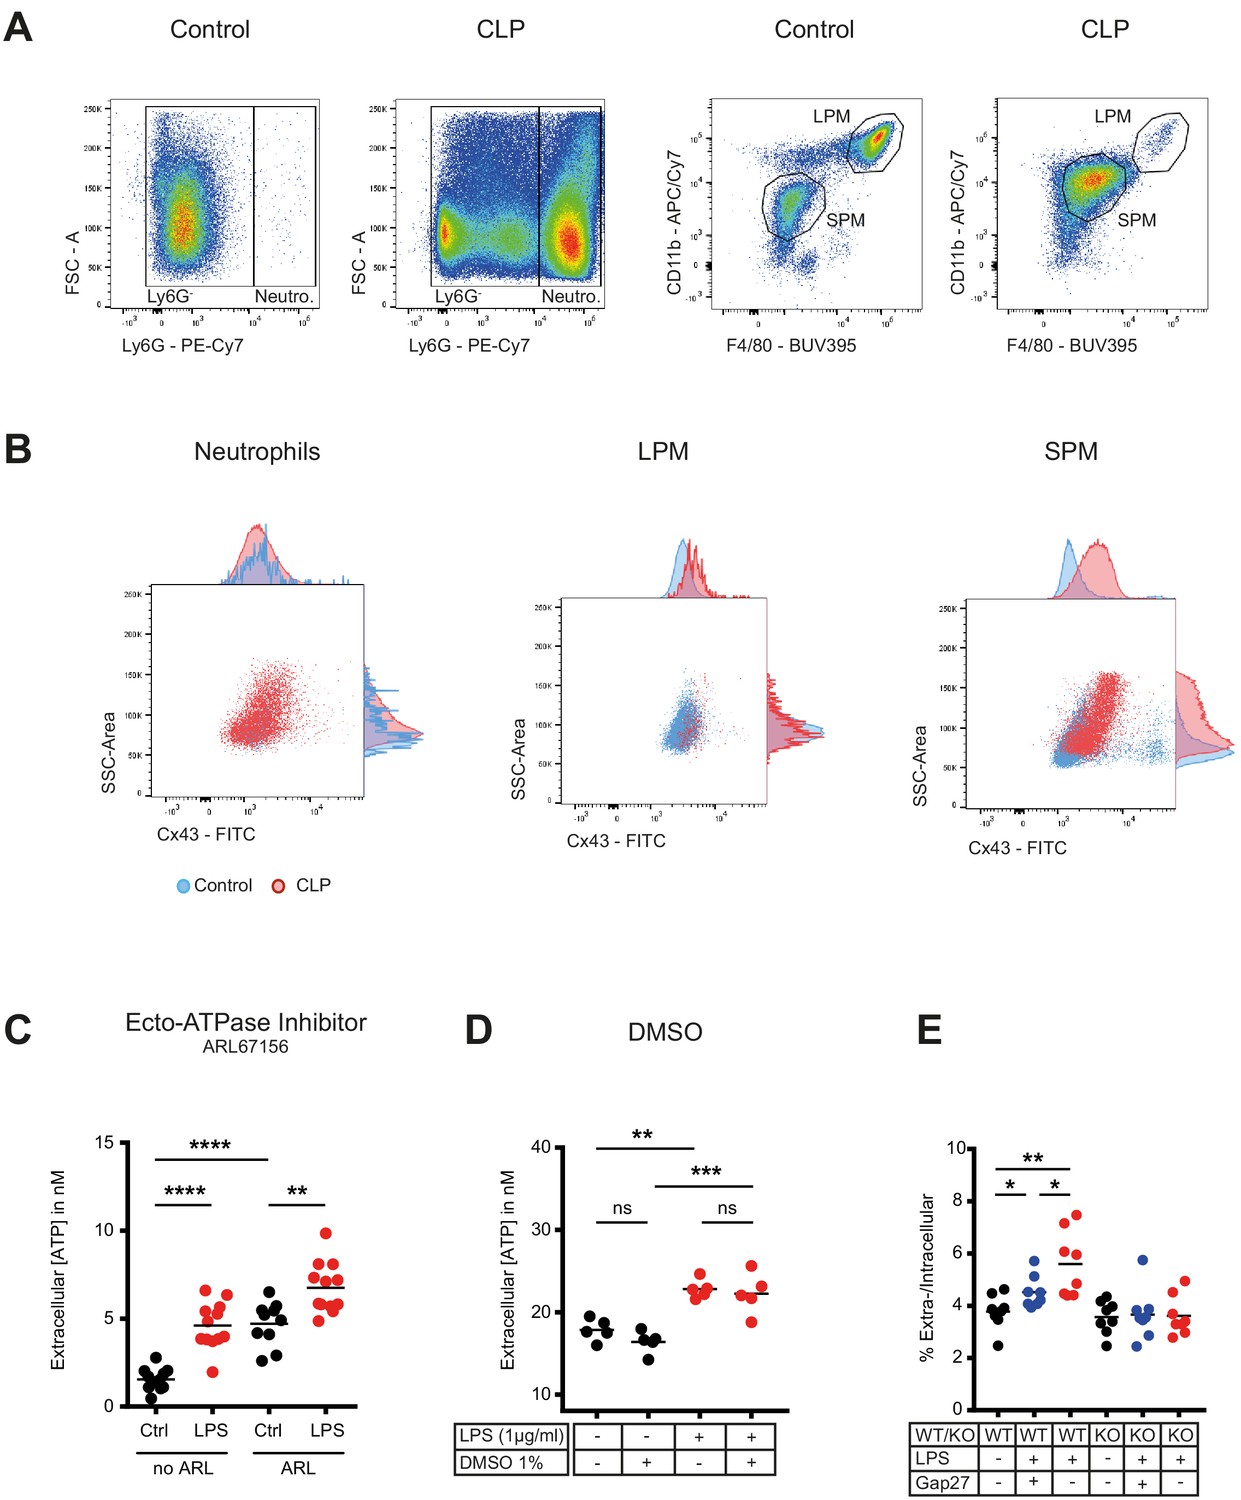
Flow cytometry gating strategy for peritoneal inflammatory cells and characterization of ATP release from peritoneal macrophages.
(A) Flow cytometry gating strategy for inflammatory cells isolated from the peritoneal cavity. Identified peritoneal macrophages subsets in controls versus 10 hr after caecal ligation and puncture (CLP). Large (resident) peritoneal macrophages (LPM) were defined as viable (AmCyanlow), CD45high, Ly6Glow, F4/80high and CD11b high cells. Small (infiltrating) peritoneal macrophages (SPM) were defined as viable (AmCyanlow), CD45high, Ly6Glow, F4/80int and CD11bint cells. Neutrophils were defined as viable (AmCyanlow), CD45high, Ly6Ghigh cells. (B) CX43 expression determined by flow cytometry in neutrophils, LPM and SPM in controls (blue) versus 10 hr after CLP (red). (C) Impact of Ecto-ATPase inhibitor ARL67156 on extracellular ATP levels measured by a luciferin-luciferase assay in the supernatant of peritoneal macrophages stimulated or not with LPS 1 µg/ml (unpaired t-test)*. (D) DMSO had no impact on LPS-induced ATP release from peritoneal macrophages (N = 5, one-way ANOVA)*. (E) ATP present in the extracellular space of peritoneal macrophages expressed as percentage of their intracellular ATP content (N = 8, one-way ANOVA)*. *Data represent independent biological replicates and are representative of three or more independent experiments.
Figure 1—figure supplement 2
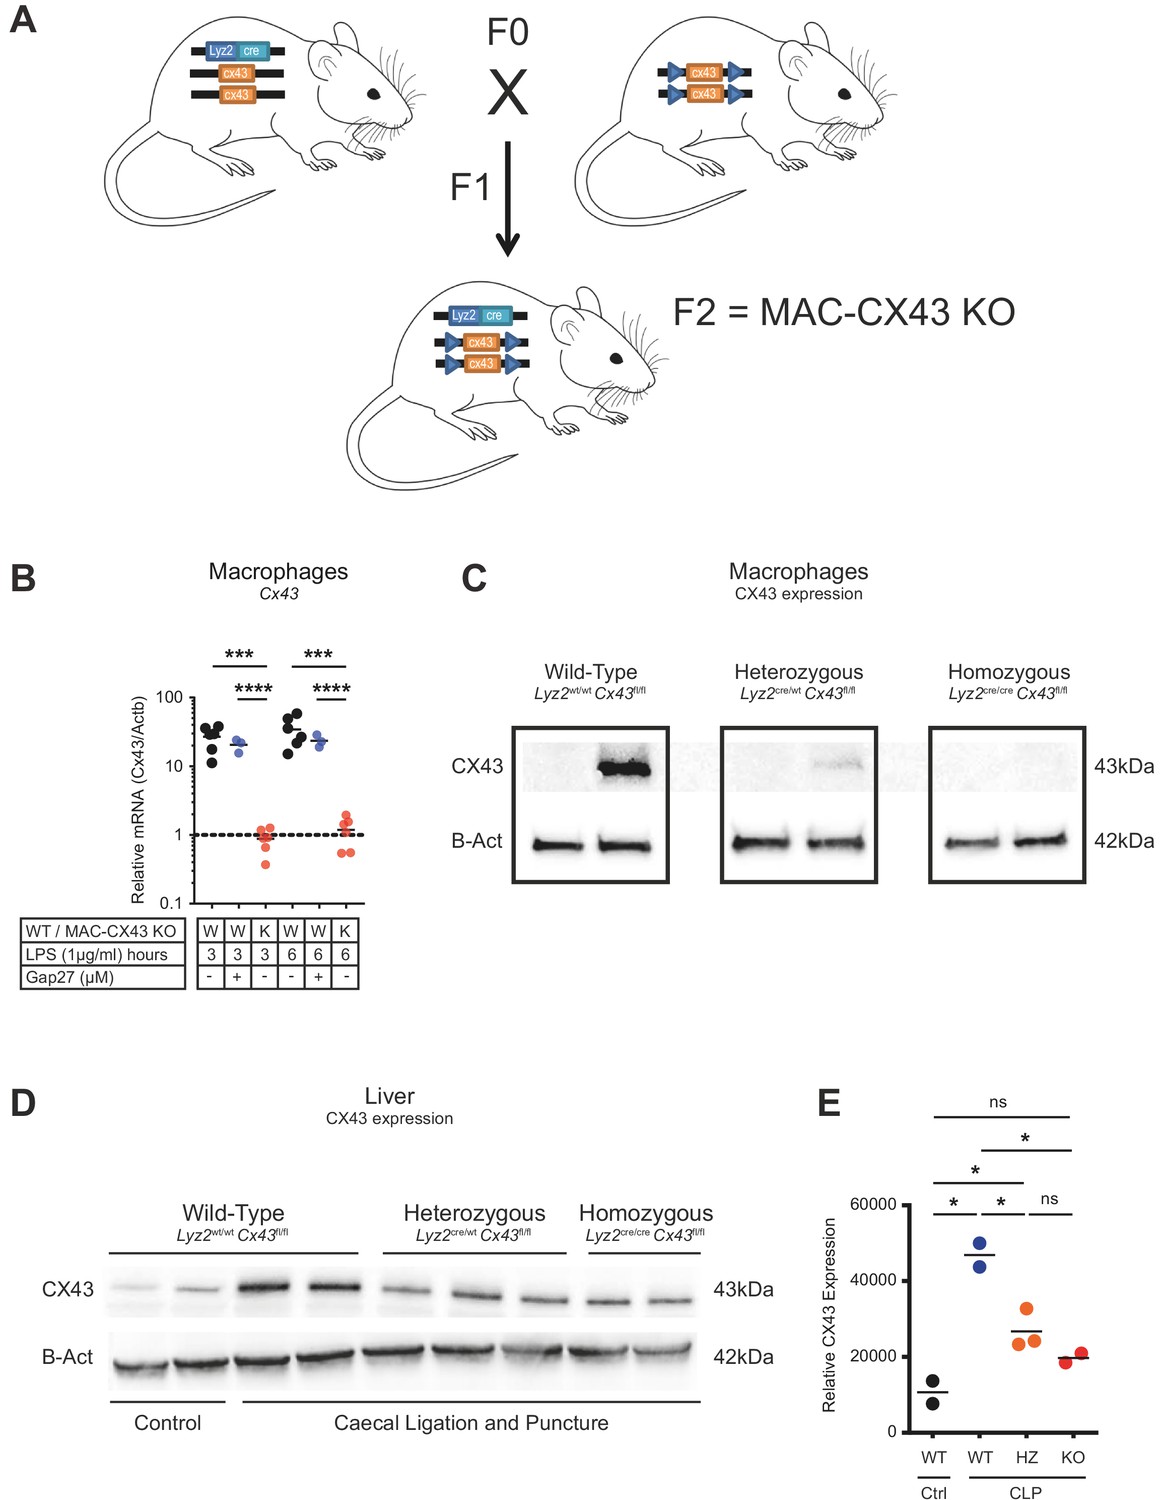
Generation of conditional MAC-CX43 KO.
(A) Schematic representation of our conditional Connexin-43 KO mouse model (MAC-CX43 KO). (B) Gja1 (Cx43) mRNA expression in LPS (1 µg/ml)-stimulated peritoneal macrophages isolated from MAC-CX43 KO mice and from wild-type controls treated or not with Gap27*. (C) CX43 protein expression levels in LPS (1 µg/ml)-stimulated peritoneal macrophages isolated from control mice (Lyz2wt/wt, Gja1flox/flox), heterozygous mice (Lyz2cre/wt, Gja1flox/flox) and homozygous mice (Lyz2cre/cre, Gja1flox/flox). (D) CLP was performed in mice with the same genetic background and CX43 protein expression was quantified in the liver. (E) Relative quantification of CX43 protein expression (unpaired t-test). *Data represent independent biological replicates, compared by unpaired t-test and are representative of three or more independent experiments.
Figure 2 with 1 supplement
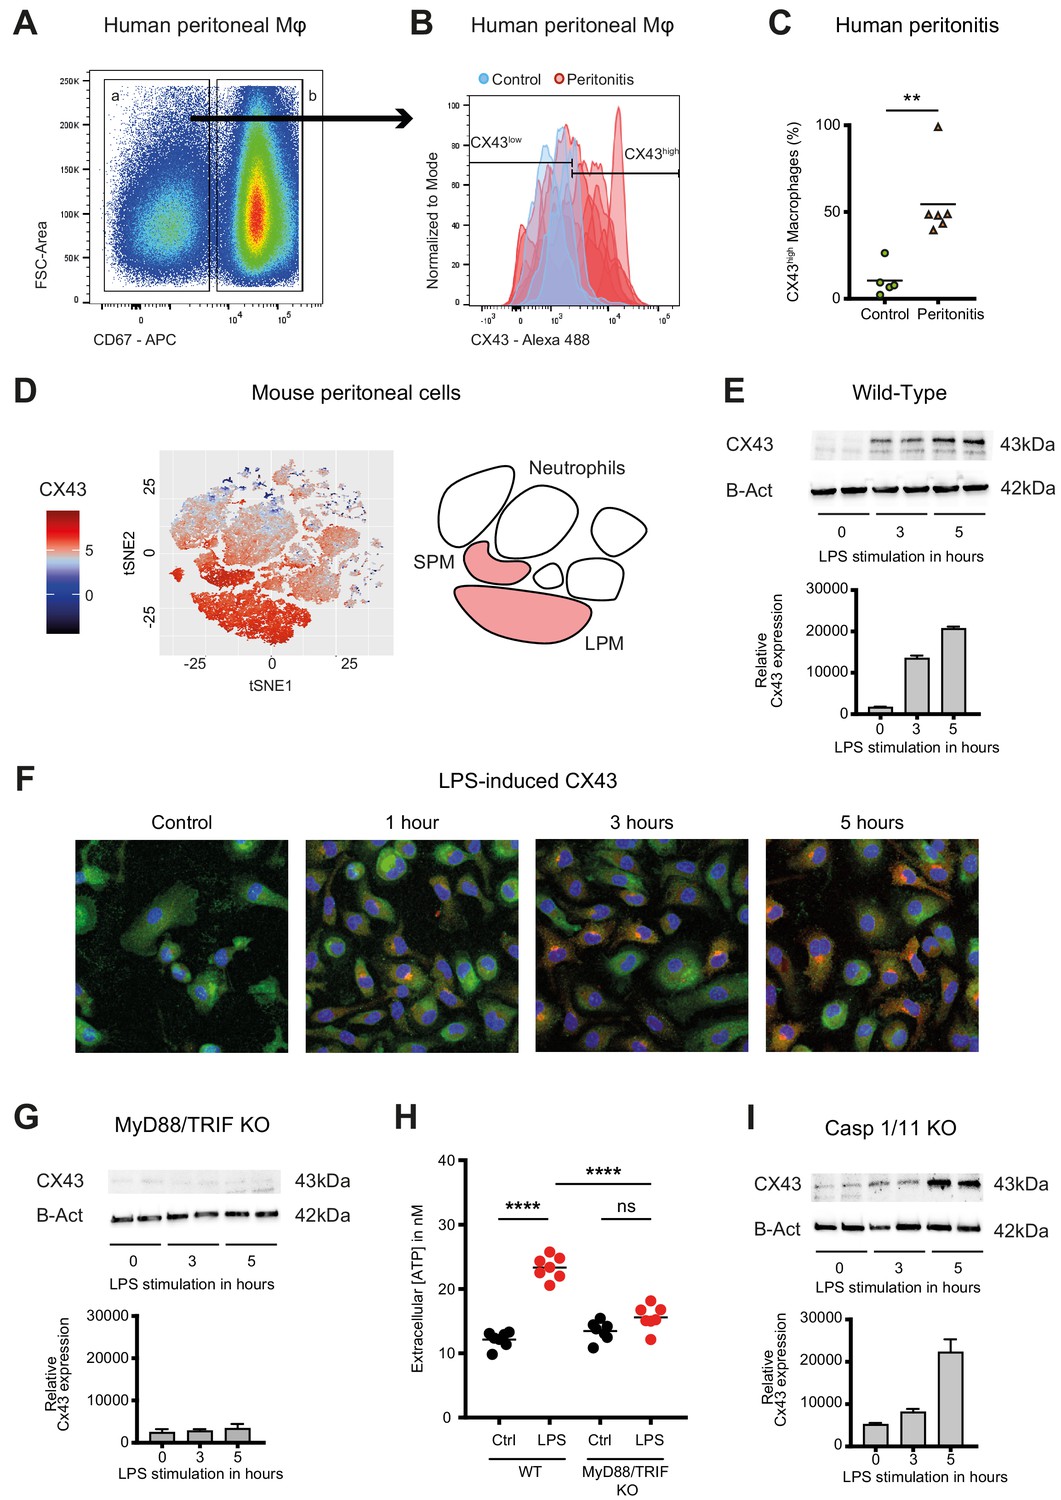
Connexin-43 expression is induced on macrophages in a MyD88/TRIF dependent manner.
(A) Flow cytometry gating strategy for human inflammatory cells isolated from fluids obtained from peritoneal lavage during abdominal operations. Macrophages were defined as viable (AmCyanlow), CD45high, CD3low, CD19low, CD56low, CD11clow, CD16high and CD67low cells. (B) CX43 expression level on macrophages isolated from patients with peritonitis (red) compared to control patients (blue). (C) Percentage of CX43high macrophages in the peritoneal fluid collected from control patients without peritoneal inflammation (green) compared to patients with peritonitis (orange) (N = 5 patients in control group and N = 6 patients in peritonitis group, Mann-Whitney test). (D) Specific CX43 expression (Alexa Fluor 488) in macrophages (small and large peritoneal macrophages, SPM and LPM) among peritoneal viable (AmCyanlow) CD45high cells (N = 5 animals per group, tSNE analysis as described in statistical methods). (E–F) Increased expression of CX43 in peritoneal macrophages following stimulation with LPS (1 µg/ml) for the indicated time-points (Western blot: N = 2 independent biological replicates per time-point, quantification of immunoblots using ImageJ, unpaired t-test. Immunofluorescence: PE-Texas red = CX43; FITC = F4/80; blue = DAPI). (G) Abrogated CX43 protein expression in peritoneal macrophages from MyD88/TRIF double KO mice upon stimulation with LPS 1 μg/ml (N = 2 mice per time-point, quantification of immunoblots using ImageJ, unpaired t-test). (H) LPS-induced ATP release from murine WT compared to MyD88/TRIF KO peritoneal macrophages (N = 7 independent biological replicates, one-way ANOVA). (I) CX43 protein expression in peritoneal macrophages from caspase 1/11 double KO mice upon stimulation with LPS 1 μg/ml (N = 2 mice per time-point, quantification of immunoblots using ImageJ, unpaired t-test). Full uncut western blot membranes are available in Source data 1.
Figure 2—figure supplement 1
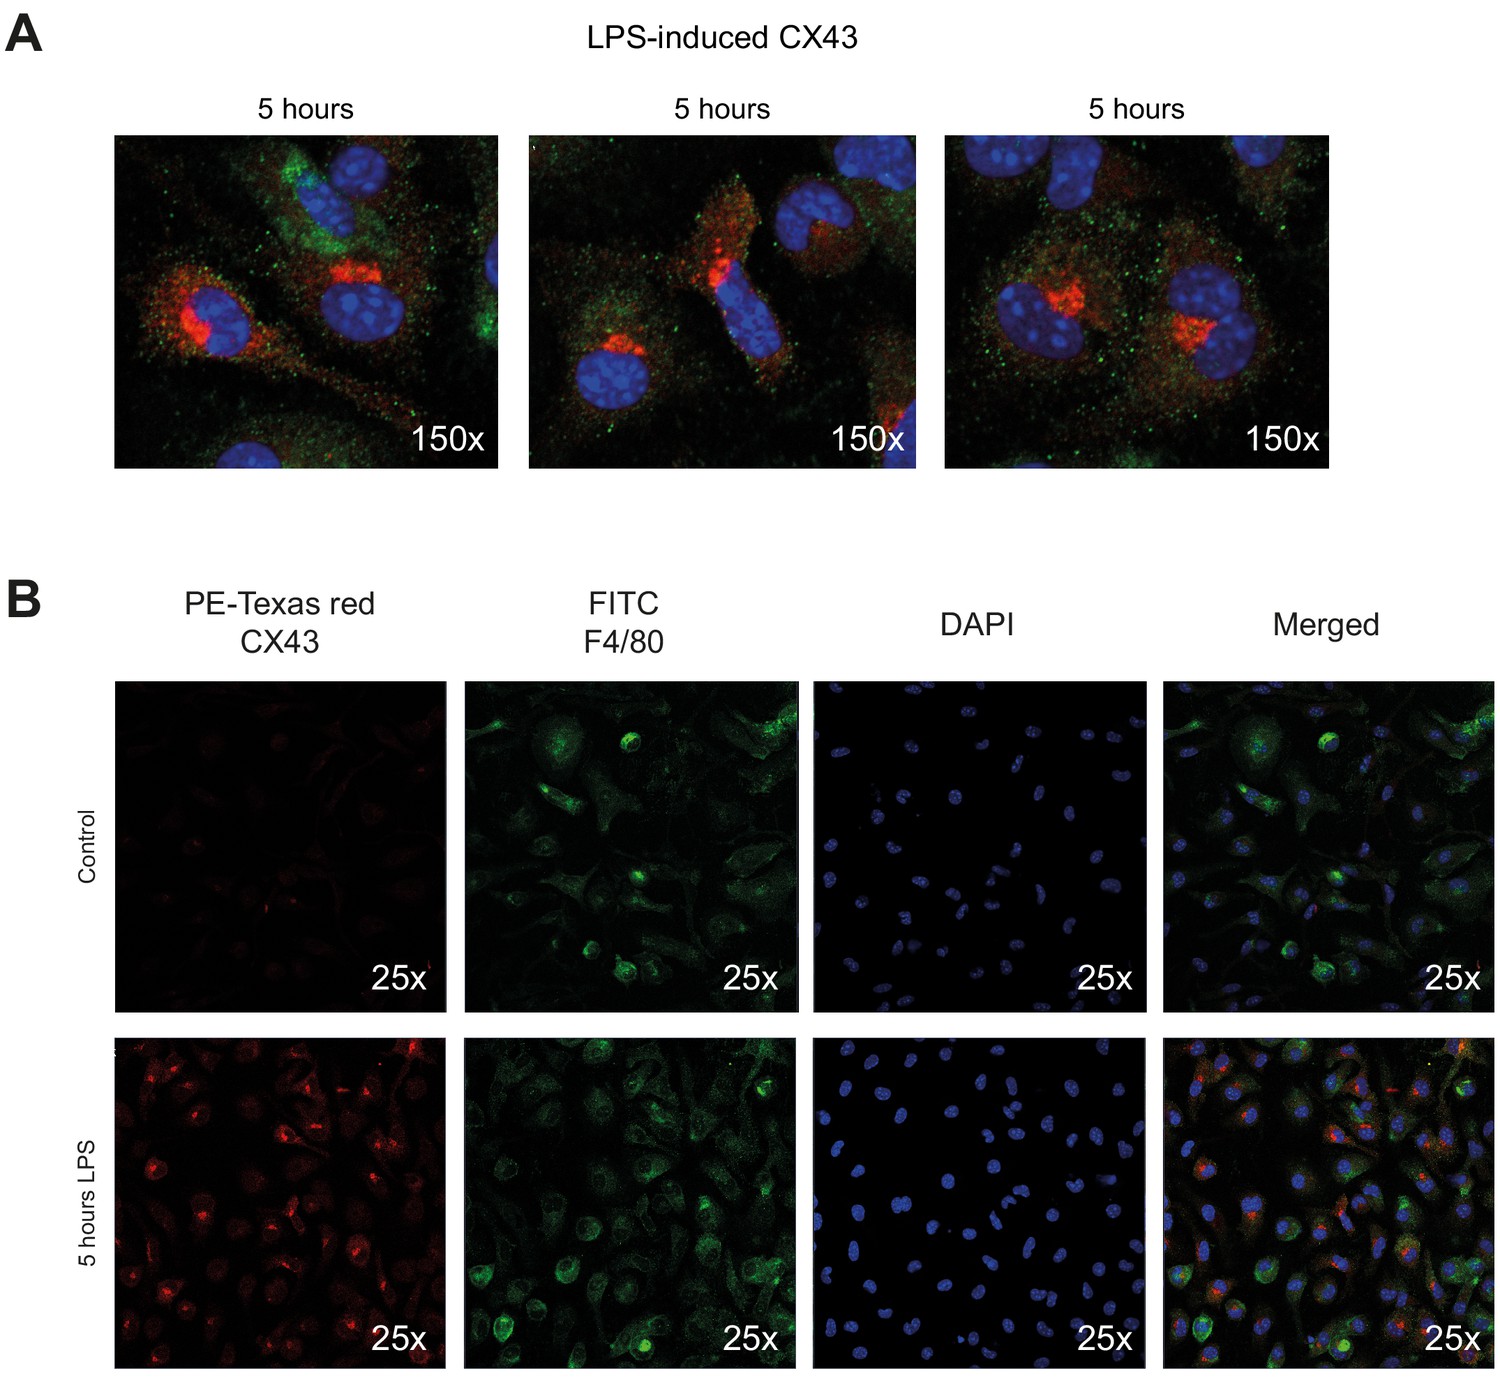
Connexin-43 expression on peritoneal macrophages.
(A) Increased expression of CX43 in peritoneal macrophages after 5 hr LPS stimulation (1 µg/ml). (B) Single channel staining for PE-Texas Red-labelled CX43, FITC-labelled F4/80 and DAPI.
Figure 3 with 1 supplement
Connexin-43 expressing macrophages are recruited systemically during sepsis.
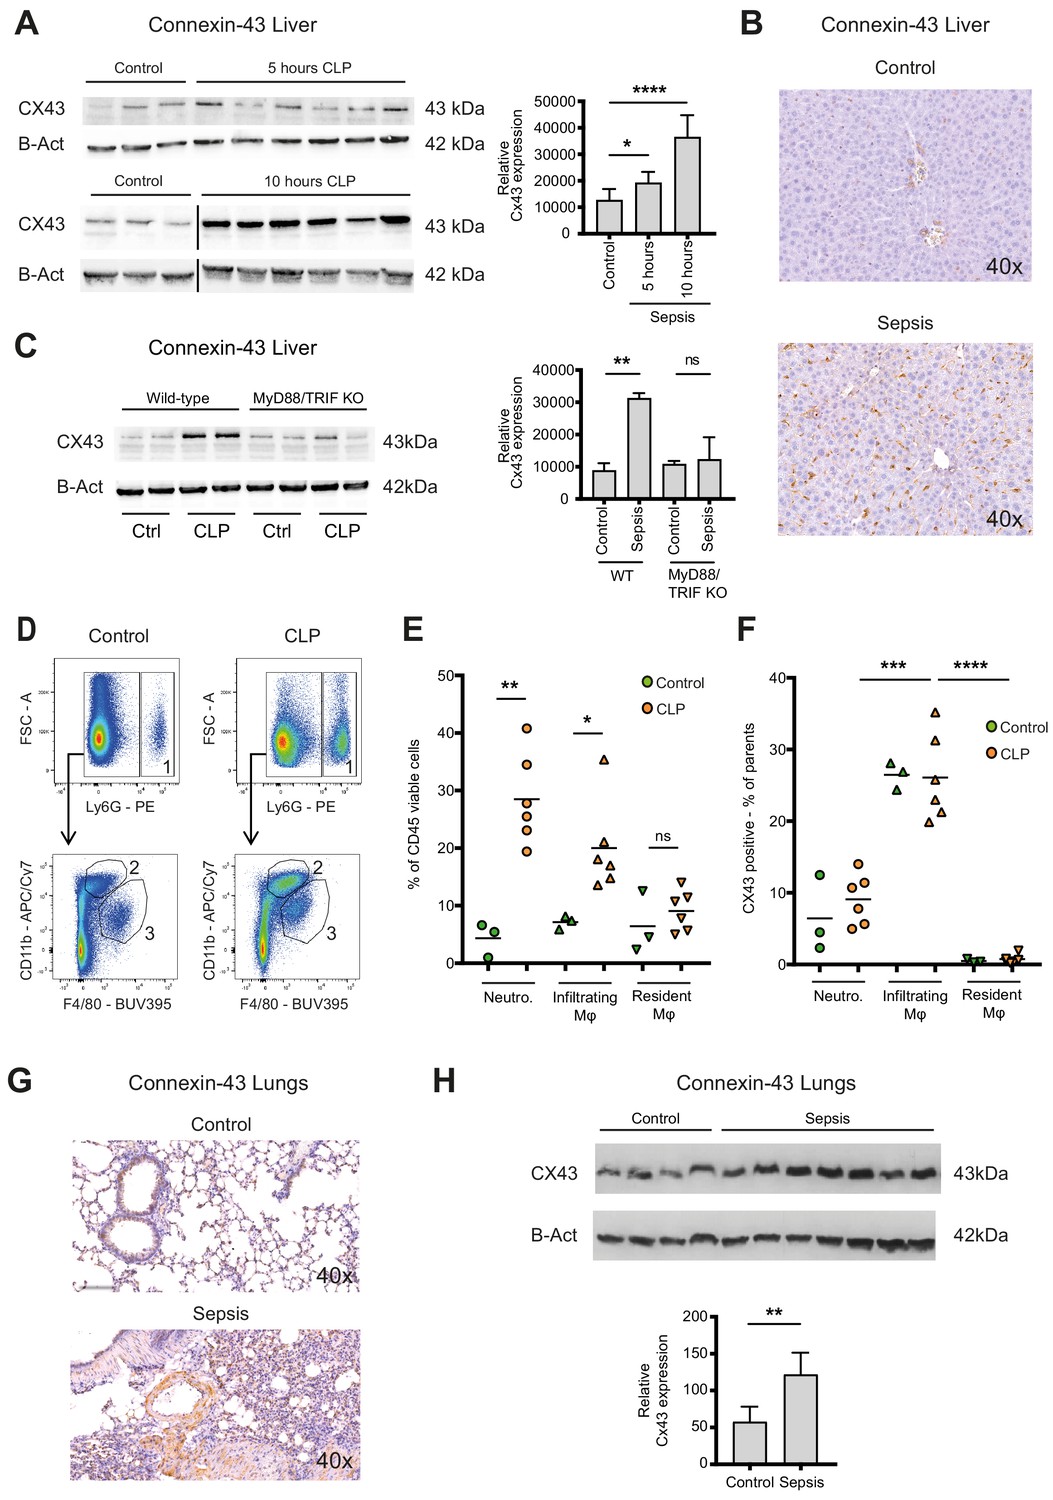
(A) Elevated CX43 protein expression in the liver 5 and 10 hr after CLP compared to controls (N = 3 animals in each control group from the gels at 5 hr and 10 hr, all used for the calculation of the histogram) and N = 6 animals for each time point, unpaired t-test). (B) Elevated expression of CX43 on non-parenchymal cells in the liver 10 hr after CLP compared to controls. (C) Abrogated CX43 protein expression in the liver of MyD88/TRIF double KO mice 10 hr after CLP (N = 2 mice per group, unpaired t-test). (D–E) Following CLP (orange), neutrophils (1) and infiltrating macrophages (2) increased in the liver, while resident macrophages (3) remained constant compared to controls (green). (F) Infiltrating macrophages highly expressed CX43 levels while neutrophils (1) and resident macrophages (3) were CX43 low (N = 3 animals in control group and N = 6 animals in CLP group, unpaired t-test). (G, H) Elevated expression of CX43 on non-parenchymal cells in the lungs in response to CLP compared to control mice (N = 4 animals in control group and N = 7 animals in CLP group, unpaired t-test). Full uncut western blot membranes are available in Source data 1.
Figure 3—figure supplement 1
Connexin-43 expression in the liver.
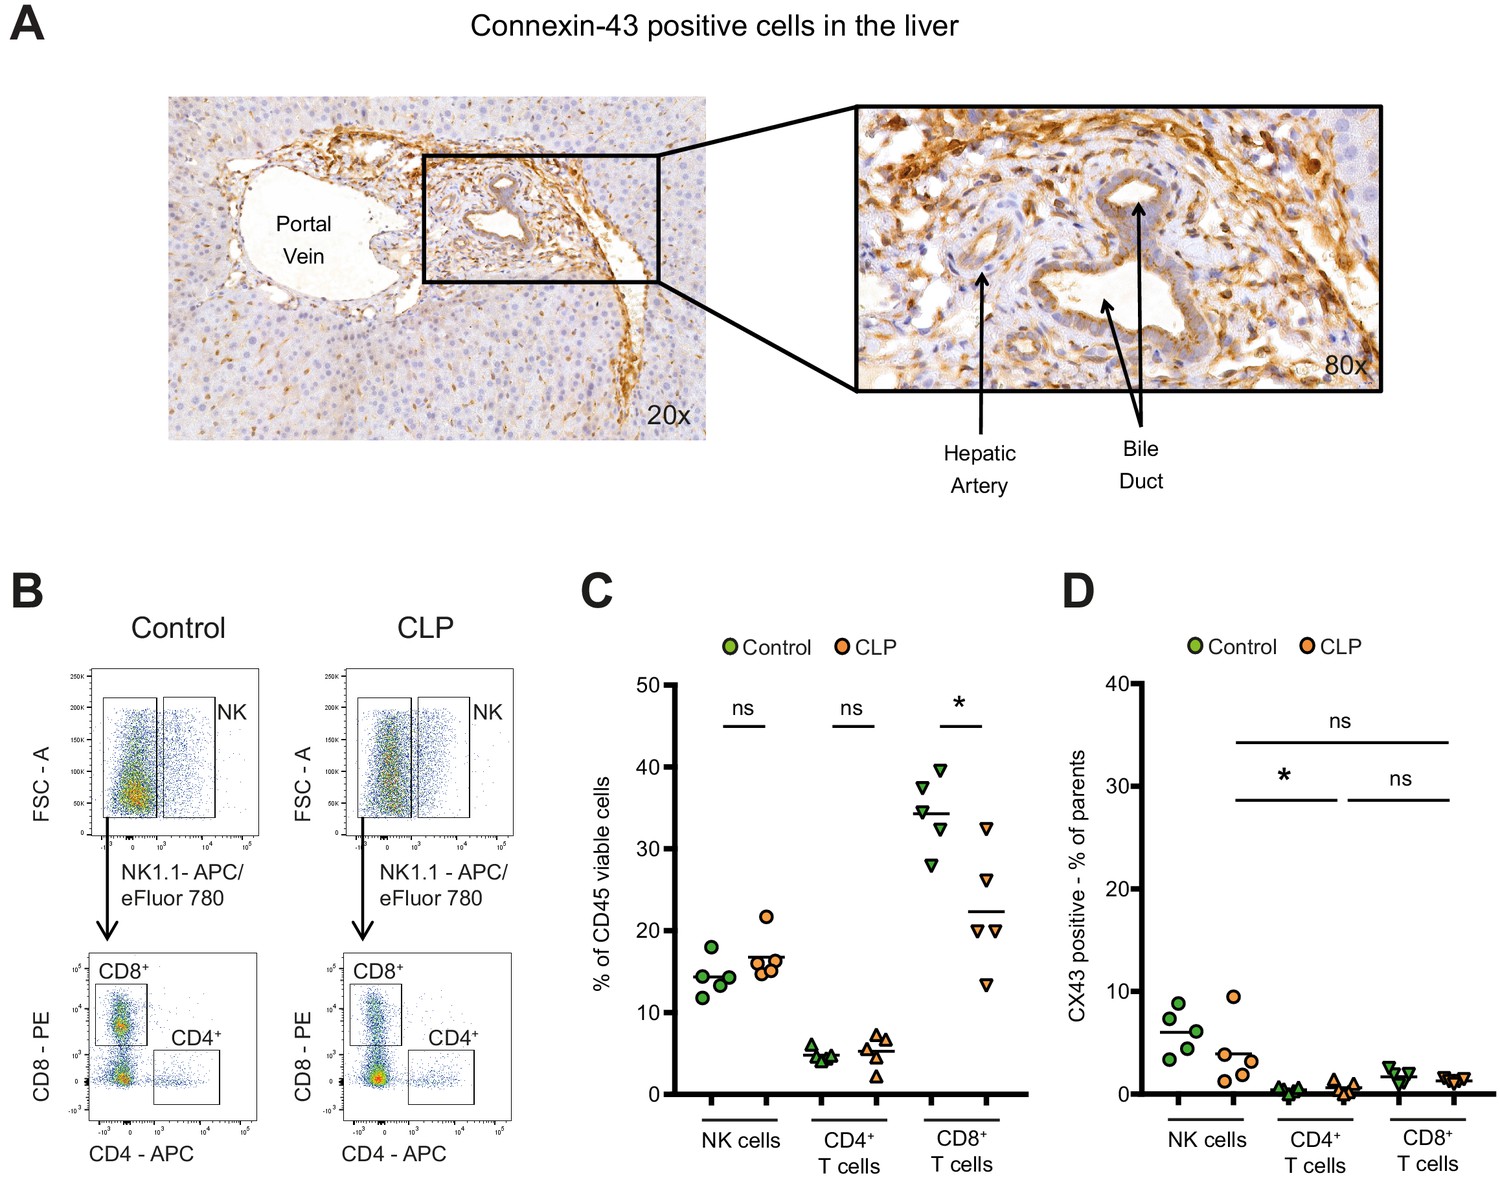
(A) Expression of CX43 in the liver 10 hr after CLP. Data are representative of >3 experiments. (B–C) Following CLP (orange), CD8 positive cytotoxic T cells decreased in the liver, while NK cells and CD4 positive T helper cells remained constant compared to controls (green). (D) Hepatic NK cells, CD4 positive T helper cells and CD8 positive cytotoxic T cells were CX43 low compared to infiltrating macrophages (N = 5 animals per group, one-way ANOVA).
Figure 4 with 3 supplements
Connexin-43-mediated local and systemic ATP release contributes to macrophage over-activation via P2Y1.
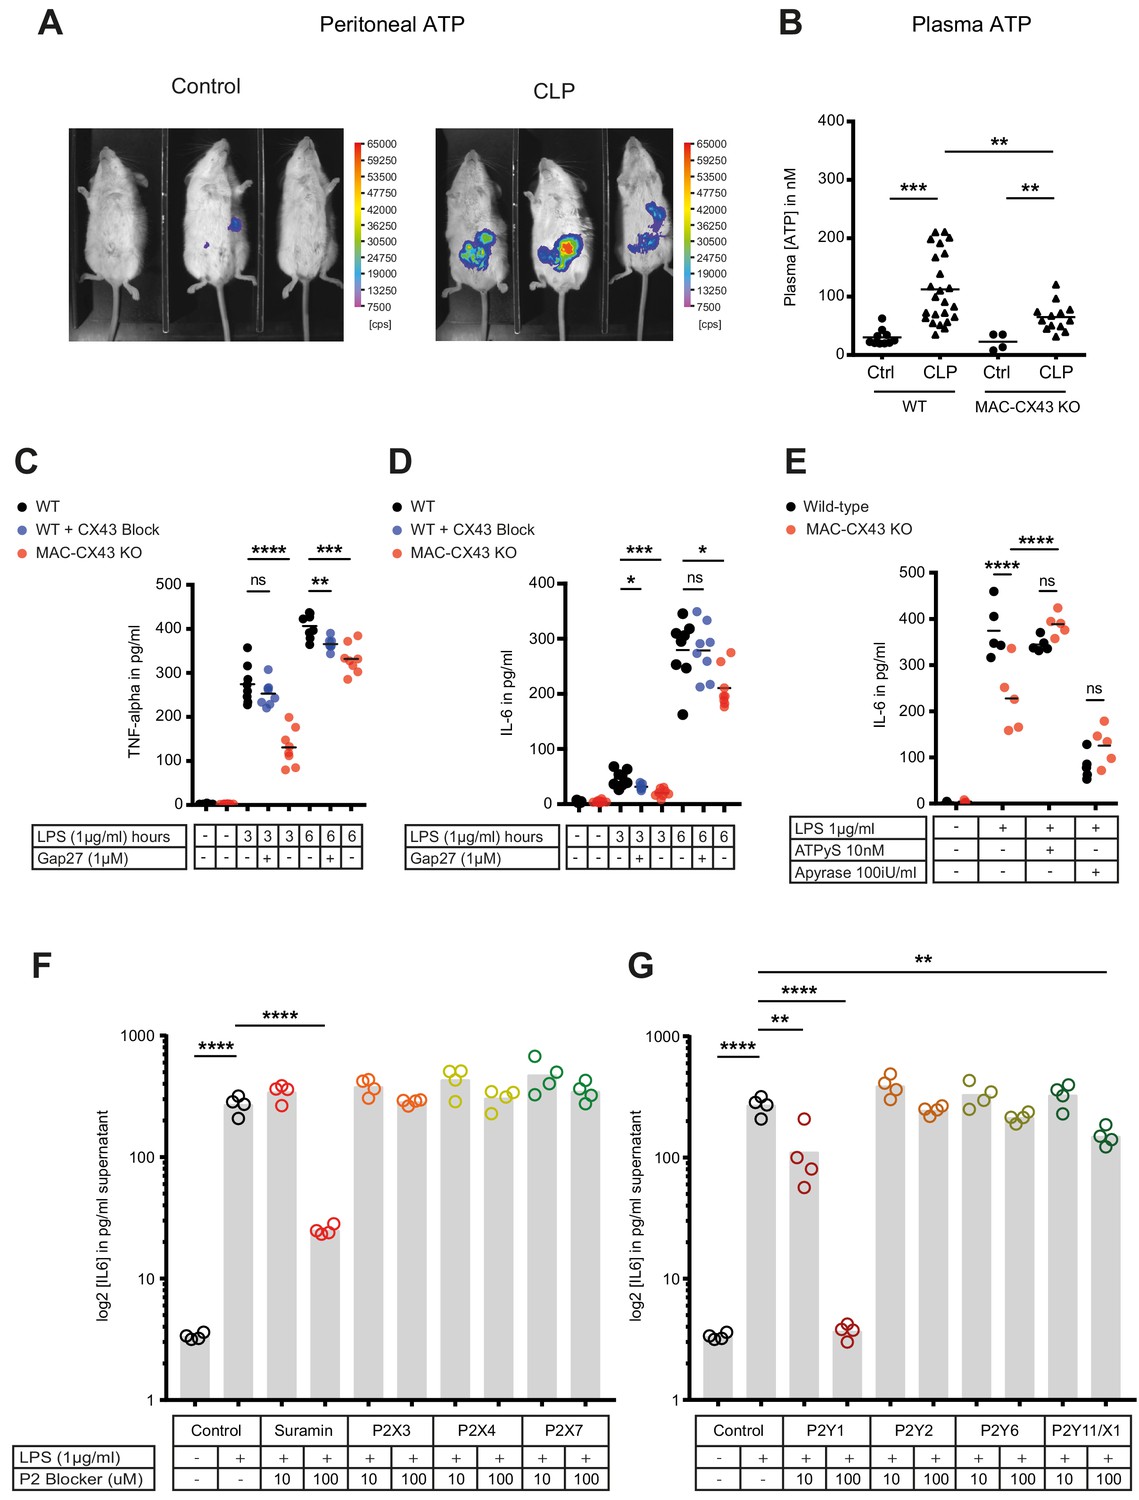
(A) Extracellular ATP levels as assessed by luminescence of i.p. injected 5 × 10⁶ HEK293-pmeLUC D-luciferin activated cells (in counts per second (cps)). Luminescence was significantly higher 10 hr after CLP compared to sham-operated controls. (B) Direct measurement of extracellular ATP in the plasma collected from vena cava inferior is elevated in response to CLP and higher in WT mice compared to MAC-CX43 KO mice (each dot is representative for a single animal, unpaired t-test). (C–D) Inhibition (Gap27 (1 µM)) or genetic deletion of CX43 decreased TNF-alpha (C) und IL-6 (D) secretion from peritoneal macrophages in response to stimulation with LPS (1 μg/ml) for 3 and 6 hr (removal of 7 outliers after ROUT test in Figure 4D)*. (E) IL-6 release was restored by activation of purinergic receptors by exogenous administration of ATPуS (10 nM) and abrogated in response to apyrase (100 IU/ml) (each dot is representative of an independent biological replicate, two-way ANOVA, representative of three experiments). (F–G) IL-6 release from peritoneal macrophages in response to LPS (1 µg/ml) and by blocking major P2X (G) and P2Y (H) purinergic receptors (N = 4)*. *Data represent independent biological replicates, compared by unpaired t-test and are representative of three or more independent experiments.
Figure 4—figure supplement 1
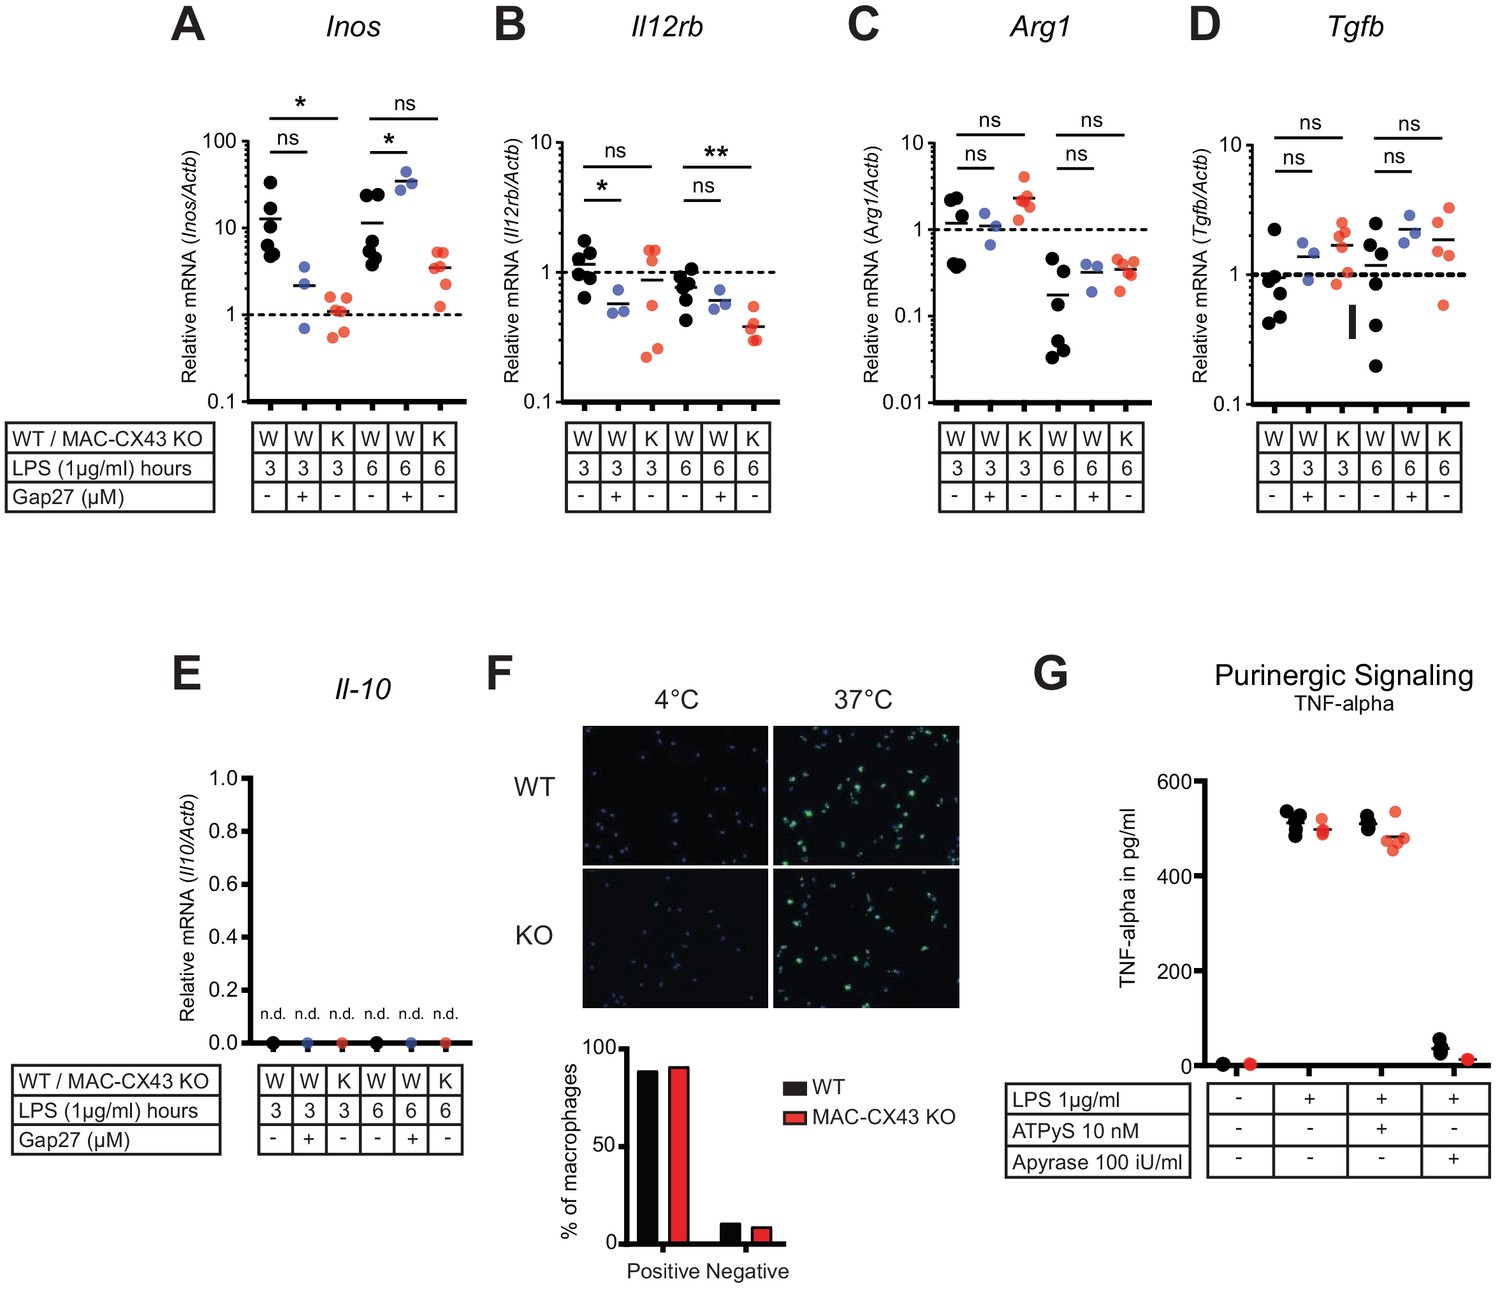
Characterization of peritoneal macrophage activation.
(A–B) Quantification of functional markers of M1 macrophage differentiation Inos and Il12rb, in peritoneal macrophages with CX43 blocking or deletion by qPCR (unpaired t-test)*. (C–E) Markers of M2 differentiation Arg1, Tgfb and Il-10 (unpaired t-test)*. (F) Phagocytic activity of peritoneal macrophages assessed using IgG coated latex beads. (G) TNF-alpha release was not increased by exogenous administration of ATPуS (10 nM) but was abrogated in response to apyrase (100 IU/ml) (N = 5, unpaired t-test)*. *Data represent independent biological replicates and are representative of three or more independent experiments.
Figure 4—figure supplement 2
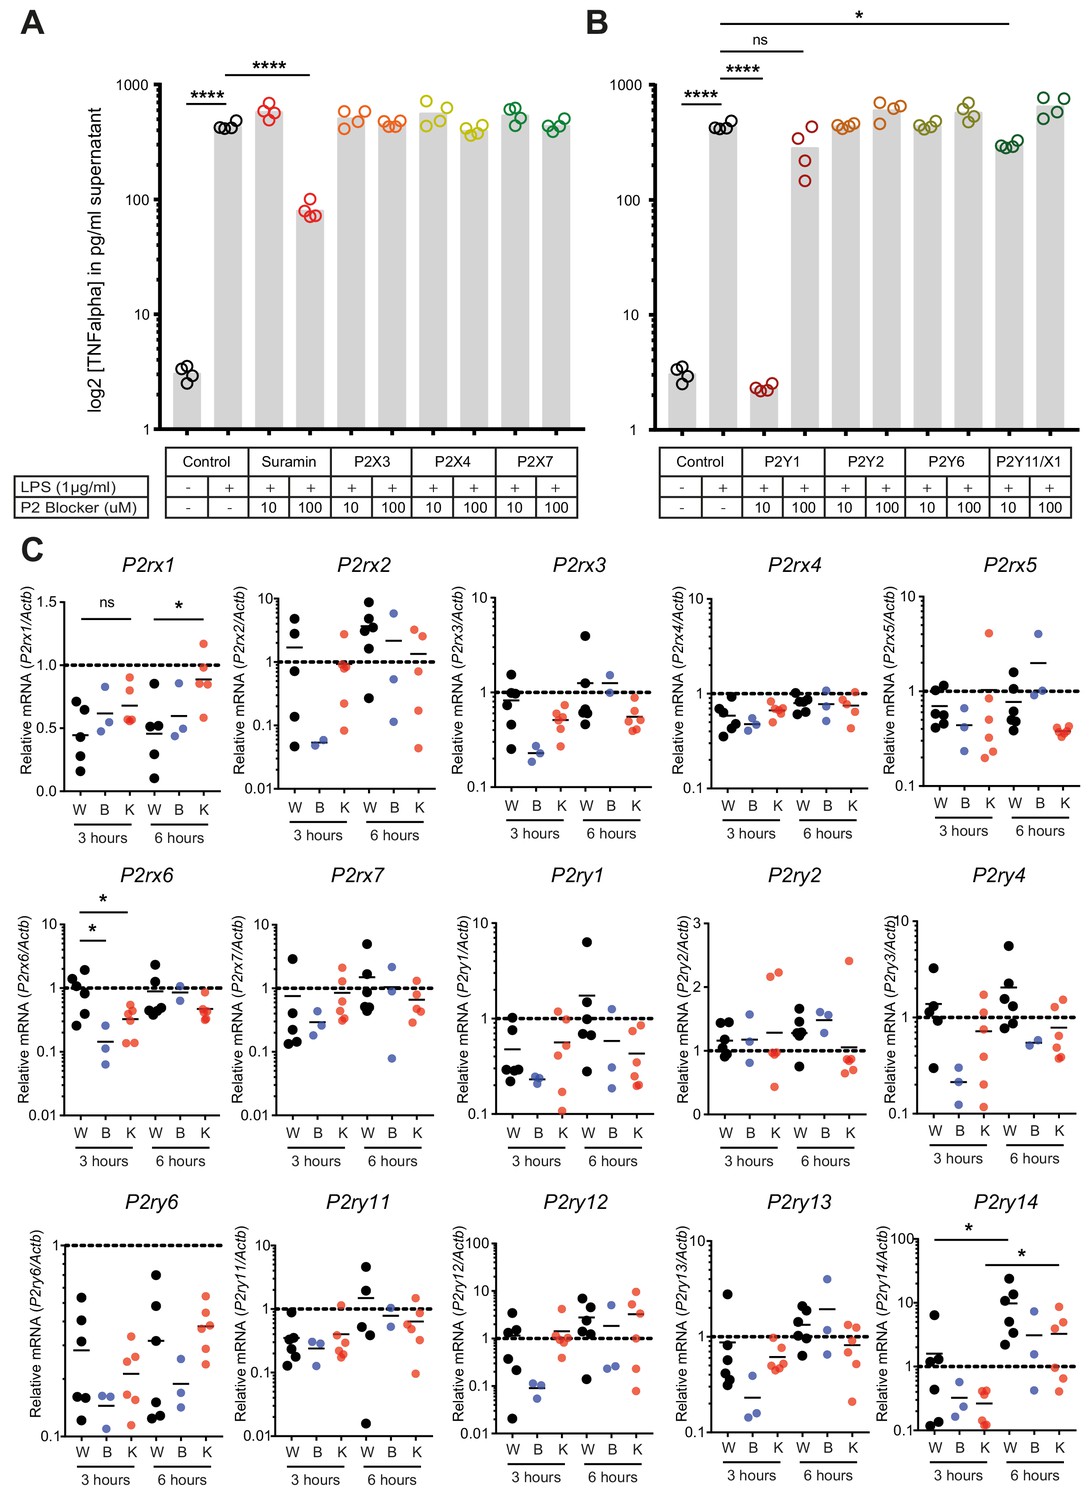
Regulation of P2-type receptors on peritoneal macrophages.
(A–B) TNF-alpha release from peritoneal macrophages in response to LPS (1 µg/ml) and by blocking specifically purinergic receptors including P2X (A) and P2Y (B) receptors (N = 4)*. (C) Purinergic receptors expression in LPS (1 µg/ml)-stimulated peritoneal macrophages isolated from WT mice treated with 1 µM Gap27 (B = CX43 Blocking) or not (W = Wild type) or isolated from MAC-CX43 KO mice (K = Knock out). Expression was assessed using qPCR (unpaired t-test)*. *Data represent independent biological replicates and are representative of three or more independent experiments.
Figure 4—figure supplement 3
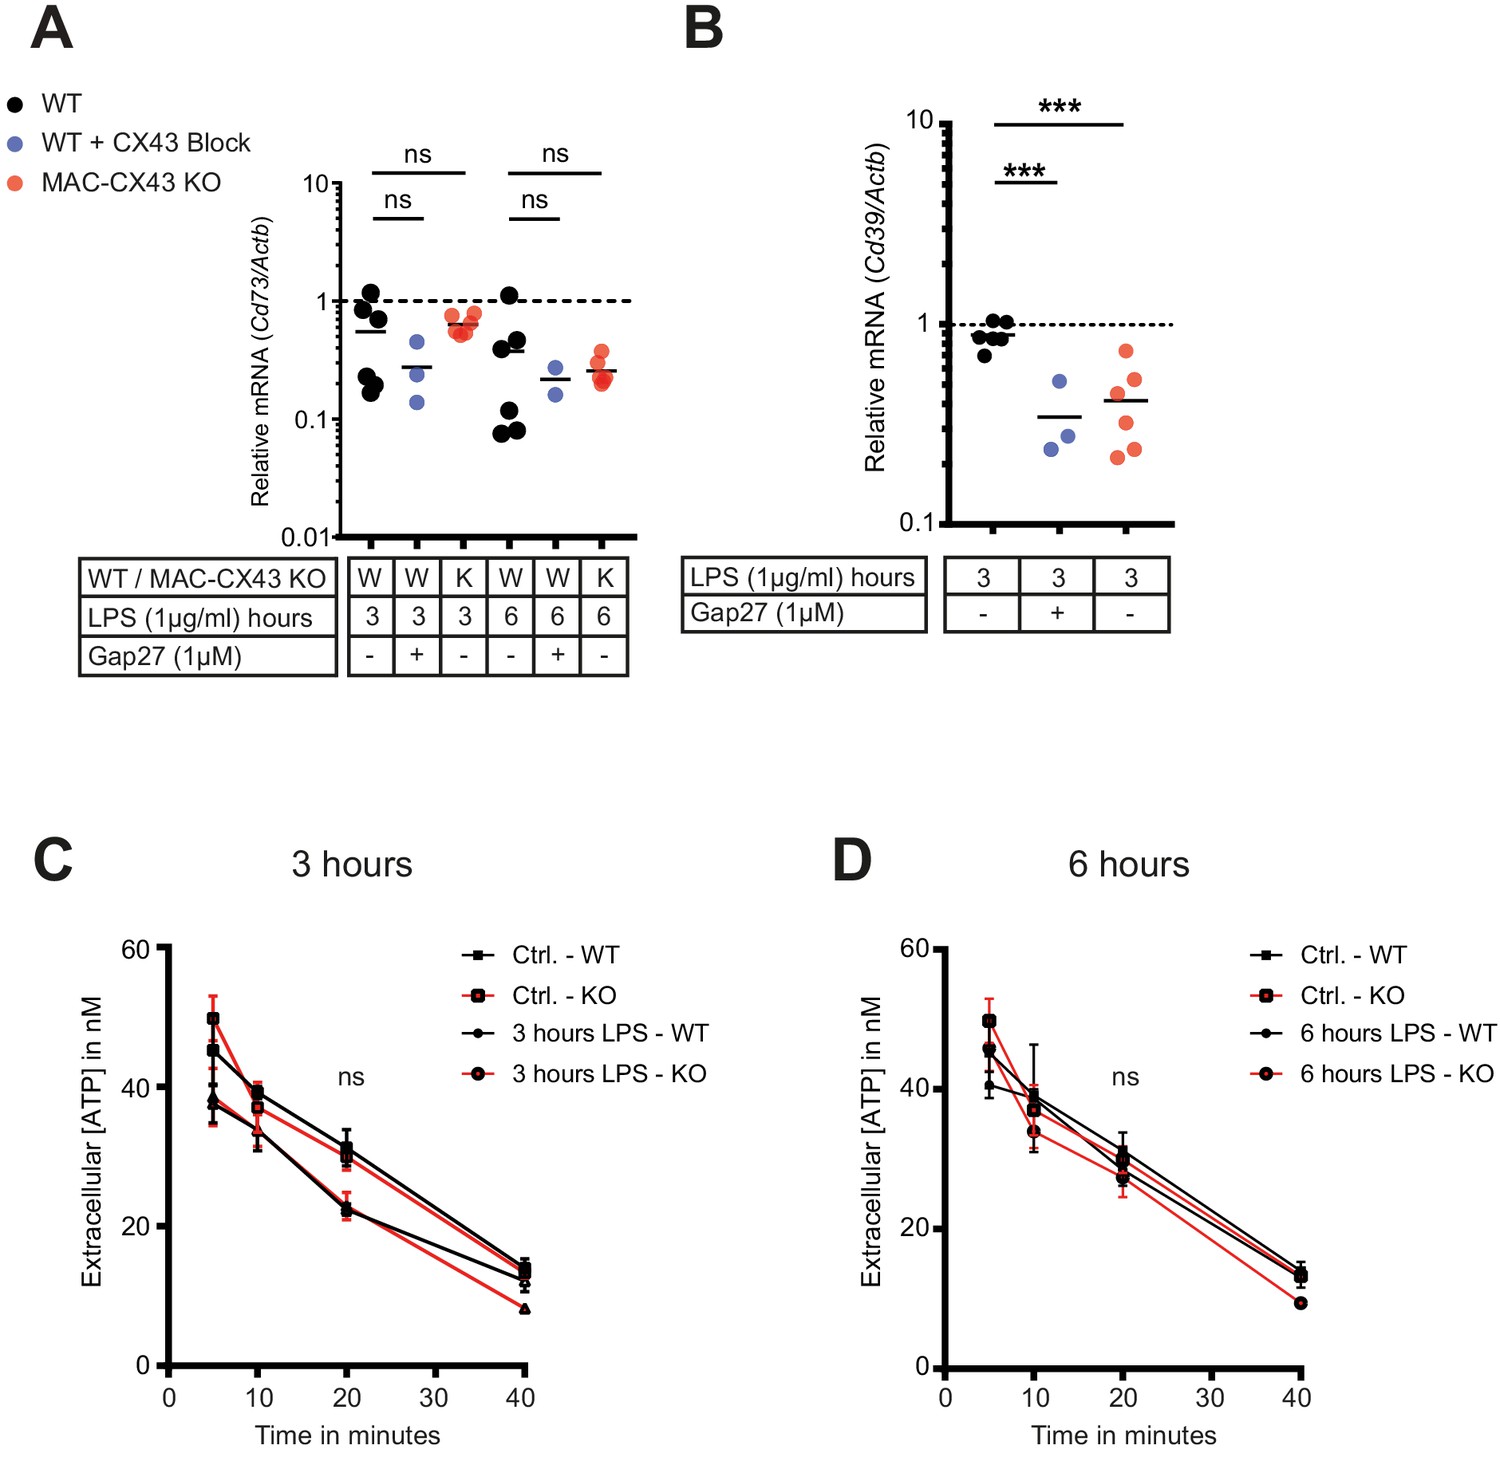
No consequences of Connexin-43 deletion on function of CD73 and CD39 in peritoneal macrophages.
(A–B) CD73 and CD39 expression was assessed by qPCR (each dot is representative of a single independent biological samples, unpaired t-test). (C–D) Kinetic of extracellular ATP degradation from WT and MAC-CX43 KO peritoneal macrophages after 3 and 6 hr of LPS stimulation and the addition 100 µM ATP (each dot is representative of 5 independent biological samples, one-way ANOVA).
Figure 5 with 3 supplements

Improved survival and decreased local and systemic cytokine secretion in response to Connexin-43 blocking or deletion during abdominal sepsis.
(A–B) Clinical outcome using Murine Sepsis Score and weight loss following CLP (N = 5 animals per group, two-way ANOVA). (C) Survival of mice following caecal ligation and puncture (CLP). Mice treated with Gap27 (blue, N = 6 animals), a specific CX43 blocker, homozygous (Lyz2cre/cre, Gja1flox/flox, red, N = 7 animals) and heterozygous cre (Lyz2cre/wt, Gja1flox/flox, red dashed, N = 3 animals) were compared to non-treated WT controls (black, N = 6 animals) (Log-rank (Mantel-Cox) test). (D–G) Systemic levels of TNF-alpha, IL-6, IL-33 and IL-10 in the serum of WT and MAC-CX43 KO mice operated with CLP (each dot is representative of a single animal, Mann-Whitney test). (H–K) IL-6 in peritoneal fluid (PF) serum, lungs, kidney and liver (each dot is representative of a single animal, Mann-Whitney test). Levels are expressed in pg/mg tissue respectively pg/ml of serum or peritoneal fluid. Data are representative of three or more independent experiments.
Figure 5—figure supplement 1
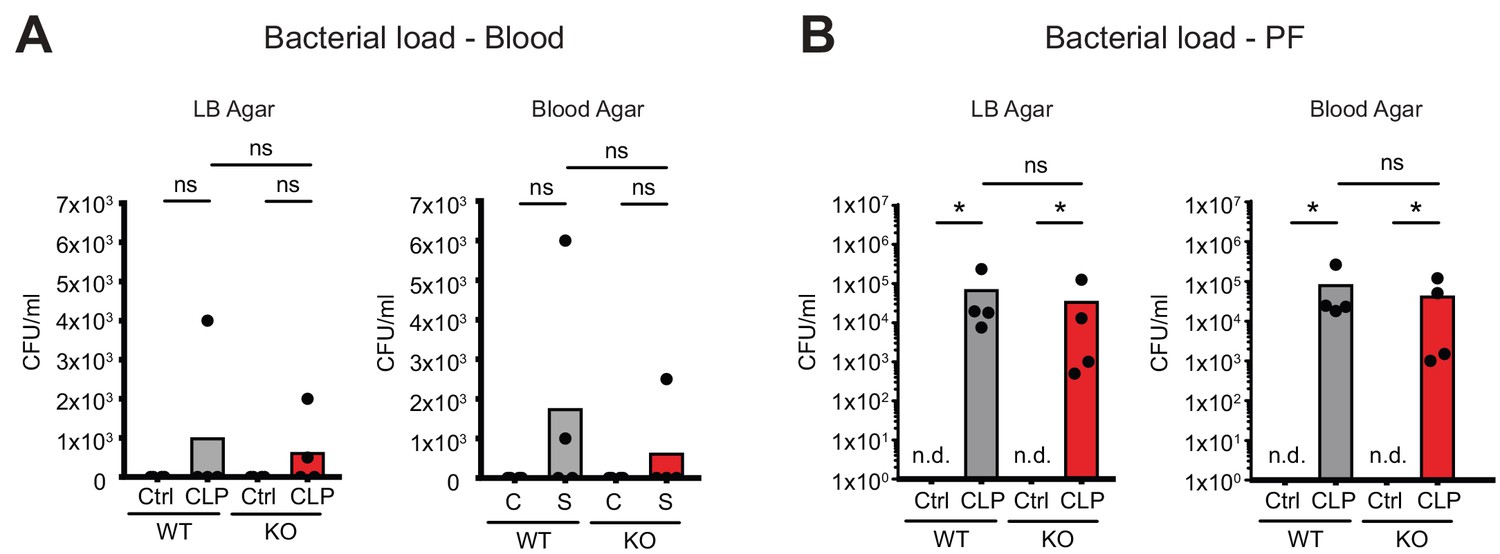
No consequences of Connexin-43 deletion on local and systemic bacterial load.
(A–B) No difference in bacterial load as determined by CFUs after serial dilution of blood and peritoneal fluid 10 hr post CLP (N = 4 animals per group, Mann-Whitney-test).
Figure 5—figure supplement 2
Impact of CX43 on inflammatory cell recruitment to the peritoneal cavity.
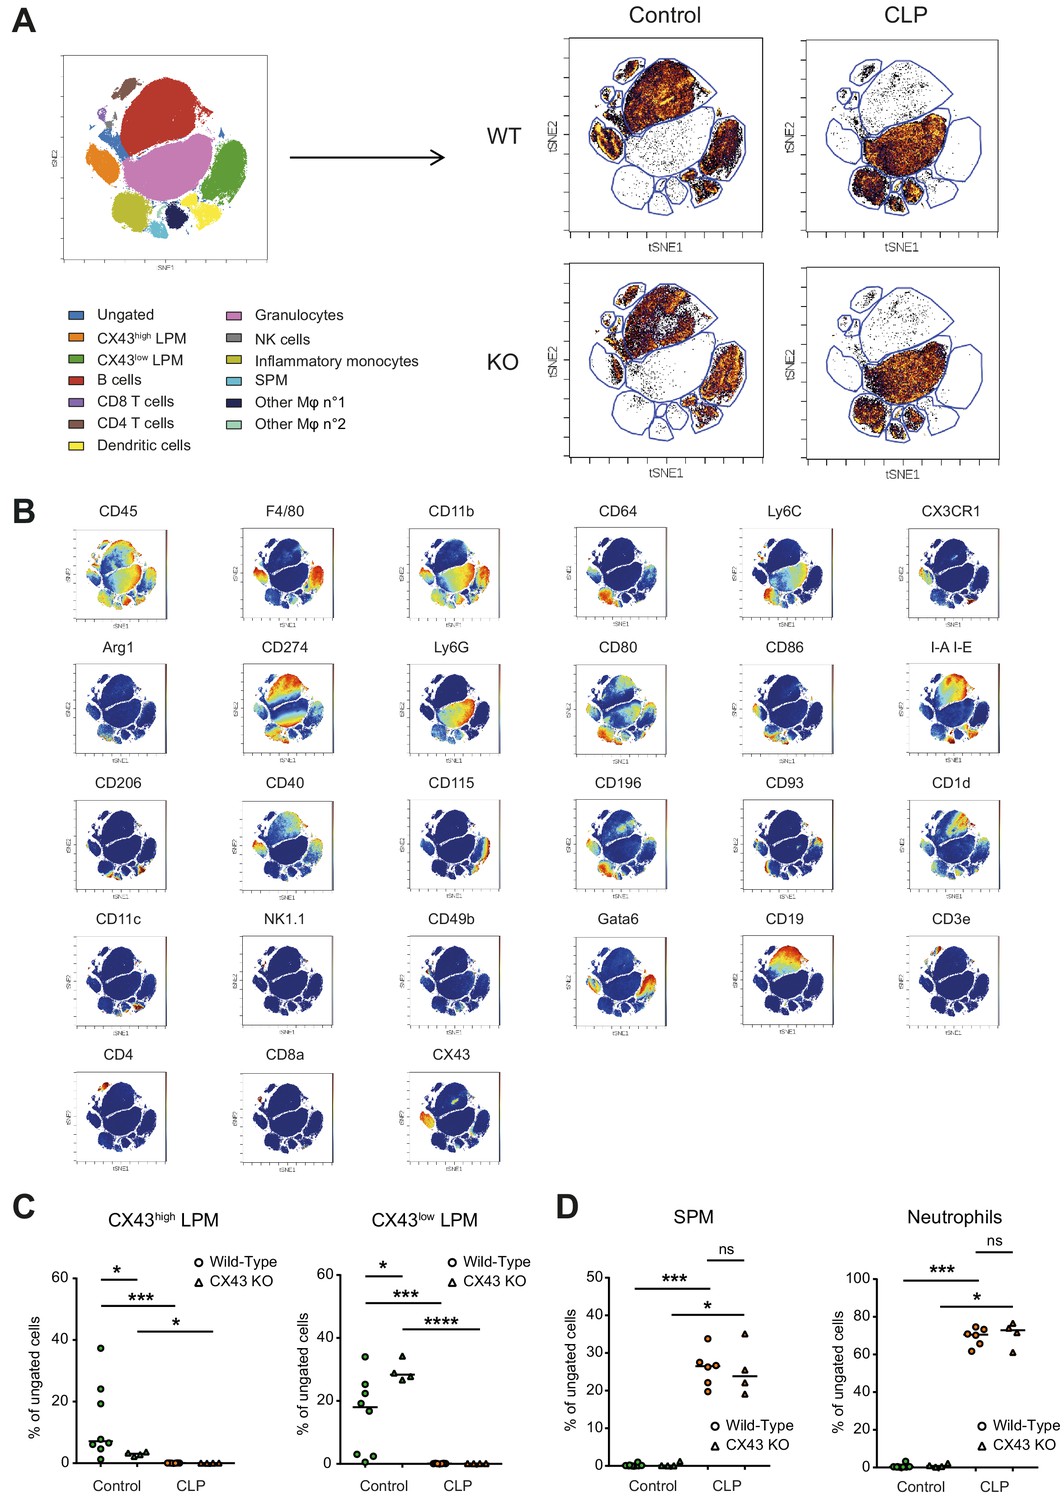
(A) Schematic representation of clustering after CyTOF analysis and dot plot representation of tSNE analysis showing different clusters in the peritoneal cavity 10 hr after CLP compared to control animals. (B) Dot plot representation of tSNE analysis showing the different clusters of inflammatory cells present in the peritoneal cavity in controls and 10 hr after CLP and the expression of several different surface markers that enable the distinction of populations. (C) Two LPM clusters were different between WT and MAC-CX43 KO at baseline (each dot is representative of a single animal, unpaired t-test). (D) SPM and neutrophils were similar between MAC-CX43 KO and WT mice (each dot is representative of a single animal, unpaired t-test).
Figure 5—figure supplement 3
Consequences of peritonitis on distribution of T cells subsets, IL1beta, IL-6 and MPO.
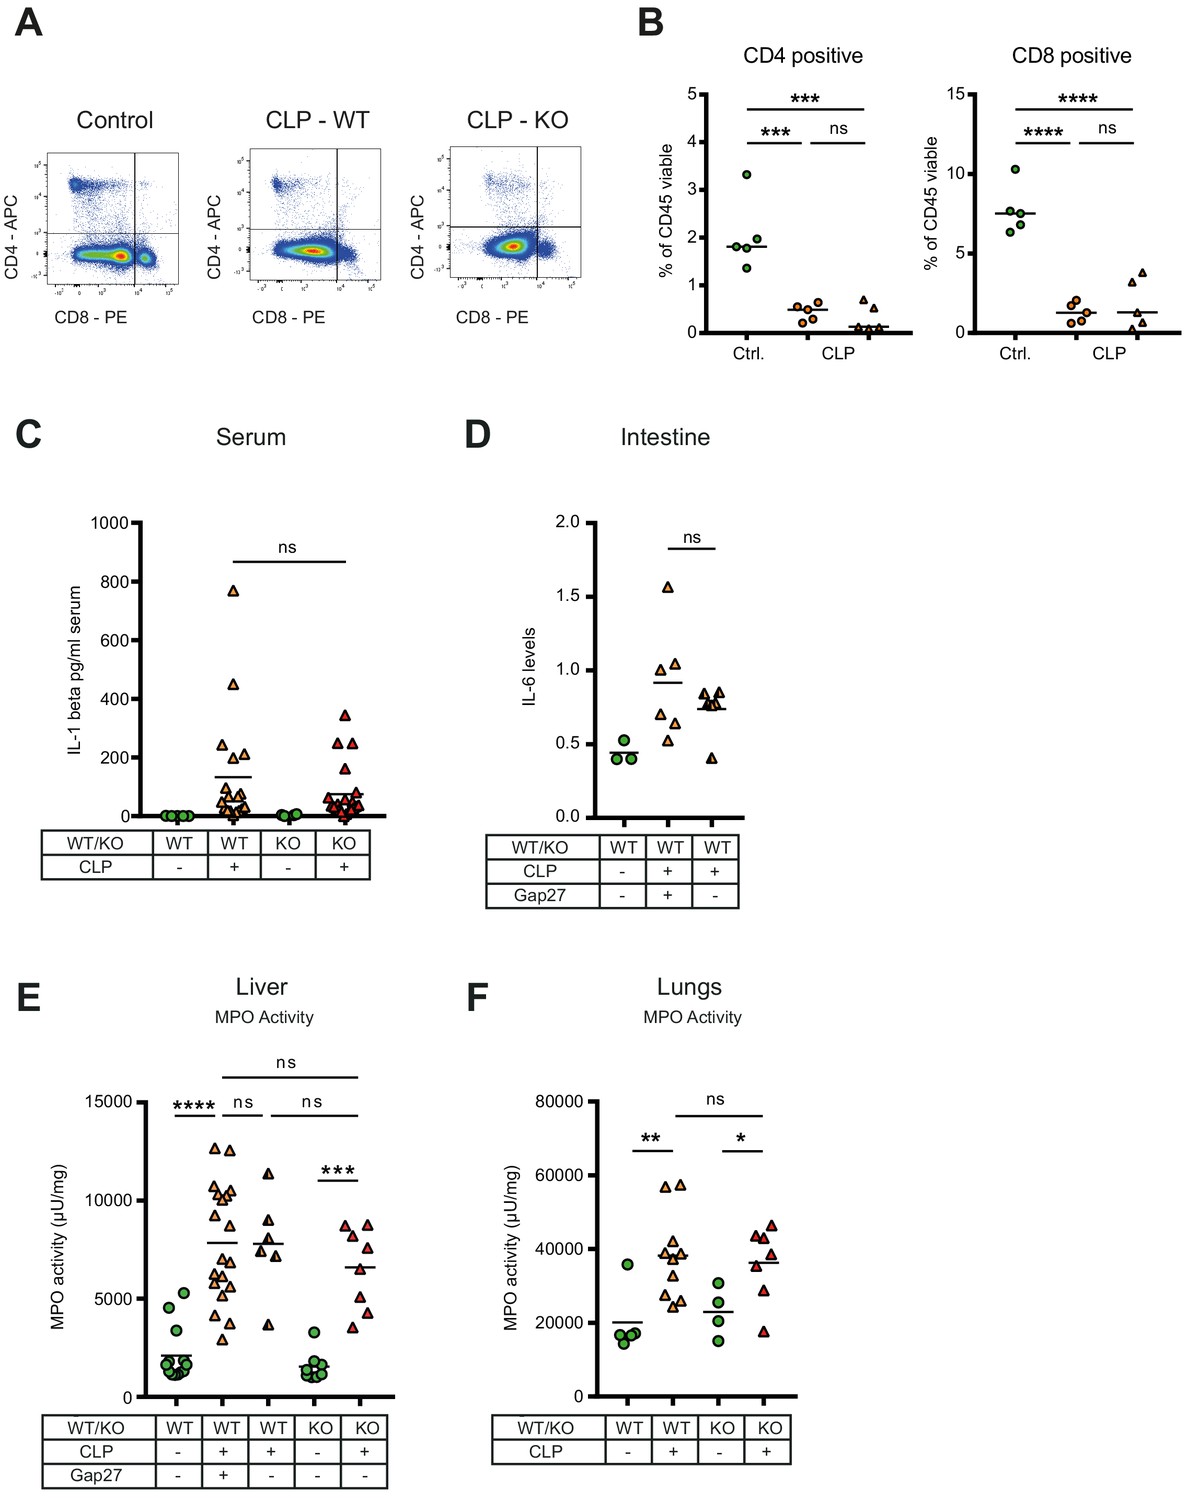
(A–B) Impact of CX43 on T-lymphocyte recruitment in the peritoneal cavity, CD4 positive T helper and CD8 cytotoxic T cells were similar between MAC-CX43 KO and WT mice (N = 5 animals per group, unpaired t-test). (C) Systemic levels of IL-1 beta in the serum of WT and MAC-CX43 KO mice operated with CLP (each dot is representative of a single animal, Mann-Whitney test). (D) Levels of IL-6 in the intestine (terminal ileum) of mice after 10 hr CLP treated or not with Gap27 and compared to controls. Levels are expressed in pg/mg tissue (each dot is representative of a single animal, unpaired t-test). (E–F) No difference on myeloperoxidase (MPO) activity in the liver (each dot is representative of a single animal, unpaired t-test).
Figure 6
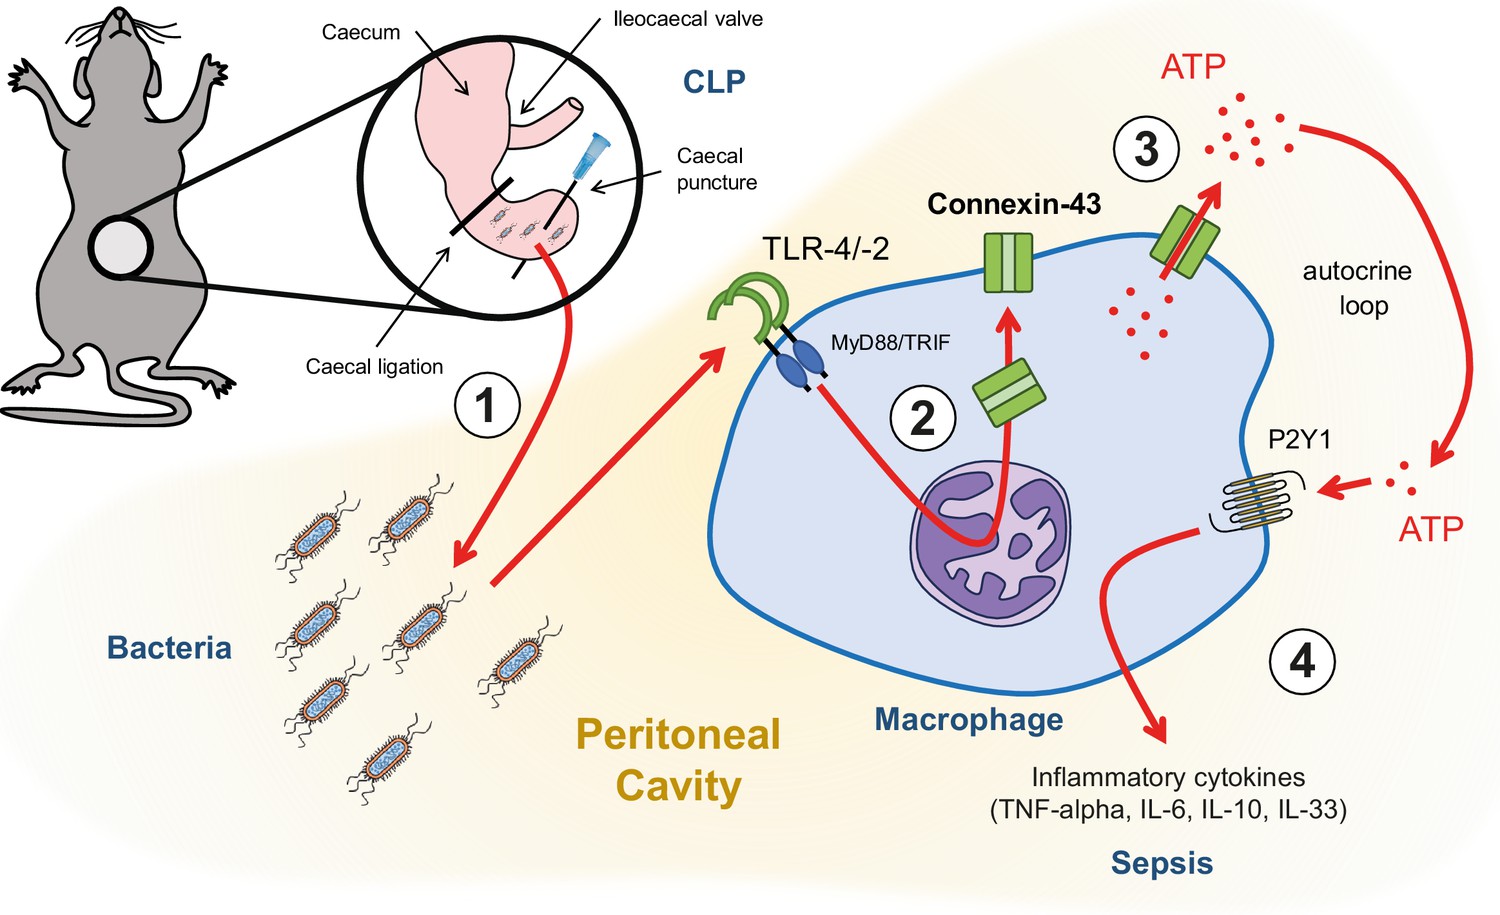
Graphical summary.
(1) Following caecal ligation and puncture (CLP), bacteria invade the peritoneal cavity. (2) Bacteria-derived products, for example LPS, interact with TLR-4 to increase CX43 synthesis in a MyD88/TRIF dependent manner and (3) with TLR-4/–2 to induce CX43-dependent ATP release. (4) Extracellular ATP interacts with P2Y1 receptors to increase inflammatory cytokines secretion.
Tables
Key resources table
| Reagent type (species) or resource | Designation | Source or reference | Identifiers | Additional information |
|---|---|---|---|---|
| Antibody | Anti-Connexin-43 (rabbit, polyclonal) | Cell Signalling | 3512, RRID:AB_2294590 | WB (1:850) IHC/IF (1:100) |
| Antibody | Anti-β-actin HRP-conjugated (mouse, monoclonal) | Sigma-Aldrich | A2228, RRID:AB_476697 | (1:5000) |
| Antibody | Anti-rabbit HRP-conjugated (goat, polyclonal) | Dako | P0448, RRID:AB_2617138 | (1:5000) |
| Antibody | Anti-rabbit biotinylated (goat, polyclonal) | Dako | E0432, RRID:AB_2313609 | (1:200) |
| Antibody | Anti-rabbit IgG FITC-conjugated (goat, polyclonal) | Sigma-Aldrich | F0382, RRID:AB_259384 | (1:200) |
| Cell line (Homo sapiens) | HEK293-pmeLUC | doi:10.1371/journal.pone.0002599 | ||
| Chemical compound | ARL 67156 | Sigma-Aldrich | 67156 | |
| Chemical compound | TRIzol | Roche | 11667165001 | |
| Chemical compound | Omniscript RT Kit 200 | Quiagen | 205113 | |
| Chemical compound | Lipopolysaccharides E.coli O111:B4 | Sigma-Aldrich | L4130 | |
| Chemical compound | Pam3CSK4 | Invivogen | tlrlpms | |
| Chemical compound | 18-alpha- glycyrrhetinic acid | Sigma-Aldrich | G8503 | |
| Chemical compound | Gap27 | Tocris-Bioscience | 1476 | |
| Chemical compound | Probenecid | Sigma-Aldrich | P8761 | |
| Chemical compound | Carbenoxolone | Sigma-Aldrich | C4790 | |
| Commercial assay | ATP Reagent SL | BioThema | 144–041 | |
| Commercial assay | Resazurin assay | Sigma-Aldrich | 199303 | |
| Commercial kit | V-PLEX Mouse Cytokine 19-Plex kit | Meso Scale Discovery | K15255D-1 | |
| Commercial kit (ELISA) | TNF-alpha | Invitrogen | 88-7324-22 | |
| Commercial kit (ELISA) | IL-6 | Invitrogen | 88-7064-22 | |
| Commercial kit (ELISA) | IL-10 | Invitrogen | 88-7105-22 | |
| Commercial kit (ELISA) | IL-1 beta | Invitrogen | 88-7013-86 | |
| Commercial assay | Phagocytic assay | Cayman Chemical | 500290 | |
| Other | Brewer thioglycollate | Sigma-Aldrich | B2551 | |
| Other | DMEM/F12 GlutaMAX | ThermoFisher Scientific, Gibco | 10565018 | |
| Other | CTAD tubes | BD Vacutainer | 367599 | |
| Other | Peroxidase labelled streptavidin | Seracare | 71-00-38 | (1:200) |
| Other | DAPI stain | Sigma-Aldrich | D9542 | (1:1000) |
| Other | Ficoll | GE Healthcare | 17-5442-02 | |
| Other | Myeloperoxidase assay | doi:10.1097/TP.0000000000000101 | ||
| Strain, strain background (Mus musculus) | Wild-type mice | Harlan, Netherlands | C57BL/6J | |
| Strain, strain background (Mus musculus) | MyD88/TRIF double-knockout mice | Mucosal Immunology, University of Bern | B6.129-MyD88tm1Aki x B6-Ticam1lps2 | |
| Strain, strain background (Mus musculus) | Caspase-1/11 double-knockout mice | Mucosal Immunology, University of Bern | B6N.129S2-Casp1tm1Flv | |
| Strain, strain background (Mus musculus) | MAC-CX43 knockout mice | Visceral Surgery, University of Bern | B6.129P2-Lyz2tm1(cre)Ifo/J x B6.129S7-Gja1tm1Dlg/J | Cell-specific conditional MAC-CX43 KO mouse model developed in our laboratory |
| Strain, strain background (Mus musculus) | Lyz2-cre mice | Jackson Laboratory | B6.129P2-Lyz2tm1(cre)Ifo/J | |
| Strain, strain background (Mus musculus) | Gja1 floxed mice | Jackson Laboratory | B6.129S7-Gja1tm1Dlg/J |
Additional files
-
Supplementary file 1
Anti-mouse antibodies used for Time-of-Flight Mass Cytometry.
(A) Diagnosis of human patients included in the study. (B) P2 receptors antagonists. (C) Visceral Surgery Murine Sepsis Score Sheet. (D) Anti-mouse antibodies used for flow cytometry (E) Anti-human antibodies used for flow cytometry (F) Anti-mouse antibodies used for Time-of-Flight Mass Cytometry
- https://doi.org/10.7554/eLife.42670.018
-
Source data 1
Full uncut western blot membranes.
- https://doi.org/10.7554/eLife.42670.019
-
Transparent reporting form
- https://doi.org/10.7554/eLife.42670.020
Download links
A two-part list of links to download the article, or parts of the article, in various formats.
Downloads (link to download the article as PDF)
Open citations (links to open the citations from this article in various online reference manager services)
Cite this article (links to download the citations from this article in formats compatible with various reference manager tools)
Connexin-43-dependent ATP release mediates macrophage activation during sepsis
eLife 8:e42670.
https://doi.org/10.7554/eLife.42670


