A composition-dependent molecular clutch between T cell signaling condensates and actin
- Howard Hughes Medical Institute, Summer Institute, Marine Biological Laboratory, United States
- Howard Hughes Medical Institute, University of Texas Southwestern Medical Center, United States
- University of Texas Southwestern Medical Center, United States
- National Centre for Biological Sciences, Tata Institute for Fundamental Research, India
- Howard Hughes Medical Institute, University of California, San Francisco, United States
- Eugene Bell Center for Regenerative Biology and Tissue Engineering, Marine Biological Laboratory, United States
Figures
Figure 1 with 1 supplement

Composition regulates condensate movement with actin networks.
(A) Schematic of biochemical reconstitution in solutions containing LAT and eABD attached to SLBs and LAT phase separation agents, actin filaments, and myosin filaments in solution. (B) TIRF microscopy images of LAT condensates of the indicated compositions (see text for nomenclature) without actin (left column), with actin-only networks (middle column), or with actomyosin networks (right column). pLAT-Alexa488 is green, rhodamine-actin is magenta. Scale bar = 5 μm. (C) Actin enrichment at condensates in reconstitution assays using actomyosin, calculated as the ratio of actin fluorescence intensity within condensates to actin intensity outside condensates (see Materials and methods). Shown are the individual data points and their mean ±s.d. from N = 15 fields of view from three independent experiments (with 5 FOV per experiment). P-values are for indicated distribution comparisons via Wilcoxon rank-sum test with Bonferroni correction to achieve a total type-I error of 0.05. (D) Example plots of condensate tracks. Scale bar = 5 μm. (E) Effective diffusion coefficients of the condensate tracks. Each measurement is shown as a violin plot of the distribution of values from analyzing N = 15 fields of view from three independent experiments (with 5 FOV per experiment). Green square shows median and magenta plus sign shows mean. Significance was determined by averaging results from 100 Wilcoxon rank-sum tests that compared pairs of 500 randomly-selected tracks.
-
Figure 1—source data 1
Source data file for Figure 1C.
- https://doi.org/10.7554/eLife.42695.004
Figure 1—figure supplement 1

Detection process for LAT condensates in vitro.
(A) (left) An example of the initial thresholding and local maxima detection for LAT condensates. Orange dotted lines indicate pair-wise comparisons that are made to remove superfluous local maxima. (right) Thresholded areas and local maxima after correction steps. (B) The distribution of maximum/minimum intensity ratios taken from segmented areas with a single local maximum. The threshold (1st percentile of distribution) used to discard local maxima is shown as an orange line. The maximum/minimum intensity ratios of the pairs from (A) are shown with orange arrows.
Figure 2 with 1 supplement
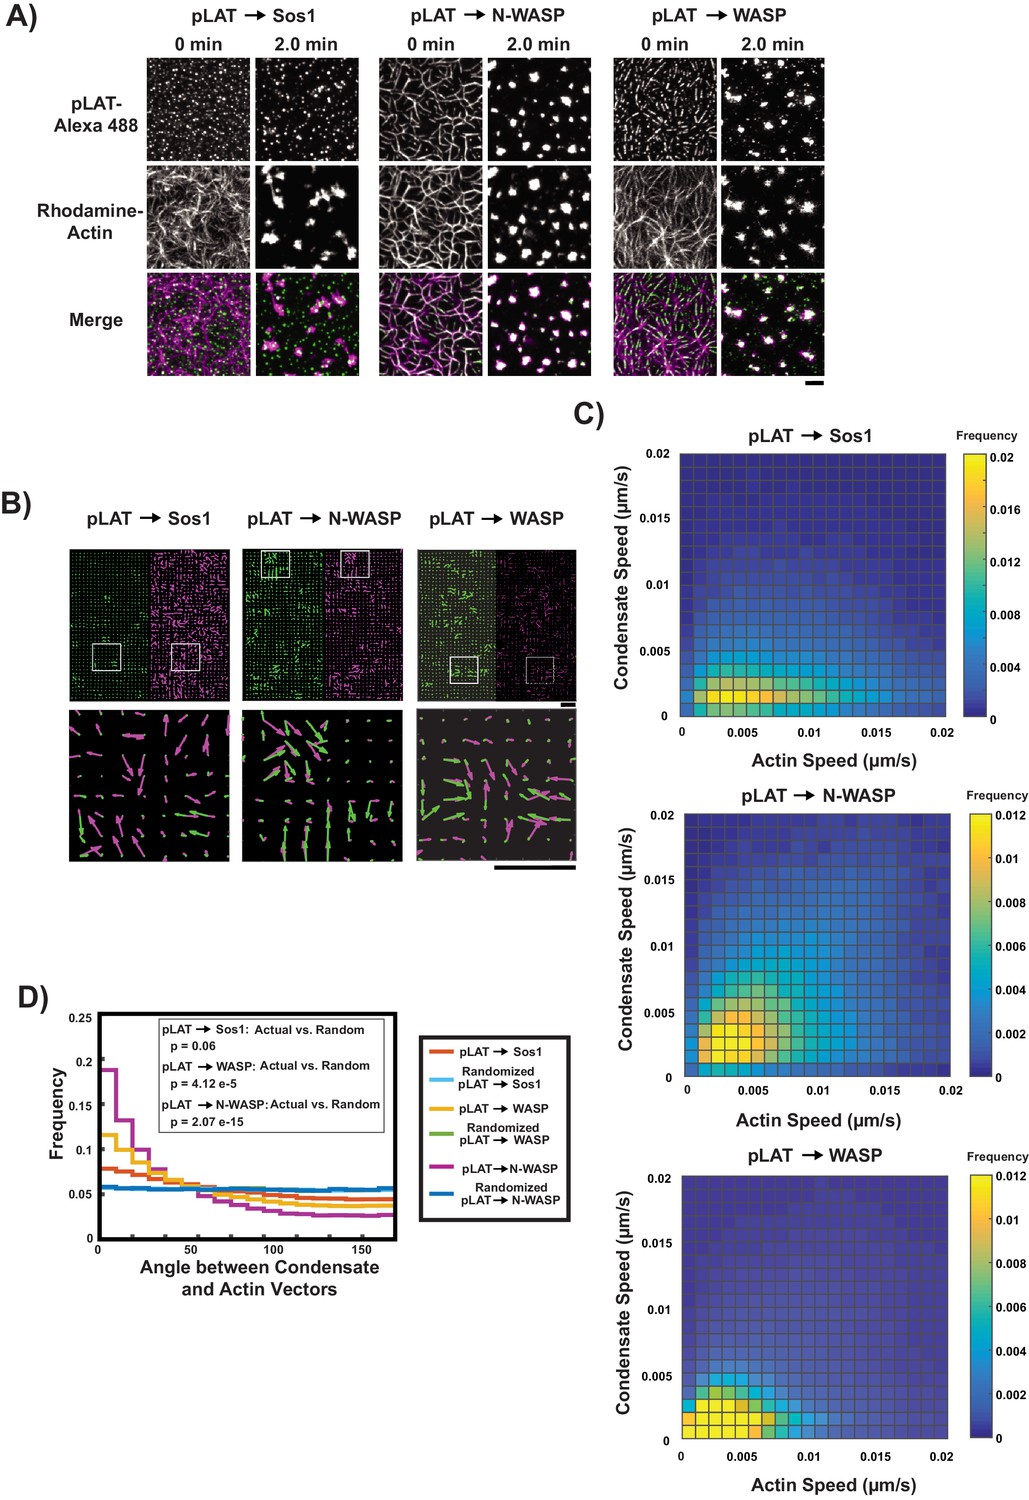
pLAT → N-WASP condensates bind to and move with moving actin filaments.
(A) TIRF microscopy images of pLAT → Sos1 condensates (left two columns), and pLAT → N-WASP condensates (middle two columns), and pLAT→ WASP (right two columns), formed in an actin network before (t = 0 min) and after (t = 2 min) addition of myosin II. pLAT condensates are green and actin is magenta in merge. Scale bar = 5 μm. (B–D) STICS analysis of actin and condensate movement. (B) Representative map of actin (magenta) and pLAT condensate (green) vector fields. Lower panels show magnification of box regions in upper panels. (C) Condensate speed vs. actin speed at same position. Condensate composition indicated above each heat map. Heat map indicates frequency in each bin, that is counts in each bin normalized by total number of counts. (D) Distribution of the angle between actin and condensate movement vectors for pLAT → Sos1 (blue), pLAT → N-WASP (gold), randomized pLAT → Sos1 (red) and randomized pLAT → N-WASP (purple) (see Materials and methods for randomization). P-values are for indicated distribution comparisons via Kolmogorov-Smirnov test. Data in (C) and (D) are pooled from 15 fields of view from three independent experiments (5 FOV per experiment).
Figure 2—figure supplement 1
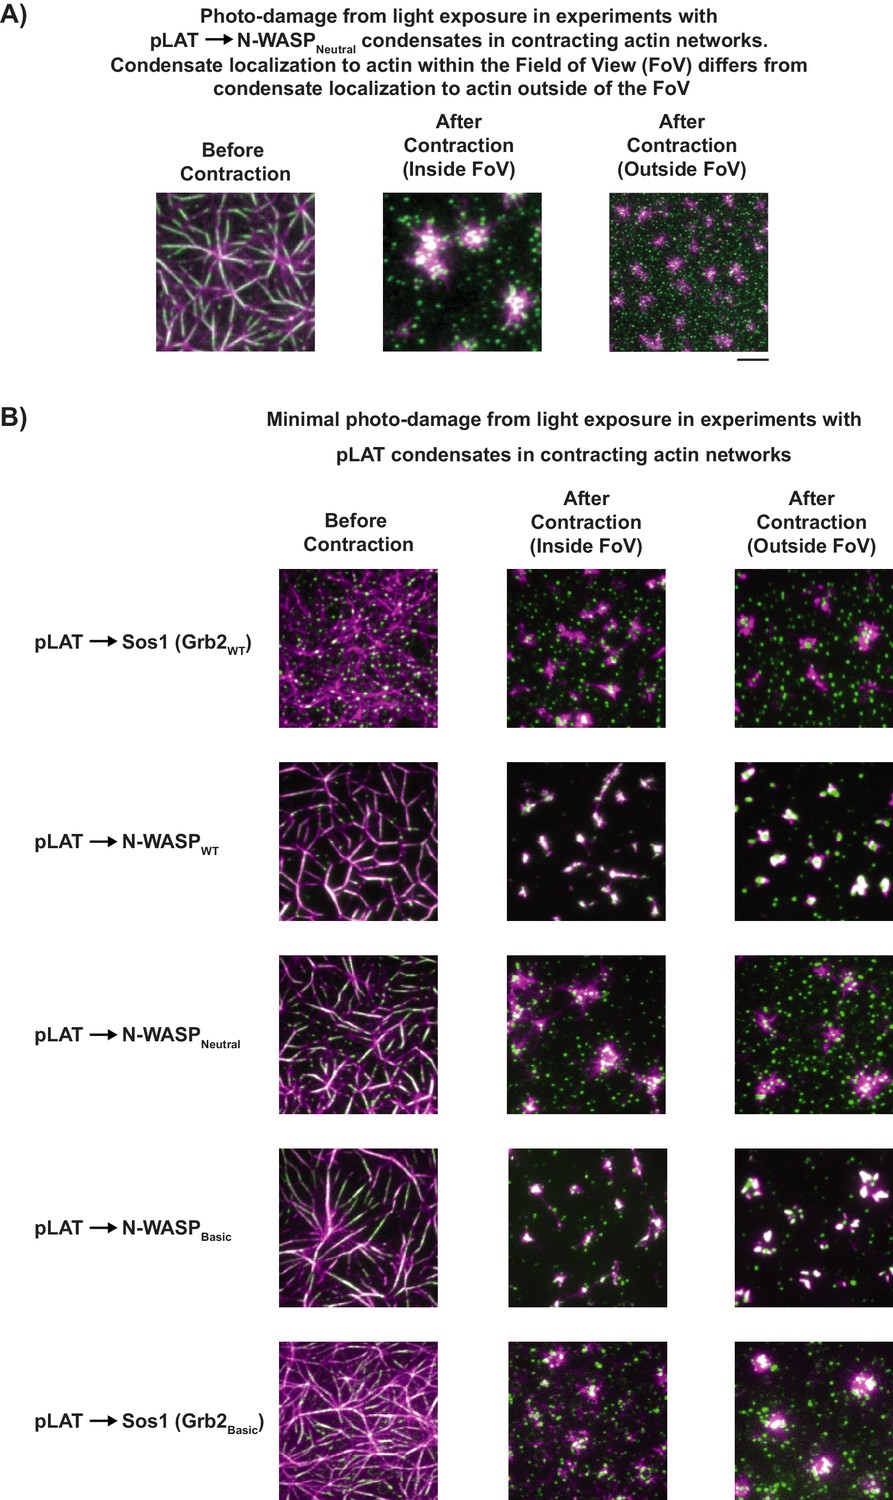
In actomyosin contractile assays, imaging conditions were chosen such that photo-damage was minimized to avoid artifactual results.
(A) TIRF microscopy images of LAT condensate movement following myosin II-induced actin contraction inside or outside the field of view (FOV) when care was not taken to minimize photo-damage. (left) Representative image of pLAT → N-WASPNeutral condensate (green) wetting of rhodamine-actin filaments (magenta) prior to induced actin contraction. (center) Image of same FOV after imaging during myosin II-induced actin contraction. (right) Image of region outside of FOV (i.e. not imaged during contraction) obtained immediately following actin contraction. Comparing center and right images indicates that photo-damage can increase interactions between condensates and actin, leading to artifactual co-localization following contraction. (B) When imaging is performed with low laser power (as done in our experiments), regions inside and outside of the FOV during actin contraction show similar co-localization of condensates with actin asters. Figure shows representative images for a variety of pLAT condensates types captured in the FOV prior to myosin II-induced actin contraction (left), in the FOV after myosin II-induced contraction (center), and outside of the FOV after contraction (right).
Figure 3 with 8 supplements
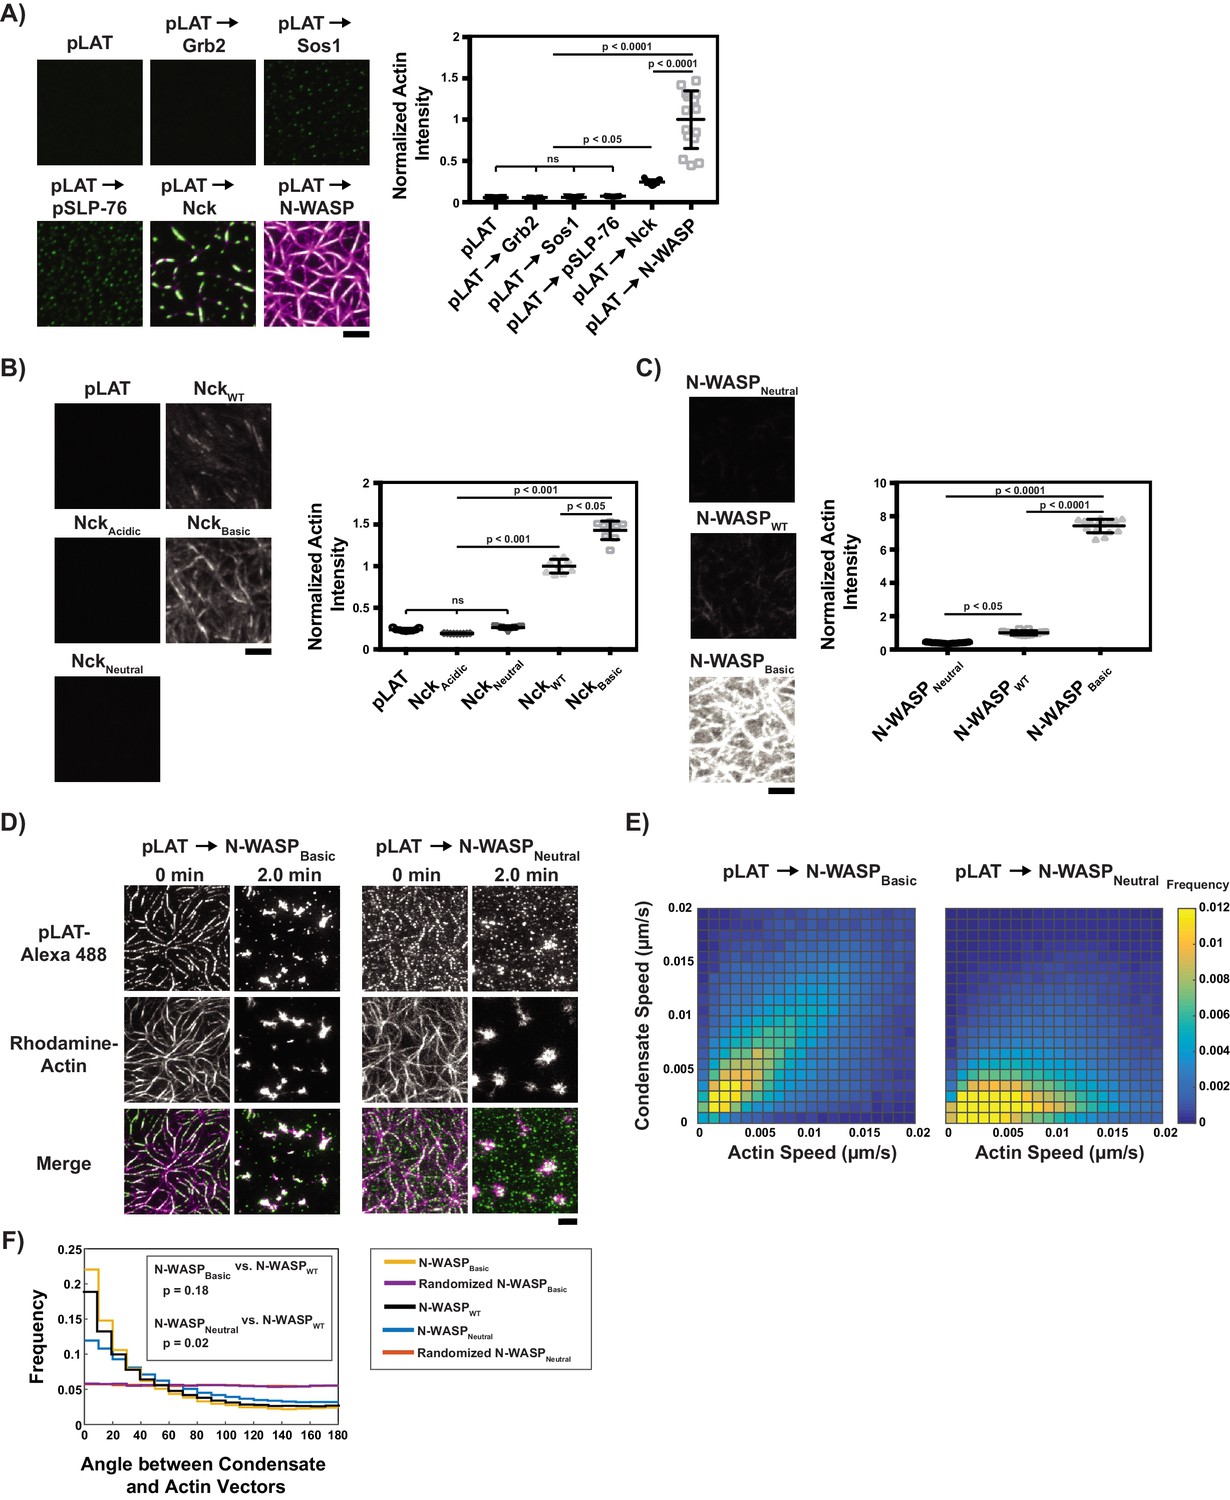
Basic regions of Nck and N-WASP mediate interaction of LAT condensates with actin filaments.
(A) (Left) TIRF microscopy images of rhodamine-actin (magenta) recruited to SLBs by the indicated LAT condensate compositions (green). Scale bar = 5 μm. All panels use the same intensity range. (Right) Normalized average rhodamine-actin fluorescence intensity on SLBs. Shown are the individual data points and their mean ±s.d. N = 15 fields of view from three independent experiments (5 FOV per experiment). P values were determined using a t-test. (B) (Left) TIRF microscopy images of rhodamine-actin recruited to SLBs by His-tagged Nck variants. Scale bar = 5 μm. All panels use the same intensity range. (Right) Normalized average rhodamine-actin fluorescence intensity on SLBs. Shown are the individual data points and their mean ±s.d. N = 9 fields of view from three independent experiments (3 FOV per experiment). P values were determined using a t-test. (C) (Left) TIRF microscopy images of rhodamine-actin recruited to SLBs by His-tagged N-WASP variants. All panels use the same intensity range. (Right) Normalized average rhodamine-actin fluorescence intensity on SLBs. Shown are the individual data points and their mean ±s.d. N = 15 fields of view from three independent experiments (5 FOV per experiment). P values were determined using a t-test. (D) TIRF microscopy images of pLAT → N-WASPBasic condensates (left two columns) and pLAT → N-WASPNeutral condensates (right two columns) formed in an actin network before (t = 0 min) and after (t = 2 min) addition of myosin II. LAT condensates are green and actin is magenta in merge. Scale bar = 5 μm. (E) Condensate speed vs. actin speed at same position from STICS analysis. Condensate composition indicated above each heat map. Heat map indicates frequency in each bin (as in Figure 2C). N = 15 fields of view from three independent experiments (5 FOV per experiments). (F) Distribution of the angle between actin and condensate movement vectors for pLAT → N-WASPBasic (gold), randomized pLAT → N-WASPBasic (purple), pLAT → N-WASPWT (black, same data as in Figure 2), pLAT → N-WASPNeutral (blue), and randomized pLAT → N-WASPNeutral (red). N = 15 fields of view from three independent experiments (5 FOV per experiment). P-values are for indicated distribution comparisons via Kolmogorov-Smirnov test.
-
Figure 3—source data 1
Source data file for Figure 3A.
- https://doi.org/10.7554/eLife.42695.028
-
Figure 3—source data 2
Source data file for Figure 3B.
- https://doi.org/10.7554/eLife.42695.029
-
Figure 3—source data 3
Source data file for Figure 3C.
- https://doi.org/10.7554/eLife.42695.030
Figure 3—figure supplement 1
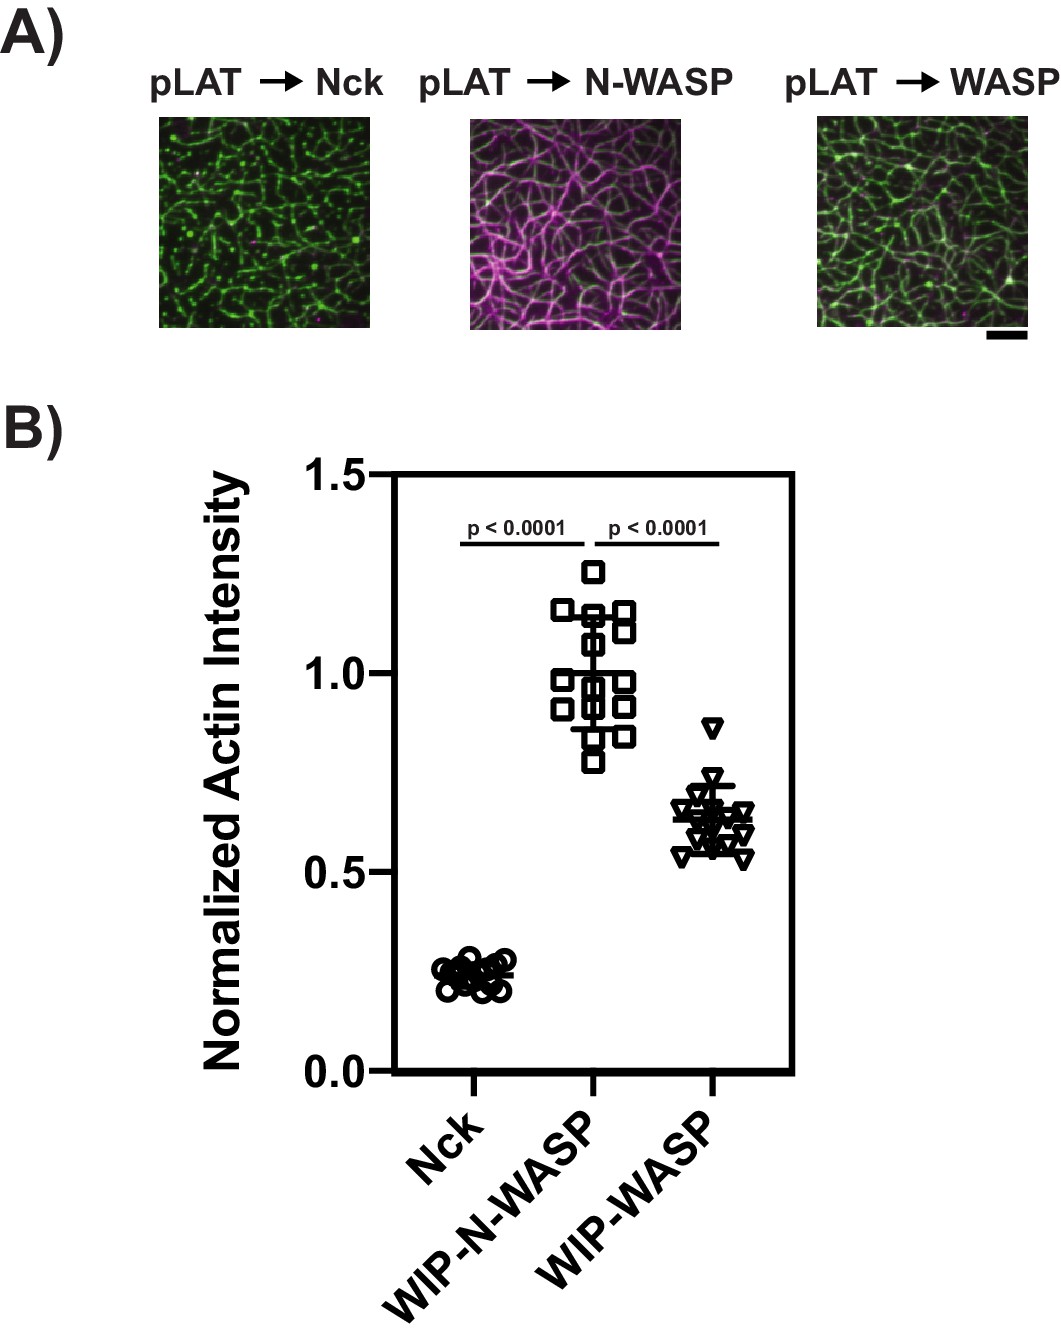
pLAT → Nck, pLAT → N-WASP, and pLAT → WASP condensates bind F-Actin.
(A) TIRF microscopy images of rhodamine-actin recruited to pLAT → Nck, pLAT → N-WASP, and pLAT → WASP condensates. Scale bar = 5 μm. (B) Normalized average rhodamine-actin fluorescence intensity on SLBs. Shown are the individual data points and their mean ±s.d. N = 15 fields of view from three independent experiments (5 FOV per experiment). P values were determined using a t-test.
-
Figure 3—figure supplement 1—source data 1
Source data file for Figure 3—figure supplement 1.
- https://doi.org/10.7554/eLife.42695.013
Figure 3—figure supplement 2
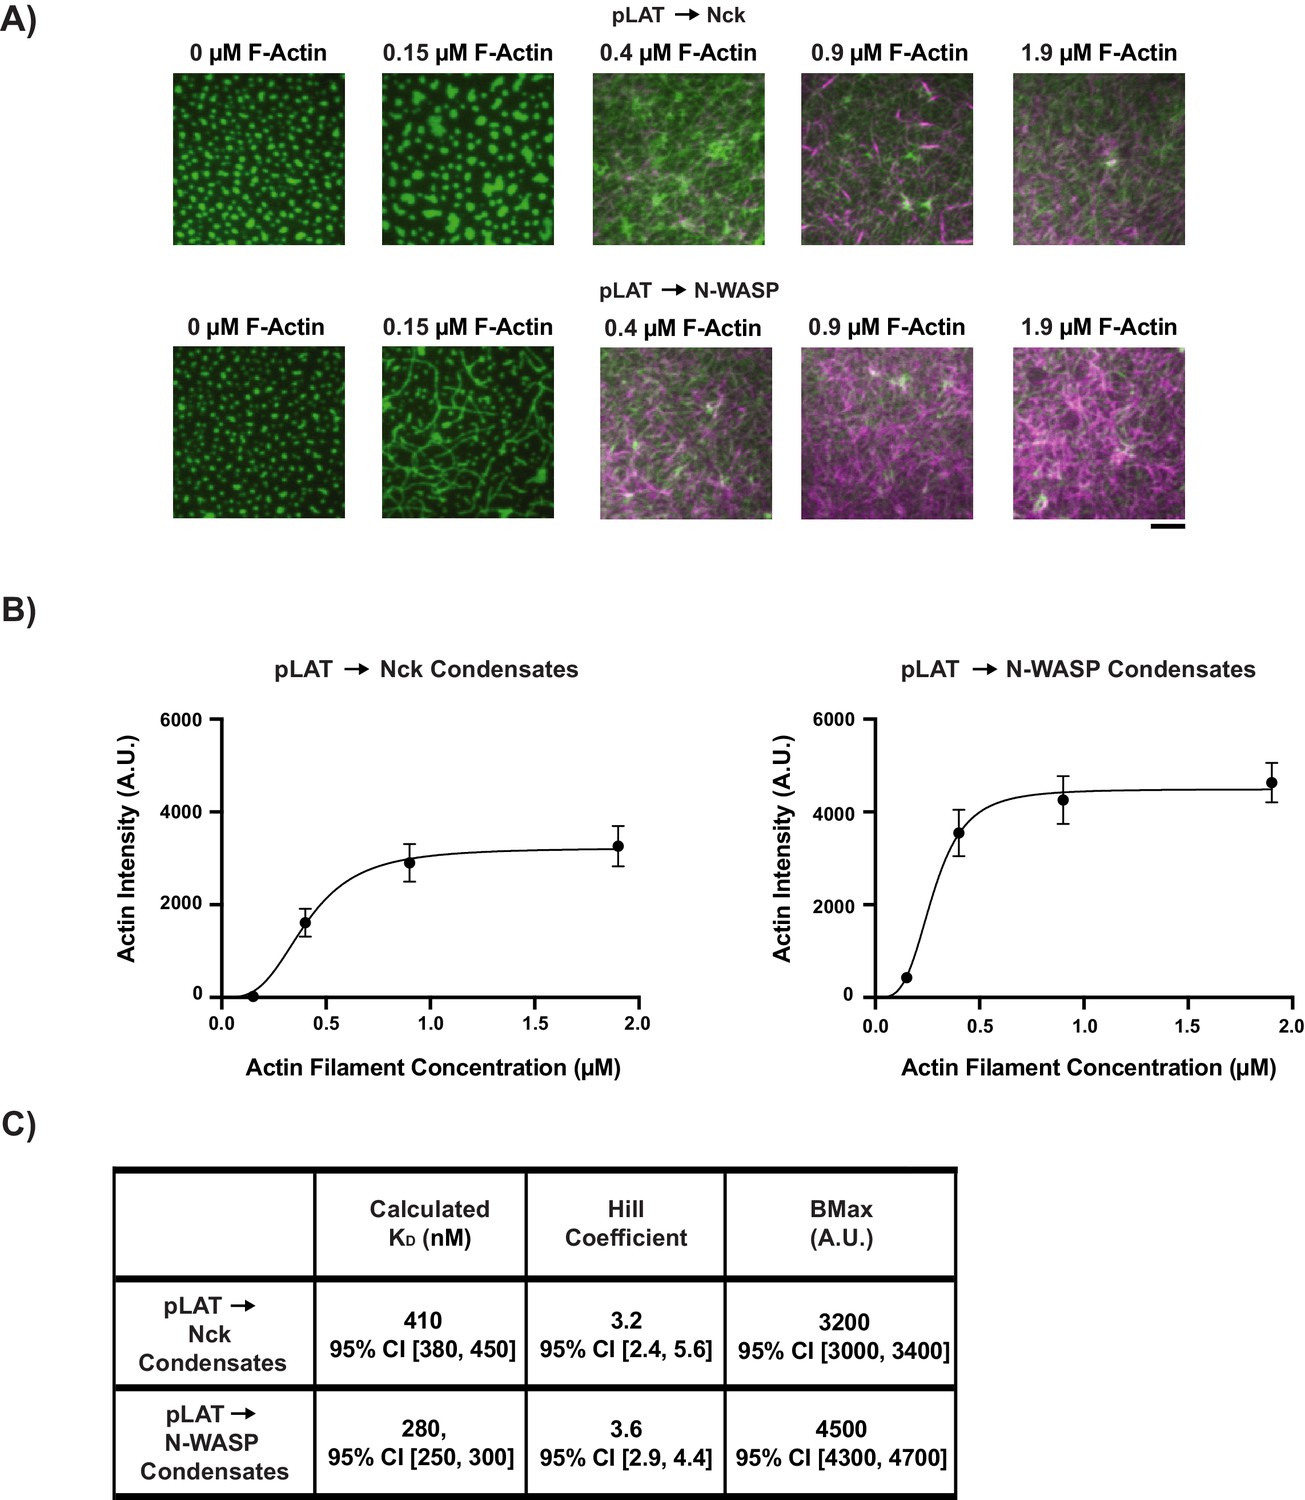
Quantitative analysis of actin filaments binding to LAT condensates.
(A) TIRF microscopy images of rhodamine actin recruited to pLAT → Nck or pLAT → N-WASP condensates. Scale bar = 5 μm. (B) Plots of fluorescence intensity of rhodamine actin recruited to the SLB. Shown are the average intensity value for each concentration of rhodamine actin ±s.d. from N = 15 fields of view from three independent experiments (5 FOV per experiment). Data was fit using the Specific Binding with a Hill slope algorithm in GraphPad Prism. (C) Calculated KD, Hill Coefficient, and binding capacity (BMax) for pLAT → Nck and pLAT → N-WASP condensates using the fit shown in (B).
-
Figure 3—figure supplement 2—source data 1
Source data file for Figure 3—figure supplement 2.
- https://doi.org/10.7554/eLife.42695.015
-
Figure 3—figure supplement 2—source data 2
Source data file for Figure 3—figure supplement 2.
- https://doi.org/10.7554/eLife.42695.016
Figure 3—figure supplement 3
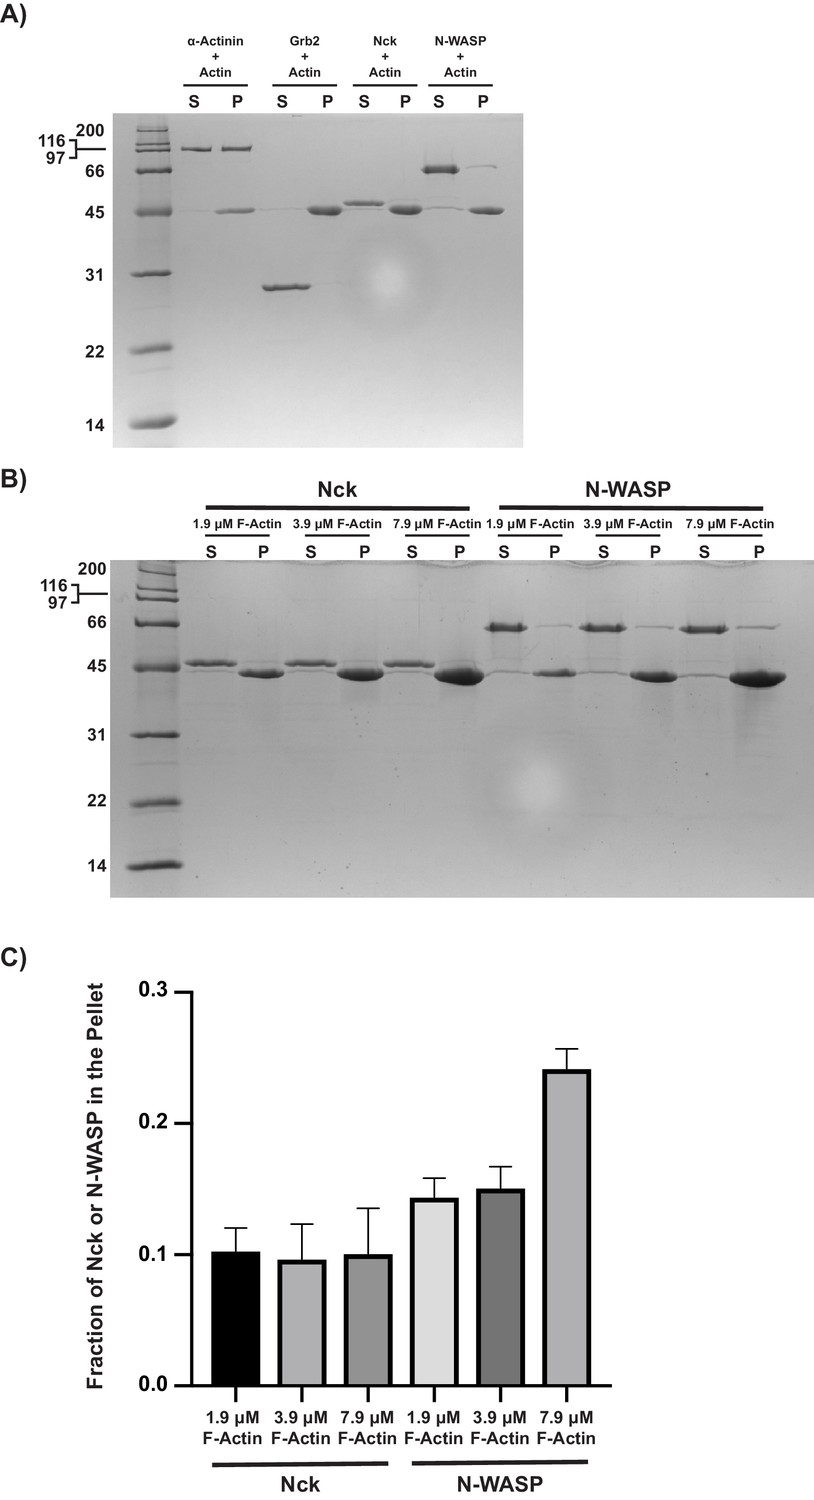
Nck does not co-sediment with actin filaments.
N-WASP co-sediments with actin filaments, but not to the same degree as α-actinin, a known actin filament binding protein. (A) Coomassie blue-stained SDS-PAGE gel showing co-sedimentation of α-actinin (positive control), Grb2 (negative control), Nck, and N-WASP with actin filaments. (B) Coomassie blue-stained SDS-PAGE gel showing co-sedimentation of Nck or N-WASP with increasing actin filament concentration. (C) Quantification of Nck and N-WASP bands shown in (B). Error bars report ±s.d. from N = 3 independent co-sedimentation assays and gels.
-
Figure 3—figure supplement 3—source data 1
Source data file for Figure 3—figure supplement 3.
- https://doi.org/10.7554/eLife.42695.018
Figure 3—figure supplement 4
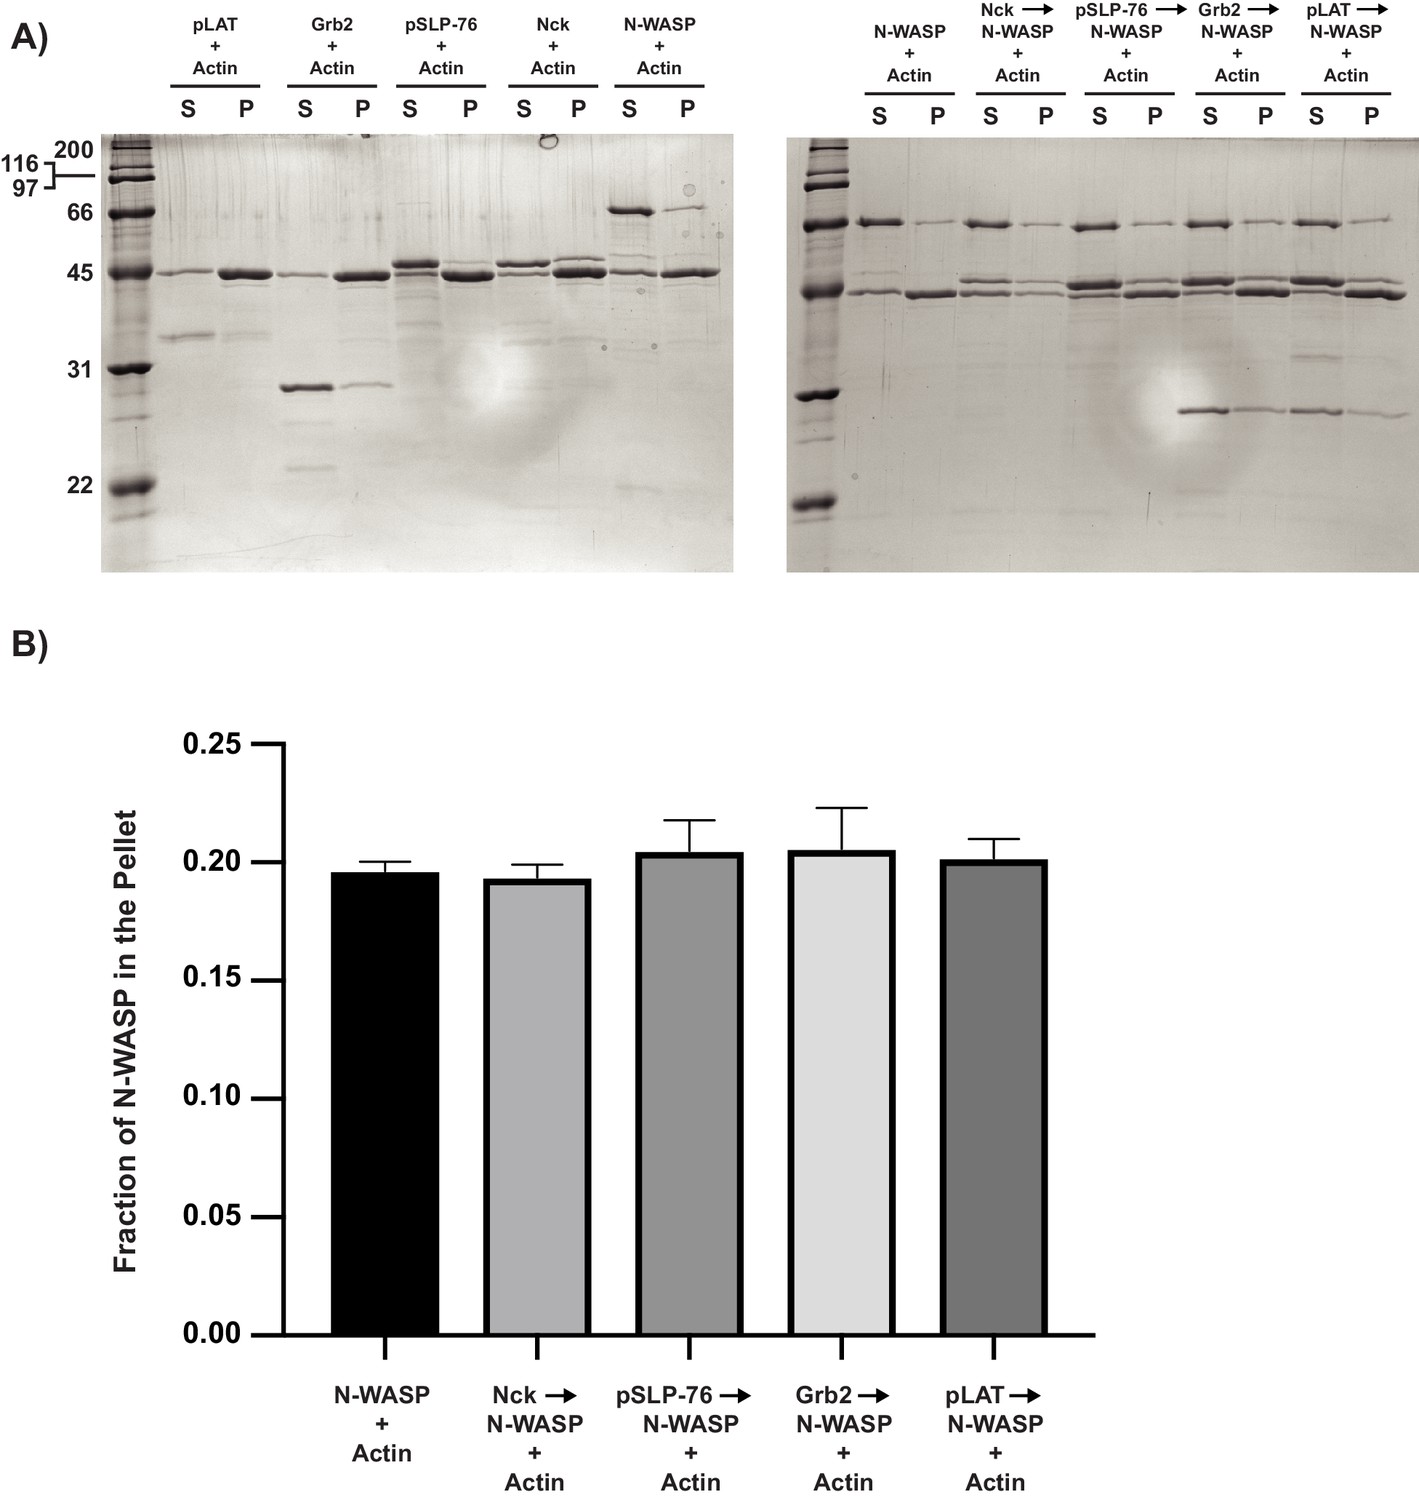
N-WASP binding partners do not increase N-WASP co-sedimentation with F-actin.
(A) (Left) Coomassie blue-stained SDS-PAGE gel showing co-sedimentation of pLAT, Grb2, pSLP-76, Nck, and N-WASP with actin filaments. (Right) Coomassie blue-stained SDS-PAGE gel showing co-sedimentation of N-WASP, Nck +N WASP, pSLP-76 +Nck + N-WASP, Grb2 +pSLP-76 + Nck + N-WASP, and pLAT +Grb2+pSLP-76 + Nck + N-WASP with actin filaments. It should be noted that pLAT is weakly stained by Coomassie blue, and thus the band appears fainter than other bands. (B) Quantification of N-WASP bands shown in (A). Error bars report ±s.d. from N = 3 independent co-sedimentation assays and gels.
-
Figure 3—figure supplement 4—source data 1
Source data file for Figure 3—figure supplement 4.
- https://doi.org/10.7554/eLife.42695.020
Figure 3—figure supplement 5
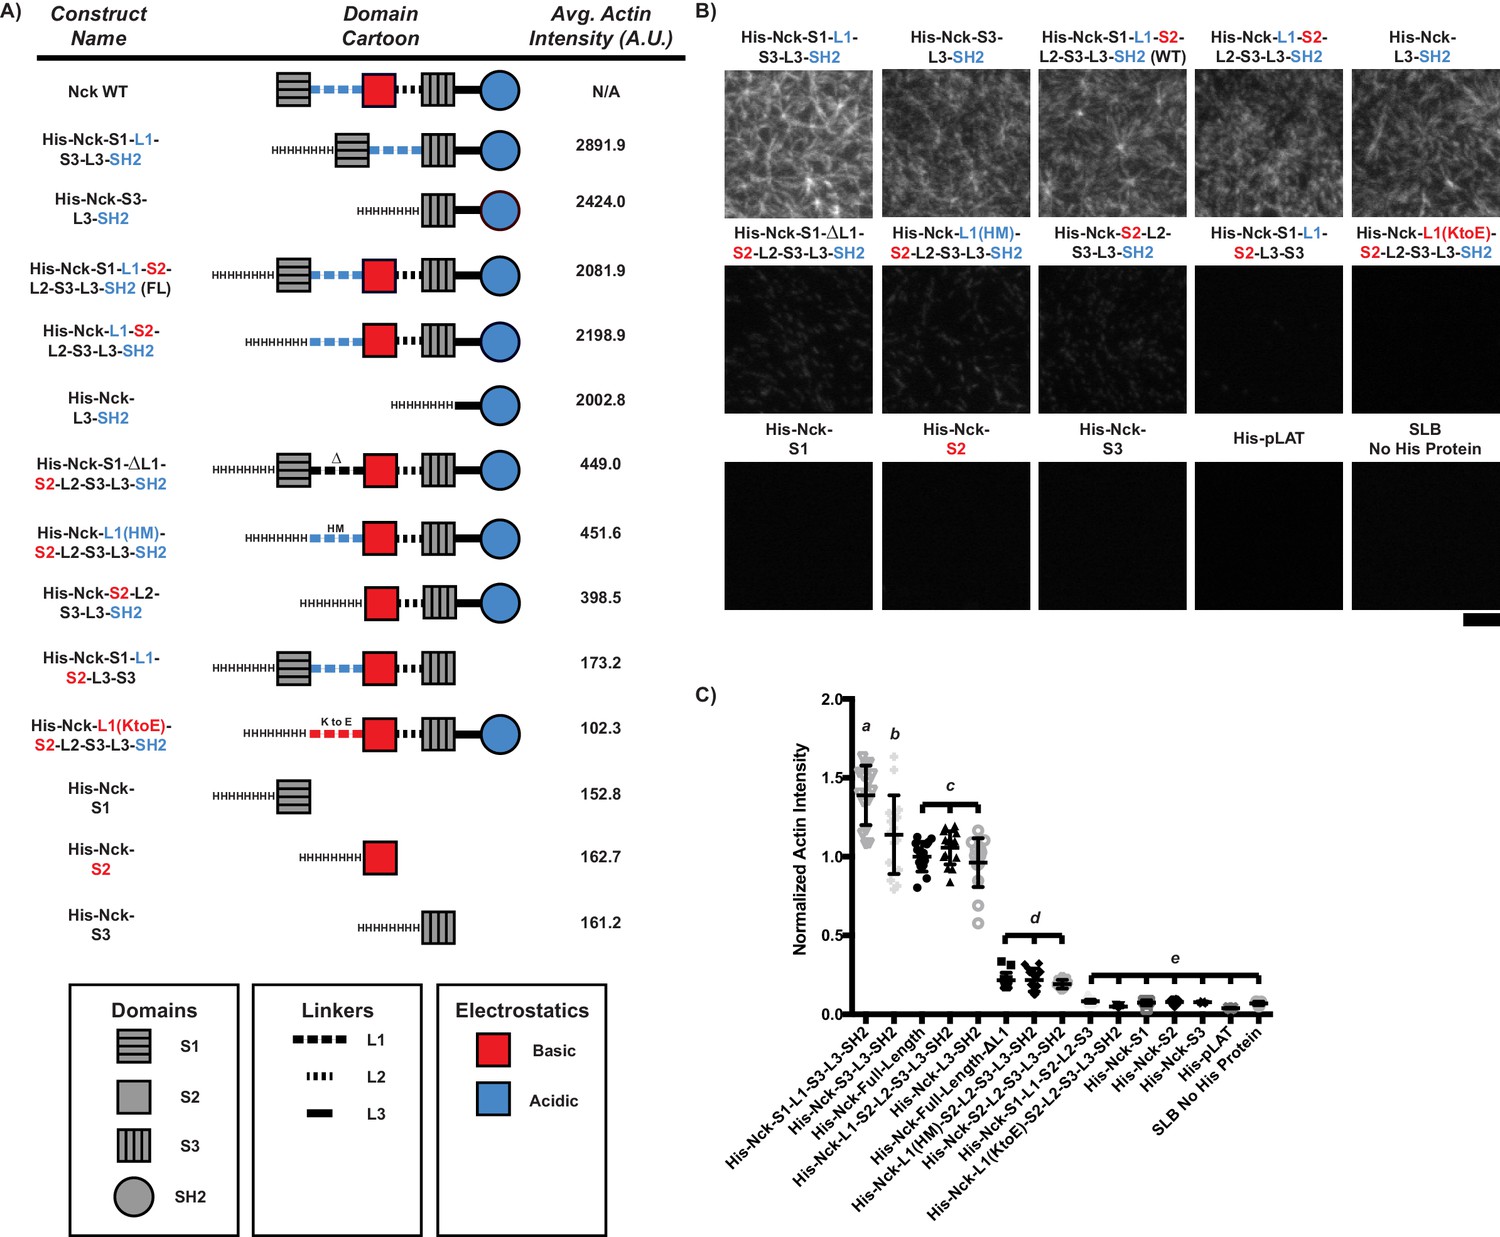
The ability of His-tagged Nck variants to recruit actin filaments to an SLB depends on the number of basic regions (concentrated in L1 and the SH2 domain) vs. the number of acidic regions (concentrated in the second SH3 domain).
If the number of basic regions > the number of acidic regions, the Nck variant will recruit actin filaments. (A) Names (left), domain schematics (center), and average actin intensity recruited to the bilayer (right) for each Nck variant. (B) TIRF microscopy images of rhodamine-actin recruited to SLBs coated with His-tagged Nck variants or His-tagged pLAT as a control. Scale Bar = 5 μm. All images set to same intensity range. (C) Normalized fluorescence intensity of rhodamine-actin (normalized to the average actin filament intensity of His-Nck-L3-SH2 experiments) recruited to SLBs coated with His-tagged Nck variants. Shown are individual data points and their mean ±s.d. from N = 15 fields of view from three independent experiments (5 FOV per experiment). Significance was determined using analysis of variance with Tukey’s multiple comparison test and found that p<0.0332 for b vs. c, p<0.0021 for d vs. e, and p<0.0001 for a vs. b, a vs. c, a vs. d, a vs. e, b vs. d, b vs. e, c vs. d, and c vs. e.
-
Figure 3—figure supplement 5—source data 1
Source data file for Figure 3—figure supplement 5.
- https://doi.org/10.7554/eLife.42695.022
Figure 3—figure supplement 6

His-tagged Nck variants containing mutations to L1 recruit actin to the bilayer in a density-dependent manner when L1 is WT or contains basic mutations.
(A) TIRF microscopy images of rhodamine-actin recruited to SLBs coated with His-tagged full-length Nck variants. Concentrations refer to the concentration of His-tagged protein in solution used to coat the bilayer; for pLAT-Alexa488, with 2% Ni-NTA lipid and His-pLAT-Alexa488 protein in the 0–100 nM range (100 nM data is from Figure 3B), the density of protein recruited to the bilayer scales approximately linearly with protein concentration in solution (not shown). Scale bar = 5 μm. All images set to same intensity range. (B) Normalized fluorescence intensity of rhodamine-actin (normalized to the average actin filament intensity of 100 nM His-NckWT experiments) recruited to SLBs coated with His-tagged full-length Nck variants. Shown are individual data points and their mean ±s.d. from N = 9 fields of view from three independent experiments (3 FOV per experiment). Significance was determined using analysis of variance with Tukey’s multiple comparison test and found that p<0.0332 for e vs. f, p<0.0002 for d vs. e, and p<0.0001 for a vs. b, a vs. c, a vs. d, a vs. e, a vs. f, b vs. c, b vs. d, b vs. e, b vs. f, c vs. d, c vs. e, and c vs. f.
-
Figure 3—figure supplement 6—source data 1
Source data file for Figure 3—figure supplement 6.
- https://doi.org/10.7554/eLife.42695.024
Figure 3—figure supplement 7
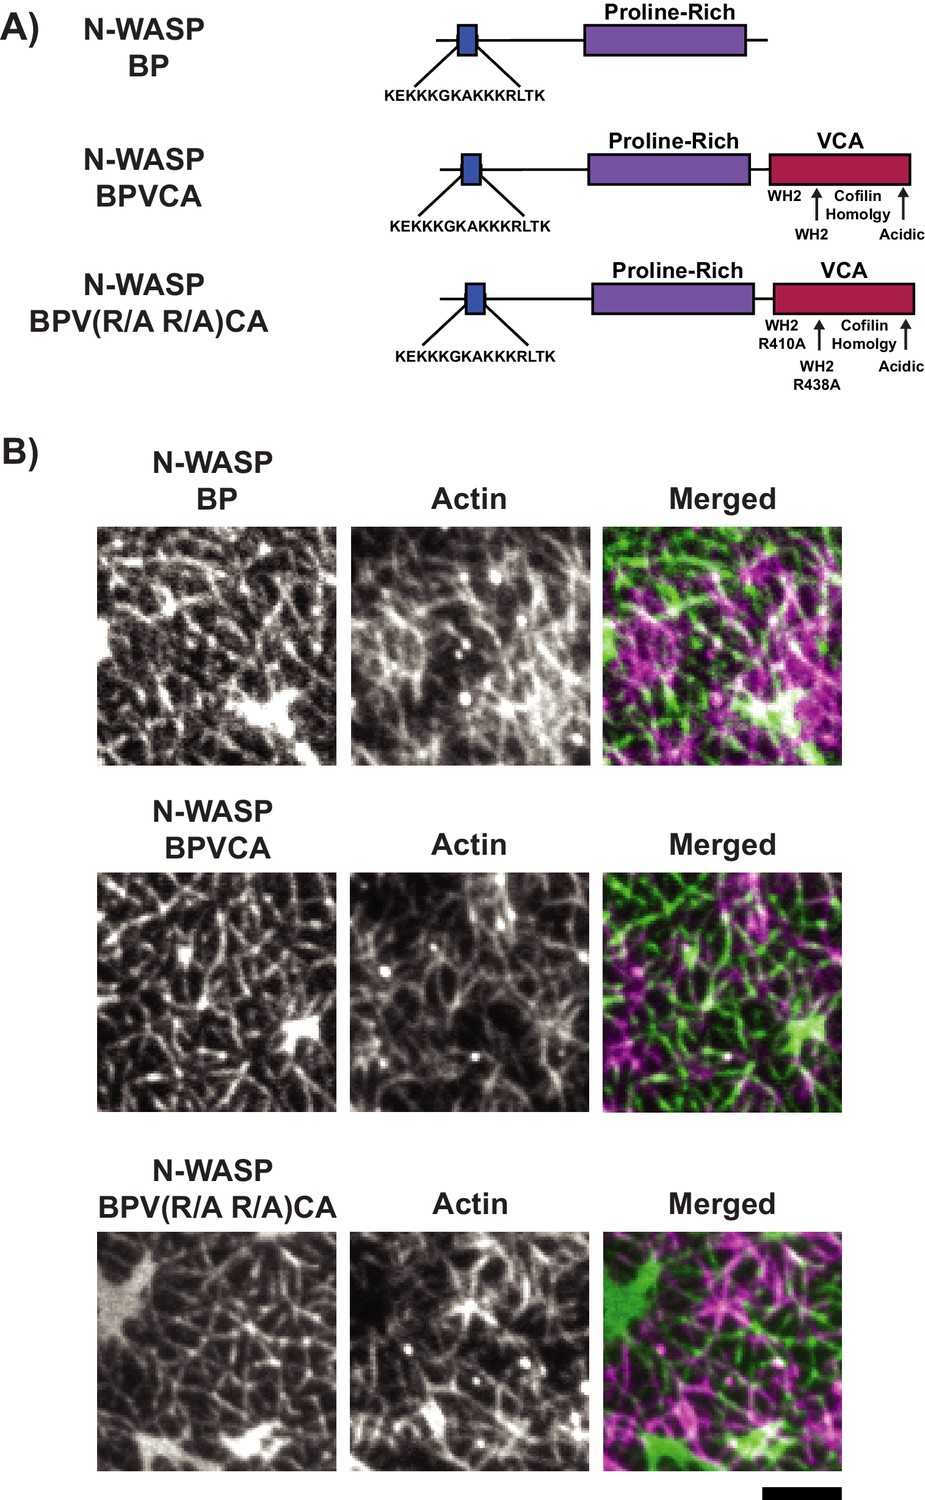
LAT condensates containing N-WASP fragments recruit actin to SLBs.
(A) Schematics of N-WASP variants used to generate LAT condensates. (B) TIRF microscopy images of pLAT → N-WASP variant condensates incubated with rhodamine-labeled actin filaments. Condensates containing N-WASP variants strongly recruited actin filaments to SLBs. Images are representative of 3 independent experiments. Scale bar = 5 μm. All images set to same intensity range.
Figure 3—figure supplement 8
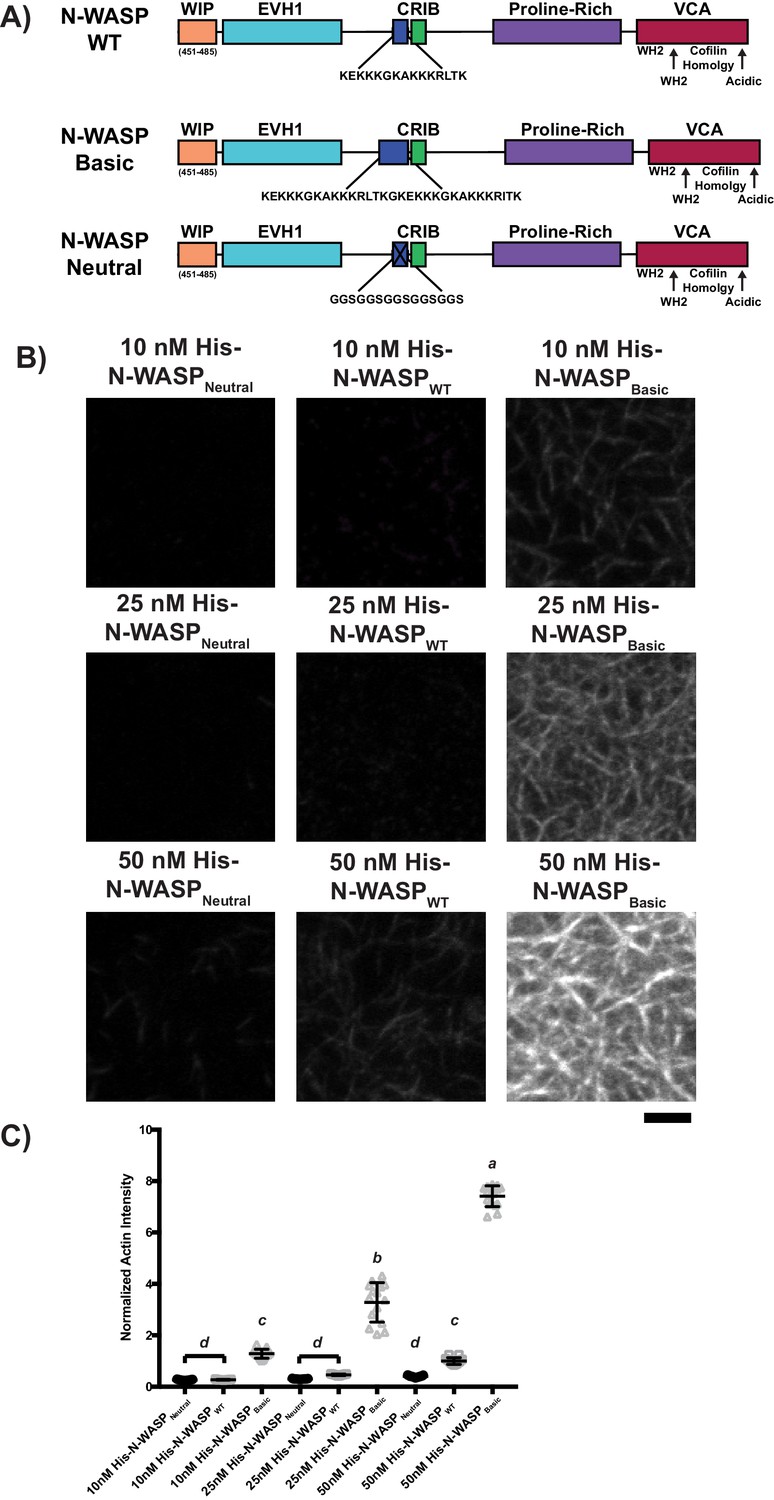
His-tagged N-WASPNeutral, N-WASPWT, or N-WASPBasic recruit actin filaments to SLBs in a density-dependent manner.
(A) Schematics of full-length N-WASP variants. (B) TIRF microscopy images of rhodamine-labeled actin filaments recruited to SLBs coated with His-tagged full-length N-WASP variants. Concentrations refer to the concentration of His-tagged protein in solution used to coat the bilayer; for pLAT-Alexa488, with 2% Ni-NTA lipid and His-pLAT-Alexa488 protein in the 0–50 nM range (50 nM data is from Figure 3C), the density of protein recruited to the bilayer scales approximately linearly with protein concentration in solution. Scale bar = 5 μm. All images set to same intensity range. (C) Normalized fluorescence intensity of rhodamine-actin (normalized to the average actin filament intensity of 50 nM His-N-WASPWT experiments) recruited to SLBs coated with His-tagged full-length N-WASP variants. Shown are individual data points and their mean ±s.d. for N = 15 fields of view from three independent experiments (5 FOV per experiment). Significance was determined using analysis of variance with Tukey’s multiple comparison test and found that p<0.0001 for a vs. b, a vs. c, a vs. d, b vs. c, b vs. d, and c vs. d.
-
Figure 3—figure supplement 8—source data 1
Source data file for Figure 3—figure supplement 8.
- https://doi.org/10.7554/eLife.42695.027
Figure 4 with 6 supplements
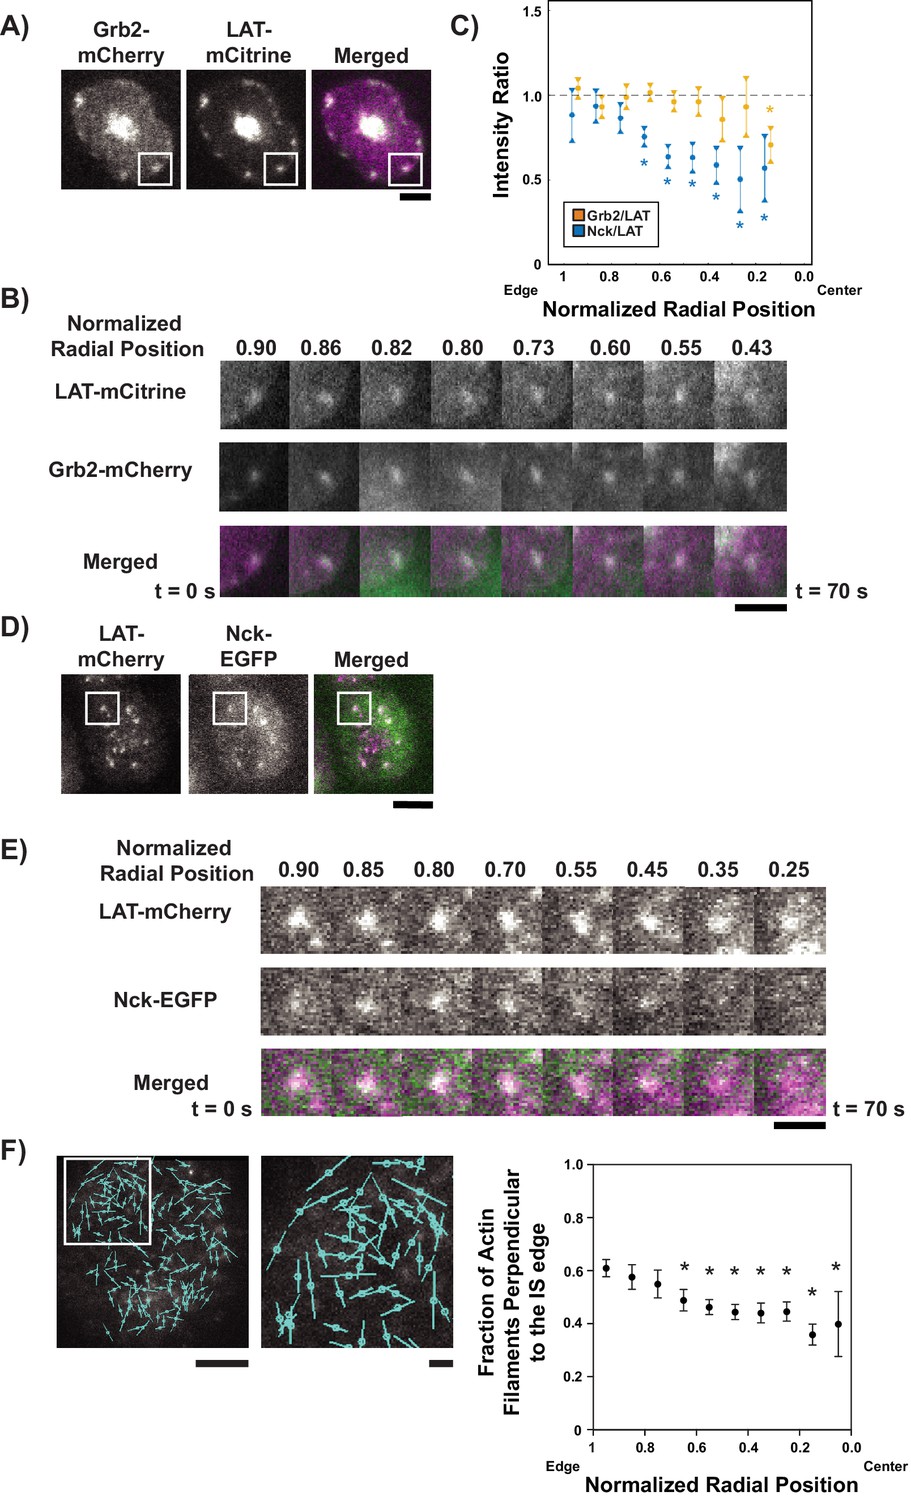
LAT condensates change composition as they move across the IS.
(A) TIRF microscopy image of Jurkat T cell expressing Grb2-mCherry (magenta in merge) and LAT-mCitrine (green in merge) activated on an SLB coated with OKT3 and ICAM-1. Scale Bar = 5 μm. (B) Magnification of boxed region in (A), with normalized radial position (one at synapse edge, 0 at cSMAC center) indicated above images and time indicated below. Scale bar = 2 μm. (C) Quantification of fluorescence intensity ratios of Grb2/LAT (gold) and Nck/LAT (blue) in LAT condensates in Jurkat T cells at different normalized radial positions. Measurements were made at identical relative locations but data points are slightly offset in the graph for visual clarity. Plot displays median and its 95% confidence interval from N = 125 condensates from 25 cells expressing Nck-sfGFP and LAT-mCherry from five independent experiments and 82 condensates from 11 cells expressing Grb2-mCherry and LAT-mCitrine from five independent experiments. Only tracks in which the mean Grb2 or Nck intensity was greater than one standard deviation above background during the first three measurements were used for this analysis. Asterisks indicate data points whose values differ significantly from the reference data point (radial position = 1.0–0.9 for Grb2 and radial position = 0.9–0.8 for Nck) as determined using a Wilcoxon rank-sum test with Bonferroni correction. The Bonferroni correction was used to achieve a total type-I error of 0.05. For eight comparisons, this leads to a significance threshold per pair = 0.006. (D) TIRF microscopy image of Jurkat T cell expressing Nck-sfGFP (green in merge) and LAT-mCherry (magenta in merge) activated on an SLB by OKT3 and ICAM-1. Scale Bar = 5 μm. (E) Magnification of boxed region in (D). Scale bars and details as in (B). (F) Fluorescence polarization microscopy image of a Jurkat T cell sparsely labeled with SiR-Actin and activated on an SLB coated with OKT3 and ICAM-1 (left, scale bar = 10 µm), magnification of boxed region in image (middle, scale bar = 2 µm), and fraction of filaments perpendicular (+ / - 45o) to the synapse edge (right). Cyan lines in left and center images indicate the orientation of the fluorescence dipole of the SiR fluorophore which in turn is oriented orthogonal to the underlying actin filament (see Figure 4—figure supplement 5). Shown are the mean ±s.d. from N = 13,052 particles from 6 cells. Asterisks indicate data points whose values differ significantly from the reference data point (radial position = 1.0–0.9) as determined using a t-test with Bonferroni correction to achieve a total type-I error of 0.05.
-
Figure 4—source data 1
Source data file for Figure 4F.
- https://doi.org/10.7554/eLife.42695.040
Figure 4—figure supplement 1
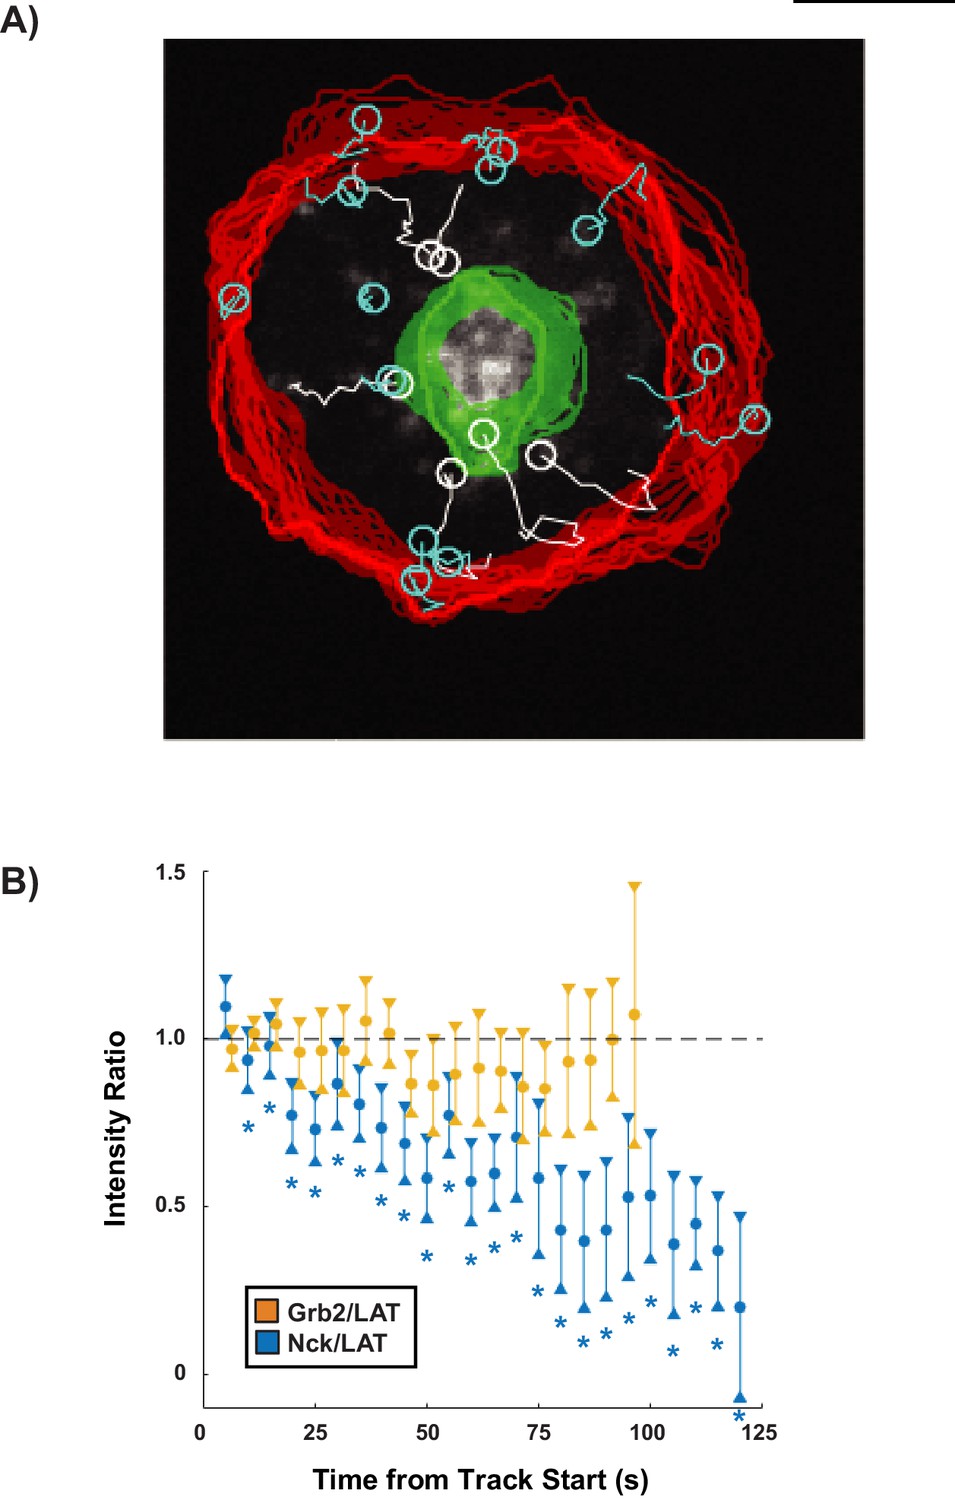
Nck dissipation from condensates is spatially regulated within the first 5 min of synapse formation.
(A) Example of analysis overlaid on a cell showing tracks of individual LAT condensates that move radially over the course of the time-lapse (white), LAT condensates tracks that do not move radially over the course of the time-lapse (cyan), the synapse edge over the course of the time-lapse (red), and the cSMAC over the course of the time-lapse (green). For information regarding detection of the synapse edge and cSMAC, see section 4A of the Supplemental Methods. Tracks that did not move radially (cyan) were discarded from the analysis. (B) Nck/LAT (blue) and Grb2/LAT (orange) ratios in condensates plotted against time. The ratio of Grb2:LAT remains constant over time while the ratio of Nck: LAT steadily decreases over time. Plot displays median and its 95% confidence interval from N = 125 condensates from 25 cells expressing Nck-sfGFP and LAT-mCherry from five independent experiments and 82 condensates from 11 cells expressing Grb2-mCherry and LAT-mCitrine from five independent experiments (same condensate trajectories used in Figure 4C, just aligned differently). Asterisks indicate data points whose values differ significantly from the reference data point (time = 0 s) as determined using a Wilcoxon rank-sum test with Bonferroni correction. The Bonferroni correction was used to achieve a total type-I error of 0.05. For 23 comparisons, this leads to a significance threshold per pair = 0.002.
Figure 4—figure supplement 2
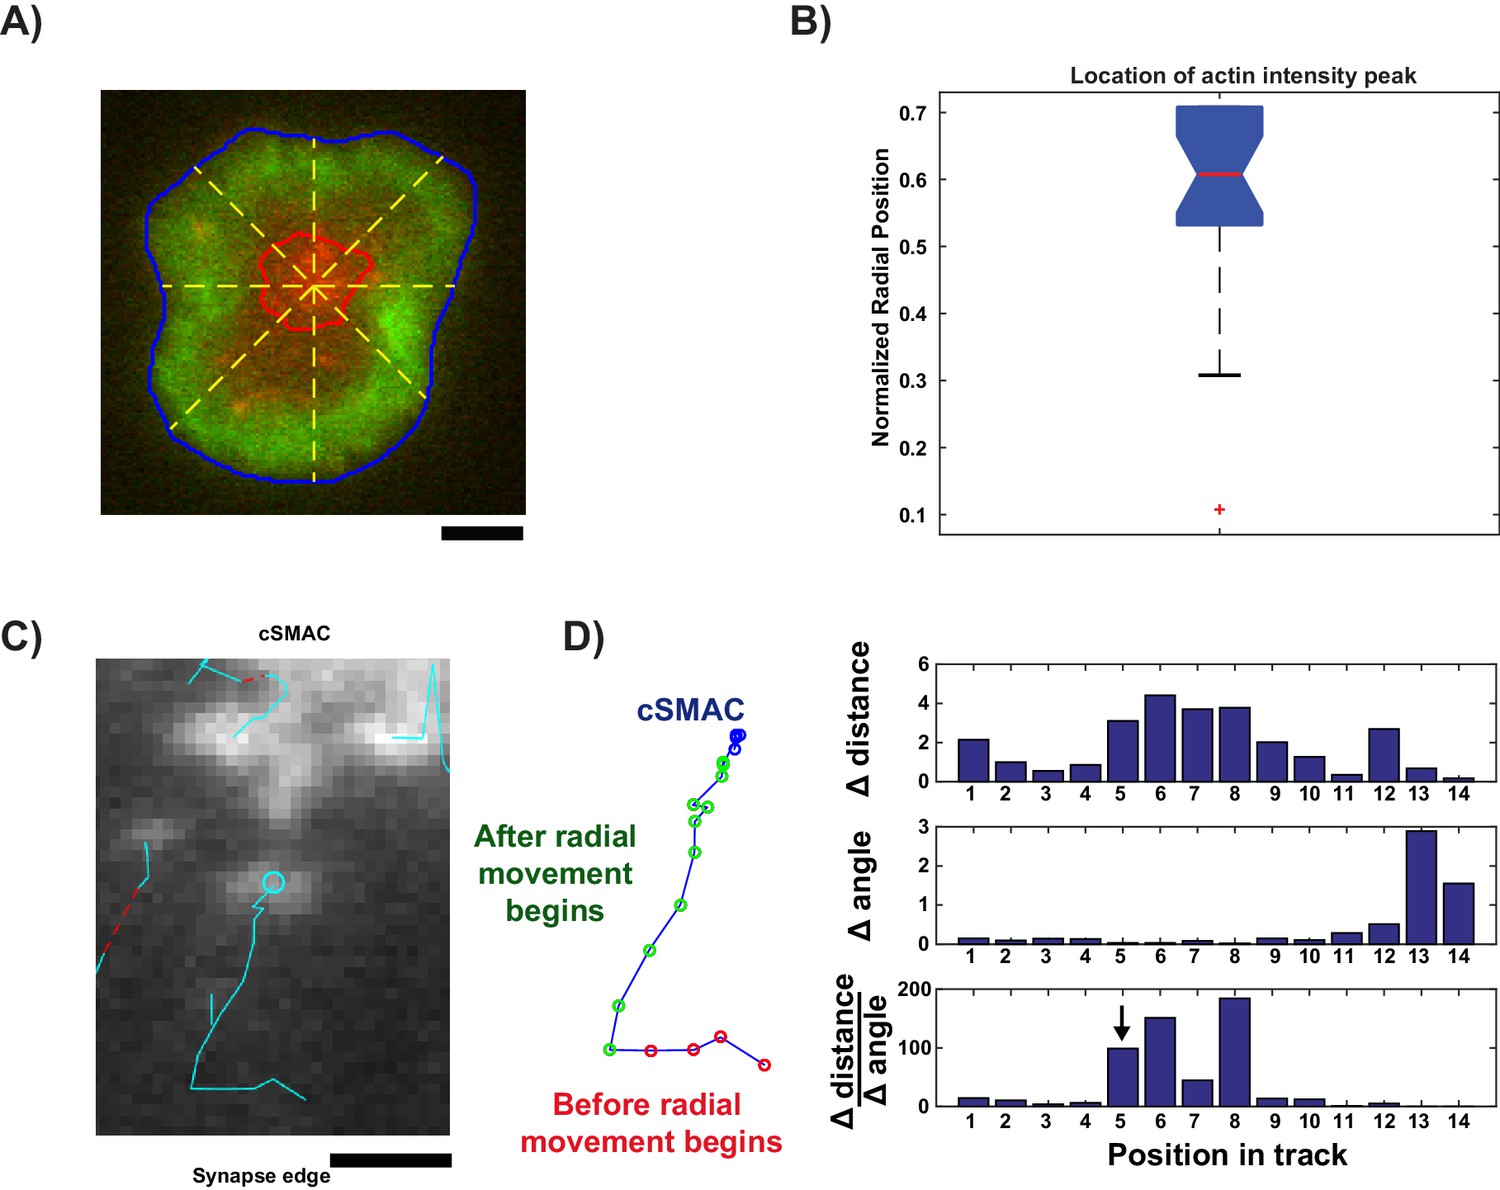
Image analysis for live cell data.
(A) Example cell (LAT channel: red, LifeAct (actin) channel: green) overlaid with segmented synapse edge (blue line), segmented cSMAC edge (red line), and lines from cSMAC center to synapse edge (yellow dashed lines, 45⁰ angles between neighboring lines) to measure actin intensity radial profile. (B) Box plot of the normalized radial position at which the actin intensity profile along each line (yellow dashed lines in (A)) reaches its maximum, for each time point in each cell. Box plot description: red central mark shows median; box edges show 25th and 75th percentiles; dashed whiskers extend to the most extreme data points not designated as ‘outliers’; and notch emanating from median indicates the 95% confidence interval around the median, shown for visual aid. (C) Example of condensate that is tracked before and after radial movement. (D) (left) Example track from C, segmented into three distinct regions: before actin engagement (red), after actin engagement (green), and inside cSMAC (blue). (right) Measurements used to detect when condensates begin to move radially: frame-to-frame change in distance to cSMAC center (top), frame-to-frame change in angle between consecutive displacements (middle), and ratio of previous two measurements (bottom). Arrow indicates position chosen based on the first ratio value in the top 10th percentile.
Figure 4—figure supplement 3

Photobleaching analysis of live-cell data.
The mean intensity within the segmented synapse, but outside the segmented cSMAC and detected condensate areas, was taken for each cell for every frame. All mean intensity measurements were normalized by the mean intensity of the first frame for each cell. The ratio of pooled normalized mean intensity (either Grb2: LAT or Nck: LAT) was plotted as a minimal boxplot showing only the median and notches, indicating the 95% confidence interval of each median. This analysis demonstrates that the two channels in live-cell time lapses exhibited similar photobleaching rates (which were overall minimal), and thus variable photobleaching did not contribute to the observed condensate composition changes over time.
Figure 4—figure supplement 4
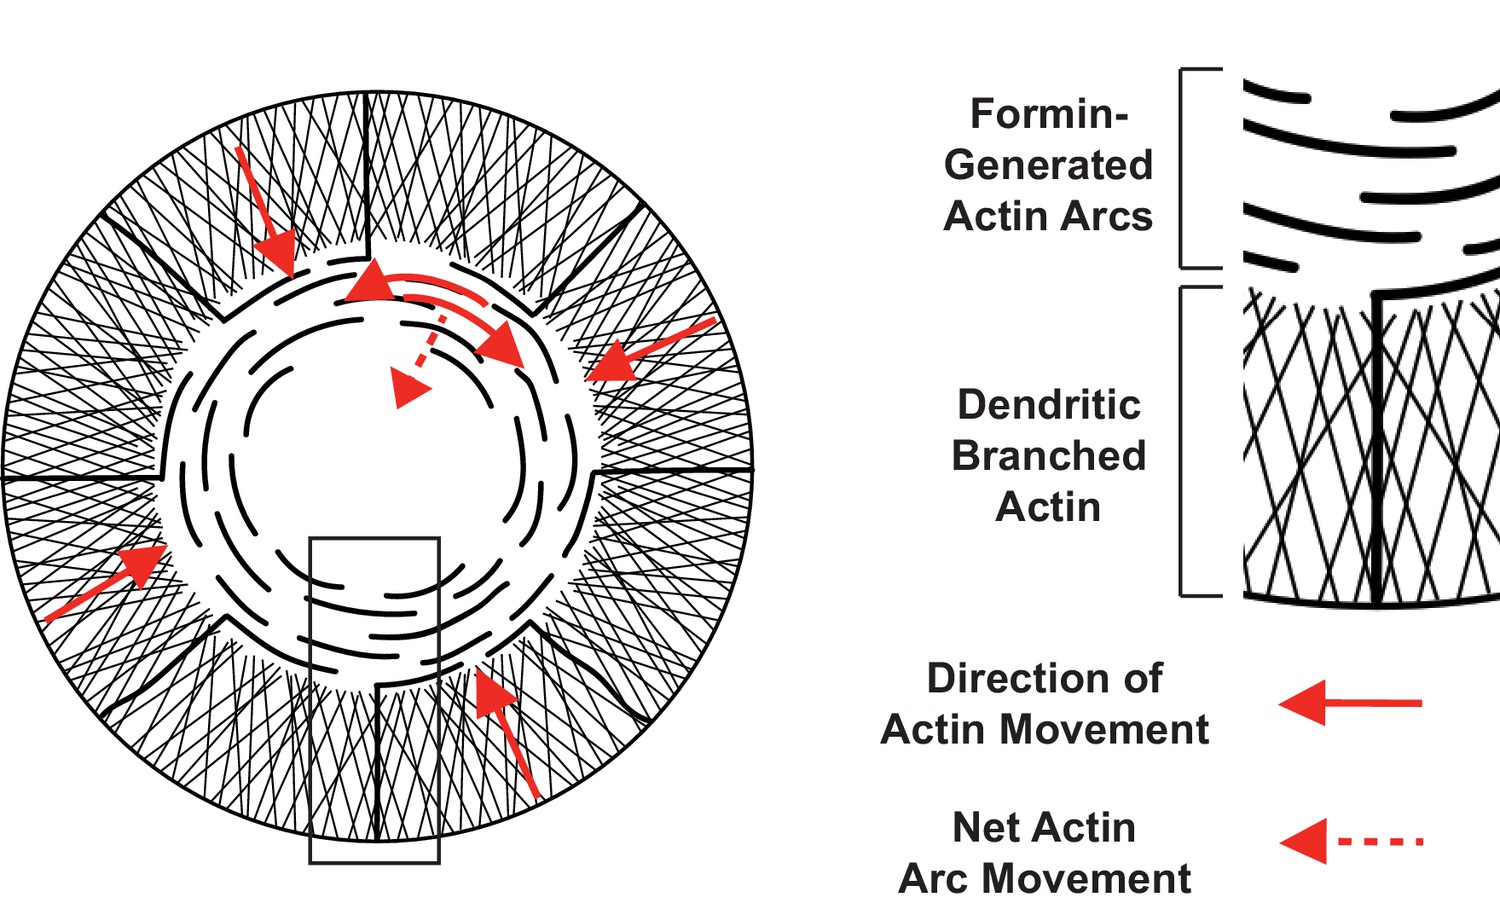
Two actin networks at the IS, with different architecture and movement.
(Left) Schematic of actin filament networks and direction of movement at the IS. In the outer region, a dendritic branched actin network undergoes retrograde flow approximately perpendicular to the edge of the synapse (solid red arrows at synapse edge). In the medial region, contractile actin arcs sweep towards the center of the synapse. Actin arcs move parallel to the synapse edge (solid red arrows; filaments sliding against each other through the action of myosin II). Parallel movement results in net movement that is perpendicular to the edge via a telescoping mechanism in which filament motion ‘closes’ the circular architecture (dotted red arrow; much like the diaphragm of a camera). (Right) Enlarged view of boxed region from schematic on left with dendritic branched actin network and formin-generated actin arcs.
Figure 4—figure supplement 5
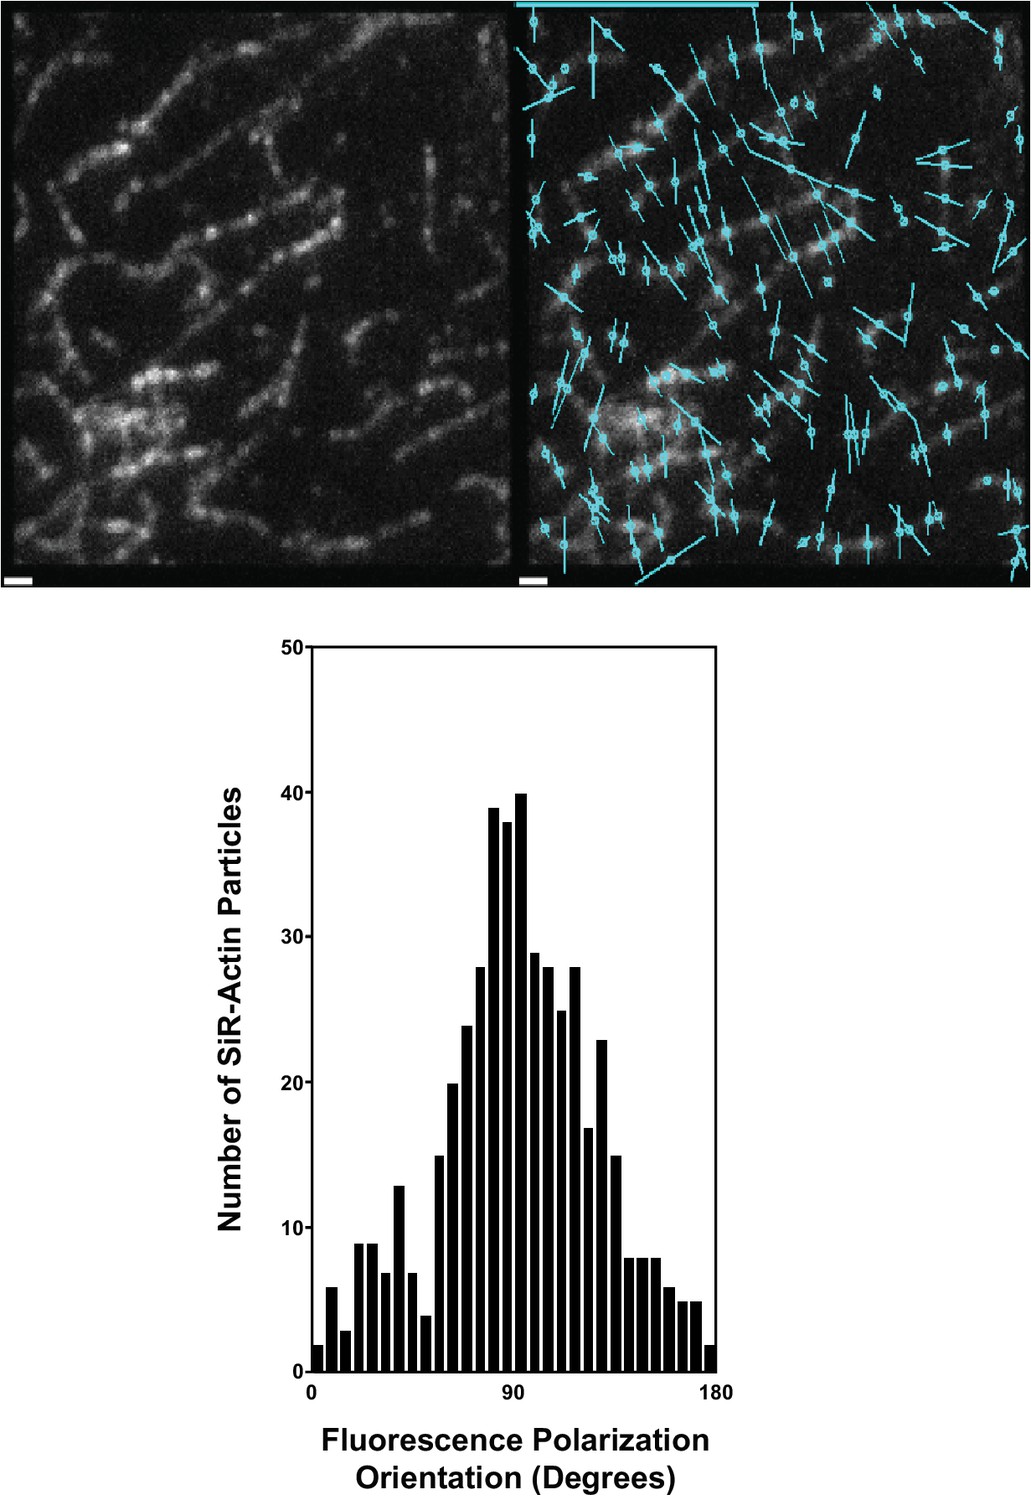
SiR-Actin polarity is perpendicular to actin filaments.
(top, left) SiR-Actin labeling of immobilized actin filaments attached to a glass coverslip. (top, right) The polarity of SiR-Actin bound to immobilized actin filaments is shown by circles transversed by a line to indicate the dye polarity (cyan). (bottom) Histogram showing the orientation of SiR-Actin bound to actin filaments with respect to the alignment of the actin filament. Scale Bar = 1 μm.
Figure 4—figure supplement 6

The two-dimensional extension of the dense actin network at the IS in Jurkat T cells activated on SLBs is independent of the three dimensional shape of the activated Jurkat T cell.
Scale Bar = 5 μm.
Figure 5 with 1 supplement
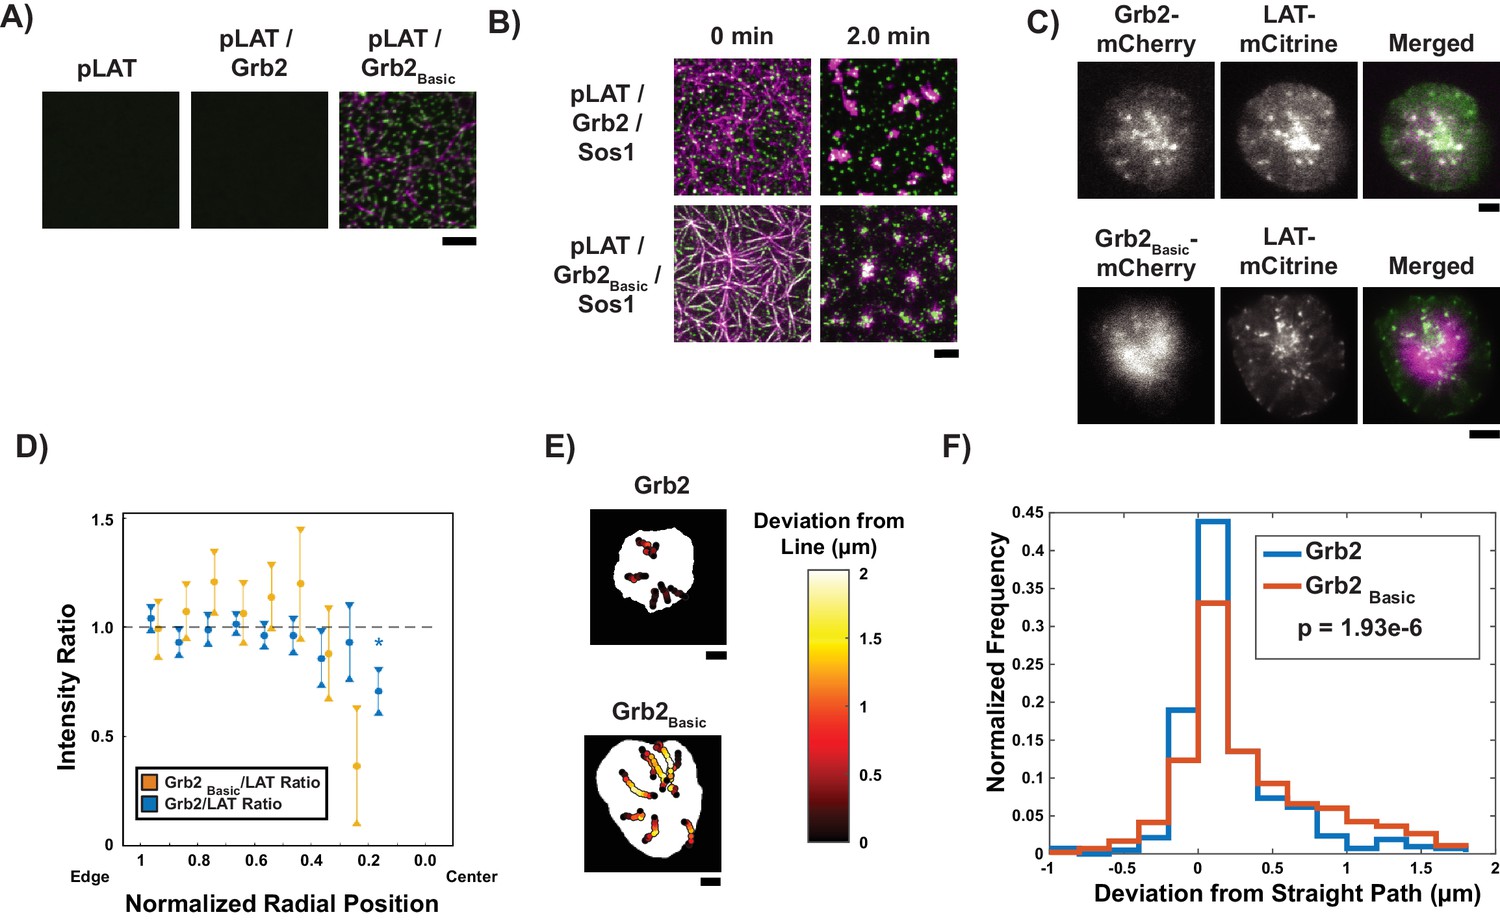
Grb2 fused to a basic molecular clutch can couple LAT condensates to actin.
(A) TIRF microscopy images of rhodamine-actin recruited to SLBs by His-tagged pLAT or condensates of pLAT → Grb2 or pLAT → Grb2Basic. Scale bar = 5 μm. (B) TIRF microscopy images of pLAT → Sos1 condensates containing Grb2WT (top row; data from Figure 2) or Grb2Basic (bottom row) formed in an actin network before (t = 0 min) and after (t = 2 min) addition of myosin II. Actin shown in magenta and LAT condensates in green. Scale bar = 5 μm. (C) TIRF microscopy image of Jurkat T cell expressing Grb2-mCherry (top, magenta in merge) or Grb2Basic-mCherry (bottom, magenta in merge) and LAT-mCitrine (green in merge) activated on an SLB coated with OKT3 and ICAM-1. Scale Bar = 5 μm. (D) Fluorescence intensity ratios of Grb2/LAT (blue, data from Figure 4C) or Grb2Basic / LAT in condensates (gold) at different normalized radial positions. Measurements were made at identical relative locations but data are slightly offset in the graph for visual clarity. Plot displays median and notches from boxplot for 95% confidence interval from N = 44 condensates from 12 cells expressing Grb2Basic-mCherry and LAT-mCitrine from seven independent experiments and 82 condensates from 11 cells expressing Grb2-mCherry and LAT-mCitrine from five independent experiments (same cells as in Figure 4C). Only tracks in which the mean Grb2 or Grb2Basic intensity was greater than one standard deviation above background during the first three measurements were used to generate this plot. Asterisk indicates data point whose value differs significantly from the reference data point (radial position = 1.0–0.9) as determined using a Wilcoxon rank-sum test with Bonferroni correction. The Bonferroni correction was used to achieve a total type-I error of 0.05. For eight comparisons, this leads to a significance threshold per pair = 0.006. (E) Trajectories of LAT condensates in Jurkat T cells expressing Grb2-mCherry (top) or Grb2Basic-mCherry (bottom) recorded over 2 to 5 min of imaging. Trajectories are color-coded as indicated in the legend at right according to deviation from a straight line between the estimated starting point of actin engagement and just before entering the cSMAC (see Materials and methods). Scale bar = 5 μm. (F) Distribution of deviations from a straight line for condensates in Jurkat T cells expressing Grb2-mCherry (red) or Grb2Basic-mCherry (blue). N = 44 condensates from 12 cells expressing Grb2Basic-mCherry and LAT-mCitrine from seven independent experiments and 82 condensates from 11 cells expressing Grb2-mCherry and LAT-mCitrine from independent experiments (same cells as in Figure 4C). P-value is for comparing the two distributions via a Kolmogorov-Smirnov test. Only tracks in which the mean Grb2 or Grb2Basic intensity was greater than one standard deviation above background during the first three measurements were used to generate this plot.
Figure 5—figure supplement 1
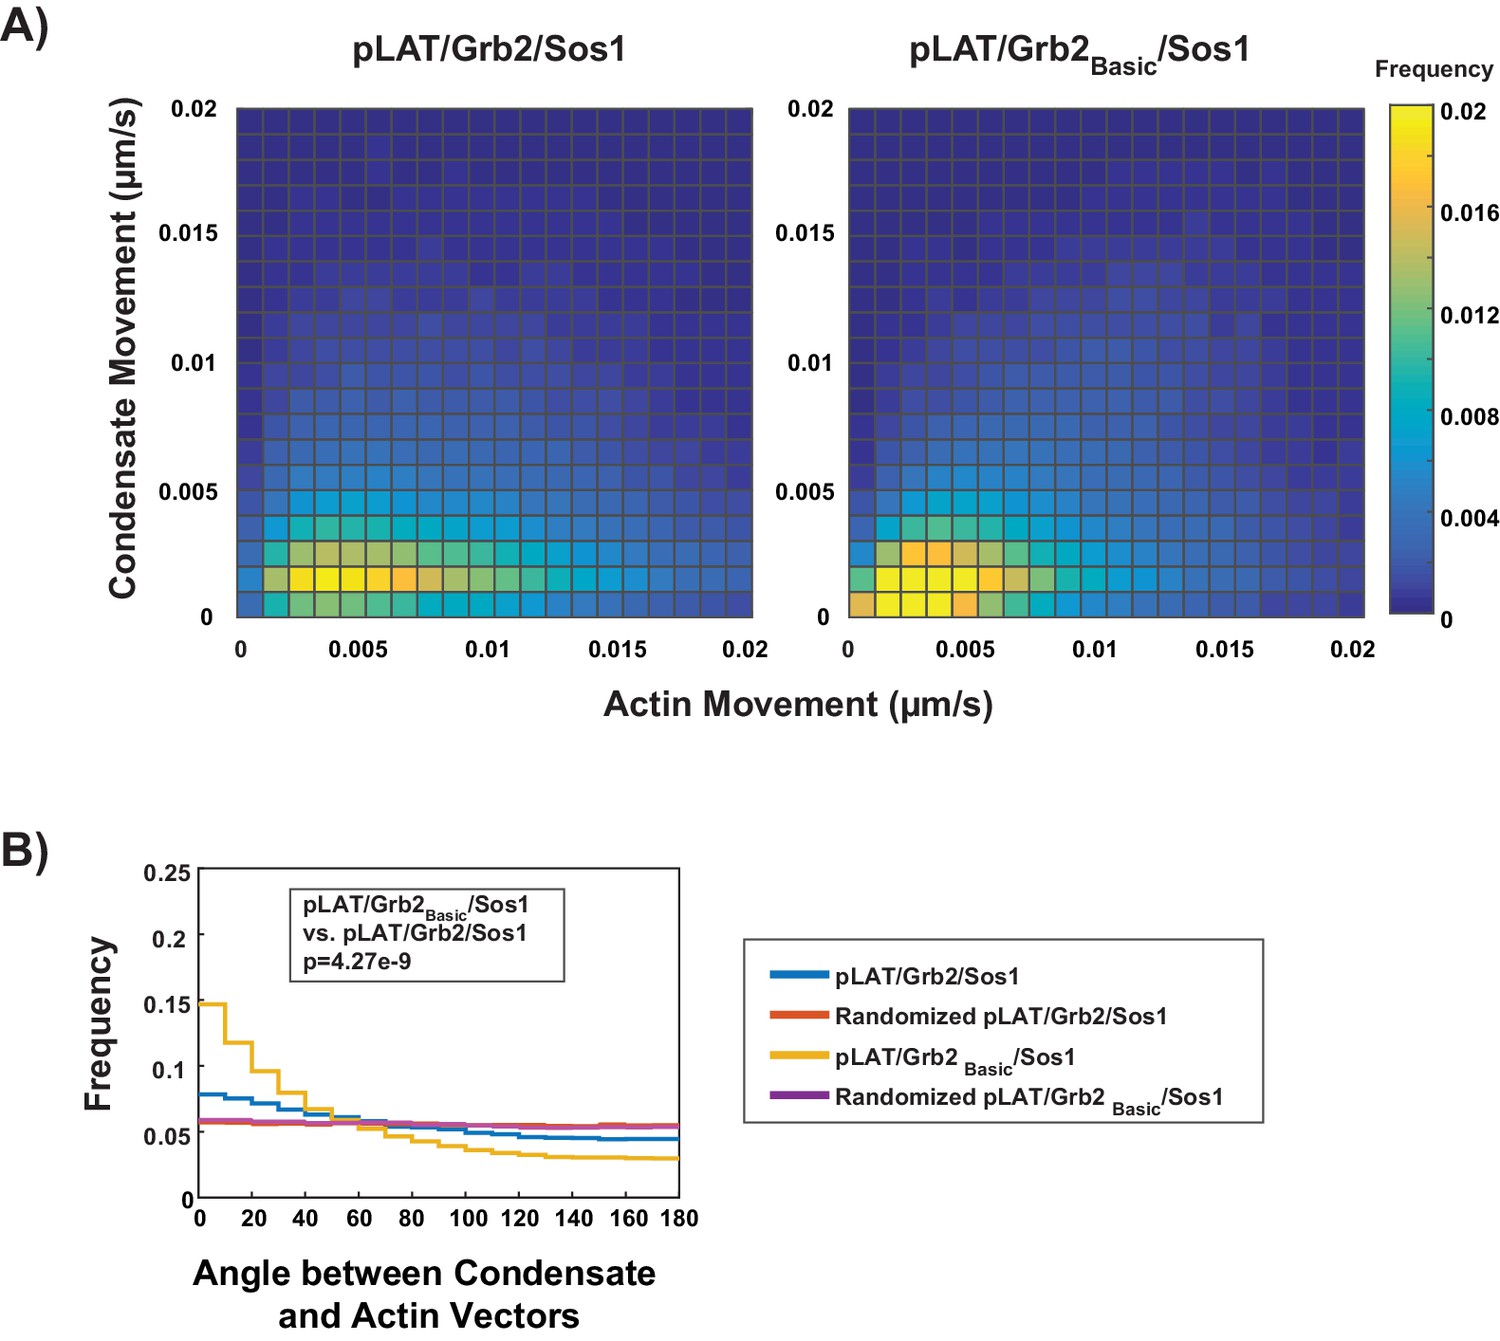
Adding a doubled N-WASP basic domain to Grb2 (Grb2Basic) enables pLAT / Grb2Basic/Sos1 condensates to move with actin to a better degree than condensates formed with WT Grb2.
(A) Condensate speed vs. actin speed for pLAT/Grb2/Sos1 (from Figure 3) or pLAT / Grb2Basic/Sos1 condensates in contracting actin networks from STICS analysis. Type of condensate indicated above each heat map. Heat map indicates frequency in each bin, that is counts in each bin normalized by total number of counts. (B) Distribution of the angle between actin and condensate movement vectors for pLAT/Grb2/Sos1 (blue, from Figure 3), pLAT / Grb2Basic/Sos1 (gold), randomized pLAT/Grb2/Sos1 (red, from Figure 3), or randomized pLAT / Grb2Basic/Sos1 (purple). Data in (A) and (B) were pooled from N = 15 fields of view from three independent experiments (5 FOV per experiment).
Figure 6 with 1 supplement

Formin activity is necessary for Nck dissipation from LAT condensates.
(A) Fluorescence intensity ratios of Nck/LAT in condensates in Jurkat T cells treated with DMSO (blue) or the formin inhibitor, SMIFH2, (gold) at different normalized radial positions. Measurements were made at identical relative locations but data are slightly offset in the graph for visual clarity. Plot displays median and notches from boxplot for 95% confidence interval from N = 43 condensates from 11 DMSO-treated cells from five individual experiments and 102 condensates from 14 SMIFH2-treated cells from five individual experiments. Only tracks in which the mean Nck intensity was greater than one standard deviation above background during the first three measurements were used to generate this plot. The first DMSO data point (radial position = 1.0–0.9) does not appear in the plot because the number of detected condensates was too small (<10) to generate a statistically meaningful measurement. Asterisks indicate data points whose values differ significantly from the reference data point (radial position = 0.9–0.8) as determined using a Wilcoxon rank-sum test with Bonferroni correction. The Bonferroni correction was used to achieve a total type-I error of 0.05. For eight comparisons, this leads to a significance threshold per pair = 0.006. (B, C) Magnification of boxed regions from Figure 6—figure supplement 1 of condensates containing LAT-mCherry (magenta in merge) and Nck-sfGFP (green in merge) during their trajectories across the IS in a cell treated with DMSO (B) or SMIFH2 (C). Normalized radial position indicated above image panels and time below panels. Scale bar = 2 μm.
Figure 6—figure supplement 1
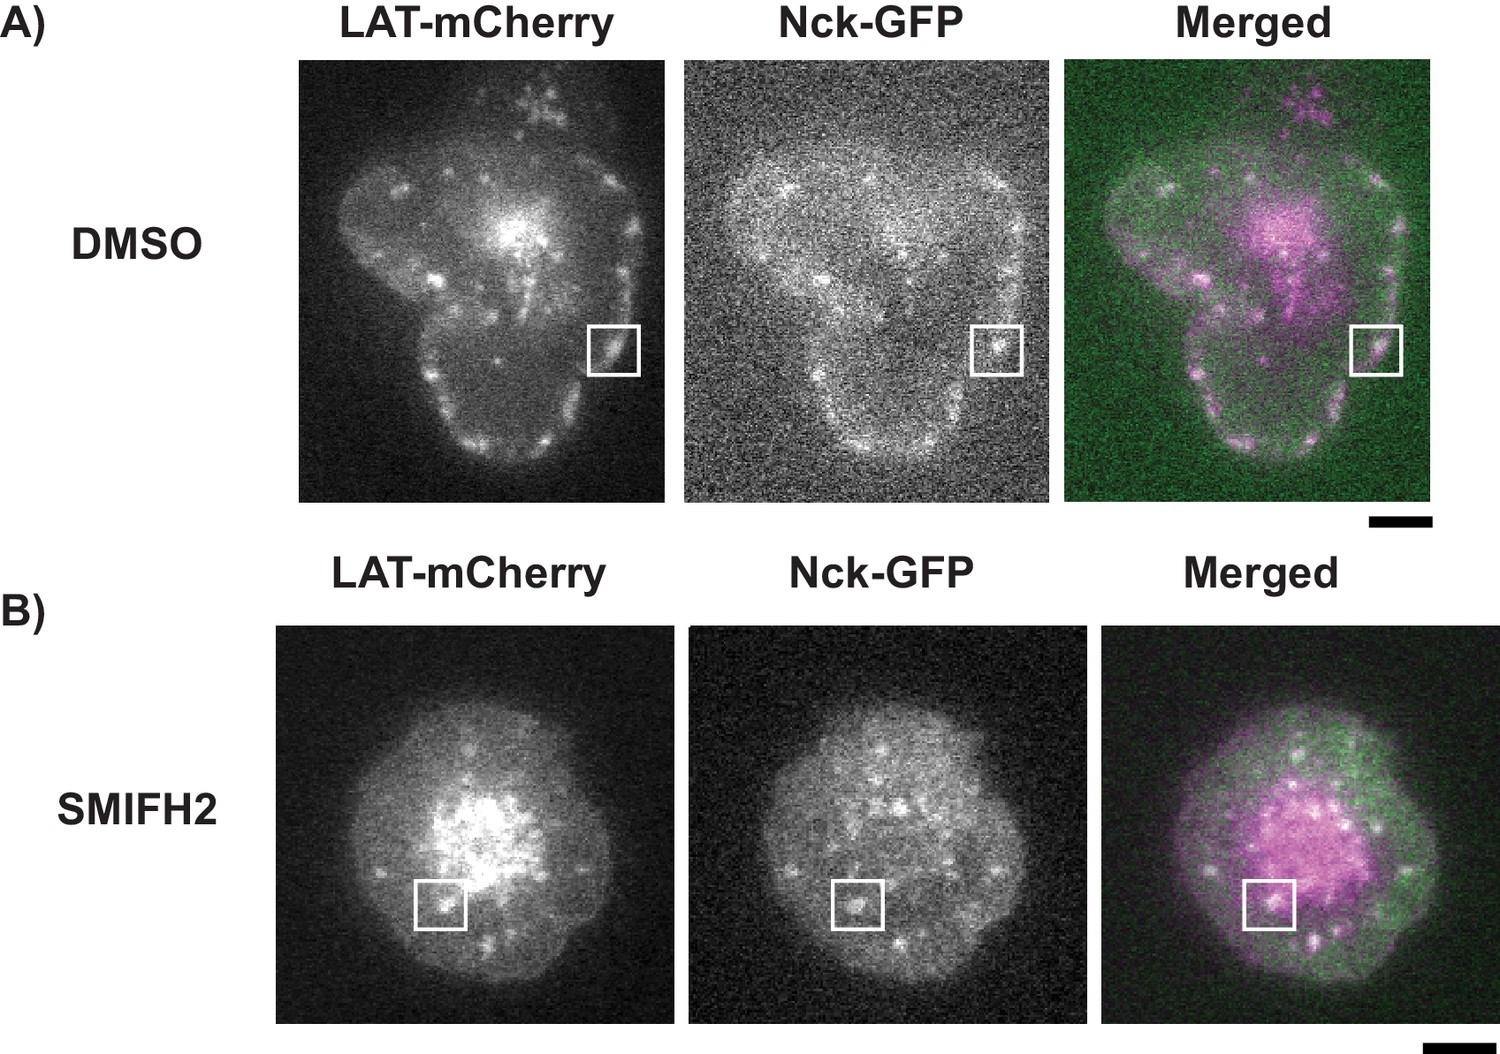
Example images showing DMSO- or SMIFH2-treated Jurkat T cells activated on SLBs.
(A, B) TIRF microscopy images of Jurkat T cells expressing Nck-sfGFP and LAT-mCherry and treated with DMSO (A) or the formin inhibitor SMIFH2 (B) for 5 min prior to activation on SLBs. Scale Bars = 5 μm.
Videos
Video 1
Reconstitution of LAT condensate formation and movement using different component mixtures.
TIRF microscopy revealed LAT condensate formation and movement on supported lipid bilayers. His8-pLAT-Alexa488 was attached to Ni-functionalized SLBs at 500 molecules / μm2. Condensate component mixtures are indicated at the top of each movie panel. All reconstitutions were performed in 75 mM KCl. Condensates were formed by adding 125 nM Grb2 and 125 nM Sos1 (pLAT → Sos1); 125 nM Grb2, 62.5 nM Sos1, and 62.5 nM pSLP-76 (pLAT → pSLP-76); 125 nM Grb2, 62.5 nM Sos1, 62.5 nM pSLP-76, a 125 nM Nck (pLAT → Nck); 125 nM Grb2, 62.5 nM Sos1, 62.5 nM pSLP-76, 125 nM Nck, and 125 nM N-WASP (pLAT → N-WASP); or 125 nM Grb2, 62.5 nM Sos1, 62.5 nM pSLP-76, 125 nM Nck, and 125 nM WASP (pLAT → WASP). After formation, most condensates were either immobile or displayed confined movement regardless of their composition. Movie shows a 32 μm x 32 μm field of view for each movie panel. The movie is played at nine fps with frame intervals of 15 s.
Video 2
Reconstitution of LAT condensate formation and movement using different component mixtures in actin networks.
TIRF microscopy revealed LAT condensate formation and movement on supported lipid bilayers in an actin network. His8-pLAT-Alexa488 (green) was attached to Ni-functionalized SLBs at 500 molecules / μm2. Actin filaments (magenta) were attached to the same bilayers via His10-ezrin actin binding domains. Condensate component mixtures are indicated at the top of each movie panel. All reconstitutions were performed in 75 mM KCl. Condensates were formed by adding 125 nM Grb2 and 125 nM Sos1 (pLAT → Sos1); 125 nM Grb2, 62.5 nM Sos1, and 62.5 nM pSLP-76 (pLAT → pSLP-76); 125 nM Grb2, 62.5 nM Sos1, 62.5 nM pSLP-76, and 125 nM Nck (pLAT → Nck); 125 nM Grb2, 62.5 nM Sos1, 62.5 nM pSLP-76, 125 nM Nck, and 125 nM N-WASP (pLAT → N-WASP); or 125 nM Grb2, 62.5 nM Sos1, 62.5 nM pSLP-76, 125 nM Nck, and 125 nM WASP (pLAT → WASP). After formation, pLAT → Sos1 and pLAT → pSLP-76 condensates displayed increased mobility (compared to condensates formed in the absence of actin filaments) while pLAT → Nck and pLAT → N-WASP showed decreased mobility (compared to condensates formed in the absence of actin networks) while binding to and wetting actin filaments. Movie shows a 32 μm x 32 μm field of view for each movie panel. The movie is played at nine fps with frame intervals of 15 s.
Video 3
Reconstitution of LAT condensate formation and movement using different component mixtures in steady-state active actomyosin networks.
TIRF microscopy revealed LAT condensate formation and movement on supported lipid bilayers in an active actomyosin network. His8-pLAT-Alexa488 (green) was attached to Ni-functionalized SLBs at 500 molecules / μm2. Actin filaments (magenta) were attached to the same bilayers via His10-ezrin actin binding domains. 100 nM myosin II and 1 mM ATP were added to actin filaments prior to LAT condensate formation to induce actin filament movement. Condensate component mixtures are indicated at the top of each movie panel. All reconstitutions were performed in 75 mM KCl. Condensates were formed by adding 125 nM Grb2 and 125 nM Sos1 (pLAT → Sos1); 125 nM Grb2, 62.5 nM Sos1, and 62.5 nM pSLP-76 (pLAT → pSLP-76); 125 nM Grb2, 62.5 nM Sos1, 62.5 nM pSLP-76, and 125 nM Nck (pLAT → Nck); 125 nM Grb2, 62.5 nM Sos1, 62.5 nM pSLP-76, 125 nM Nck, and 125 nM N-WASP (pLAT → N-WASP); or 125 nM Grb2, 62.5 nM Sos1, 62.5 nM pSLP-76, 125 nM Nck, and 125 nM WASP (pLAT → WASP). After formation, all condensate types displayed increased condensate mobility (compared to condensates formed in the absence of actin filaments or in an actin network). Movie shows a 32 μm x 32 μm field of view for each movie panel. The movie is played at nine fps with frame intervals of 15 s.
Video 4
Reconstitution of LAT condensate movement using different component mixtures in contracting actomyosin networks.
TIRF microscopy revealed actin filament and LAT condensate movement on supported lipid bilayers in a contracting actomyosin network. His8-pLAT-Alexa488 (green) was attached to Ni-functionalized SLBs at 500 molecules / μm2. Actin filaments (magenta) were attached to the same bilayers via His10-ezrin actin binding domains. Condensate component mixtures are indicated at the top of each movie panel. All reconstitutions were performed in 50 mM KCl. Condensates were formed by adding 125 nM Grb2 and 125 nM Sos1 (pLAT → Sos1); 125 nM Grb2, 62.5 nM Sos1, 62.5 nM pSLP-76, 125 nM Nck, and 125 nM N-WASP (pLAT → N-WASP); or 125 nM Grb2, 62.5 nM Sos1, 62.5 nM pSLP-76, 125 nM Nck, and 125 nM WASP (pLAT → WASP). After formation, pLAT → Sos1 condensates were randomly distributed within the actin network while pLAT → N-WASP condensates bound to and wet actin filaments. Actin filament contraction was induced by adding 100 nM myosin II. pLAT→ Sos1 condensates did not efficiently move with contracting actin filaments while pLAT → N-WASP condensates efficiently moved with contracting actin filaments. pLAT → WASP condensates moved with contracting actin filaments with an efficiency between pLAT → Sos1 and pLAT → N-WASP condensates. Movie shows a 52 μm x 52 μm field of view for each movie panel. The movie is played at five fps with frame intervals of 5 s.
Video 5
Reconstitution of LAT condensate movement using different component mixtures containing N-WASPNeutral or N-WASPBasic in contracting actomyosin networks.
TIRF microscopy revealed actin filament and LAT condensate movement on supported lipid bilayers in a contracting actomyosin network. His8-pLAT-Alexa488 (green) was attached to Ni-functionalized SLBs at 500 molecules / μm2. Actin filaments (magenta) were attached to the same bilayers via His10-ezrin actin binding domains. Condensate component mixtures are indicated at the top of each movie panel. All reconstitutions were performed in 50 mM KCl. Condensates were formed by adding 125 nM Grb2, 62.5 nM Sos1, 62.5 nM pSLP-76, 125 nM Nck, and 125 nM N-WASPNeutral (pLAT → N-WASPNeutral) or 125 nM Grb2, 62.5 nM Sos1, 62.5 nM pSLP-76, 125 nM Nck, and 125 nM N-WASPBasic (pLAT → N-WASPBasic). After formation, both types of condensates bound to and wet actin filaments, although pLAT → N-WASPNeutral condensates did not wet filaments to the same degree as either pLAT → N-WASPWT condensates (compare with Video 6) or pLAT → N-WASPBasic. Actin filament contraction was induced by adding 100 nM myosin II. pLAT→ N-WASPNeutral condensates did not efficiently move with contracting actin filaments (although they moved with actin filaments to a greater degree than pLAT → Sos1 condensates [compare with Video 6]) while pLAT → N-WASPBasic condensates efficiently moved with contracting actin filaments. Movie shows a 52 μm x 52 μm field of view for each movie panel. The movie is played at five fps with frame intervals of 5 s.
Video 6
Single particle tracking of LAT condensates in activated Jurkat T cells.
TIRF microscopy of an activated Jurkat T cell expressing LAT-mCherry on a SLB coated with ICAM-1 and OKT3. LAT condensates form at the synapse edge (cyan perimeter) and are tracked, using uTrack, as they move towards the cSMAC. Track colors: Cyan-track segment between adjacent frames; Red- gap closing between non-adjacent frames (maximum of 3 frames between end of a track segment and the beginning of another). Showing a maximum track tail length of 10 frames for visual clarity. The movie is played at five fps with frame intervals of 5 s.
Video 7
Grb2 is maintained as LAT condensates move across the IS in activated Jurkat T cells.
TIRF microscopy of an activated Jurkat T cell expressing Grb2-mCherry (magenta) and LAT-mCitrine (green) on a SLB coated with ICAM-1 and OKT3 revealed that Grb2 co-localizes with LAT condensates as they move from the edge of the synapse to the cSMAC. Movie shows a 22 μm x 22 μm field of view. The movie is played at seven fps with frame intervals of 5 s.
Video 8
Nck dissipates from LAT condensates as they move across the IS in activated Jurkat T cells.
TIRF microscopy of an activated Jurkat T cell expressing LAT-mCherry (magenta) and Nck-sfEGFP (green) on a SLB coated with ICAM-1 and OKT3 revealed that Nck dissipates from LAT condensates as they move from the edge of the synapse to the cSMAC. Movie shows a 24 μm x 24 μm field of view. The movie is played at five fps with frame intervals of 5 s.
Video 9
Reconstitution of movement in LAT condensates containing Grb2Basic in contracting actomyosin networks.
TIRF microscopy revealed actin filament and LAT condensate movement on supported lipid bilayers in a contracting actomyosin network. His8-pLAT-Alexa488 (green) was attached to Ni-functionalized SLBs at 500 molecules / μm2. Actin filaments (magenta) were attached to the same bilayers via His10-ezrin actin binding domains. Reconstitution was performed in 50 mM KCl. Condensates were formed by adding 125 nM Grb2Basic and 125 nM Sos1. After formation, condensates bound to and wet actin filaments. Actin filament contraction was induced by adding 100 nM myosin II. LAT condensates composed of Grb2Basic moved with contracting actin filaments, although not to the same degree as pLAT → N-WASPWT condensates (Compare with Video 6). Movie shows a 52 μm x 52 μm field of view. The movie is played at five fps with frame intervals of 5 s.
Video 10
LAT condensates containing Grb2Basic deviate tend to deviate from a radial trajectory across the IS.
TIRF microscopy of an activated Jurkat T cell expressing Grb2Basic-mCherry and LAT-mCitrine on a SLB coated with ICAM-1 and OKT3 revealed that condensates containing Grb2Basic-mCherry tend to deviate from a radial trajectory as they move across the IS (Compare with Video 1). Movie shows a 35 μm x 35 μm field of view. The movie is played at six fps with frame intervals of 5 s.
Video 11
Nck dissipates from LAT condensates as they move across the IS in activated Jurkat T cells treated with DMSO.
TIRF microscopy of an activated Jurkat T cell expressing LAT-mCherry (magenta) and Nck-sfGFP (green) on a SLB coated with ICAM-1 and OKT3 revealed that Nck dissipates from LAT condensates as they move from the edge of the synapse to the cSMAC following treatment with DMSO for 5 min prior to activation. Movie shows a 31 μm x 31 μm field of view. The movie is played at six fps with frame intervals of 5 s.
Video 12
Nck is maintained in LAT condensates as they move across the IS in activated Jurkat T cells treated with the formin inhibitor SMIFH2.
TIRF microscopy of an activated Jurkat T cell expressing LAT-mCherry (magenta) and Nck-sfGFP (green) on a SLB coated with ICAM-1 and OKT3 revealed that Nck is maintained in LAT condensates as they move from the synapse of the cell to the cSMAC following treatment with SMIFH2 for 5 min prior to activation. Movie shows a 27 μm x 27 μm field of view. The movie is played at 10 fps with frame intervals of 5 s.
Tables
Table 1
Sequences of constructs used in the study.
https://doi.org/10.7554/eLife.42695.051| Construct | Sequence | Notes |
|---|---|---|
| Ezrin | ISHMHHHHHHHHHHKCKVYEPVSYHVQESLQDEGAEPTGYSAELSSEGIRDDRNEEKRITEAEKNERVQRQLLTLSSELSQARDENKRTHNDIIHNENMRQGRDKYKTLRQIRQGNTKQRIDEFEAL | Human, Ezrin actin binding domain, residues 477–586, with N-terminal His10 - KCK fusion. |
| Grb2 | GPLGSMEAIAKYDFKATADDELSFKRGDILKVLNEECDQNWYKAELNGKDGFIPKNYIEMKPHPWFFGKIPRAKAEEMLSKQRHDGAFLIRESESAPGDFSLSVKFGNDVQHFKVLRDGAGKYFLWVVKFNSLNELVDYHRSTSVSRNQQIFLRDIEQVPQQPTYVQALFDFDPQEDGELGFRRGDFIHVMDNSDPNWWKGACHGQTGMFPRNYVTPVNRNV | Human, residues 1–217. |
| Grb2Basic | GPLGSMEAIAKYDFKATADDELSFKRGDILKVLNEECDQNWYKAELNGKDGFIPKNYIEMKPHPWFFGKIPRAKAEEMLSKQRHDGAFLIRESESAPGDFSLSVKFGNDVQHFKVLRDGAGKYFLWVVKFNSLNELVDYHRSTSVSRNQQIFLRDIEQVPQQPTYVQALFDFDPQEDGELGFRRGDFIHVMDNSDPNWWKGACHGQTGMFPRNYVTPVNRNVKEKKKGKAKKKRLTKGKEKKKGKAKKKRITKA | Human, residues 1–217 with the basic region of N-WASP (x2) fused to the C-terminal. |
| LAT | GGSLEHHHHHHHHGIQFKRPHTVAPWPPAFPPVTSFPPLSQPDLLPIPRSPQPLGGSHRTPSSRRDSDGANSVASFENEEPACEDADEDEDDFHNPGYLVVLPDSTPATSTAAPSAPALSTPGIRDSAFSMESIDDYVNVPESGESAEASLDGSREYVNVSQELHPGAAKTEPAALSSQEAEEVEEEGAPDYENLQELN | Human, residues 48–233 (short isoform) with His8N-terminal fusion. This construct only contains the four C-terminal Tyr residues (Y132, Y171, Y191, and Y226) that are sufficient for TCR signaling. Y171, Y191, and Y226 are the three tyrosines that are recognized by Grb2 when phosphorylated. All other tyrosine residues were mutated to Phe residues. |
| Nck | GHMCMAEEVVVVAKFDYVAQQEQELDIKKNERLWLLDDSKSWWRVRNSMNKTGFVPSNYVERKNSARKASIVKNLKDTLGIGKVKRKPSVPDSASPADDSFVDPGERLYDLNMPAYVKFNYMAEREDELSLIKGTKVIVMEKSSDGWWRGSYNGQVGWFPSNYVTEEGDSPLGDHVGSLSEKLAAVVNNLNTGQVLHVVQALYPFSSSNDEELNFEKGDVMDVIEKPENDPEWWKARKINGMVGLVPKNYVTVMQNNPLTSGLEPSPPQSDYIRPSLTGKFAGNPWYYGKVTRHQAEMALNERGHEGDFLIRDSESSPNDFSVSLKAQGKNKHFKVQLKETVYSIGQRKFSTMEELVEHYKKAPIFTSEQGEKLYLVKHLS | Human, residues 1–377, with mutations C139S, C232A, C266S, C340S. A single Cys was added to the N-terminus. |
| His-Nck (FL) | GHMHHHHHHHHGGSCGGSGGSGGSGGSLEMAEEVVVVAKFDYVAQQEQELDIKKNERLWLLDDSKSWWRVRNSMNKTGFVPSNYVERKNSARKASIVKNLKDTLGIGKVKRKPSVPDSASPADDSFVDPGERLYDLNMPAYVKFNYMAEREDELSLIKGTKVIVMEKSSDGWWRGSYNGQVGWFPSNYVTEEGDSPLGDHVGSLSEKLAAVVNNLNTGQVLHVVQALYPFSSSNDEELNFEKGDVMDVIEKPENDPEWWKARKINGMVGLVPKNYVTVMQNNPLTSGLEPSPPQSDYIRPSLTGKFAGNPWYYGKVTRHQAEMALNERGHEGDFLIRDSESSPNDFSVSLKAQGKNKHFKVQLKETVYSIGQRKFSTMEELVEHYKKAPIFTSEQGEKLYLVKHLS | Human, residues 1–377, with N-terminal His8-GGSC(GGS)4 fusion and C139S, C232A, C266S, and C340S mutations. |
| His-Nck (FLΔL1) | GHMHHHHHHHHGGSCGGSGGSGGSGGSLEAEEVVVVAKFDYVAQQEQELDIKKNERLWLLDDSKSWWRVRNSMNKTGFVPSNYVERKNSGGSAGGSAGGSATLGIGKVKRKPSVPDSASPADDSFVDPGERLYDLNMPAYVKFNYMAEREDELSLIKGTKVIVMEKSSDGWWRGSYNGQVGWFPSNYVTEEGDSPLGDHVGSLSEKLAAVVNNLNTGQVLHVVQALYPFSSSNDEELNFEKGDVMDVIEKPENDPEWWKARKINGMVGLVPKNYVTVMQNNPLTSGLEPSPPQSDYIRPSLTGKFAGNPWYYGKVTRHQAEMALNERGHEGDFLIRDSESSPNDFSVSLKAQGKNKHFKVQLKETVYSIGQRKFSTMEELVEHYKKAPIFTSEQGEKLYLVKHLS | Human, residues 2–377, with N-terminal His8-GGSC(GGS)4fusion and C139S, C232A, C266S, and C340S mutations. ARKASIVKNLKD in the N-terminal portion of L1 has been replaced with GGSAGGSAGGSA. |
| His-Nck (L1-S2-L2-S3-L3-SH2) | GHMHHHHHHHHGGSCGGSGGSGGSGGSLEKNSARKASIVKNLKDTLGIGKVKRKPSVPDSASPADDSFVDPGERLYDLNMPAYVKFNYMAEREDELSLIKGTKVIVMEKSSDGWWRGSYNGQVGWFPSNYVTEEGDSPLGDHVGSLSEKLAAVVNNLNTGQVLHVVQALYPFSSSNDEELNFEKGDVMDVIEKPENDPEWWKCRKINGMVGLVPKNYVTVMQNNPLTSGLEPSPPQSDYIRPSLTGKFAGNPWYYGKVTRHQAEMALNERGHEGDFLIRDSESSPNDFSVSLKAQGKNKHFKVQLKETVYSIGQRKFSTMEELVEHYKKAPIFTSEQGEKLYLVKHLS | Human, residues 59–377 (No S1), with N-terminal His8-GGSC(GGS)4 fusion and C139S, C232A, C266S, and C340S mutations. |
| His-Nck (L1(KtoE)-S2-L2-S3-L3-SH2) | GHMHHHHHHHHGGSCGGSGGSGGSGGSLEKNSAREASIVENLEDTLGIGKVKRKPSVPDSASPADDSFVDPGERLYDLNMPAYVKFNYMAEREDELSLIKGTKVIVMEKSSDGWWRGSYNGQVGWFPSNYVTEEGDSPLGDHVGSLSEKLAAVVNNLNTGQVLHVVQALYPFSSSNDEELNFEKGDVMDVIEKPENDPEWWKCRKINGMVGLVPKNYVTVMQNNPLTSGLEPSPPQSDYIRPSLTGKFAGNPWYYGKVTRHQAEMALNERGHEGDFLIRDSESSPNDFSVSLKAQGKNKHFKVQLKETVYSIGQRKFSTMEELVEHYKKAPIFTSEQGEKLYLVKHLS | Human, residues 59–377 (No S1), with N-terminal His8-GGSC(GGS)4fusion and C139S, C232A, C266S, and C340S mutations. The basic N-terminal portion of L1 has the following basic to acidic mutations: K64E, K69E, and K72E. |
| His-Nck (L1(HM)-S2-L2-S3-L3-SH2) | GHMHHHHHHHHGGSCGGSGGSGGSGGSLEKNSARKASNSKNSKDTLGIGKVKRKPSVPDSASPADDSFVDPGERLYDLNMPAYVKFNYMAEREDELSLIKGTKVIVMEKSSDGWWRGSYNGQVGWFPSNYVTEEGDSPLGDHVGSLSEKLAAVVNNLNTGQVLHVVQALYPFSSSNDEELNFEKGDVMDVIEKPENDPEWWKCRKINGMVGLVPKNYVTVMQNNPLTSGLEPSPPQSDYIRPSLTGKFAGNPWYYGKVTRHQAEMALNERGHEGDFLIRDSESSPNDFSVSLKAQGKNKHFKVQLKETVYSIGQRKFSTMEELVEHYKKAPIFTSEQGEKLYLVKHLS | Human, residues 59–377, with N-terminal His8-GGSC(GGS)4fusion and C139S, C232A, C266S, and C340S mutations. Additional Hydrophobic Mutations in L1: I67N, V68S, L71S. |
| His-Nck (S1-L1-S3-L3-SH2) | GHMHHHHHHHHGGSCGGSGGSGGSGGSLEAEEVVVVAKFDYVAQQEQELDIKKNERLWLLDDSKSWWRVRNSMNKTGFVPSNYVERKNSARKASIVKNLKDTLGIGKVKRKPSVPDSASPADDSFVDPGERLYDLNVLHVVQALYPFSSSNDEELNFEKGDVMDVIEKPENDPEWWKCRKINGMVGLVPKNYVTVMQNNPLTSGLEPSPPQSDYIRPSLTGKFAGNPWYYGKVTRHQAEMALNERGHEGDFLIRDSESSPNDFSVSLKAQGKNKHFKVQLKETVYSIGQRKFSTMEELVEHYKKAPIFTSEQGEKLYLVKHLS | Human, residues 2–108 and 191–377, with N-terminal His8-GGSC(GGS)4 fusion and C232A, C266S, and C340S mutations. |
| His-Nck (S1-L1-S2-L2-S3) | GHMHHHHHHHHGGSCGGSGGSGGSGGSLEMAEEVVVVAKFDYVAQQEQELDIKKNERLWLLDDSKSWWRVRNSMNKTGFVPSNYVERKNSARKASIVKNLKDTLGIGKVKRKPSVPDSASPADDSFVDPGERLYDLNMPAYVKFNYMAEREDELSLIKGTKVIVMEKSSDGWWRGSYNGQVGWFPSNYVTEEGDSPLGDHVGSLSEKLAAVVNNLNTGQVLHVVQALYPFSSSNDEELNFEKGDVMDVIEKPENDPEWWKARKINGMVGLVPKNYVTVMQN | Human, residues 2–252, with N-terminal His8-GGSC(GGS)4 fusion and C139S and C232A mutations. |
| His-Nck (S2-L2-S3-L3-SH2) | GHMHHHHHHHHGGSCGGSGGSGGSGGSLEDLNMPAYVKFNYMAEREDELSLIKGTKVIVMEKSSDGWWRGSYNGQVGWFPSNYVTEEGDSPLGDHVGSLSEKLAAVVNNLNTGQVLHVVQALYPFSSSNDEELNFEKGDVMDVIEKPENDPEWWKCRKINGMVGLVPKNYVTVMQNNPLTSGLEPSPPQSDYIRPSLTGKFAGNPWYYGKVTRHQAEMALNERGXEGXFLIRDSESSPNDFSVSLKAQGKNKHFKVQLKETVYSIGQRKFSTMEELVEHYKKAPIFTSEQGEKLYLVKHLS | Human, residues 106–377, with N-terminal His8-GGSC(GGS)4fusion and C139S, C232A, C266S, and C340S mutations. |
| His-Nck (S3-L3-SH2) | GHMHHHHHHHHGGSCGGSGGSGGSGGSLEQVLHVVQALYPFSSSNDEELNFEKGDVMDVIEKPENDPEWWKARKINGMVGLVPKNYVTVMQNNPLTSGLEPSPPQSDYIRPSLTGKFAGNPWYYGKVTRHQAEMALNERGHEGDFLIRDSESSPNDFSVSLKAQGKNKHFKVQLKETVYSIGQRKFSTMEELVEHYKKAPIFTSEQGEKLYLVKHLS | Human, residues 190–377, with N-terminal His8-GGSC(GGS)4fusion and C232A, C266S, and C340S mutations. |
| His-Nck (L3-SH2) | GHMHHHHHHHHGGSCGGSGGSGGSGGSLENPLTSGLEPSPPQSDYIRPSLTGKFAGNPWYYGKVTRHQAEMALNERGHEGDFLIRDSESSPNDFSVSLKAQGKNKHFKVQLKETVYSIGQRKFSTMEELVEHYKKAPIFTSEQGEKLYLVKHLS | Human, residues 253–377, with N-terminal His8-GGSC(GGS)4fusion and C266S and C340S mutations. |
| His-Nck (S1) | GHMHHHHHHHHGGSCGGSGGSGGSGGSLEAEEVVVVAKFDYVAQQEQELDIKKNERLWLLDDSKSWWRVRNSMNKTGFVPSNYVERKNSGSAAAS | Human, residues 2–61, with N-terminal His8-GGSC(GGS)4 fusion. |
| His-Nck (S2) | GHMHHHHHHHHGGSCGGSGGSGGSGGSLEDLNMPAYVKFNYMAEREDELSLIKGTKVIVMEKSSDGWWRGSYNGQVGWFPSNYVTEEGDGSAAAS | Human, residues 106–165, with N-terminal His8-GGSC(GGS)4fusion and C139S mutation. |
| His-Nck (S3) | GHMHHHHHHHHGGSCGGSGGSGGSGGSLEQVLHVVQALYPFSSSNDEELNFEKGDVMDVIEKPENDPEWWKARKINGMVGLVPKNYVTVMQNGSAAAS | Human, residues 190–252, with N-terminal His8-GGSC(GGS)4fusion and C232A mutation. |
| His-NckAcidic (FL(L1 KtoE)) | GHMHHHHHHHHGGSCGGSGGSGGSGGSLEAEEVVVVAKFDYVAQQEQELDIKKNERLWLLDDSKSWWRVRNSMNKTGFVPSNYVERKNSAREASIVENLEDTLGIGKVKRKPSVPDSASPADDSFVDPGERLYDLNMPAYVKFNYMAEREDELSLIKGTKVIVMEKSSDGWWRGSYNGQVGWFPSNYVTEEGDSPLGDHVGSLSEKLAAVVNNLNTGQVLHVVQALYPFSSSNDEELNFEKGDVMDVIEKPENDPEWWKARKINGMVGLVPKNYVTVMQNNPLTSGLEPSPPQSDYIRPSLTGKFAGNPWYYGKVTRHQAEMALNERGHEGDFLIRDSESSPNDFSVSLKAQGKNKHFKVQLKETVYSIGQRKFSTMEELVEHYKKAPIFTSEQGEKLYLVKHLS | Human, residues 2–377, with C139S, C232A, C266S, and C340S mutations. The basic N-terminal portion of L1 has the following basic to acidic mutations: K64E, K69E, and K72E. |
| His-NckBasic (FL(L1 basic)) | GHMHHHHHHHHGGSCGGSGGSGGSGGSLEAEEVVVVAKFDYVAQQEQELDIKKNERLWLLDDSKSWWRVRNSMNKTGFVPSNYVERKNSARKASIVKNLKDTLGIGKVKRKPSVPKSASPADKSFVKPGKRLYKLNMPAYVKFNYMAEREDELSLIKGTKVIVMEKSSDGWWRGSYNGQVGWFPSNYVTEEGDSPLGDHVGSLSEKLAAVVNNLNTGQVLHVVQALYPFSSSNDEELNFEKGDVMDVIEKPENDPEWWKARKINGMVGLVPKNYVTVMQNNPLTSGLEPSPPQSDYIRPSLTGKFAGNPWYYGKVTRHQAEMALNERGHEGDFLIRDSESSPNDFSVSLKAQGKNKHFKVQLKETVYSIGQRKFSTMEELVEHYKKAPIFTSEQGEKLYLVKHLS | Human, residues 2–377, with C139S, C232A, C266S, and C340S mutations. The acidic C-terminal portion of L1 has the following acidic to basic mutations: D88K, D95K, D99K, E102K, and D106K. |
| His-NckNeutral (FL(L1 GGSA)10) | GHMHHHHHHHHGGSCGGSGGSGGSGGSLEMAEEVVVVAKFDYVAQQEQELDIKKNERLWLLDDSKSWWRVRNSMNKTGFVPSNYVERGGSAGGSAGGSAGGSAGGSAGSGGSAGGSAGGSAGGSAGGSAGSDLNMPAYVKFNYMAEREDELSLIKGTKVIVMEKCSDGWWRGSYNGQVGWFPSNYVTEEGDSPLGDHVGSLSEKLAAVVNNLNTGQVLHVVQALYPFSSSNDEELNFEKGDVMDVIEKPENDPEWWKCRKINGMVGLVPKNYVTVMQNNPLTSGLEPSPPQCDYIRPSLTGKFAGNPWYYGKVTRHQAEMALNERGHEGDFLIRDSESSPNDFSVSLKAQGKNKHFKVQLKETVYCIGQRKFSTMEELVEHYKKAPIFTSEQGEKLYLVKHLS | Human full-length Nck with L1 replaced by a GGSA linker, residues 1–58, 109–377, with an N-terminal His8-GGSC(GGS)4 fusion and C139S, C232A, C266S, and C340S mutations. |
| N-WASP | GSESRFYFHPISDLPPPEPYVQTTKSYPSKLARNESRENESLFTFLGKKCVTMSSAVVQLYAADRNCMWSKKCSGVACLVKDNPQRSYFLRIFDIKDGKLLWEQELYNNFVYNSPRGYFHTFAGDTCQVALNFANEEEAKKFRKAVTDLLGRRQRKSEKRRDPPNGPNLPMATVDIKNPEITTNRFYGPQVNNISHTKEKKKGKAKKKRLTKADIGTPSNFQHIGHVGWDPNTGFDLNNLDPELKNLFDMCGISEAQLKDRETSKVIYDFIEKTGGVEAVKNELRRQAPPPPPPSRGGPPPPPPPPHNSGPPPPPARGRGAPPPPPSRAPTAAPPPPPPSRPSVAVPPPPPNRMYPPPPPALPSSAPSGPPPPPPSVLGVGPVAPPPPPPPPPPPGPPPPPGLPSDGDHQVPTTAGNKAALLDQIREGAQLKKVEQNSRPVSCSGRDALLDQIRQGIQLKSVADGQESTPPTPAPTSGIVGALMEVMQKRSKAIHSSDEDEDEDDEEDFEDDDEWED | Human WIP N-WASP EVH1 binding motif, residues 451–485 fused to human N-WASP, residues 26–505. |
| His-N-WASP | MGHHHHHHDYDIPTTENLYFQGSESRFYFHPISDLPPPEPYVQTTKSYPSKLARNESRENESLFTFLGKKCVTMSSAVVQLYAADRNCMWSKKCSGVACLVKDNPQRSYFLRIFDIKDGKLLWEQELYNNFVYNSPRGYFHTFAGDTCQVALNFANEEEAKKFRKAVTDLLGRRQRKSEKRRDPPNGPNLPMATVDIKNPEITTNRFYGPQVNNISHTKEKKKGKAKKKRLTKADIGTPSNFQHIGHVGWDPNTGFDLNNLDPELKNLFDMCGISEAQLKDRETSKVIYDFIEKTGGVEAVKNELRRQAPPPPPPSRGGPPPPPPPPHNSGPPPPPARGRGAPPPPPSRAPTAAPPPPPPSRPSVAVPPPPPNRMYPPPPPALPSSAPSGPPPPPPSVLGVGPVAPPPPPPPPPPPGPPPPPGLPSDGDHQVPTTAGNKAALLDQIREGAQLKKVEQNSRPVSCSGRDALLDQIRQGIQLKSVADGQESTPPTPAPTSGIVGALMEVMQKRSKAIHSSDEDEDEDDEEDFEDDDEWED | Human WIP N-WASP EVH1 binding motif, residues 451–485 fused to human N-WASP, residues 26–505 with N-terminal His6 fusion. |
| N-WASPBasic | GSESRFYFHPISDLPPPEPYVQTTKSYPSKLARNESRENESLFTFLGKKCVTMSSAVVQLYAADRNCMWSKKCSGVACLVKDNPQRSYFLRIFDIKDGKLLWEQELYNNFVYNSPRGYFHTFAGDTCQVALNFANEEEAKKFRKAVTDLLGRRQRKSEKRRDPPNGPNLPMATVDIKNPEITTNRFYGPQVNNISHTKEKKKGKAKKKRLTKGKEKKKGKAKKKRITKADIGTPSNFQHIGHVGWDPNTGFDLNNLDPELKNLFDMCGISEAQLKDRETSKVIYDFIEKTGGVEAVKNELRRQAPPPPPPSRGGPPPPPPPPHNSGPPPPPARGRGAPPPPPSRAPTAAPPPPPPSRPSVAVPPPPPNRMYPPPPPALPSSAPSGPPPPPPSVLGVGPVAPPPPPPPPPPPGPPPPPGLPSDGDHQVPTTAGNKAALLDQIREGAQLKKVEQNSRPVSCSGRDALLDQIRQGIQLKSVADGQESTPPTPAPTSGIVGALMEVMQKRSKAIHSSDEDEDEDDEEDFEDDDEWED | Human WIP N-WASP EVH1 binding motif, residues 451–485 fused to human N-WASP, residues 26–505. Basic Region (186-200) has been doubled. |
| His-N-WASPBasic | MGHHHHHHDYDIPTTENLYFQGSESRFYFHPISDLPPPEPYVQTTKSYPSKLARNESRENESLFTFLGKKCVTMSSAVVQLYAADRNCMWSKKCSGVACLVKDNPQRSYFLRIFDIKDGKLLWEQELYNNFVYNSPRGYFHTFAGDTCQVALNFANEEEAKKFRKAVTDLLGRRQRKSEKRRDPPNGPNLPMATVDIKNPEITTNRFYGPQVNNISHTKEKKKGKAKKKRLTKGKEKKKGKAKKKRITKADIGTPSNFQHIGHVGWDPNTGFDLNNLDPELKNLFDMCGISEAQLKDRETSKVIYDFIEKTGGVEAVKNELRRQAPPPPPPSRGGPPPPPPPPHNSGPPPPPARGRGAPPPPPSRAPTAAPPPPPPSRPSVAVPPPPPNRMYPPPPPALPSSAPSGPPPPPPSVLGVGPVAPPPPPPPPPPPGPPPPPGLPSDGDHQVPTTAGNKAALLDQIREGAQLKKVEQNSRPVSCSGRDALLDQIRQGIQLKSVADGQESTPPTPAPTSGIVGALMEVMQKRSKAIHSSDEDEDEDDEEDFEDDDEWED | Human WIP N-WASP EVH1 binding motif, residues 451–485 fused to human N-WASP, residues 26–505 with N-terminal His6 fusion. Basic Region (186-200) has been doubled. |
| N-WASPNeutral | GSESRFYFHPISDLPPPEPYVQTTKSYPSKLARNESRENESLFTFLGKKCVTMSSAVVQLYA ADRNCMWSKKCSGVACLVKDNPQRSYFLRIFDIKDGKLLWEQELYNNFVYNSPRGYFHTFAGDTCQVALNFANEEEAKKFRKAVTDLLGRRQRKSEKRRDPPNGPNLPMATVDIKNPEITTNRFYGPQVNNISHTGGSGGSGGSGGSGGSADIGTPSNFQHIGHVGWDPNTGFDLNNLDPELKNLFDMCGISEAQLKDRETSKVIYDFIEKTGGVEAVKNELRRQAPPPPPPSRGGPPPPPPPPHNSGPPPPPARGRGAPPPPPSRAPTAAPPPPPPSRPSVAVPPPPPNRMYPPPPPALPSSAPSGPPPPPPSVLGVGPVAPPPPPPPPPPPGPPPPPGLPSDGDHQVPTTAGNKAALLDQIREGAQLKKVEQNSRPVSCSGRDALLDQIRQGIQLKSVADGQESTPPTPAPTSGIVGALMEVMQKRSKAIHSSDEDEDEDDEEDFEDDDEWED | Human WIP N-WASP EVH1 binding motif, residues 451–485 fused to human N-WASP, residues 26–505. Basic Region (186-200) has been removed and replaced with (GGS)5. |
| His-N-WASPNeutral | MGHHHHHHDYDIPTTENLYFQGSESRFYFHPISDLPPPEPYVQTTKSYPSKLARNESRENESLFTFLGKKCVTMSSAVVQLYAADRNCMWSKKCSGVACLVKDNPQRSYFLRIFDIKDGKLLWEQELYNNFVYNSPRGYFHTFAGDTCQVALNFANEEEAKKFRKAVTDLLGRRQRKSEKRRDPPNGPNLPMATVDIKNPEITTNRFYGPQVNNISHTGGSGGSGGSGGSGGSADIGTPSNFQHIGHVGWDPNTGFDLNNLDPELKNLFDMCGISEAQLKDRETSKVIYDFIEKTGGVEAVKNELRRQAPPPPPPSRGGPPPPPPPPHNSGPPPPPARGRGAPPPPPSRAPTAAPPPPPPSRPSVAVPPPPPNRMYPPPPPALPSSAPSGPPPPPPSVLGVGPVAPPPPPPPPPPPGPPPPPGLPSDGDHQVPTTAGNKAALLDQIREGAQLKKVEQNSRPVSCSGRDALLDQIRQGIQLKSVADGQESTPPTPAPTSGIVGALMEVMQKRSKAIHSSDEDEDEDDEEDFEDDDEWED | Human WIP N-WASP EVH1 binding motif, residues 451–485 fused to human N-WASP, residues 26–505 with N-terminal His6 fusion. Basic Region (186-200) has been removed and replaced with (GGS)5. |
| N-WASP BPVCA | GSEFKEKKKGKAKKKRAPPPPPPSRGGPPPPPPPPHSSGPPPPPARGRGAPPPPPSRAPTAAPPPPPPSRPGVVVPPPPPNRMYPHPPPALPSSAPSGPPPPPPLSMAGSTAPPPPPPPPPPPGPPPPPGLPSDGDHQVPASSGNKAALLDQIREGAQLKKVEQNSRPVSCSGRDALLDQIRQGIQLKSVSDGQESTPPTPAPTSGIVGALMEVMQKRSKAIHSSDEDEDDDDEEDFEDDDEWED | Rat, N-WASP fusion of basic, proline-rich, and VCA domains, residues 183–193 and 273–501. |
| N-WASP BPVCA (R/A R/A) | GSEFKEKKKGKAKKKRAPPPPPPSRGGPPPPPPPPHSSGPPPPPARGRGAPPPPPSRAPTAAPPPPPPSRPGVVVPPPPPNRMYPHPPPALPSSAPSGPPPPPPLSMAGSTAPPPPPPPPPPPGPPPPPGLPSDGDHQVPASSGNKAALLDQIAEGAQLKKVEQNSRPVSCSGRDALLDQIAQGIQLKSVSDGQESTPPTPAPTSGIVGALMEVMQKRSKAIHSSDEDEDDDDEEDFEDDDEWED | Rat, N-WASP fusion of basic, proline-rich, and VCA domains, residues 183–193 and 273–501 with R410A and R438A mutations. |
| N-WASP BP | GSEFKEKKKGKAKKKRLTKADIGTPSNFQHIGHVGWDPNTGFDLNNLDPELKNLFDMCGISAPPPPPPSRGGPPPPPPPPHSSGPPPPPARGRGAPPPPPSRAPTAAPPPPPPSRPGVVVPPPPPNRMYPPPPPALPSSAPSGPPPPPPLSMAGSTAPPPPPPPPPPPGPPPPPGLPSDGDHQVP | Rat, N-WASP fusion of basic, proline-rich, residues 183–239 and 273–396. |
| SLP-76 | GHMDNGGWSSFEEDDYESPNDDQDGEDDGDYESPNEEEEAPVEDDADYEPPPSNDEEALQNSILPAKPFPNSNSMFIDRPPSGKTPQQPPVPPQRPMAALPPPPAGRNHSPLPPPQTNHEEPSRSRNHKTAKLPAPSIDRSTKPPLDRSLAPFDREPFTLGKKPPFSDKPSIPAGRSLGEHLPKIQKPPLPPTTERHERSSPLPGKKPPVPKHGWGPDRRENDEDDVHQRPLPQPALLPMSSNTFPSRSTKPSPMNPLSSHMPGAFSESNSSFPQSASLPPFFSQGPSNRPPIRAEGRNFPLPLPNKPRPPSPAEEENCSLNEGSLEVLFQ | Human, residues 101–420, with a Cys added near the C-terminus for labeling. |
| Sos1 | GPLGSNDTVFIQVTLPHGPRSASVSSISLTKGTDEVPVPPPVPPRRRPESAPAESSPSKIMSKHLDSPPAIPPRQPTSKAYSPRYSISDRTSISDPPESPLLPPREPVRTPDVFSSSPLHLQPPPLGKKSDHGNAFFPNSPSPFTPPPPQTPSPHGTRRHLPSPPLTQEVDLHSIAGPPVPPRQSTSQHIPKLPPKTYKREHTHPSMC | Human, poly-proline rich region, residues 1117–1319 with a Cys added at the C-terminus for labeling. |
| WASP | GSESRFYFHPISDLPPPEPYVQTTKSYPSKLARNESRENESLFTFLGRKCLTLATAVVQLYLALPPGAEHWTKEHCGAVCFVKDNPQKSYFIRLYGLQAGRLLWEQELYSQLVYSTPTPFFHTFAGDDCQAGLNFADEDEAQAFRALVQEKIQKRNQRQSGDRRQLPPPPTPANEERRGGLPPLPLHPGGDQGGPPVGPLSLGLATVDIQNPDITSSRYRGLPAPGPSPADKKRSGKKKISKADIGAPSGFKHVSHVGWDPQNGFDVNNLDPDLRSLFSRAGISEAQLTDAETSKLIYDFIEDQGGLEAVRQEMRRQEPLPPPPPPSRGGNQLPRPPIVGGNKGRSGPLPPVPLGIAPPPPTPRGPPPPGRGGPPPPPPPATGRSGPLPPPPPGAGGPPMPPPPPPPPPPPSSGNGPAPPPLPPALVPAGGLAPGGGRGALLDQIRQGIQLNKTPGAPESSALQPPPQSSEGLVGALMHVMQKRSRAIHSSDEGEDQAGDEDEDDEWDD | Human WIP WASP EVH1 binding motif, residues 451–485 fused to human WASP, residues 39–502. |
Table 2
Experimental conditions used in steady state and actomyosin contraction assays.
50 mM HEPES pH 7.3, 1 mM MgCl2, 1 mM TCEP, 1 mg / ml BSA, and 0.2 mg / ml glucose oxidase +0.035 mg / ml catalase +1 mM glucose (O2 scavenging system) were included in every assay.
| Experiment | His8-pLAT | His10- Ezrin (ABD) | Grb2 | Sos1 | pSLP-76 | Nck | N-wasp | WASP | Actin | Myosin II | KCl | ATP |
|---|---|---|---|---|---|---|---|---|---|---|---|---|
| pLAT → Sos1 (Steady-State) | 20 nM (sol’n) 500 molecules /μm2 | five nM (sol’n) ~100 molecules /μm2 | 125nM | 125nM | 0nM | 0nM | 0nM | 0nM | 0nM | 0nM | 75mM | 1mM |
| pLAT → Sos1 +Actin (Steady-State) | 20 nM (sol’n) 500 molecules /μm2 | five nM (sol’n) ~100 molecules /μm2 | 125 nM | 125 nM | 0 nM | 0 nM | 0 nM | 0 nM | 250 nM | 0 nM | 75 mM | 1 mM |
| pLAT → Sos1 +Actin + Myosin (Steady-State) | 20 nM (sol’n) 500 molecules /μm2 | five nM (sol’n) ~100 molecules /μm2 | 125 nM | 125 nM | 0 nM | 0 nM | 0 nM | 0 nM | 250 nM | 100 nM | 75 mM | 1 mM |
| pLAT → pSLP-76 (Steady-State) | 20 nM (sol’n) 500 molecules /μm2 | five nM (sol’n) ~100 molecules /μm2 | 125 nM | 62.5 nM | 62.5 nM | 0 nM | 0 nM | 0 nM | 0 nM | 0 nM | 75 mM | 1 mM |
| pLAT → pSLP-76 +Actin (Steady-State) | 20 nM (sol’n) 500 molecules /μm2 | five nM (sol’n) ~100 molecules /μm2 | 125 nM | 62.5 nM | 62.5 nM | 0 nM | 0 nM | 0 nM | 250 nM | 0 nM | 75 mM | 1 mM |
| pLAT → pSLP-76 +Actin + Myosin (Steady-State) | 20 nM (sol’n) 500 molecules /μm2 | five nM (sol’n) ~100 molecules /μm2 | 125 nM | 62.5 nM | 62.5 nM | 0 nM | 0 nM | 0 nM | 250 nM | 100 nM | 75 mM | 1 mM |
| pLAT → Nck (Steady-State) | 20 nM (sol’n) 500 molecules /μm2 | five nM (sol’n) ~100 molecules /μm2 | 125 nM | 62.5 nM | 62.5 nM | 125 nM | 0 nM | 0 nM | 0 nM | 0 nM | 75 mM | 1 mM |
| pLAT → Nck +Actin (Steady-State) | 20 nM (sol’n) 500 molecules /μm2 | five nM (sol’n) ~100 molecules /μm2 | 125 nM | 62.5 nM | 62.5 nM | 125 nM | 0 nM | 0 nM | 250 nM | 0 nM | 75 mM | 1 mM |
| pLAT → Nck +Actin + Myosin (Steady-State) | 20 nM (sol’n) 500 molecules /μm2 | five nM (sol’n) ~100 molecules /μm2 | 125 nM | 62.5 nM | 62.5 nM | 125 nM | 0 nM | 0 nM | 250 nM | 100 nM | 75 mM | 1 mM |
| pLAT → N-WASP (Steady-State) | 20 nM (sol’n) 500 molecules /μm2 | five nM (sol’n) ~100 molecules /μm2 | 125 nM | 62.5 nM | 62.5 nM | 125 nM | 125 nM | 0 nM | 0 nM | 0 nM | 75 mM | 1 mM |
| pLAT → N-WASP +Actin (Steady-State) | 20 nM (sol’n) 500 molecules /μm2 | five nM (sol’n) ~100 molecules /μm2 | 125 nM | 62.5 nM | 62.5 nM | 125 nM | 125 nM | 0 nM | 250 nM | 0 nM | 75 mM | 1 mM |
| pLAT → N-WASP +Actin + Myosin (Steady-State) | 20 nM (sol’n) 500 molecules /μm2 | five nM (sol’n) ~100 molecules /μm2 | 125 nM | 62.5 nM | 62.5 nM | 125 nM | 125 nM | 0 nM | 250 nM | 100 nM | 75 mM | 1 mM |
| pLAT → Sos1 +Actin + Myosin (Contraction) For Grb2, Grb2Basic | 20 nM (sol’n) 500 molecules /μm2 | five nM (sol’n) ~100 molecules /μm2 | 125 nM | 125 nM | 0 nM | 0 nM | 0 nM | 0 nM | 250 nM | 100 nM | 50 mM | 0.05 mM |
| pLAT → N-WASP +Actin + Myosin (Contraction) For N-WASPWT, N-WASPNeutral, N-WASPBasic | 20 nM (sol’n) 500 molecules /μm2 | five nM (sol’n) ~100 molecules /μm2 | 125 nM | 62.5 nM | 62.5 nM | 125 nM | 125 nM | 0 nM | 250 nM | 100 nM | 50 mM | 0.05 mM |
| pLAT → WASP (Steady-State) | 20 nM (sol’n) 500 molecules /μm2 | five nM (sol’n) ~100 molecules /μm2 | 125 nM | 62.5 nM | 62.5 nM | 125 nM | 0 nM | 125 nM | 0 nM | 0 nM | 75 mM | 1 mM |
| pLAT → WASP +Actin (Steady-State) | 20 nM (sol’n) 500 molecules /μm2 | five nM (sol’n) ~100 molecules /μm2 | 125 nM | 62.5 nM | 62.5 nM | 125 nM | 0 nM | 125 nM | 250 nM | 0 nM | 75 mM | 1 mM |
| pLAT → WASP +Actin + Myosin (Steady-State) | 20 nM (sol’n) 500 molecules /μm2 | five nM (sol’n) ~100 molecules /μm2 | 125 nM | 62.5 nM | 62.5 nM | 125 nM | 0 nM | 125 nM | 250 nM | 100 nM | 75 mM | 1 mM |
| pLAT → WASP +Actin + Myosin (Contraction) | 20 nM (sol’n) 500 molecules /μm2 | five nM (sol’n) ~100 molecules /μm2 | 125 nM | 62.5 nM | 62.5 nM | 125 nM | 0 nM | 125 nM | 250 nM | 100 nM | 50 mM | 0.05 mM |
Additional files
-
Supplementary file 1
Key Resource Table.
Table containing information about bacterial strains, cell lines, antibodies, recombinant DNA, peptide/recombinant protein, chemical compounds, software, reagents, and columns used for this study.
- https://doi.org/10.7554/eLife.42695.053
-
Transparent reporting form
- https://doi.org/10.7554/eLife.42695.054
Download links
A two-part list of links to download the article, or parts of the article, in various formats.
Downloads (link to download the article as PDF)
Open citations (links to open the citations from this article in various online reference manager services)
Cite this article (links to download the citations from this article in formats compatible with various reference manager tools)
A composition-dependent molecular clutch between T cell signaling condensates and actin
eLife 8:e42695.
https://doi.org/10.7554/eLife.42695


