Spatial and temporal organization of RecA in the Escherichia coli DNA-damage response
- University of Wollongong, Australia
- Illawarra Health and Medical Research Institute, Australia
- University of Wisconsin-Madison, United States
- National Institute of Child Health and Human Development, National Institutes of Health, United States
Figures
Figure 1 with 2 supplements
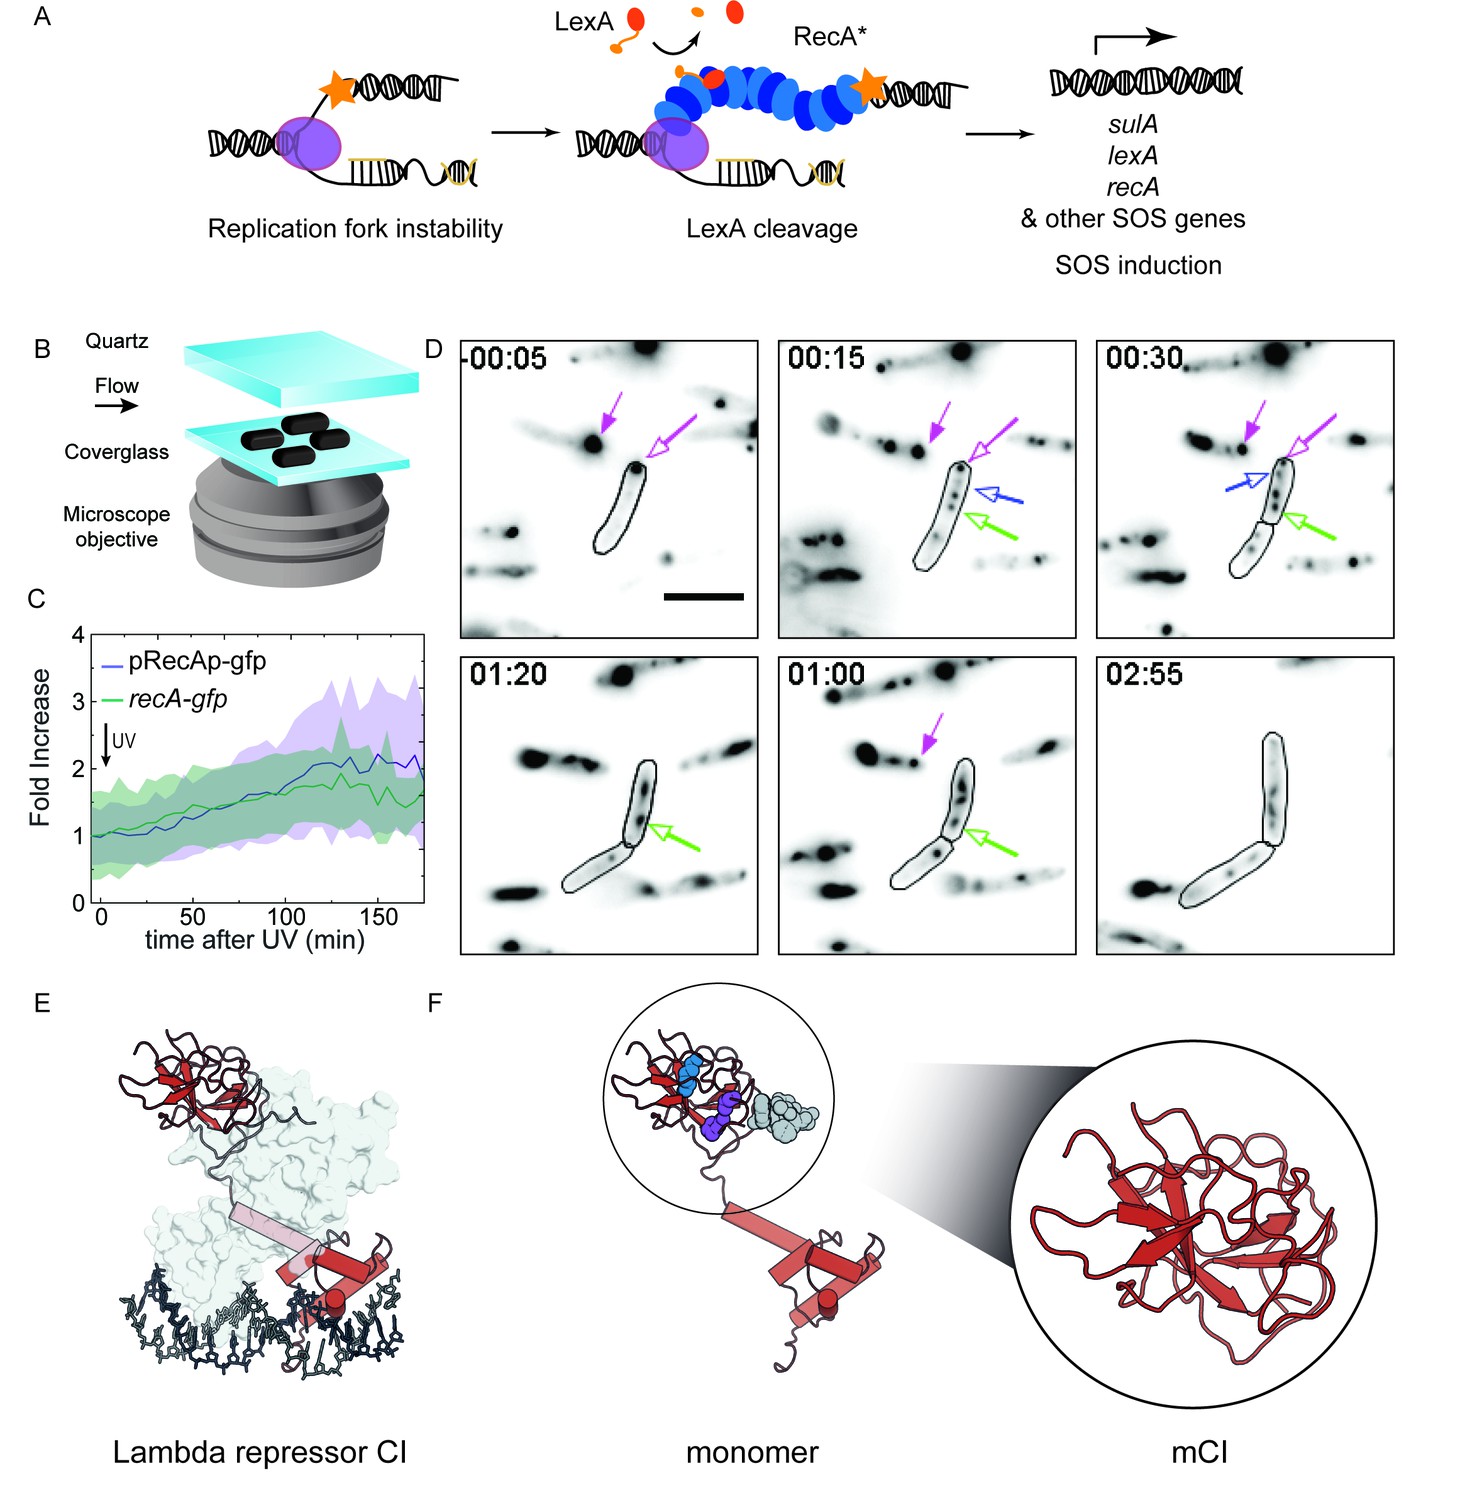
RecA forms different intracellular structures in response to UV irradiation.
(A) Consensus model for SOS induction after DNA damage, illustrating the formation of ssDNA-containing RecA* filaments at sites of stalled replication forks. These RecA* filaments induce the SOS response by promoting cleavage of LexA. (B) Schematic of flow-cell setup for live-cell imaging. (C) Plots of relative increase in mean intensity of GFP in pRecAp-gfp cells (purple, strain# HG260) or RecA-GFP expressed from the native chromosomal locus (recA-gfp cells). Cells are irradiated with 20 Jm−2 of UV at t = 0 min. Shaded error bars represent standard deviation of the mean cellular fluorescence measured in cells across the population. Between 50–200 cells were analyzed from 30 fields of view at each time point and two independent experiments were performed for each condition. See also Figure 1—video 1. (D) Imaging of recA-gfp cells (strain# HG195) reveals that RecA-GFP forms foci of various morphologies at different stages during the SOS response upon exposure to 20 Jm−2 of UV. Magenta arrows indicate foci that are present before damage and disappear during the SOS response. Blue arrows indicate foci that appear after damage. Green arrow represents a focus that converts into a bundle. Cell outlines are provided as a guide to the eye. At least two independent experiments were performed with 30 fields of view at each time point. Stills from Figure 1—video 2 are presented here. Scale bar corresponds to 5 μm. (E) Crystal structure of the operator bound dimeric λ repressor CI (PDB ID: 3BDN). (F) Monomer of CI showing the catalytic lysine (K192, purple), residues that mediate dimerization (A152 and P158, blue), and the C terminus involved in dimerization (grey). Inset shows the monomeric C-terminal fragment ‘mCI’ defined as CI(101–229, A152T P158A and K192A) used in this study.
Figure 1—video 1
Time-lapse acquisition of MG1655/pRecAp-GFP cells.
Related to Figure 1. Cells were irradiated at t = 0 with 20 Jm−2 of UV, and imaged every 5 min. In response to UV irradiation, the cells exhibit SOS induced cell filamentation, accompanied by expression from the recA promoter. Video is relayed at 15 fps.
Figure 1—video 2
Time-lapse acquisition of recA-gfp cells.
Related to Figure 1. Cells were irradiated at t = 0 with 20 Jm−2 of UV, and imaged every 5 min. In response to UV irradiation, the cells exhibit SOS-induced cell filamentation, accompanied by expression of RecA-GFP. RecA forms various structures that exhibit distinct dynamics. Arrows are annotated as described in Figure 1D. Video is relayed at 15 fps.
Figure 2 with 2 supplements
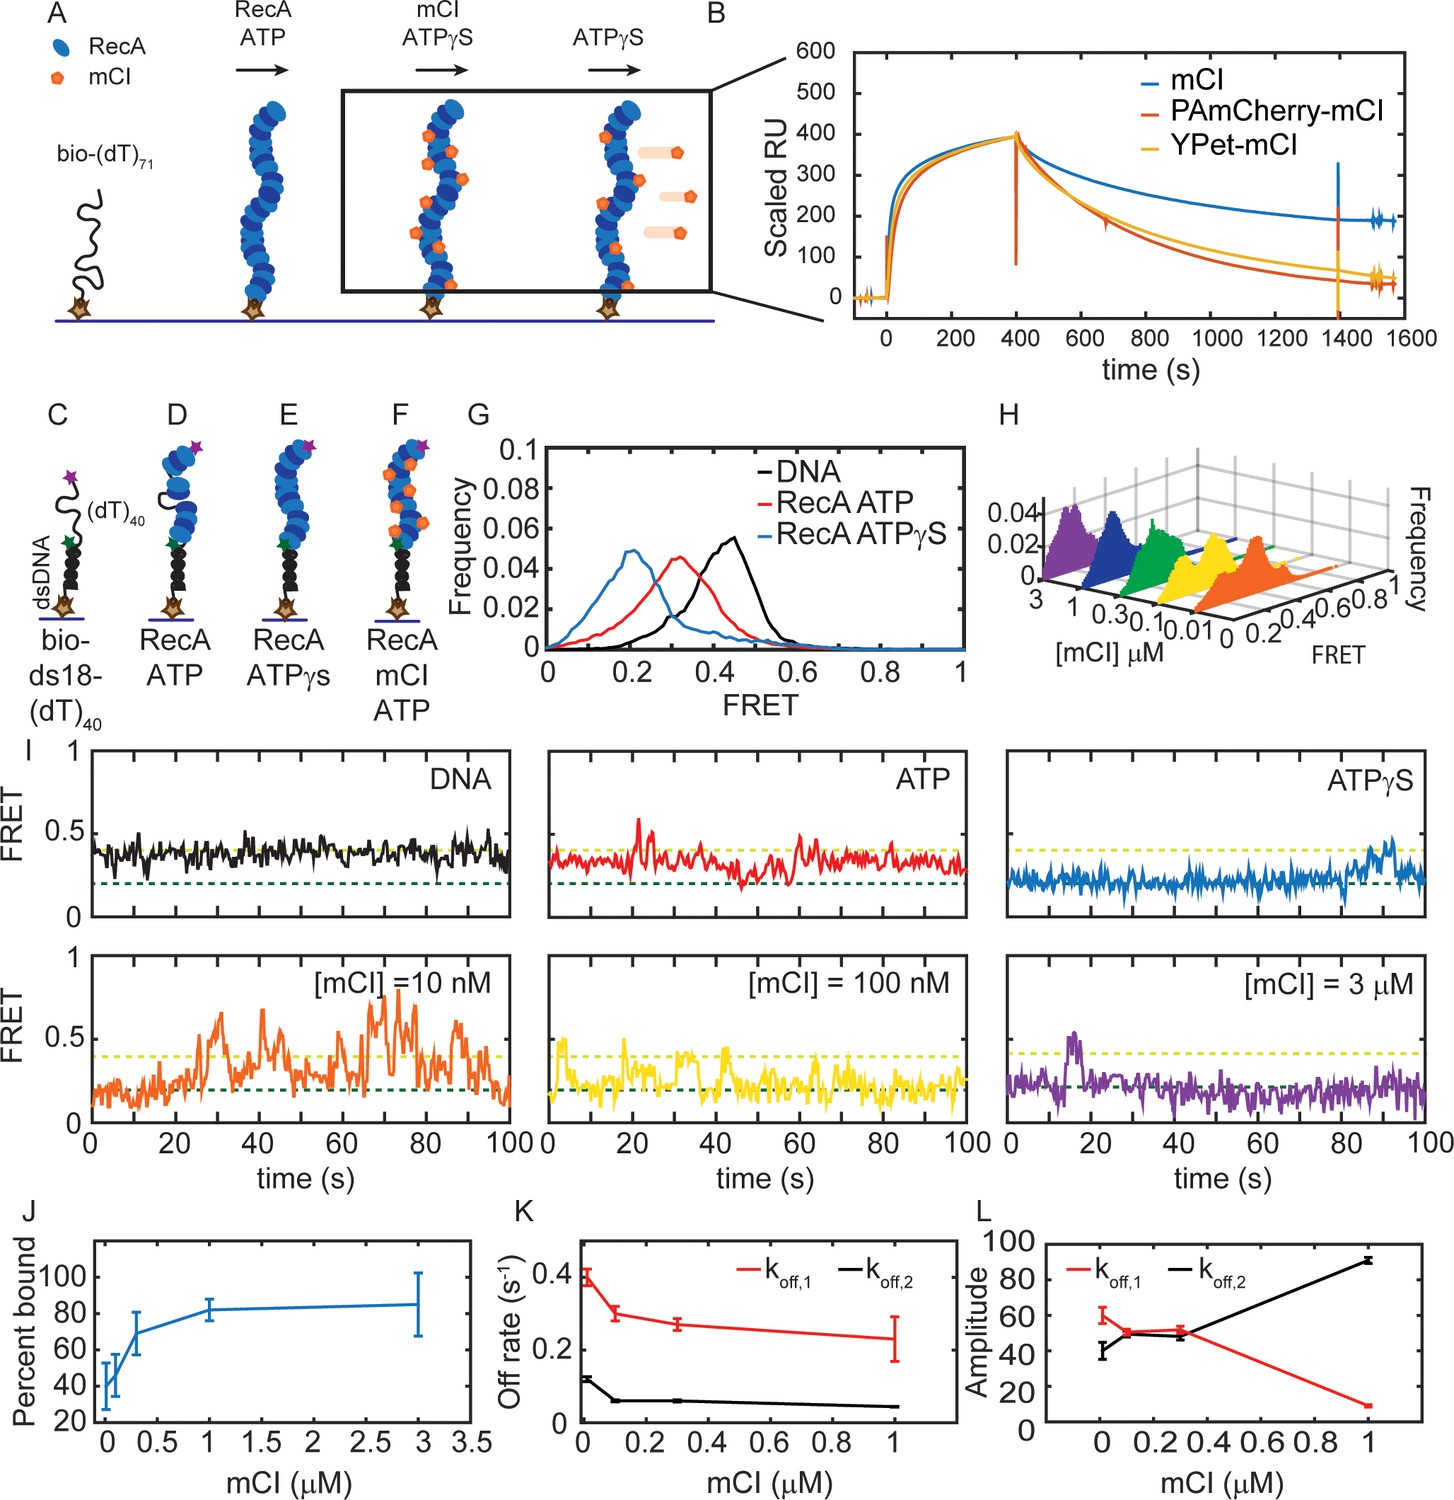
mCI stabilizes ssDNA-RecA filaments in vitro.
(A) Schematic of SPR experiment probing association and dissociation kinetics of mCI from ssDNA-RecA-ATPγS filaments on the surface of an SPR chip. ssDNA-RecA-ATPγS filaments were assembled on a biotinylated (dT)71 ssDNA molecule. (B) mCI (blue), YPet-mCI (yellow) or PAmCherry-mCI (red) were then flowed into the flow cell at time t = 0 for 400 s to monitor the association phase. Dissociation of mCI from ssDNA-RecA-ATPγS filaments was observed by leaving out mCI (or variant) from the injection buffer. Sensorgram reveals biphasic association of mCI (or variant, 1 μM) to RecA* filaments, followed by a slow dissociation from the ssDNA-RecA-ATPγS filament. Sensorgrams presented here are corrected for slow disassembly of the RecA-ATPγS filament, and data are scaled to the binding curve of YPet-mCI for purposes of comparison (see also Figure 2—figure supplement 1C for unscaled data). (C) Schematic of single-molecule FRET assay used to probe the influence of mCI binding on the conformational state of the ssDNA-RecA-ATP filament assembled on a ssDNA (dT)40 overhang. Biotinylated substrate DNA (bio-ds18-(dT)40 containing donor and acceptor fluorophores) was immobilized on a functionalized coverslip via a streptavidin-biotin interaction. (D) RecA binds the ssDNA overhang dynamically to form a ssDNA-RecA filament. (E) In the presence of ATPγS, RecA forms a stable filament. (F) Incubation with mCI leads to a RecA filament decorated with mCI. (G) FRET distributions observed from the substrate alone (n = 101 molecules), with RecA-ATP (1 μM RecA, 1 mM ATP, n = 179 molecules) and RecA-ATPγS (1 mM ATPγS, n = 87 molecules) from at least three independent experiments. (H) Titration of mCI shifts the RecA-ATP distribution to that of the active filament. (I) Example FRET traces of DNA substrate alone or when bound to RecA in the presence of ATPγS, or when bound to RecA in the presence of ATP and mCI (0, 10, 100, 300, 1000 and 3000 nM mCI; n = 179, 139, 77, 70, 172, 68 molecules respectively from at least three independent experiments). Dashed lines represent ‘bound’ (FRET = 0.2 dark green) and ‘unbound’ (FRET = 0.4 light green) states. (J) Fitting of the Hill equation to the percentage of bound fraction as a function [mCI] reveals a KD of 36 ± 10 nM and a cooperativity of 2.4 ± 0.2. Errors represent fitting errors to the entire data set. (K) Off-rates measured from binding of mCI to ssDNA-RecA-ATP filaments (L) Percentage amplitude of the detected rate-constants as a function of [mCI] reveals enrichment of the population decaying according to the slow off-rate as a function of [mCI] (between 40–50 molecules were analyzed at each concentration; Error bars represent fitting errors). See also Figure 2—figure supplements 1 and 2.
Figure 2—figure supplement 1
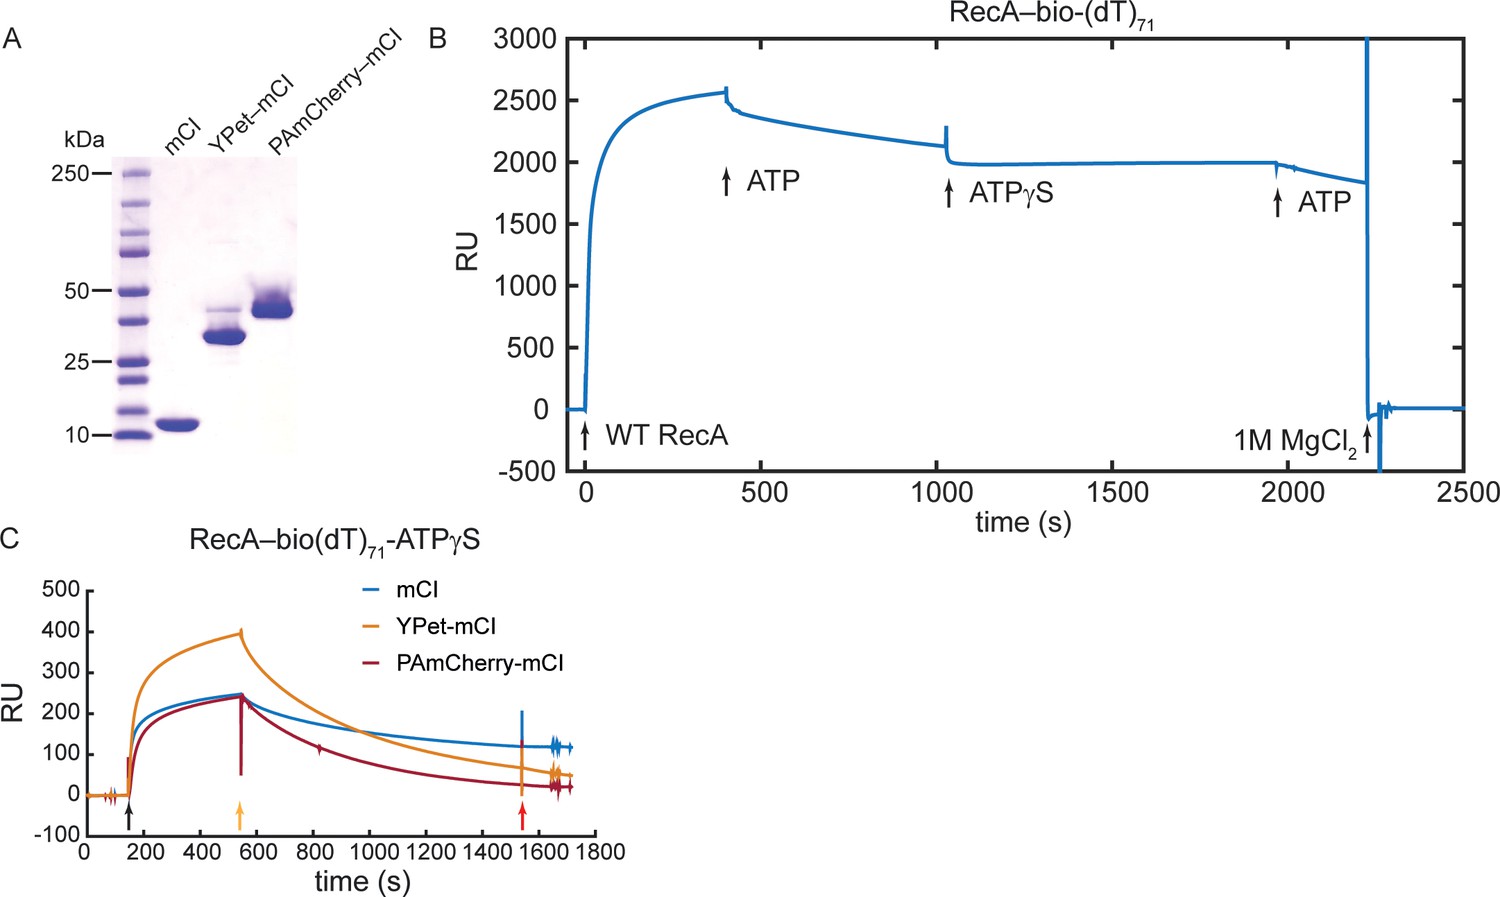
Investigation of binding of mCI, YPet-mCI and PAmCherry-mCI to RecA filaments using SPR.
Related to Figure 2. (A) Coomassie stained SDS-PAGE gel of mCI, YPet-mCI and PAmCherry-mCI. Note that YPet-mCI and PAmCherry-mCI each exhibit a doublet that is attributable to incomplete denaturation of the fluorophore in the presence of SDS. (B) Sensorgram showing immobilization of RecA on bio(dT)71 in the presence of ATP. The RecA-ATP filament is unstable and disassembles moderately slowly. In the presence of ATPγS, disassembly of the RecA-ssDNA filament is minimized. (C) Sensorgram indicating association and dissociation of mCI, YPet-mCI and PAmCherry-mCI to ssDNA-RecA-ATPγS filaments. Black arrow: injection of mCI (or variant) in SPRRecA buffer in the presence of ATPγS. Yellow arrow: Injection of SPRRecA buffer in the presence of ATPγS. Red arrow: Buffer change to SPR running buffer. N = 1 independent experiment.
Figure 2—figure supplement 2
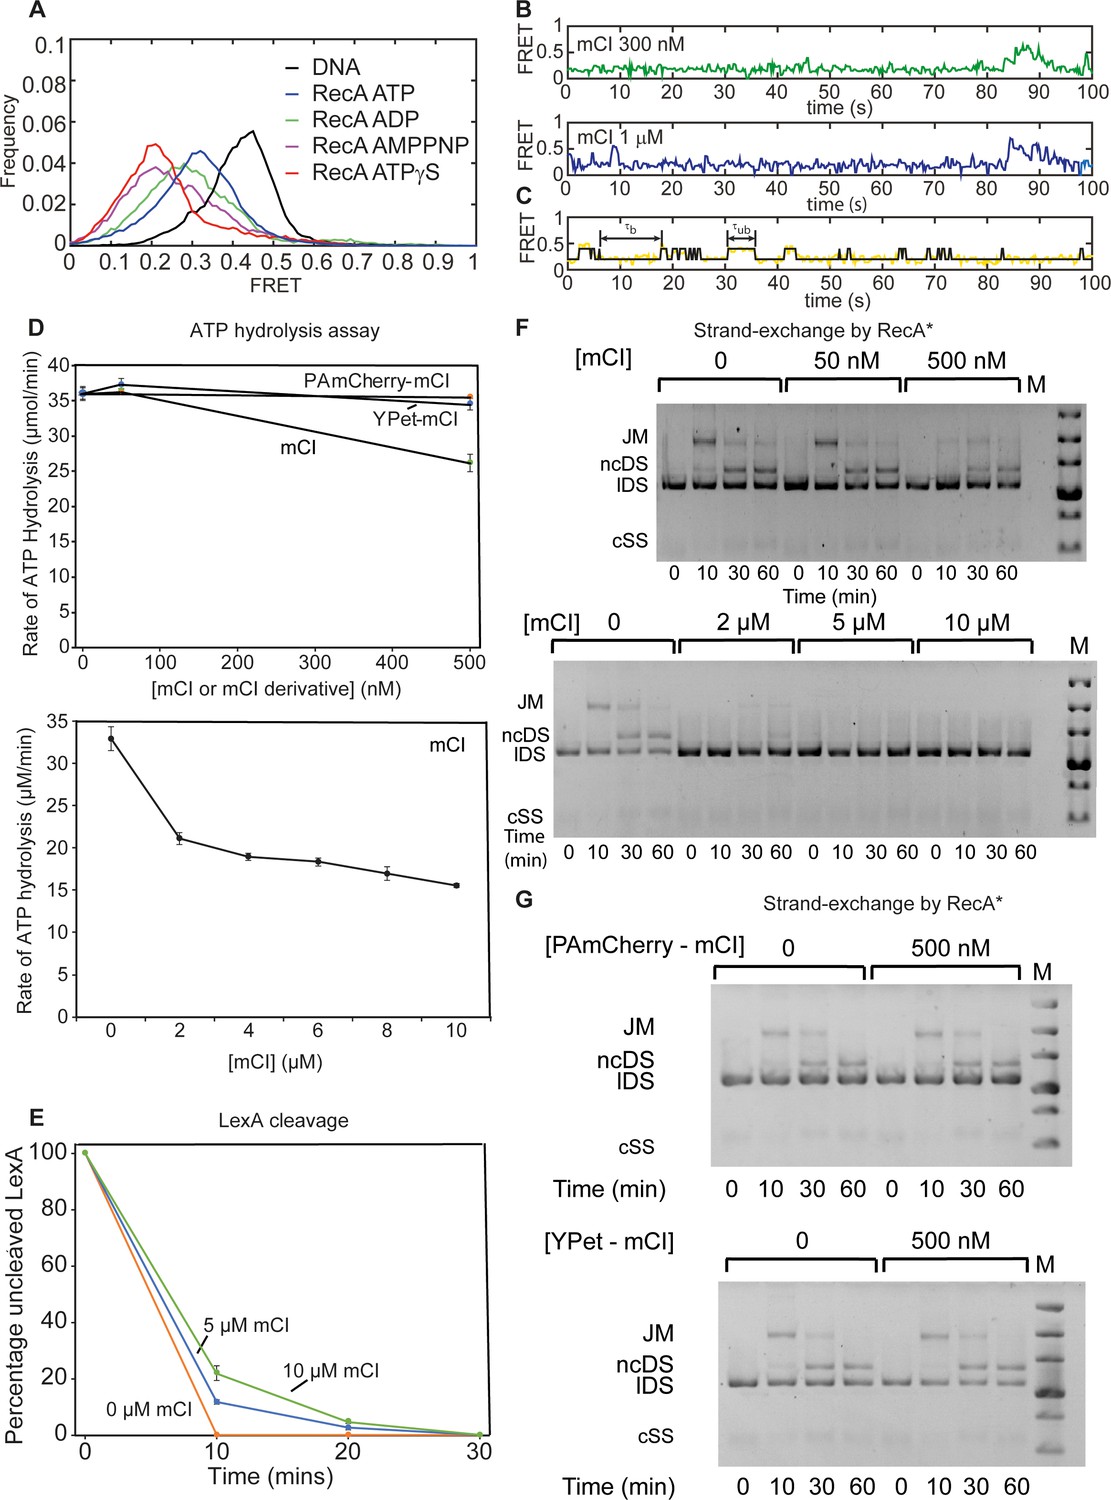
Characterizing the influence of mCI on catalytic properties of RecA* using in vitro assays.
Investigation of the influence of mCI on catalytic properties of RecA*. Related to Figure 2. (A) Investigation of binding of mCI, YPet-mCI and PAmCherry-mCI to RecA filaments using smFRET. Histogram of FRET values exhibited by bio-ds18-(dT)40 DNA (black), RecA on bio-ds18-(dT)40 in the presence of ATP (blue), ATPγS (red; n = 87 molecules), ADP (green; n = 93 molecules) or AMPPNP (purple; n = 104 molecules) from at least two independent experiments. (B) Example FRET traces of RecA assembled on bio-ds18-(dT)40 in the presence of ATP and 300 nM (green) or 1 μM (blue) mCI. (C) Examples of the states obtained by thresholding trajectory at FRET = 0.3 to the 100 nM mCI trajectory from Figure 2I. States with FRET > 0.3 were considered to be ‘unbound’, whereas states with FRET < 0.3 were considered to be ‘bound’. (D) mCI inhibits the ssDNA-dependent ATPase of RecA* at μM concentrations of mCI. PAmCherry-mCI and YPet-mCI do not inhibit the RecA* ATPase in the 0–500 nM concentration regime. n = 3 independent repeats. Error bars indicate standard deviation of the measurement. (E) mCI delays cleavage of LexA by RecA* in a concentration dependent manner. n = 3 independent repeats. Error bars indicate standard deviation of the measurement. (F) mCI inhibits RecA*-mediated DNA strand exchange at μM concentrations but not at nM concentrations. n = 2 independent repeats. (G) Tagged mCI variants do not inhibit strand-exchange activity of RecA* significantly at concentrations below 500 nM. Abbreviations are: JM, joint molecule; ncDS, nicked circular double stranded DNA product of strand exchange; lDS, linear double stranded substrate of DNA strand exchange. The circular ssDNA substrate does not stain well and is not visible on these gels. The markers in the lane labeled M are linear duplex DNAs 20, 10, 7, 5, 4 and 3 kbp in length from top to bottom. n = 2 independent repeats.
Figure 3 with 1 supplement
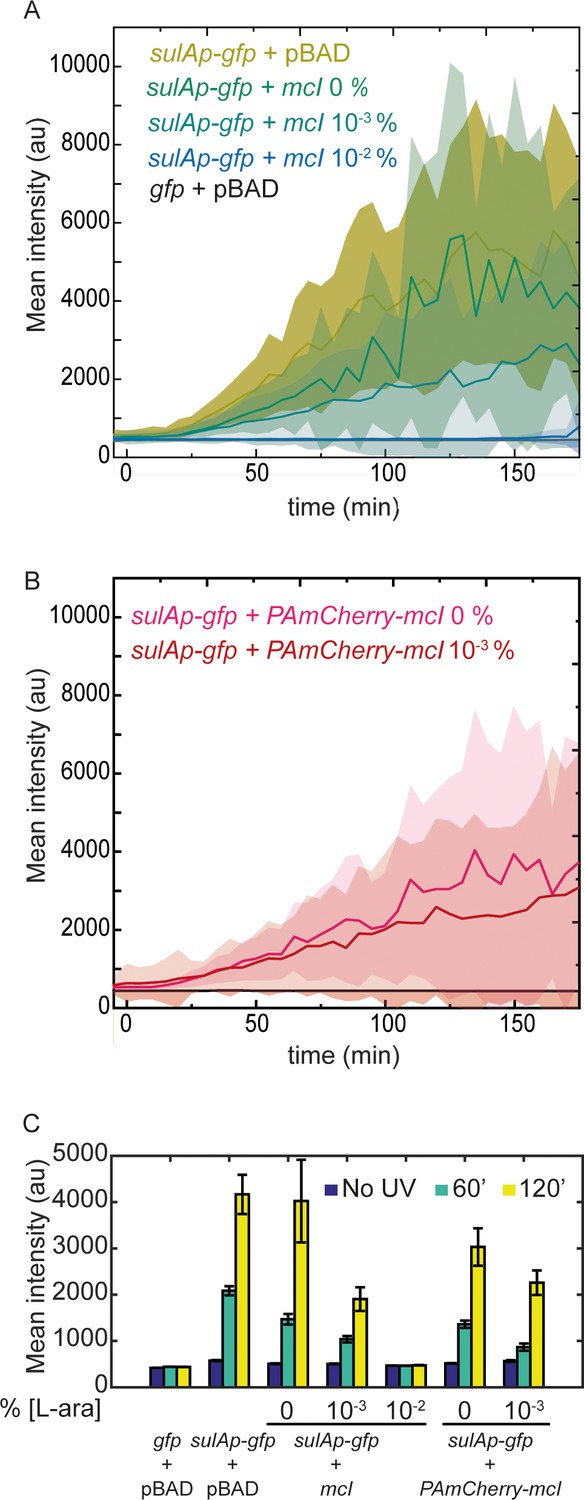
mCI inhibits the SOS response in a concentration-dependent manner.
(A) Time-lapse experiments were performed on MG1655 cells carrying the SOS-reporter plasmids (‘gfp’ or ‘sulAp-gfp’) and pBAD-mCI plasmid (‘mcI’) following irradiation with 20 Jm−2 of UV-irradiation at time t = 0 min. Mean intensity of GFP fluorescence was measured in cells carrying the reporter plasmid and mCI or empty vector, and plotted here as follows: ‘sulAp-gfp +pBAD’ cells (yellow; strain# HG258), ‘gfp +pBAD’ cells (black; strain# HG257), ‘sulAp-gfp +mcI’ (strain# HG253) (0% L-ara) (green), 10−3% L-ara (blue) and 10−2% L-ara (purple), respectively. (B) Mean intensity of GFP fluorescence in cells carrying the reporter plasmid and pBAD-PAmCherry-mcI plasmid (‘sulAp-gfp +PAmCherry-mcI’) (strain# HG285; 0% L-ara (pink) and 10-3% L-ara (red)) is plotted as a function of time. Shaded error bars indicate standard deviation of cellular fluorescence for all cells imaged at the indicated time point. Standard deviation was plotted to emphasize the variation of the cellular fluorescence across the population. In these experiments, 10–200 cells were analyzed from 12 fields of view at each of the 37 time points, from one independent repeat for each experimental condition. (C) Bar plots summarizing data presented in B and C under the indicated conditions at a time point before UV irradiation, one at 60, and one at 120 min after UV. Here, error bars represent standard error of the mean cellular fluorescence for all cells imaged at the indicated time point.
Figure 3—video 1
mCI concentration dependent inhibition of the SOS response.
Related to Figure 3. Cells were irradiated at t = 0 with 20 Jm−2 of UV, and imaged every 5 min. In response to UV irradiation, the cells exhibit SOS-induced cell filamentation, accompanied by expression of GFP from the reporter plasmid. Cells carrying the sulAp-gfp vector exhibit a large increase in GFP fluorescence indicating the activation of the SOS response, whereas cells carrying the promoter-less gfp vector do not exhibit such an increase in cell fluorescence. In the presence of L-arabinose, cells carrying the mCI expression vector and the sulAp-gfp reporter plasmid exhibit a lower increase in GFP fluorescence. Numbers indicate percentage of L-arabinose present in EZ-glycerol medium. Quantification of the cellular fluorescence is provided in Figure 3A. Video is relayed at 15 fps.
Figure 4 with 1 supplement
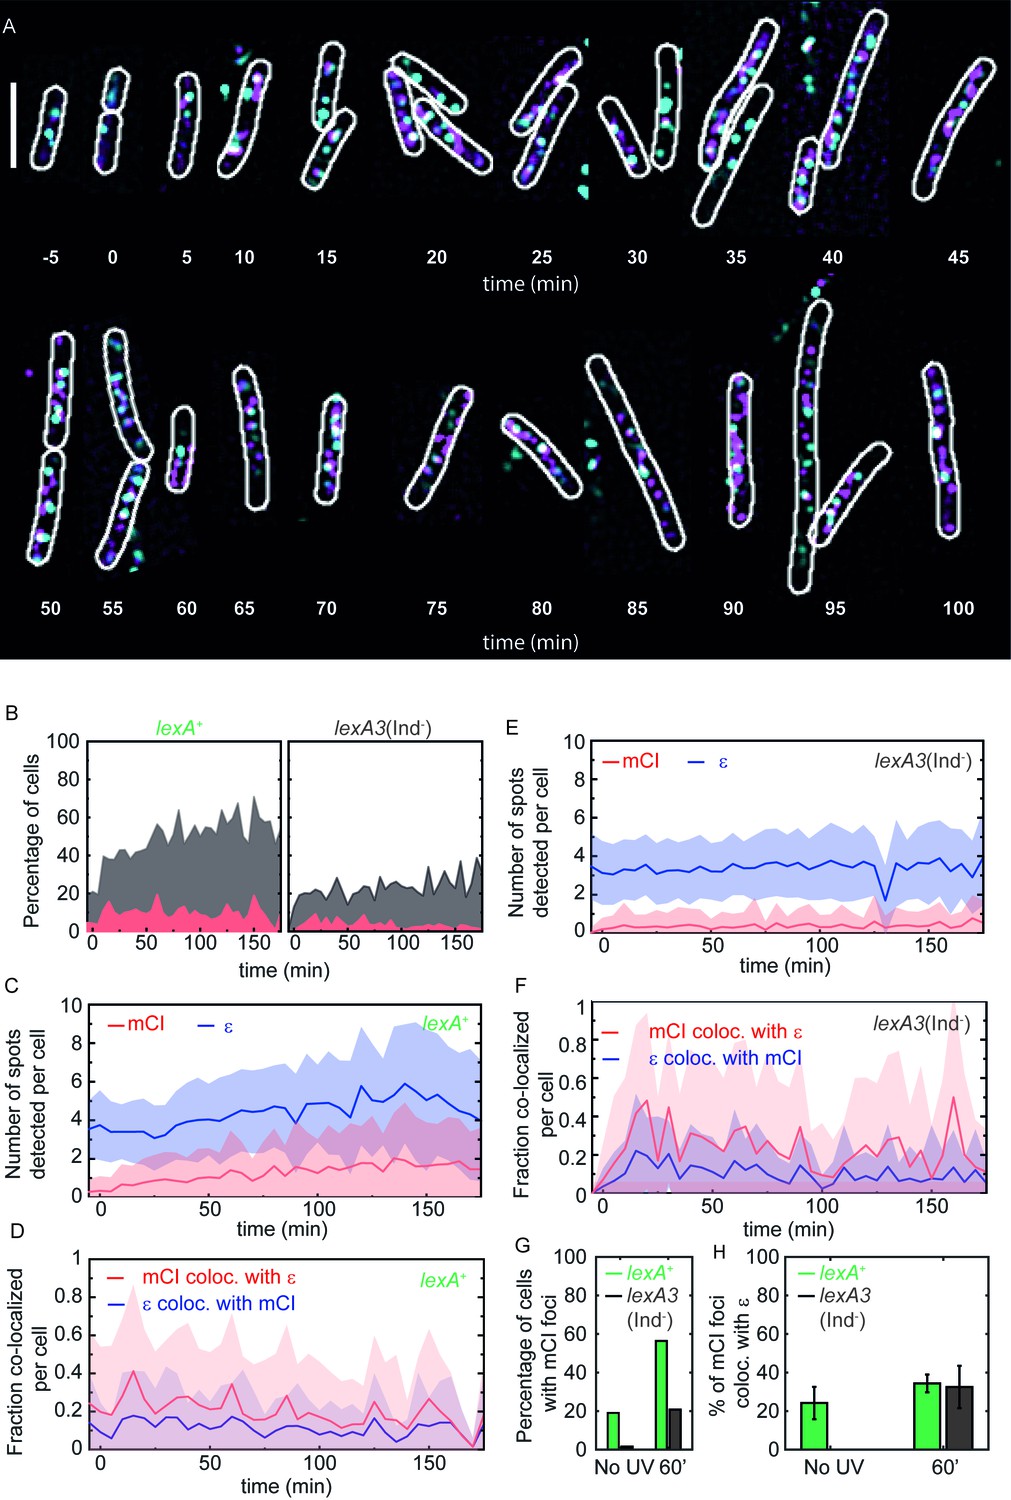
mCI co-localization with the replisome after UV irradiation.
(A) MG1655 cells carrying the ϵ-YPet replisome marker (cyan) and expressing PAmCherry-mCI (magenta) from the pBAD-PAmCherry-mcI plasmid (strain# HG267) were grown in the presence of 5 × 10⁻⁴% L-arabinose and irradiated with 20 Jm−2 of UV-irradiation followed by imaging for three hours. Examples of lexA+ (strain# HG267) provided at indicated time points (B) The percentage of cells (light gray) imaged at each time point is shown for lexA+ (N = 4 independent repeats) and lexA3(Ind-) (N = 3 independent repeats) cells. Of these, the percentage of cells exhibiting replisome as well as, mCI foci is indicated in dark gray. Red area indicates the number of cells in the population where mCI is co-localized with replisomes. Total cell counts for each time point are presented in Figure 4—figure supplement 1D. Number of replisome foci and PAmCherry foci were counted for each time point per cell for (C) lexA+ and (D) lexA3(Ind-) cells from the pooled data set. In cells exhibiting at least one replisome focus and one PAmCherry-mCI focus, the fraction of replisomes co-localizing with PAmCherry-mCI was determined (blue) and the fraction of PAmCherry-mCI co-localizing with replisomes was determined (red) for (E) lexA+ and (F) lexA3(Ind-) cells. (G) Bar plots summarizing percentage of cells exhibiting at least one mCI focus for lexA+ (green) and lexA3(Ind-) (gray) cells before UV and at 60 min after UV irradiation. (H) Bar plots summarizing extent of co-localization of ϵ-YPet and PAmCherry-mCI in cells with at least one mCI and ϵ focus. Data are presented as mean ± SEM calculated at each time point. 25–150 cells were analyzed for each time point. See also Figure 4—figure supplement 1.
Figure 4—figure supplement 1
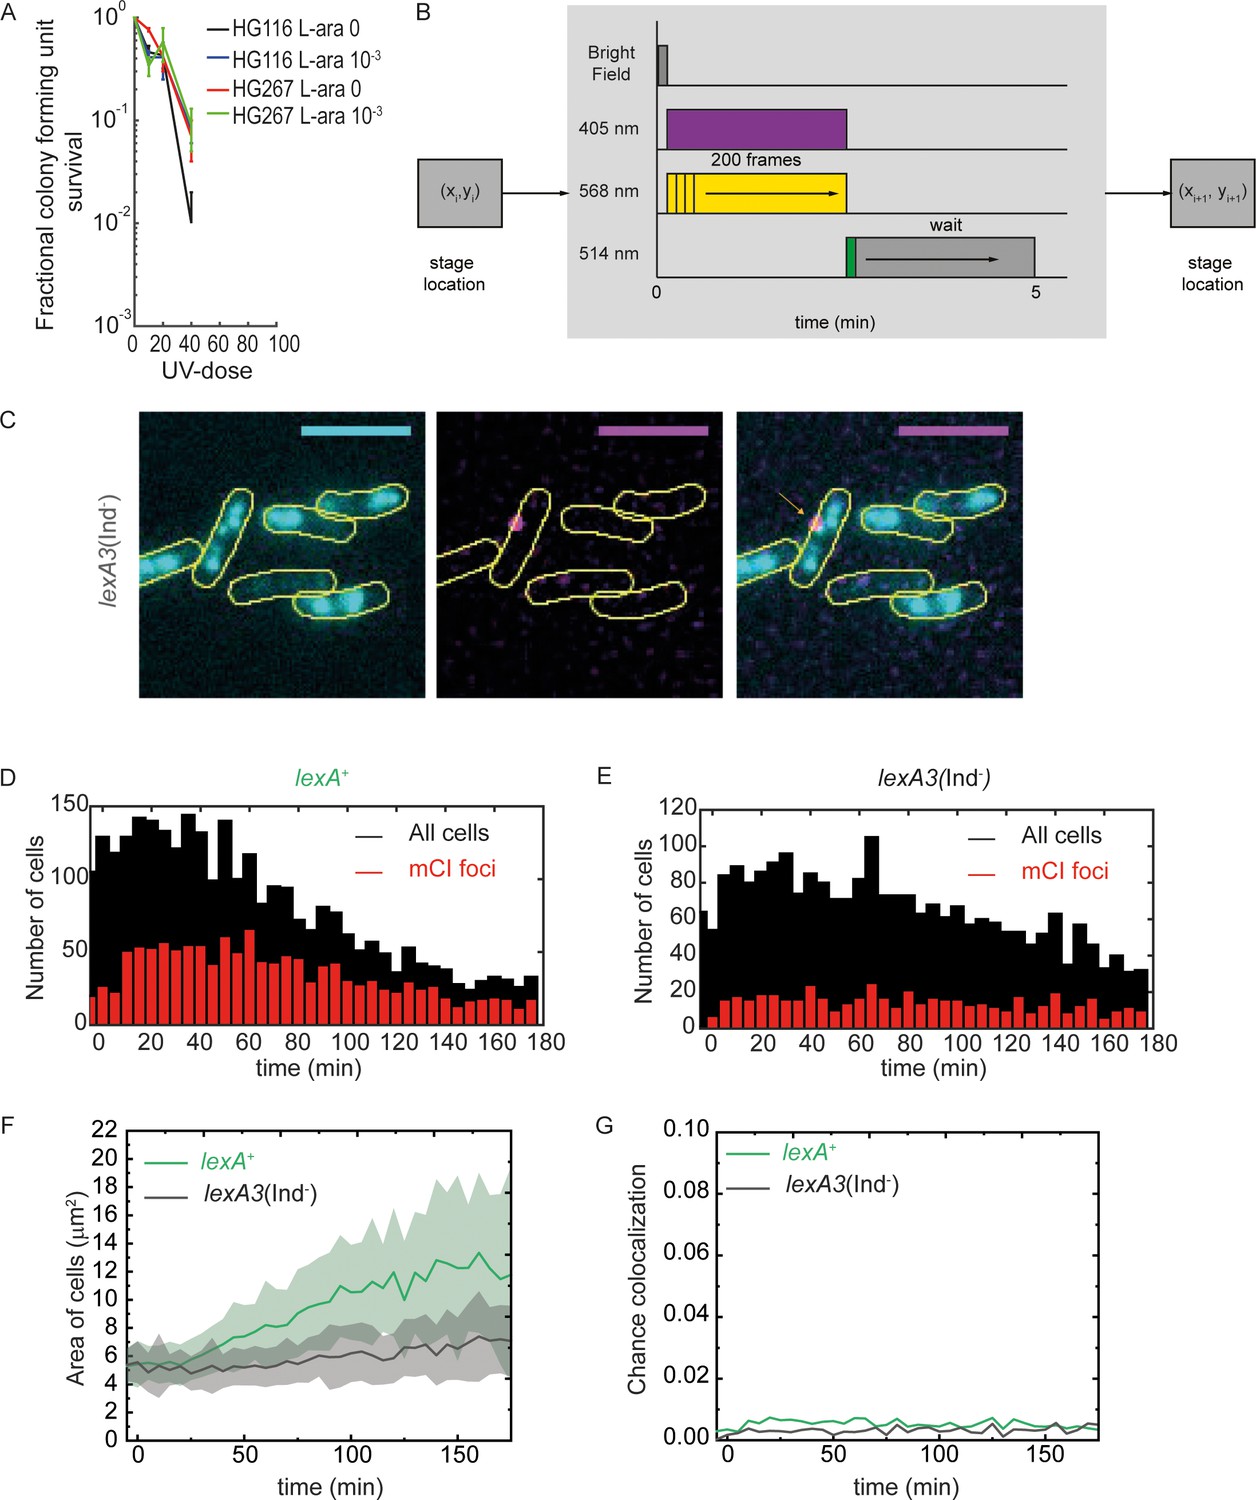
Measurement of co-localization of mCI with the replisome.
Related to Figure 4. (A) UV-survival assay showing survival of MG1655/pBAD-myc-HisB (HG116, two technical replicates and two biological replicates) and HG267 (two technical replicates and three biological replicates) at 0, 20, 40 and 80 Jm−2 of 254 nm UV radiation. Error bars represent standard error of the mean. (B) Schematic of the acquisition protocol employed for dual colour imaging with YPet and PAmCherry. (C) Example image of lexA3(Ind-) cells taken at 15 min after UV exposure of 20 Jm−2 in the flow cell provided in situ. Scale bar represents 5 μm. Histogram of number of cells counted at each time point (black) and fraction that exhibit a PAmCherry-mCI focus (red) for (D) lexA+ cells and (E) lexA3(Ind-) cells from at least 3 repeats for each experiment (F) Mean and standard deviation of cross sectional areas of cells measured as a function of time after UV for lexA+ cells and lexA3(Ind-) cells (G) Probability of foci in the two channels colocalizing by chance for lexA+ cells and lexA3(Ind-) cells after UV exposure.
Figure 5 with 2 supplements
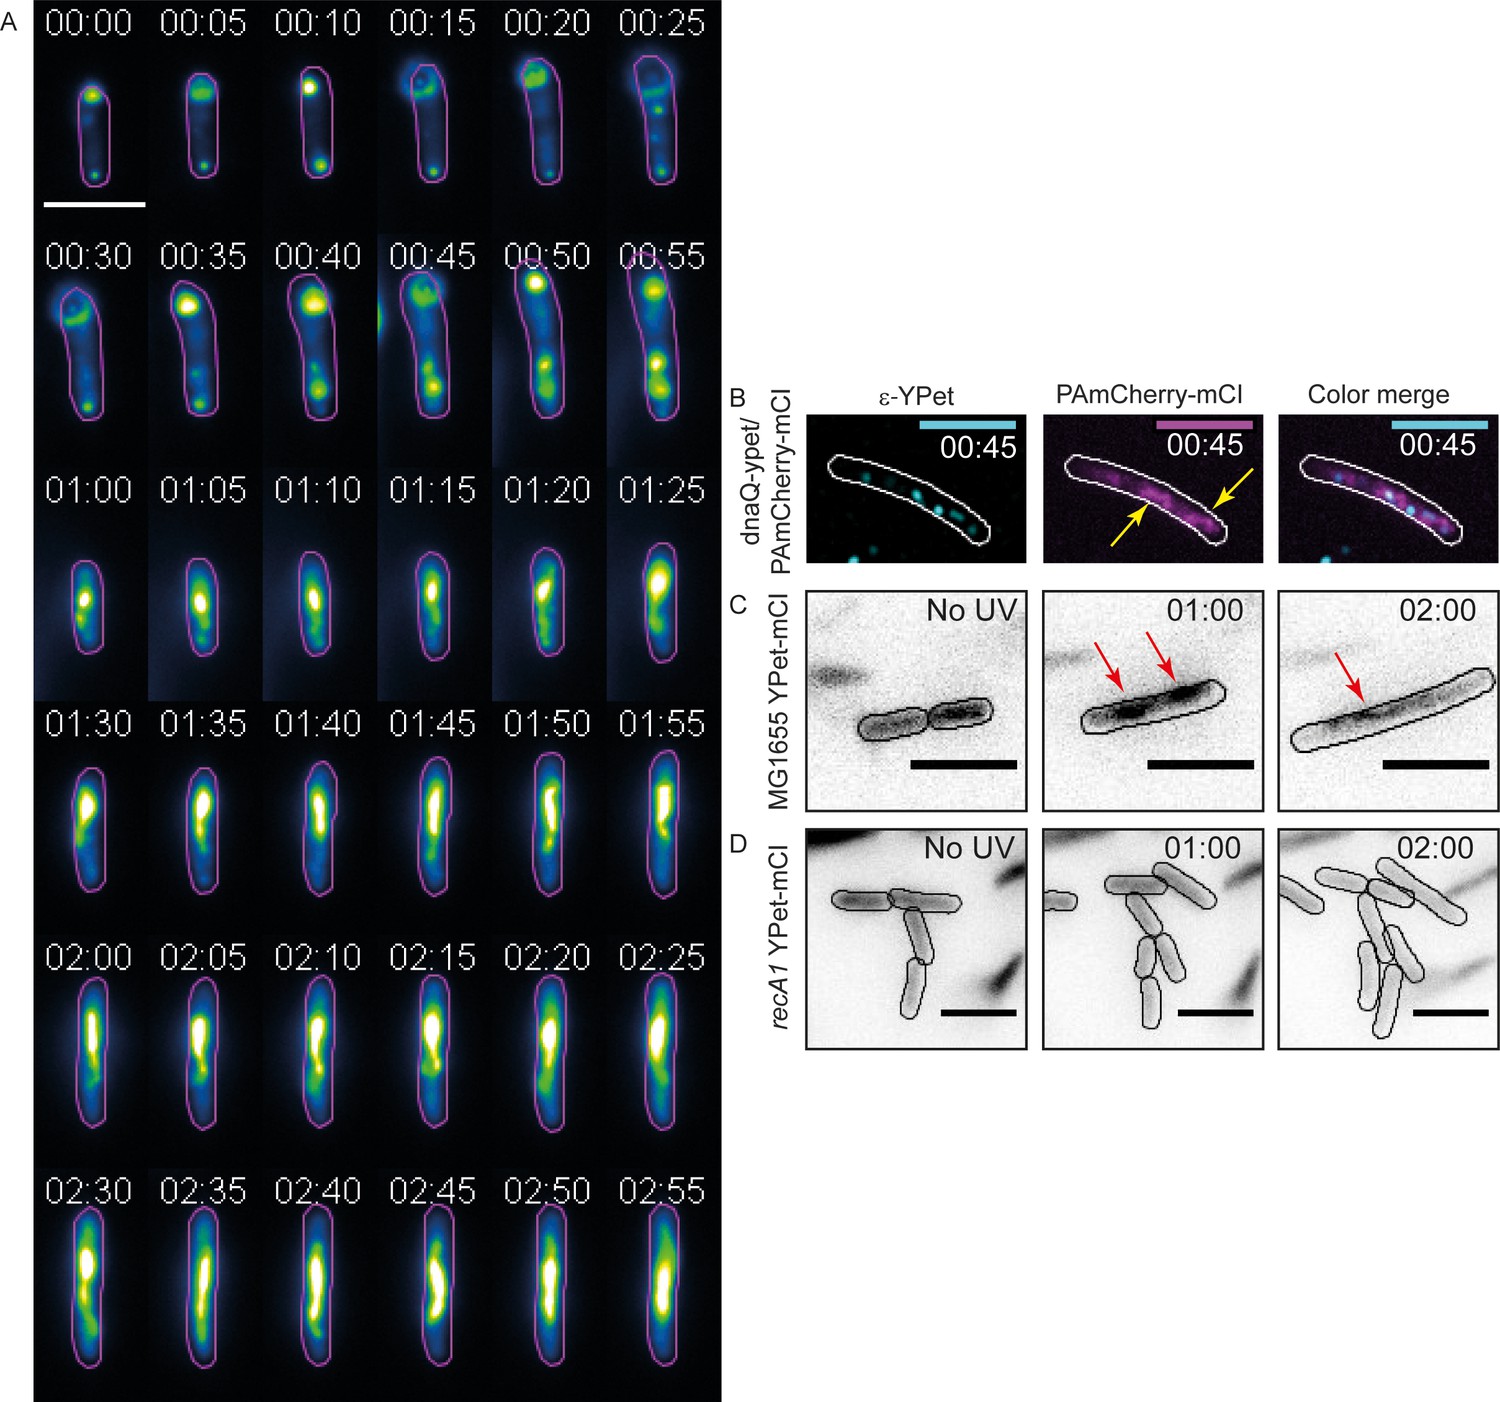
mCI stains RecA bundles after UV-damage.
(A) Montage of a single recA-gfp cell exhibiting large, dynamic RecA-GFP structures at late time points from Figure 5—video 1. Note that the immobilized cell divides at t = 1 hr. The daughter cell is carried away by flow. Cell outlines are provided as a guide to the eye. Time is indicated as hh:mm. (B) At late time points in the DNA damage response, PAmCherry-mCI forms large bundles in recA+ cells. Shown here is an example of an overlay of the mCI signal (magenta) and replisomal ϵ foci (cyan) at t = 45 min after 20 Jm−2 UV (N = 4 independent experiments). Yellow arrows point to RecA bundles. For purposes of illustration, peaks in the ϵ images were enhanced using a discoidal average filter. (C) YPet-mCI also forms bundles (indicated by red arrows) in response to UV-damage in recA+ cells (N = 3 independent experiments). (D) Cells carrying the recA1 allele do not exhibit foci or bundle formation upon UV-irradiation under identical conditions as in panel (n > 250 cells from 12 fields of view at each of the 37 time points). Scale bar s correspond to 5 μm. See also Figure 5—figure supplement 1. Cell outlines provided as a guide to the eye.
Figure 5—figure supplement 1

Detection of RecA bundles using mCI in ΔuvrD cells.
Related to Figure 5. Fluorescence image of MG1655 ΔuvrD cells carrying pBAD-YPet-mcI (N = 1 repeat). Cells exhibit constitutive SOS and the presence of large RecA bundles (A) before and (B) 15 min after UV (20 Jm−2). Scale bar represents 5 μm. n > 100 cells for each condition.
Figure 5—video 1
Visualization of RecA-GFP bundles in recA-gfp cells after UV exposure.
Related to Figure 5. Cells were imaged in the 488 channel every 5 min for three hours following UV irradiation at t = 0 min. Here a video of a single cell growing under constant flow of growth medium is presented. Note the large, dynamic structure (termed a ‘RecA bundle’) that appears at later time points. Video is relayed at 15 fps.
Figure 6 with 4 supplements
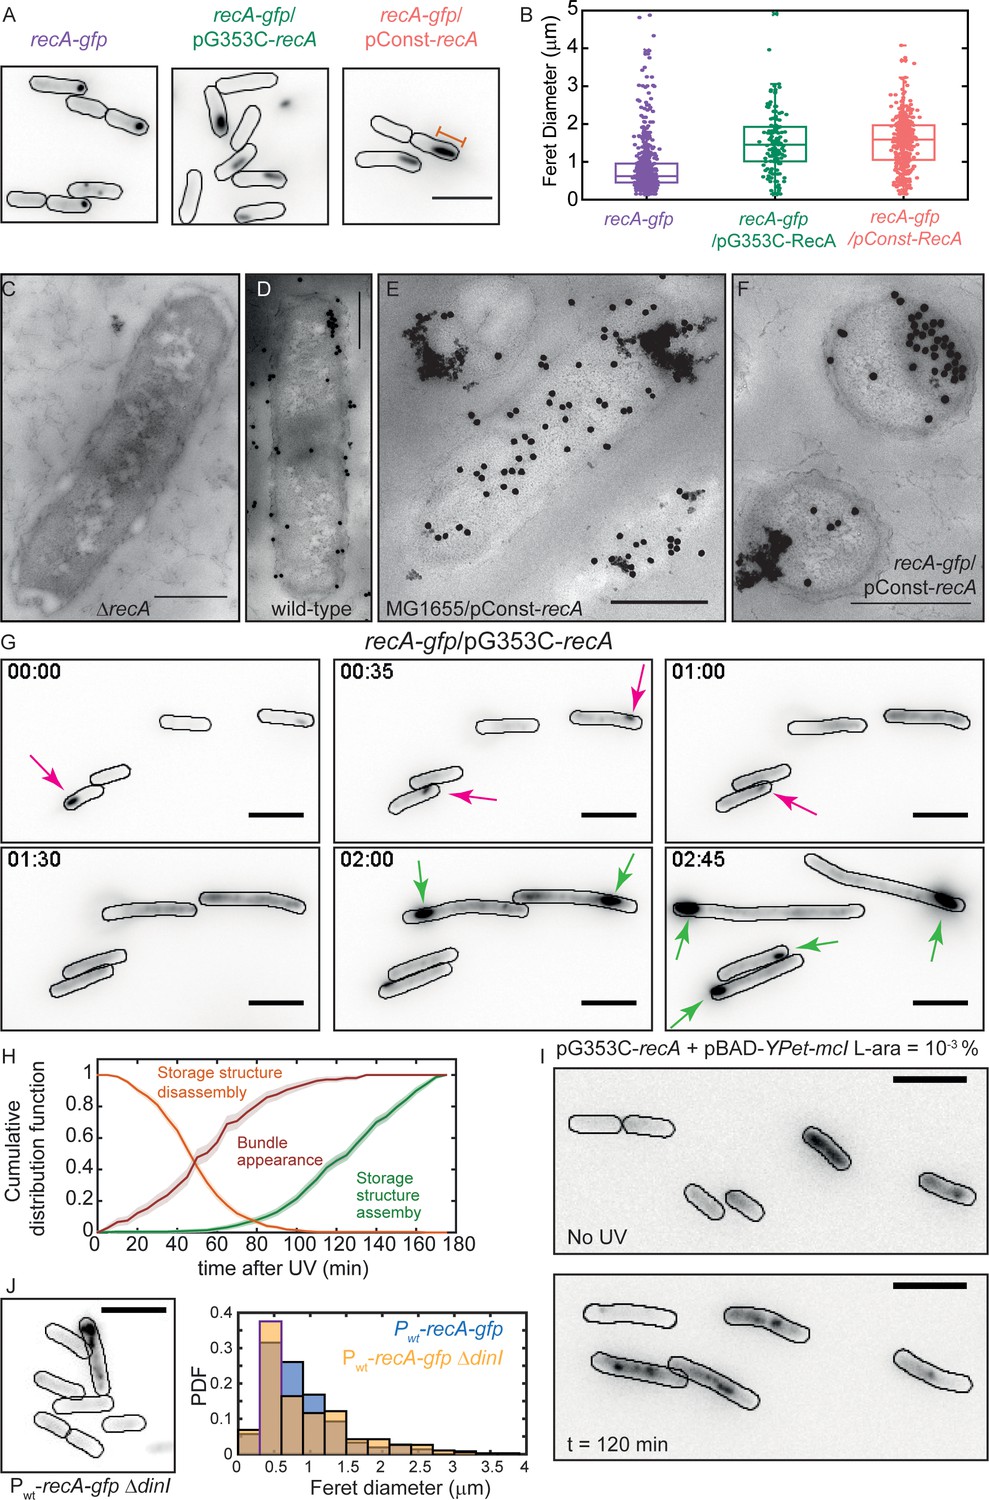
Excess RecA is stored in storage-structures.
(A) Montage of recA-gfp (strain# HG195), recA-gfp/pG353C-recA (strain# HG406) and recA-gfp/pConst-recA cells (strain# HG411) imaged in the absence of UV damage. See also Figure 6—video 1. Scale bar corresponds to 5 μm. (B) Box and whiskers plot of maximum Feret diameter of storage structures in recA-gfp (purple; n = 528 structures), recA-gfp/pG353C-recA (green; n = 137 structures) and recA-gfp/pConst-recA cells (orange; n = 399 structures). Mean and 25th/75th percentile are encapsulated in the box. Orange bar in panel A represents the maximum Feret diameter for that particular storage structure. Pairwise Kolmogorov-Smirnov test to compare the distributions of the Feret diameters of the storage structures revealed statistically significant differences for recA-gfp vs. recA-gfp/pG353C-recA (p = 1.3327×10⁻²⁹) and recA-gfp vs. recA-gfp/pConst-recA (p = 1.54×10−60), rejecting the null hypothesis that the measurements for the two strains arise from the same distribution. Electron microscopy images of (C) ΔrecA (D) wild-type recA (E) MG1655/pConst-recA and (F) recA-gfp/pConst-recA cells stained with gold nanoparticles labelled with RecA antibody. Note the appearance of aggregates of gold nanoparticles in panel E at locations consistent with those observed in panel A for recA-gfp/pConst-recA cells. Untagged, over-expressed RecA reveals gold nanoparticle localizations consistent with those expected from RecA storage structures. Scale bar corresponds to 1 μm. (G) Montage of frames from a time-lapse experiment of recA-gfp/pG353C-recA cells exposed to UV (see also Figure 6—video 2). RecA forms storage structures in the absence of DNA damage (0 min) in cells. Storage structures dynamically dissolve after DNA damage (1 hr; magenta arrows). Storage structures reform by sequestering excess RecA synthesized during SOS after repair (2 hr and 2 hr 45 min time points; green arrows). N = 5 independent experiments. (H) Cumulative probability distributions of time of solubilization of storage structure (yellow) and time of appearance (light green) of storage structures from recA-gfp/pG353C-recA (strain# HG406) cells (N = 4 independent experiments). Red line represents cumulative distribution function of time of first incidence of RecA bundles in recA-gfp cells (strain# HG195, n = 108 bundles). Shaded error bars represent standard deviation of the bootstrap distribution obtained by sampling 80% of the data 1000 times. In each case, 100–150 cells were analyzed that were present for the duration of observation (3 hr). (I) YPet-mCI does not stain storage structures in MG1655/pG353C-recA pBAD-YPet-mcI cells (strain# HG446) in the absence of DNA damage, but forms features after UV damage (shown here is a still at 120 min). Cell outlines provided as a guide to the eye. N = 2 independent experiments. See also Figure 6—video 3, and Figure 6—figure supplement 1. Scale bar represents 5 μm. (J) MG1655 cells carrying the recA-gfp fusion under the native recA promoter and ΔdinI (strain# EAW767) exhibit fewer storage structures than dinI+ cells. On average, 27% of EAW767 (Pwt-recA-gfp ΔdinI) cells exhibited structures (mean Feret diameter = 0.9 ± 0.6 μm, n = 702 cells), compared to 43% of EAW428 (Pwt-recA-gfp) cells (mean Feret diameter = 0.9 ± 0.5 μm, n = 855 cells). N = 2 independent experiments. Scale bar represents 5 μm. See also Figure 6—figure supplement 1. A Kolmogorov-Smirnov test to compare the two distributions did not reject the null hypothesis that the two measurements of the Feret diameters for the two strains arose from the same distribution, resulting in a p-value of 0.15.
Figure 6—figure supplement 1
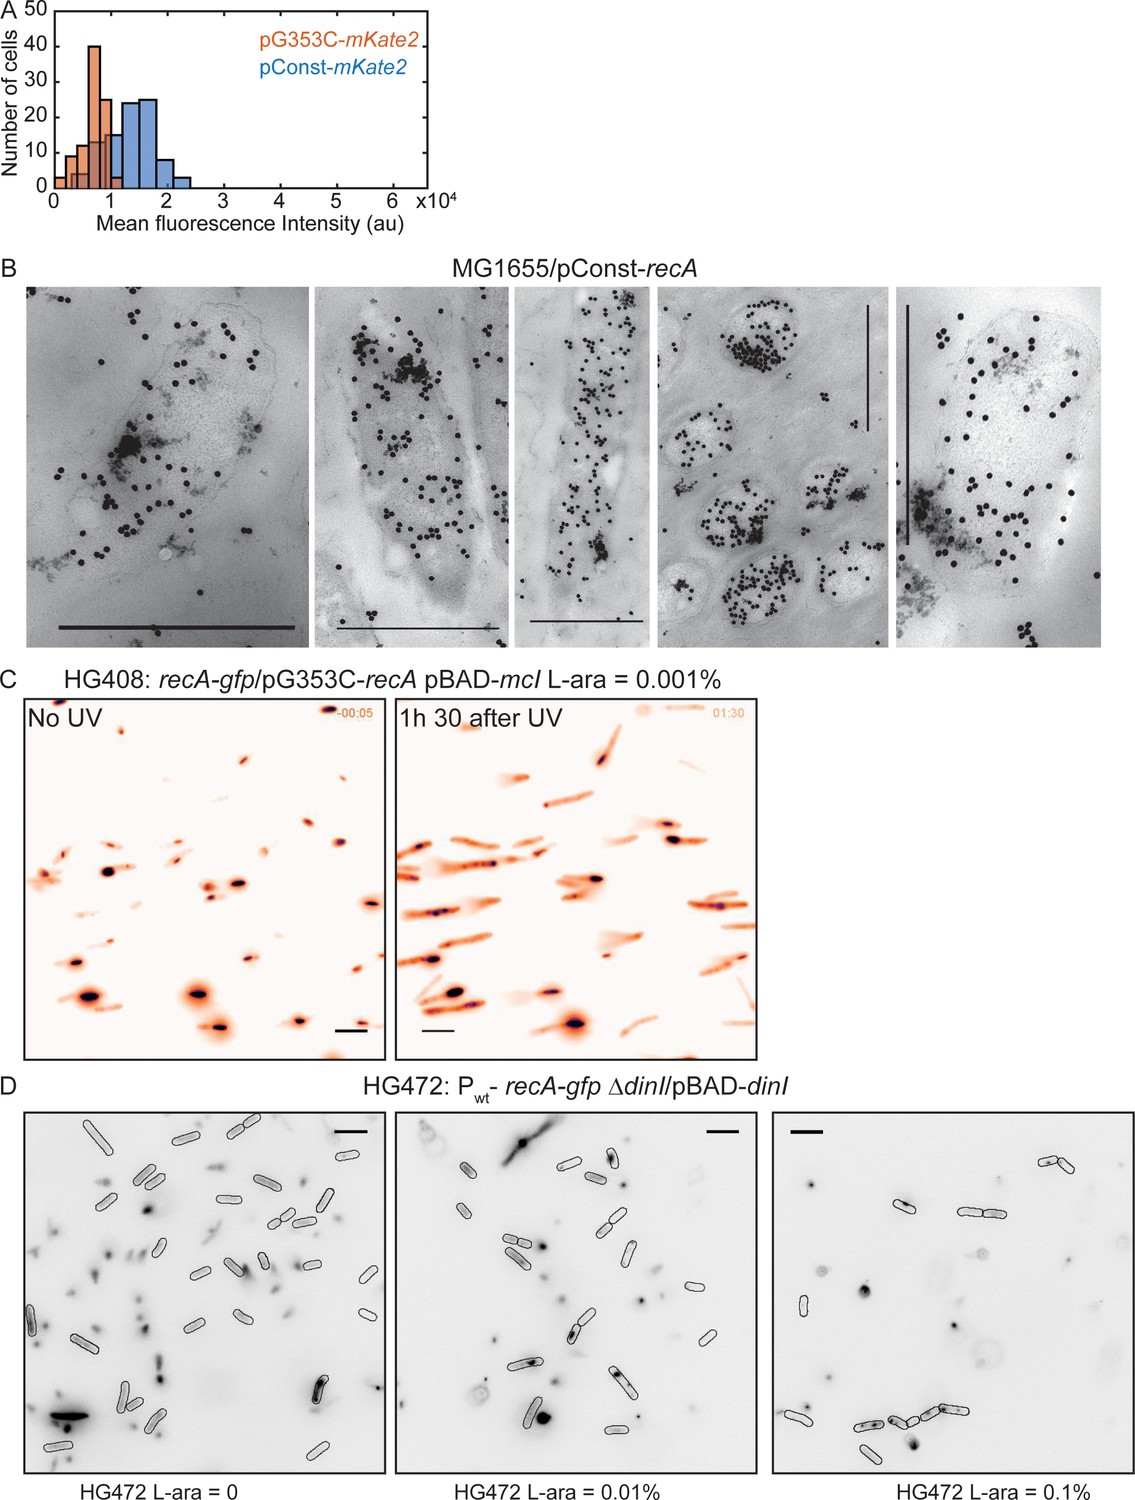
Detection of storage structures of RecA.
Related to Figure 6. (A) Histogram of mean mKate2 fluorescence in cells carrying pConst-mKate2 (n = 92 cells) or pG353C-mKate2 (n = 92 cells). Cells carrying the constitutive RecA promoter (recAo281) exhibit two-fold higher mKate2 fluorescence on average (mean ± standard deviation = 13298 ± 4085 arb. units) than cells expressing mKate2 from the RBS mutant (G353C) of the recAo281 promoter (6879 ± 2150 arb. units). (B) EM images of MG1655/pConst-recA showing clusters of gold-labeled RecA antibody corresponding to storage structures. Scale bar is 1 μm. EM experiments were performed once. (C) Fluorescence image of recA-gfp/pG353C-recA, pBAD-mcI induced with 10−3 % L-arabinose, in the absence of UV and 1 hr 30 min after UV. Storage structures in these cells do not differ from those observed in recA-gfp/pG353C-recA cells (N = 3 repeats; n > 200 cells for each condition). (D) HG472 cells (recA-gfp ΔdinI/pBAD-dinI) induced with varying amounts of L-arabinose (0, 0.01% and 0.1%) exhibit sequestration of RecA into fluorescent structures depending on L-arabinose concentration (N = 1–2 independent repeats; n > 200 cells for each condition). Scale bar is 5 μm.
Figure 6—video 1
Time-lapse imaging of recA-gfp/pG353C-recA cells.
Related to Figure 6. Cells were imaged in the 488 channel every 5 min for 3 hr. In the presence of plasmid expressing excess untagged RecA, the RecA-GFP signal is sequestered in the form of an aggregate that is maintained stably in cells. Upon cell division, cells inherit this structure disproportionately. Video is relayed at 15 fps.
Figure 6—video 2
Time-lapse imaging of recA-gfp/pG353C-recA cells after UV damage.
Related to Figure 6. Cells were irradiated at t = 0 with 20 Jm−2 of UV, and imaged every 5 min for 3 hr. The RecA storage structure dissolves in response to DNA damage and re-appears at later time points. Video is relayed at 15 fps. Cell outlines are provided as a guide to the eye. Scale bar represents 5 μm.
Figure 6—video 3
Time-lapse imaging of YPet-mCI in cells over-expressing wild-type RecA.
Related to Figure 6. Cells were irradiated at t = 0 with 20 Jm−2 of UV, and imaged every 10 min for 3 hr. In the absence of DNA damage, mCI does not stain storage structures. After UV, YPet-mCI was found to form foci and bundles. Video is relayed at 15 fps. Cell outlines are provided as a guide to the eye. Scale bar represents 5 μm.
Figure 7
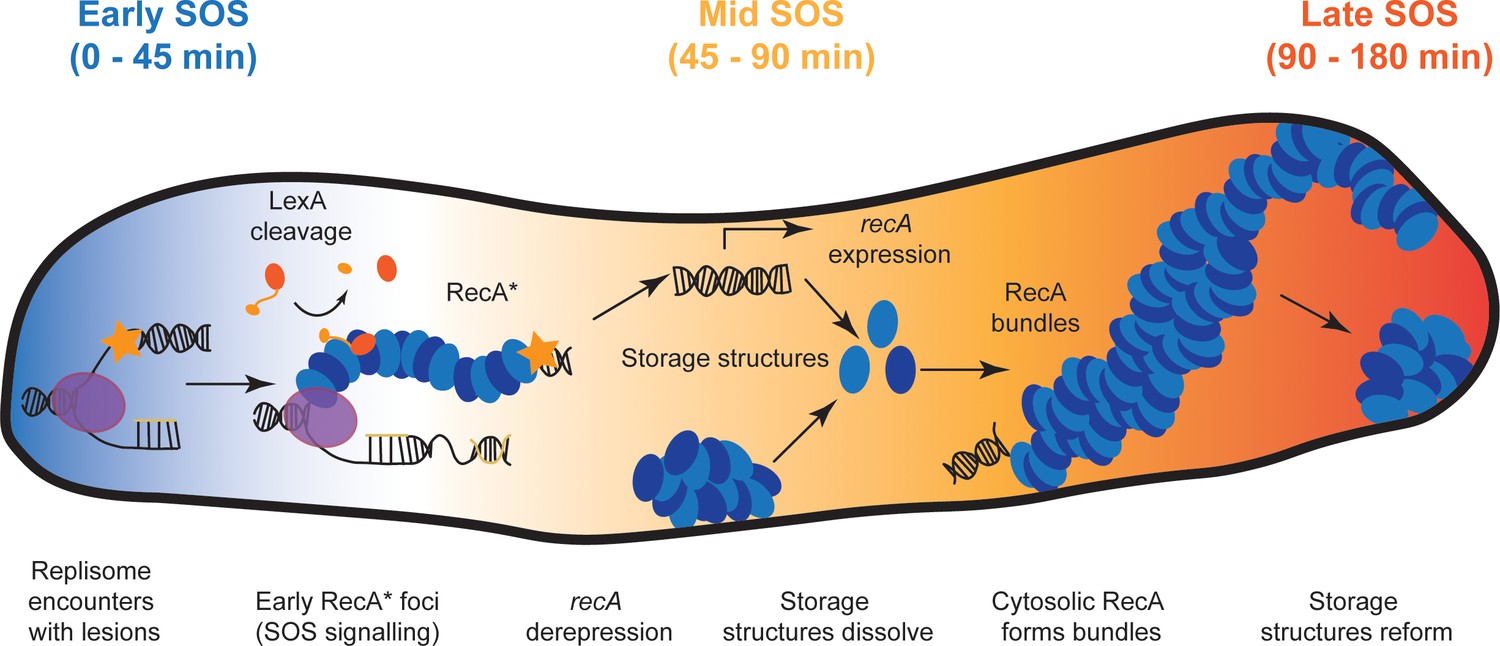
Model for organization of RecA complexes after DNA damage.
The SOS response in E. coli is composed of three stages. Detection of UV damage leads to formation of ssDNA-RecA filaments at sites of replisomes triggering the early stages of the SOS response. In this stage, ssDNA-RecA (RecA*) filaments catalyze auto-proteolysis of LexA to induce SOS and deregulate expression of the SOS inducible genes, including recA. Cells stop dividing and instead begin to filament. Storage structures of RecA dissolve in response to DNA damage to make RecA available for repair and recombination in the middle stage of the SOS response (45–90 min). RecA forms membrane-associated bundles starting in mid SOS. These bundles mature in middle-late stages of the SOS response. Finally, these are disassembled, RecA storage structures are reformed and cells division resumes in the late stages of the SOS response.
Additional files
-
Supplementary file 1
Supplemental Tables.
Supplemental Table 1: Description of plasmids used in this study. Supplemental Table 2: List of strains used in this study. Supplemental Table 3: List and sequences of primers used in this study. Supplemental Table 4: Sequences of plasmids used in this study. Supplemental Table 5: Sequences of inserts used for cloning.
- https://doi.org/10.7554/eLife.42761.021
-
Source code 1
Custom Matlab code and Fiji scripts used for analysis of cell fluorescence in Figures 1 and 3, and custom Matlab code and Fiji scripts used for co-localization analysis presented in Figure 4.
- https://doi.org/10.7554/eLife.42761.022
-
Transparent reporting form
- https://doi.org/10.7554/eLife.42761.023
Download links
A two-part list of links to download the article, or parts of the article, in various formats.
Downloads (link to download the article as PDF)
Open citations (links to open the citations from this article in various online reference manager services)
Cite this article (links to download the citations from this article in formats compatible with various reference manager tools)
Spatial and temporal organization of RecA in the Escherichia coli DNA-damage response
eLife 8:e42761.
https://doi.org/10.7554/eLife.42761


