Shank3 modulates sleep and expression of circadian transcription factors
- Washington State University, United States
- Consiglio Nazionale della Ricerche, Italy
- University of Fusciano, Italy
- University of Padova, Italy
- Weill Cornell Medicine, United States
Figures
Figure 1
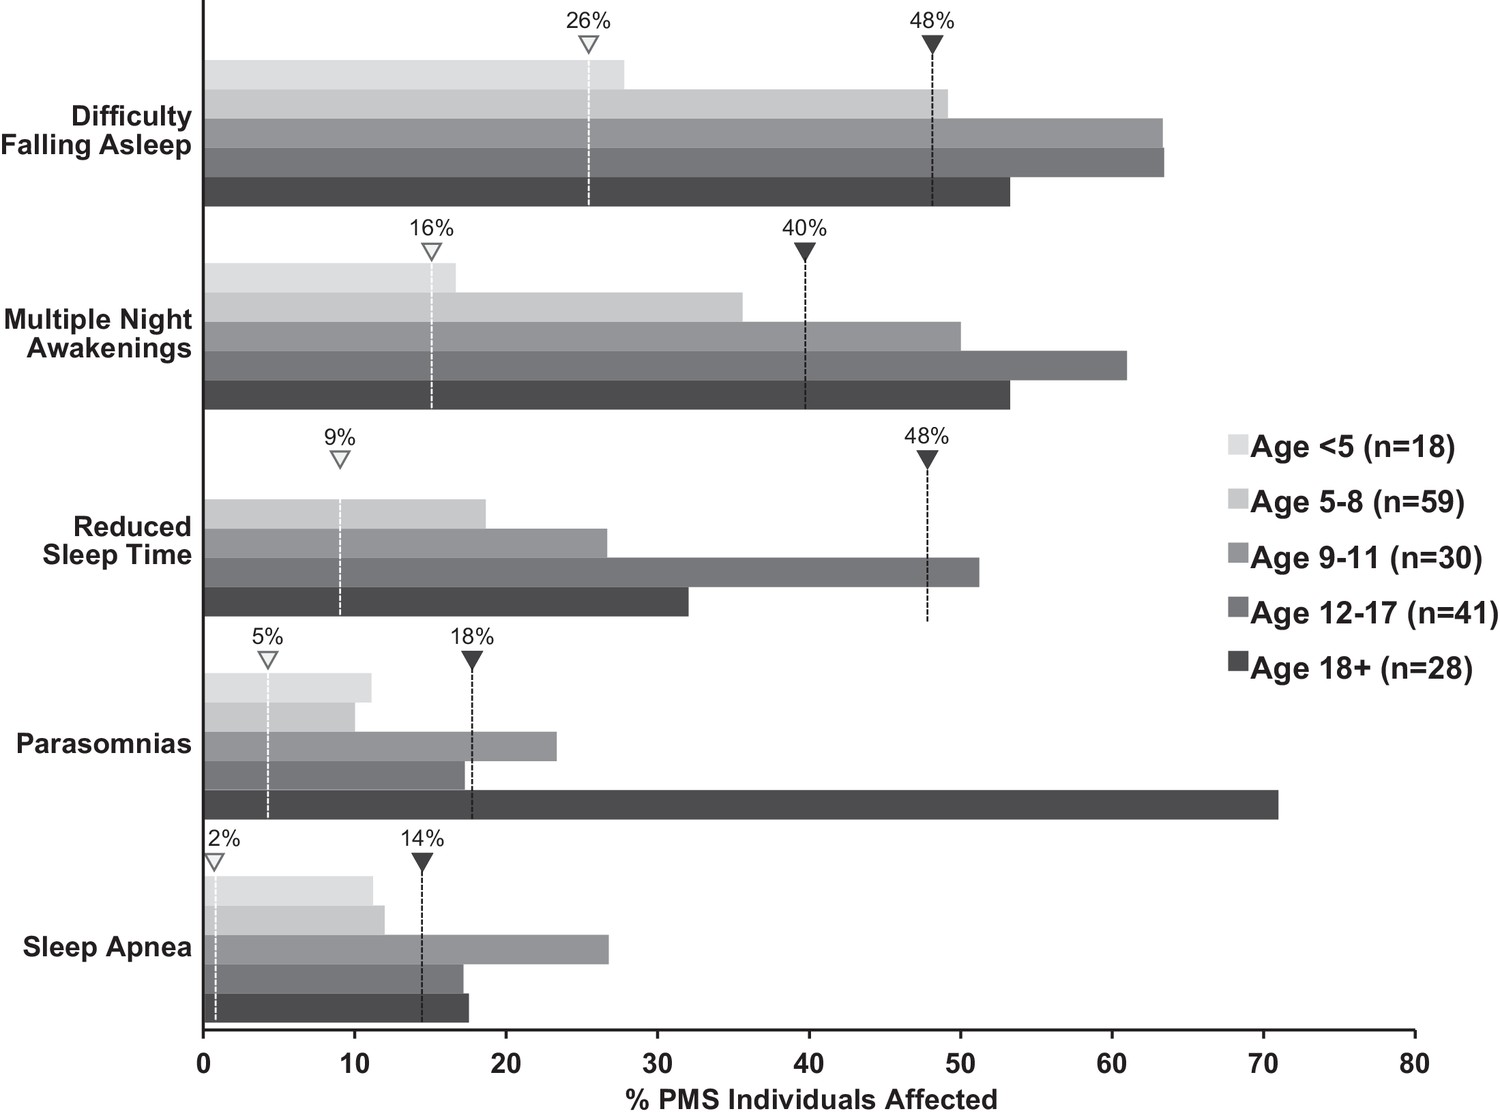
Increased incidence of sleep problems reported in individuals with Phelan-McDermid syndrome (PMS) compared to typically developing (TD) individuals.
Dashed line indicates median incidence observed in TD (white marker) and ASD (black marker) populations (values from Figure 1—source data 1).
-
Figure 1—source data 1
Incidence of sleep problems in Autism Spectrum Disorder (ASD) compared to typically developing (TD) individuals.
Survey of the literature, regardless of age. Median, first and third quartile values, age range, and included references reported for each phenotype.
- https://doi.org/10.7554/eLife.42819.004
Figure 2 with 1 supplement

Shank3∆C mice sleep less during the dark period and show altered EEG spectral power under baseline conditions.
The rows represent the vigilance states of wakefulness (top), NREM sleep (middle), and REM sleep (bottom). (A) Time spent in wakefulness and sleep shown as percentage of recording time per hour. Values are means ± SEM. Repeated measures ANOVA with posthoc pairwise comparisons using Sidak correction; *p<0.05, difference from wild type. (B) EEG spectral power normalized as a percentage of the total state-specific EEG power for the light period (left) and dark period (right) fit to smooth curves (solid lines) and expressed with 95% confidence intervals (gray and red shading). Non-overlap of the 95% confidence interval denotes statistically significant differences. The open bars on the x-axis denote the light period and the filled bars denote the dark period of the light:dark cycle. Wild type (n = 10) and Shank3∆C (n = 10) mice.
-
Figure 2—source data 1
Source data and summary statistics used for generating plots for Figure 2.
- https://doi.org/10.7554/eLife.42819.007
-
Figure 2—source data 2
Statistical results for Figure 2 and Figure 2—figure supplement 1. numDF, numerator degrees of freedom. denDF, denominator degrees of freedom.
- https://doi.org/10.7554/eLife.42819.008
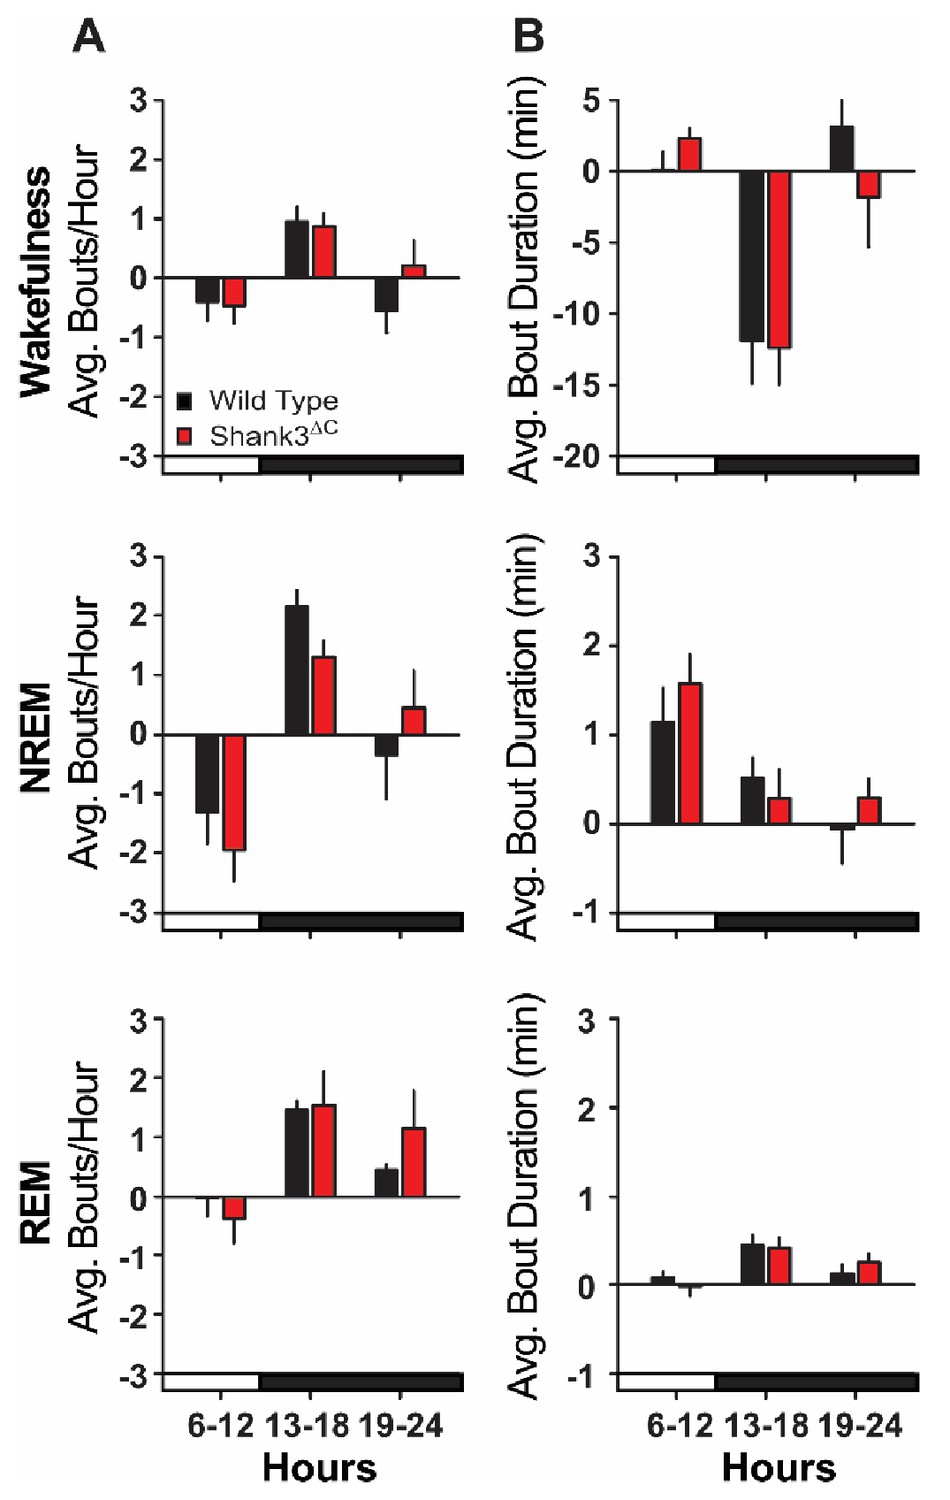
Figure 2—figure supplement 1
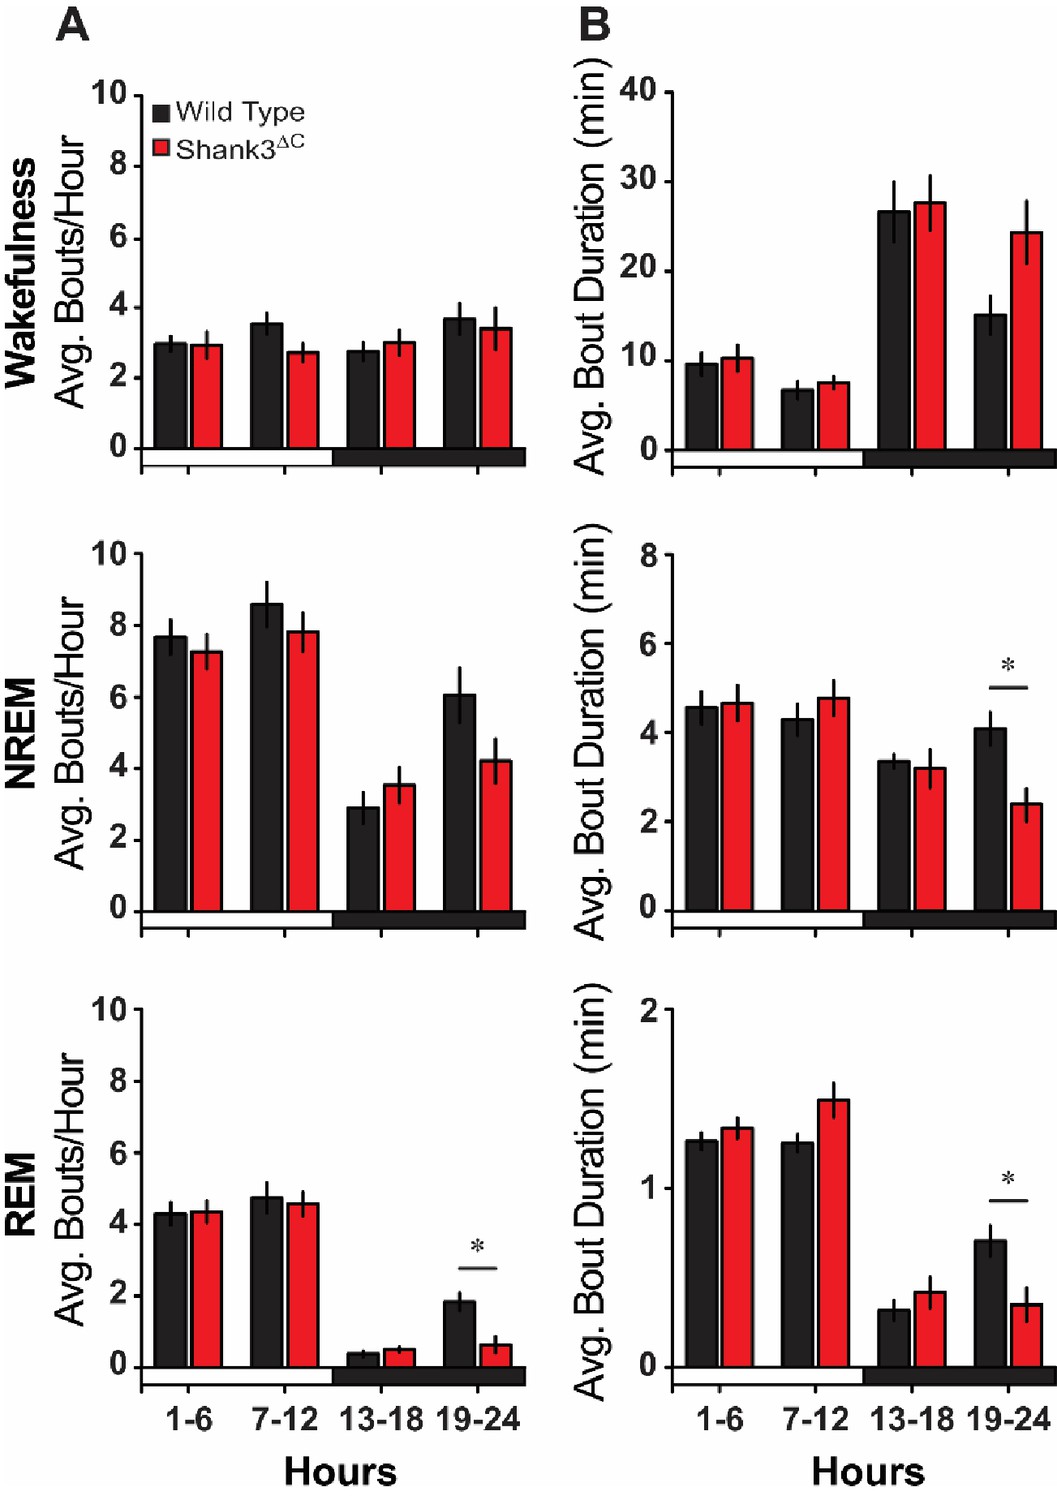
Baseline sleep bout analysis.
(A) Average number of state-specific bouts per hour shown in 6 hr blocks. (B) Average bout duration (min) per hour shown in 6 hr blocks. Repeated measures ANOVA with posthoc pairwise comparisons using Sidak correction. Values are means ± SEM for wild type (n = 10) and Shank3∆C (n = 10) mice. *p<0.05, difference from wild type.
Figure 3 with 2 supplements
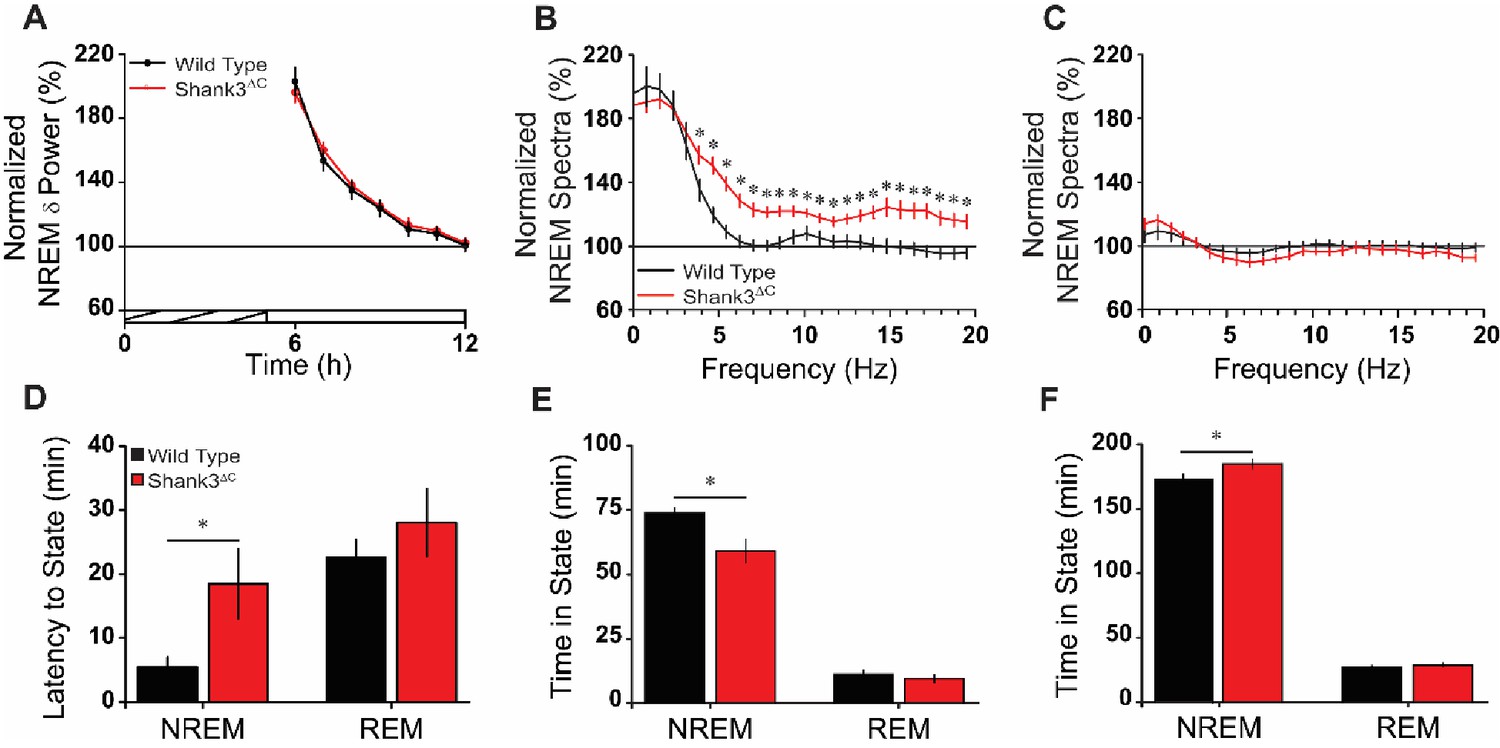
Shank3∆C mice take longer to fall asleep and sleep less after sleep deprivation.
(A) Normalized NREM delta (δ; 0.5–4 Hz) power during recovery sleep post-sleep deprivation. The cross-hatched bar on the x-axis denotes the 5 hr sleep deprivation period and the open bar denotes the remaining light period. Repeated measures ANOVA. (B) Normalized NREM spectra for the first 2 hr post-sleep deprivation (hours 6–7; significant from 3.9 to 19.5 Hz). One-way ANOVA with posthoc unpaired t-tests using Benjamini-Hochberg correction. (C) Normalized NREM spectra for the last 2 hr of the light period post-sleep deprivation (hours 11–12). One-way ANOVA. (D) Latency to enter NREM sleep and REM sleep after sleep deprivation. Unpaired t-test. (E) Time in NREM sleep and REM sleep for the first 2 hr post-sleep deprivation (hours 6–7). Unpaired t-test. (F) Time in NREM sleep and REM sleep for the remaining 5 hr of light period post-sleep deprivation (hours 8–12). Unpaired t-test. Values are means ± SEM for wild type (n = 10; black) and Shank3∆C (n = 10; red) mice. *p<0.05, difference from wild type.
-
Figure 3—source data 1
Source data and summary statistics used for generating plots for Figure 3.
- https://doi.org/10.7554/eLife.42819.013
-
Figure 3—source data 2
Statistical results for Figure 3, Figure 3—figure supplement 1, and Figure 3—figure supplement 2.
numDF, numerator degrees of freedom. denDF, denominator degrees of freedom.
- https://doi.org/10.7554/eLife.42819.014
Figure 3—figure supplement 1
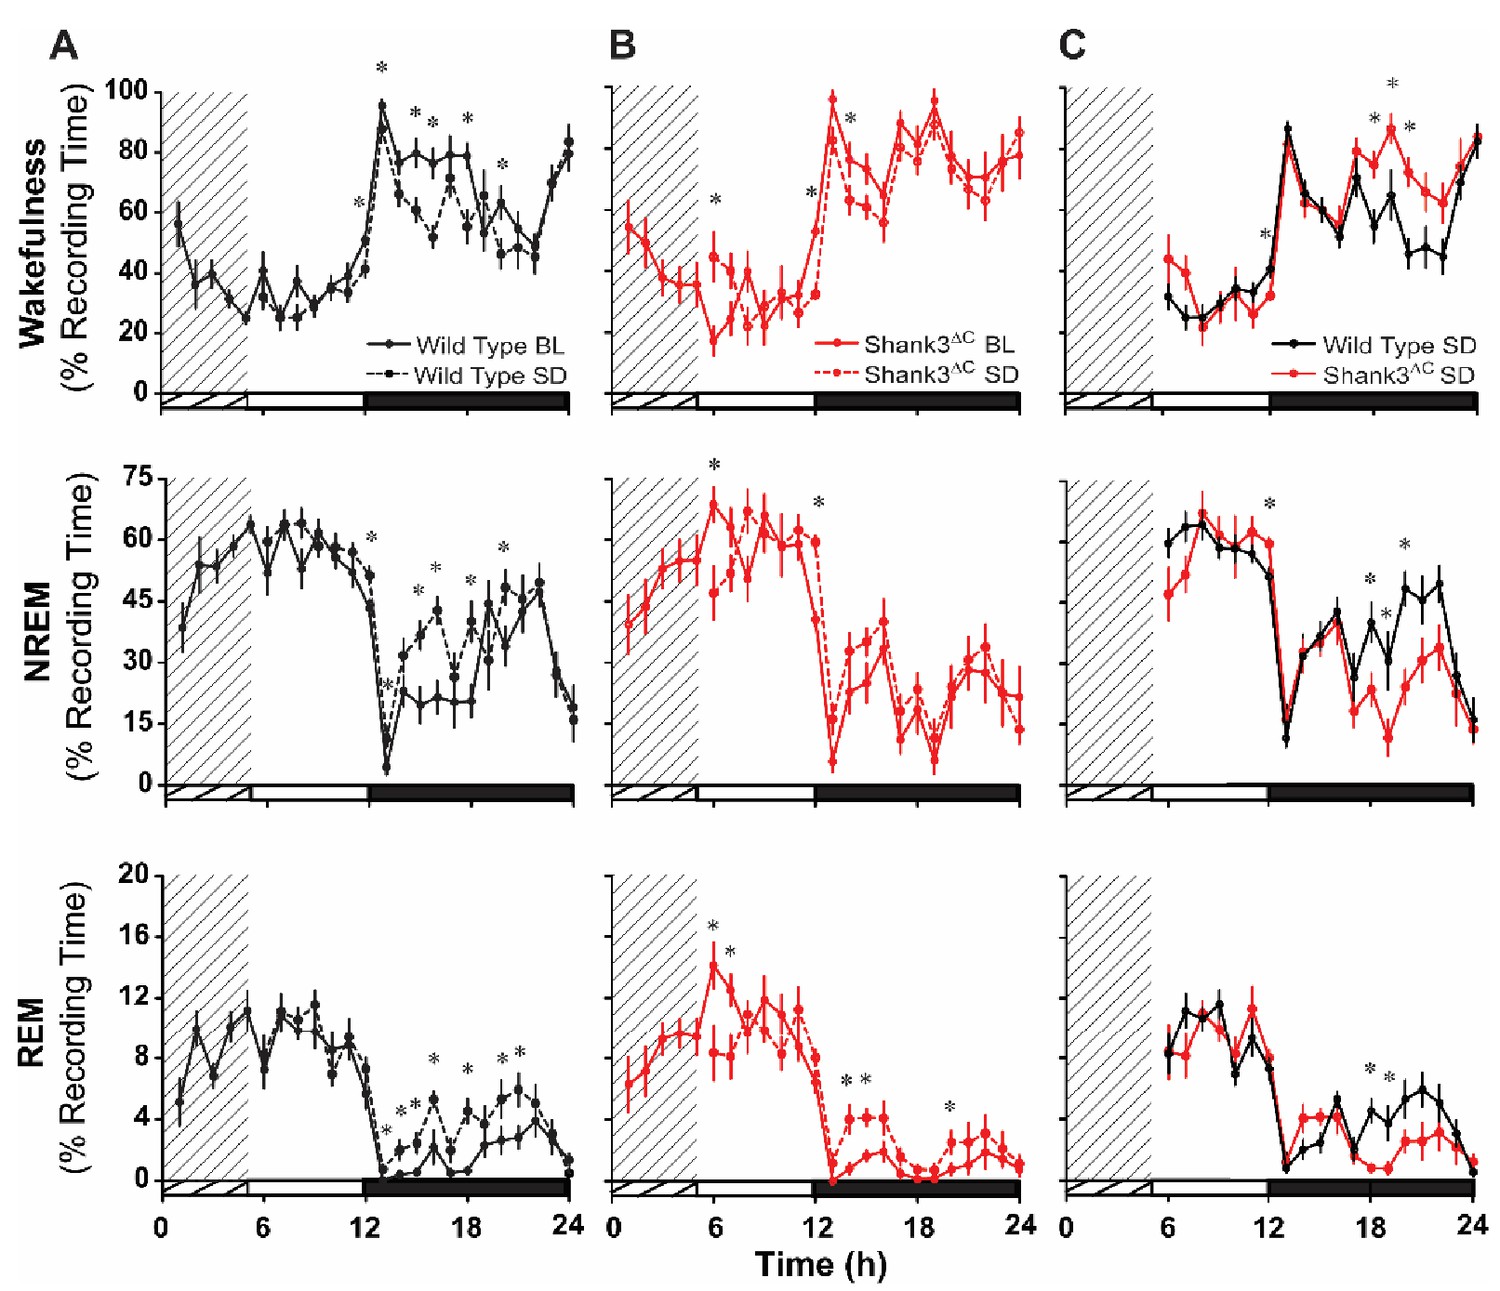
Shank3∆C mice sleep less than wild type type after sleep deprivation.
The rows represent the vigilance states of wakefulness (top), NREM sleep (middle), and REM sleep (bottom). (A – B) Time in state shown as percentage of recording time per hour comparing baseline and sleep deprived conditions for wild type mice (A) and Shank3∆C mice (B). Repeated measures ANOVA with posthoc pairwise comparisons using Sidak correction; *p<0.05, difference from baseline. (C) Time in state shown as percentage of recording time per hour after sleep deprivation. Repeated measures ANOVA with posthoc pairwise comparisons using Sidak correction; *p<0.05, difference from wild type. The cross-hatching for hours 1–5 denotes the 5 hr sleep deprivation period, the open bars on the x-axis denote the light period, and the filled bars on the x-axis denote the dark period of the light:dark cycle. Values are means ± SEM for wild type (n = 10) and Shank3∆C (n = 10) mice.
Figure 3—figure supplement 2
Bout analysis after sleep deprivation.
(A) Average number of state-specific bouts per hour (difference scores) shown in 7 hr (remaining light period) and 6 hr blocks. (B) Average bout duration (min) per hour (difference scores) shown in 7 hr (remaining light period) and 6 hr blocks. Difference scores were calculated by subtracting baseline (BL) values from sleep deprivation (SD) values. Repeated measures ANOVA. Values are means ± SEM for wild type (n = 10) and Shank3∆C (n = 10) mice. Significance as p<0.05.
Figure 4 with 1 supplement
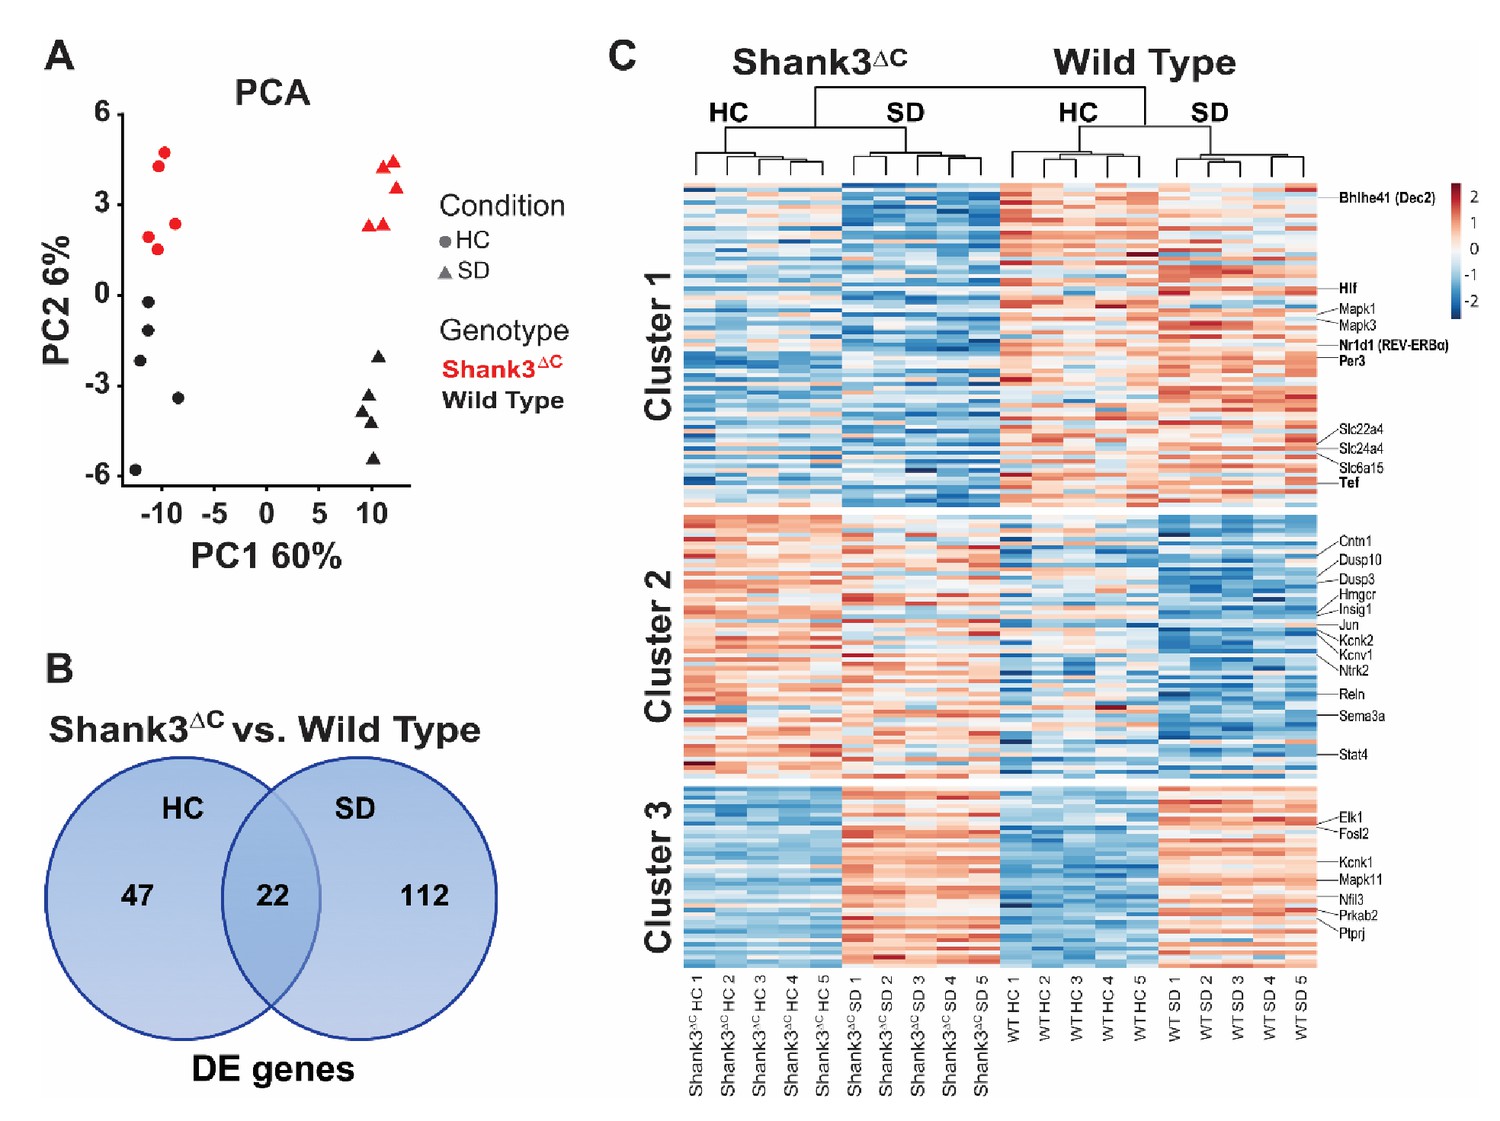
Sleep deprivation induces a two-fold difference in gene expression between Shank3ΔC and wild type mice.
RNA-seq study of gene expression from prefrontal cortex obtained from adult male Shank3ΔC and wild type mice either under control homecage conditions (HC) or following 5 hr of sleep deprivation (SD). N = 5 mice per group. (A) Principal component analysis of normalized RNA-seq data shows that sleep deprivation is the main source of variance in the data (first principal component, PC1) and genotype is the second (second principal component, PC2). Percent variance explained by each PC is shown on each axis. (B) Venn diagram showing the number of genes differentially expressed at FDR < 0.1 between Shank3ΔC and wild type mice in either control HC conditions or after SD. (C) Heat map of average scaled gene expression for all genes in (B). K-means clustering defined three clusters based on differences in gene expression across all comparisons. Genes belonging to the MAPK pathway and involved in circadian rhythms (see Table 2) are highlighted on the right.
-
Figure 4—source data 1
Genes differentially expressed between Shank3∆C vs. wild type mice.
RNA-seq study of gene expression from prefrontal cortex tissue obtained from adult male Shank3ΔC and wild type (WT) mice, either under control homecage conditions (HC) or following 5 hr of sleep deprivation (SD). N = 5 mice per group. False discovery rate (FDR) < 0.1.
- https://doi.org/10.7554/eLife.42819.017
Figure 4—figure supplement 1
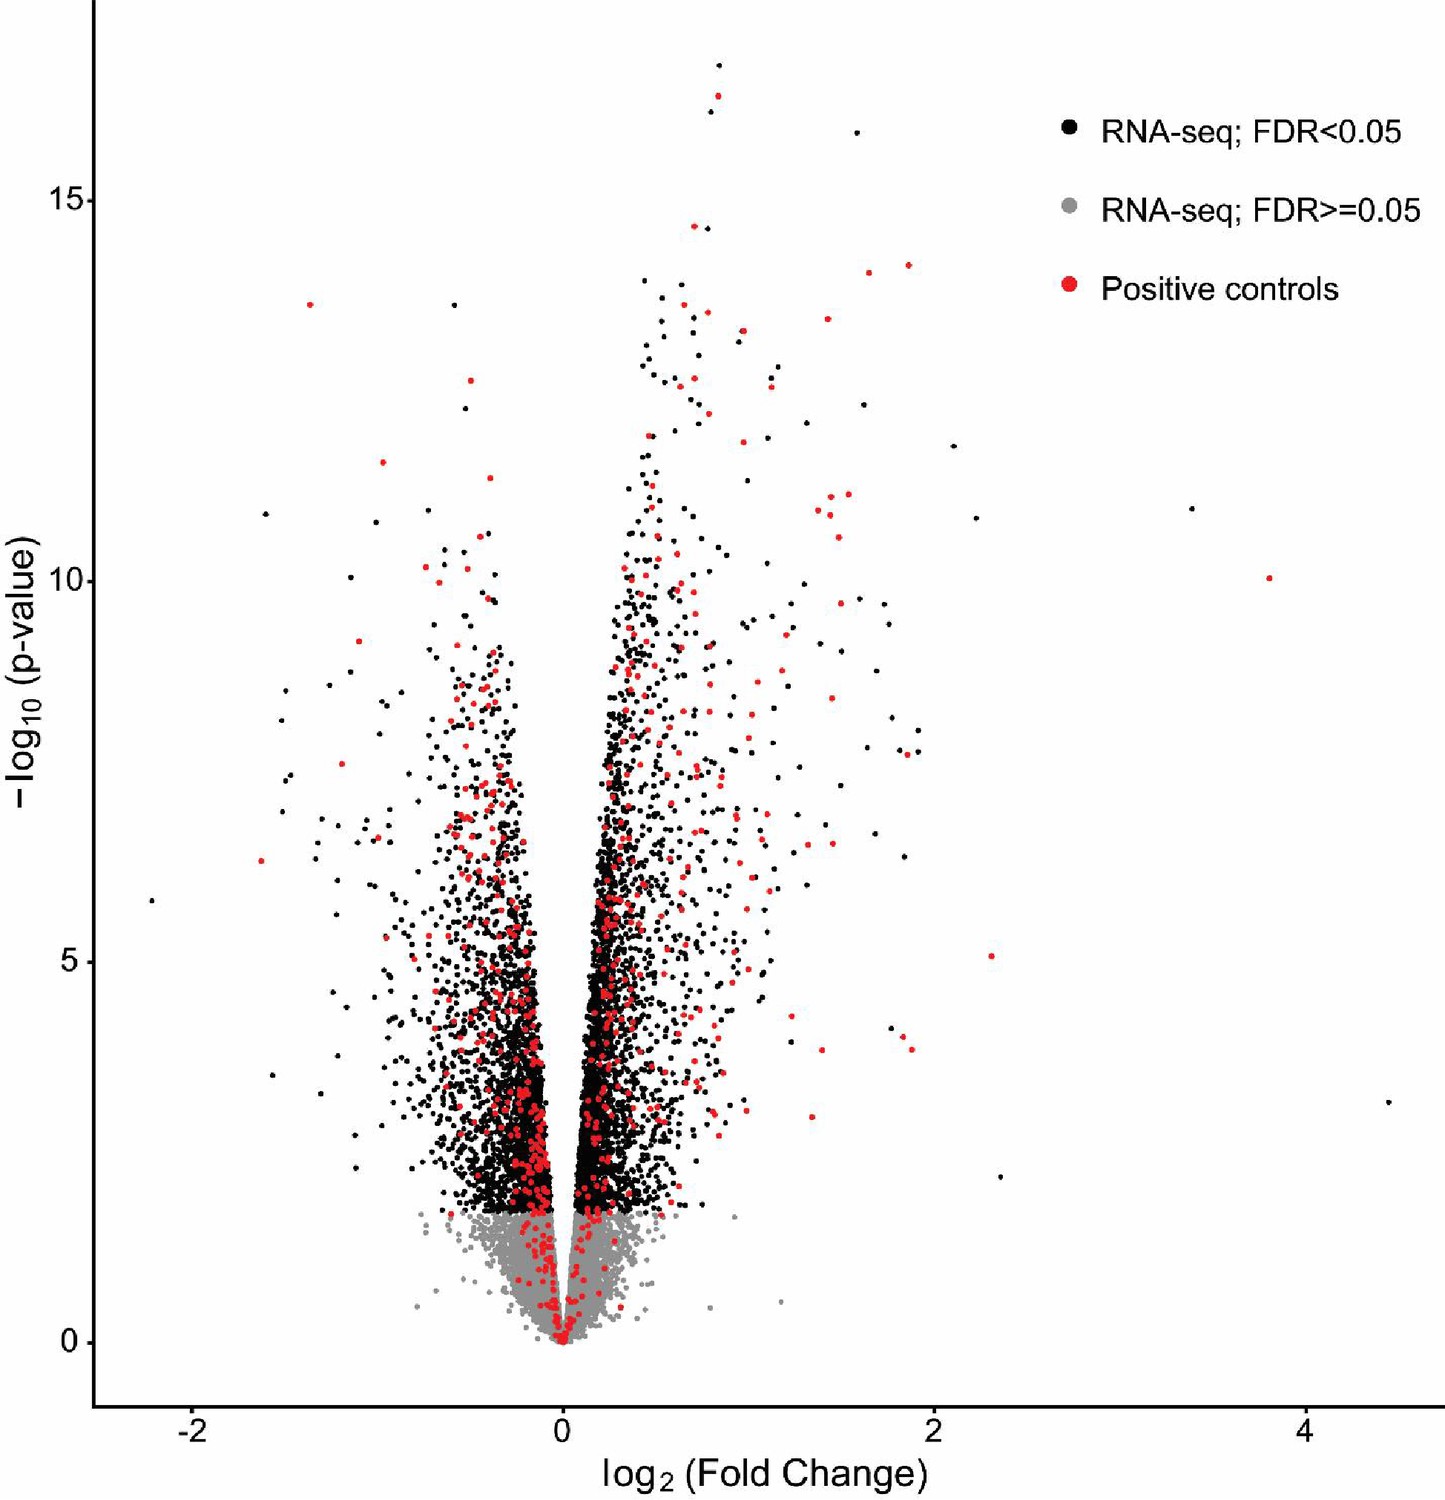
Recovery of positive control genes regulated by sleep deprivation.
Volcano plot of differential expression (−log10 P-value versus log2 fold change) caused by sleep deprivation in wild type animals (HC5 vs SD5). Genes with an FDR < 0.05 are highlighted in black. Positive controls (obtained from Gerstner et al., 2016) as described in the Materials and methods) are highlighted in red. Our RNA-seq analysis is able to detect 78% (454) of the 579 positive control genes obtained by microarrays as differentially expressed at FDR < 0.05.
Figure 5 with 1 supplement
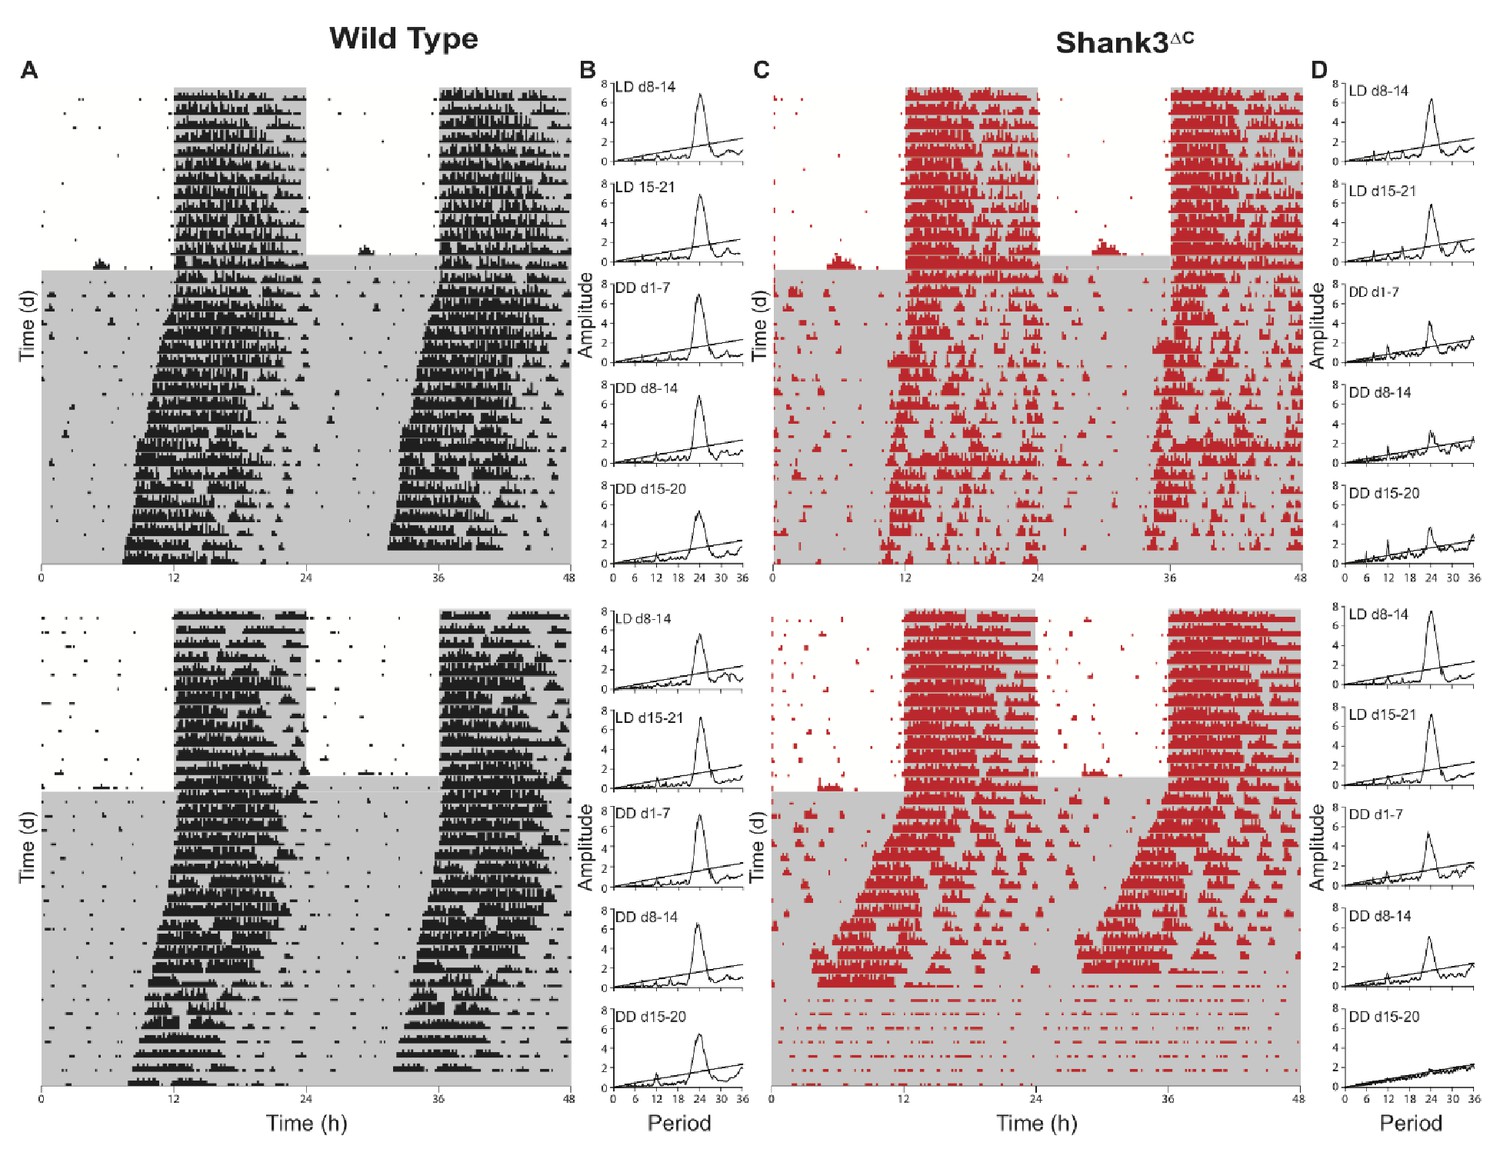
Shank3∆C mice show disruption of running wheel activity in constant darkness.
Representative actograms and periodograms for two wild type and two Shank3∆C mice. Mice were entrained to a 12:12 hr light:dark cycle (LD, 559 ± 4 : 0 ± 0 lux) for two weeks prior to 3 weeks constant darkness (DD, 0 ± 0 lux). Gray shading is representative of the dark period. (A) Actograms for two wild type mice. (B) Corresponding periodograms for wild type mice. (C) Actograms for two Shank3∆C mice. (D) Corresponding periodograms for Shank3∆C mice.
Figure 5—figure supplement 1
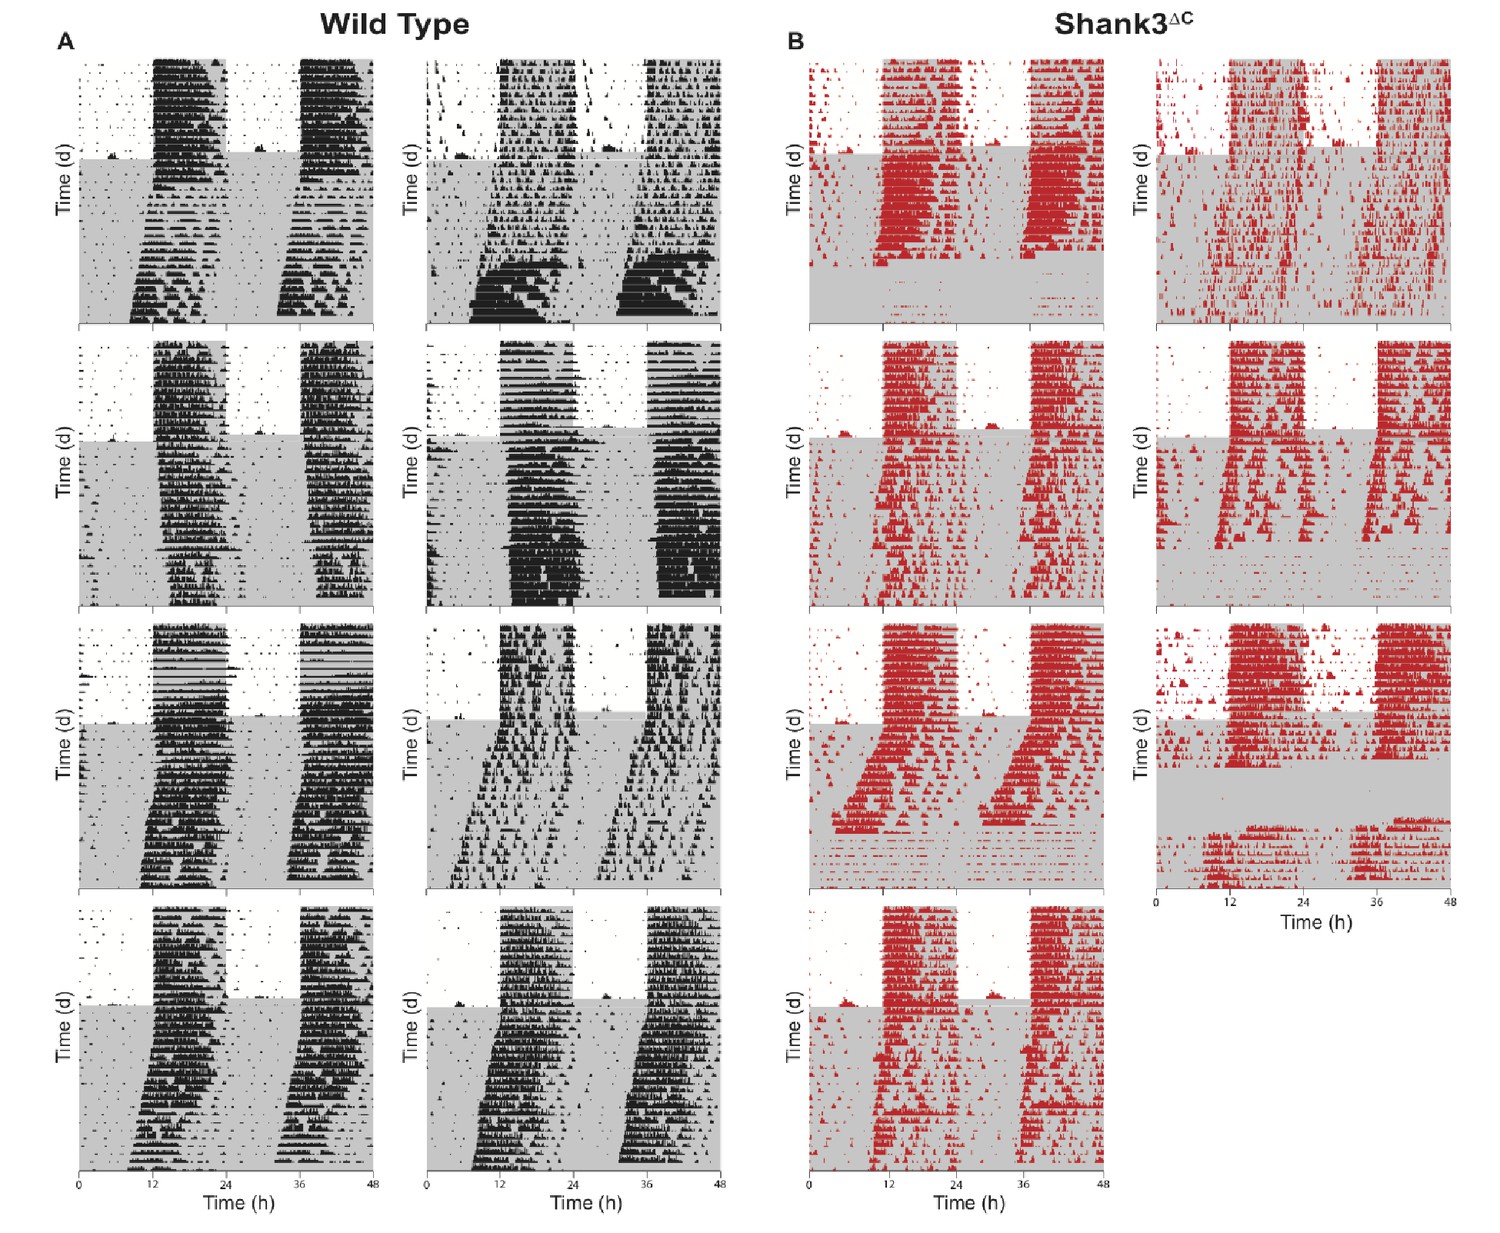
Actograms for all wild type and Shank3∆C mice.
Mice were entrained to a 12:12 hr light:dark cycle (LD, 559 ± 4 : 0 ± 0 lux) for two weeks prior to 3 weeks constant darkness (DD, 0 ± 0 lux). Gray shading is representative of the dark period. (A) Actograms for wild type mice (n = 8). (B) Actograms for Shank3∆C mice (n = 7).
Tables
Table 1
Shank3ΔC mice sleep less than wild type mice during the dark period.
Repeated measures ANOVA with posthoc pairwise comparisons using Sidak correction. Values are means ± SEM for wild type (n = 10) and Shank3ΔC (n = 10). *p<0.05, difference from wild type.
| Total Sleep Time (%) | Wild Type | Shank3ΔC | p-value |
|---|---|---|---|
| Light Period | 62.90 ± 1.57 | 62.96 ± 1.65 | 0.980 |
| Dark Period | 28.72 ± 2.41 | 21.16 ± 2.54 | 0.045* |
Table 2
Results of functional bioinformatics analysis of the genes differentially expressed between Shank3ΔCmice relative to wild type mice.
Functional annotation and clustering analysis was performed using DAVID (https://david.ncifcrf.gov) and functional information was obtained from the following databases: GO (Biological process and Molecular function), KEGG pathways, and Uniprot keywords. Enrichment was performed relative to all transcripts expressed in the mouse prefrontal cortex as defined by our RNA-seq data. Enriched functional terms were clustered at low stringency, to obtain clusters with enrichment score >1.2 (corresponding to an average p-value>0.05). See Table 2—source data 1 for details.
| Shank3ΔC vs. Wild Type | |
|---|---|
| Homecage | Sleep Deprivation |
| Up-regulated | Up-regulated |
| Cholesterol Metabolism: Hmgcr, Insig1 | Potassium Ion Transport: Kcnv1, Kcnk1, Kcnk2 |
| Transcription: Jun, Fosl2, Nfil3, Stat4 | Dephosphorylation: Dusp10, Dusp3, Ptprj |
| Neuron Projection Development: Cntn1, Ntrk2, Reln, Sema3a | |
| Down-regulated | Down-regulated |
| MAPK Signaling: Mapk3 (ERK1), Elk1 | GnRH Signaling: Mapk1 (ERK2), Elk1, Mapk11 (p38) |
| Circadian Rhythms: Per3, Tef, Hlf | Circadian Rhythms: Per3, Nr1d1 (REV-ERBα), Tef, Hlf, Prkab2 (AMPK), Bhlhe41 (DEC2) |
| Transcription: Tef, Hlf | Sodium Ion Transport: Slc6a15, Slc22a4, Slc24a4 |
-
Table 2—source data 1
Functional annotation clustering analysis of genes in Figure 4—source data 1.
- https://doi.org/10.7554/eLife.42819.019
Table 3
Shank3∆C mice show reduced wheel-running activity during constant darkness.
Summary of wheel-running behavior measured for each week of 12:12 hr light dark cycle (LD, 559 ± 4 : 0 ± 0 lux) or constant darkness (DD, 0 ± 0 lux) for both wild type and Shank3∆C mice. A linear mixed-effects model was used to estimate the contributions of genotype and the interaction between genotype and time for period, alpha, and wheel running activity for LD week three through DD week 3. There is a significant interaction effect for genotype x time for activity (p < 0.0001; indicated by *) but no significant effect for genotype x time for period (p = 0.15) or genotype x time for alpha (p = 0.88). See Table 3—source data 1 for details. Values are means ± SEM for wild type (n = 8) and Shank3∆C (n = 7) mice. Significance at p < 0.05.
| Wild Type | Shank3∆C | ||
|---|---|---|---|
| Period (h) | |||
| LD Week 2 | 24.0 ± 0.0 | 24.0 ± 0.0 | |
| LD Week 3 | 24.0 ± 0.0 | 23.9 ± 0.1 | |
| DD Week 1 | 23.9 ± 0.1 | 23.7 ± 0.1 | |
| DD Week 2 | 23.7 ± 0.1 | 20.3 ± 3.4 | |
| DD Week 3 | 23.5 ± 0.2 | 25.8 ± 1.5 | |
| Alpha (h) | |||
| LD Week 2 | 10.0 ± 0.4 | 10.7 ± 0.4 | |
| LD Week 3 | 10.3 ± 0.4 | 10.7 ± 0.5 | |
| DD Week 1 | 10.5 ± 0.2 | 9.0 ± 0.4 | |
| DD Week 2 | 10.4 ± 0.4 | 8.2 ± 0.7 | |
| DD Week 3 | 9.0 ± 1.0 | 9.9 ± 1.0 | |
| Activity (rev/day)* | |||
| LD Week 2 | 33985.2 ± 565.9 | 23258.2 ± 861.2 | |
| LD Week 3 | 40306.7 ± 1257.1 | 25365.1 ± 964.0 | |
| DD Week 1 | 37942.6 ± 795.4 | 23027.7 ± 669.6 | |
| DD Week 2 | 38250.7 ± 431.1 | 16820.7 ± 1302.5 | |
| DD Week 3 | 38586.3 ± 231.1 | 6961.5 ± 383.9 |
-
Table 3—source data 1
Results of genotype x time interaction analysis for LD week three through DD week 3.
Linear mixed-effects ANOVA for LD week three through DD week 3. The model was fitted using genotype, time, and their interaction as fixed effects and the individual mice labeled as random effect. There is a significant effect of genotype x time for activity (p<0.0001) and no significant effect for genotype x time or genotype for period and alpha. Significance at p<0.05. numDF, numerator degrees of freedom. denDF, denominator degrees of freedom.
- https://doi.org/10.7554/eLife.42819.021
Key resources table
| Reagent type (species) or resource | Designation | Source or reference | Identifiers |
|---|---|---|---|
| Gene (Mus musculus) | Shank3; SH3 and multiple ankyrin repeat domains 3 | NA | ENTREZ_ID: 58234 |
| Gene (Mus musculus) | Per3; period circadian clock 3 | NA | ENTREZ_ID: 18628 |
| Gene (Mus musculus) | Hlf; hepatic leukemia factor | NA | ENTREZ_ID: 217082 |
| Gene (Mus musculus) | Tef; thyrotroph embryonic factor | NA | ENTREZ_ID: 21685 |
| Gene (Mus musculus) | Nr1d1; nuclear receptor subfamily 1, group D, member 1; | NA | ENTREZ_ID: 217166 |
| Gene (Mus musculus) | Bhlhe41; basic helix-loop-helix family, member e41; | NA | ENTREZ_ID: 79362 |
| Strain, strain background (Mus musculus) | Shank3ΔC; Shank3tm1.1Pfw/J | Kouser et al., 2013; The Jackson Laboratory | RRID:IMSR_JAX:018398 |
| Commercial assay or kit | RNAeasy kit | Qiagen | 74104 |
| Commercial assay or kit | High Sensitivity RNA Analysis Kit | Advanced Analytical Technologies | DNF-472 |
| Commercial assay or kit | High Sensitivity NGS Fragment Analysis Kit | Advanced Analytical Technologies | DNF-474 |
| Commercial assay or kit | KAPA Library Quantification Kit | Kapabiosystems | KK4824 |
| Commercial assay or kit | TruSeq Stranded mRNA Library Prep Kit | Illumina | RS-122–2101 |
| Software, algorithm | HiSeq Control Software version (v. 2.2.68) | Illumina | 15073358 Rev A |
| Software, algorithm | bcl2fastq (v. 2.17.1.14) | R/Bioconductor | SCR_015058 |
| Software, algorithm | Rsubread (v. 1.26.1) | R/Bioconductor | SCR_016945 |
| Software, algorithm | NOISeq (v.2.22.1) | R/Bioconductor | SCR_003002 |
| Software, algorithm | RUVSeq (v. 1.12.0) | R/Bioconductor | SCR_006263 |
| Software, algorithm | edgeR (v. 3.20.9) | R/Bioconductor | SCR_012802 |
| Software, algorithm | R package nlme (v. 3.5.0) | CRAN | SCR_015655 |
| Software, algorithm | R package mgcf (v. 3.5.0) | CRAN | |
| Software, algorithm | R package pheatmap (v. 1.0.10) | CRAN | SCR_016418 |
| Software, algorithm | Database for annotation, visualization, and integrated discovery (v 6.7) | DAVID; https://david.ncifcrf.gov | |
| Software, algorithm | VitalRecorder | Kissei Comtec | 3, 0, 0, 0 |
| Software, algorithm | SleepSign for Animal | Kissei Comtec | 3, 0, 0, 812 |
| Software, algorithm | Wheel manager | Med Associates Inc | SOF-860 |
| Software, algorithm | ClockLab (v. 3.5.0) | Actimetrics | 6.0.50 |
Additional files
-
Source data 1
Results of genotype x time interaction analysis for 5 weeks of LD.
Linear mixed-effects ANOVA for LD week 1–5. The model was fitted using genotype, time, and their interaction as fixed effects and the individual mice labeled as random effect. There is a significant effect for genotype x time in activity (p<0.0001), a significant effect of genotype for period (p=0.047), and no significant effect for genotype x time or genotype for alpha. Significance at p<0.05. numDF, numerator degrees of freedom. denDF, denominator degrees of freedom.
- https://doi.org/10.7554/eLife.42819.024
-
Source code 1
Detailed report of statistical analysis including R code to reproduce the RNA-seq and circadian wheel running analysis.
- https://doi.org/10.7554/eLife.42819.025
-
Supplementary file 1
Wheel-running behavior in Shank3∆C mice across 5 weeks of continuous light:dark (LD) cycles.
Summary of wheel-running behavior measured for each week of 12:12 hr light:dark cycles for both wild type and Shank3∆C mice. A linear mixed-effects ANOVA was used to estimate the contributions of genotype and the interaction between genotype and time for period, alpha, and wheel-running activity for LD week 1 through 5. There is no significant interaction effect for genotype x time for period (p=0.41), but there is a significant effect of genotype (p=0.047, indicated by *). There is no significant interaction effect for genotype x time for alpha (p=0.43), but there is a significant effect of time (p=0.004, indicated by †). There is a significant interaction effect (indicated by vertical bar) for genotype x time for activity (p<0.0001). See Source data 1 for details. Values are means ± SEM for wild type (n = 8) and Shank3∆C (n = 8) mice.
- https://doi.org/10.7554/eLife.42819.026
-
Transparent reporting form
- https://doi.org/10.7554/eLife.42819.027
Download links
A two-part list of links to download the article, or parts of the article, in various formats.
Downloads (link to download the article as PDF)
Open citations (links to open the citations from this article in various online reference manager services)
Cite this article (links to download the citations from this article in formats compatible with various reference manager tools)
Shank3 modulates sleep and expression of circadian transcription factors
eLife 8:e42819.
https://doi.org/10.7554/eLife.42819


