Transitions in cell potency during early mouse development are driven by Notch
- Centro Nacional de Investigaciones Cardiovasculares Carlos III (CNIC), Spain
- Sloan Kettering Institute, United States
Figures
Figure 1 with 4 supplements
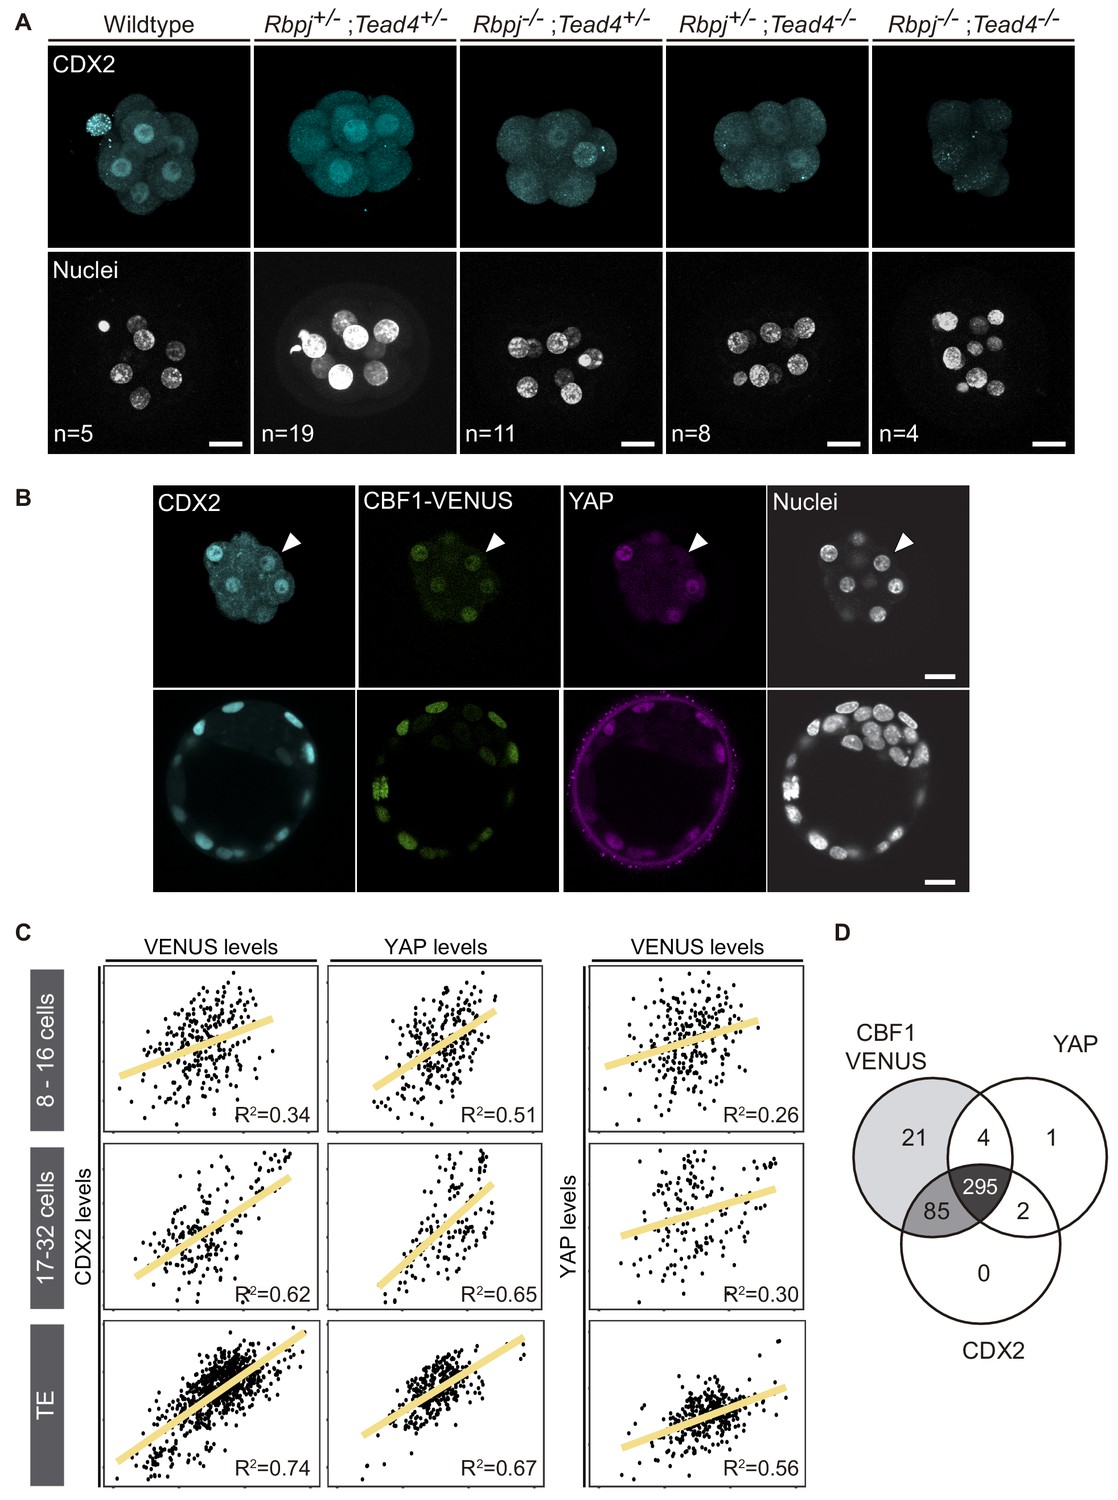
CDX2 expression depends on Notch and Hippo inputs.
(A) Maximal projections of confocal images after immunostaining for CDX2 in different combinations of wildtype and mutant alleles for Rbpj and Tead4 at E2.5. Nuclei were stained with DAPI. Number of embryos (n) is indicated. Scale bars, 20 μm. (B) Optical sections of confocal images after immunostaining for CDX2 and YAP in the CBF1-VENUS reporter line at morula (upper row) and blastocyst (lower row) stage. Fluorescent VENUS reporter is directly detected. Arrowheads indicate a cell positive for CDX2 and VENUS, but negative for nuclear YAP. Nuclei were stained with DAPI. Scale bars, 20 μm. (C) Pairwise correlations of single cell fluorescence intensity levels for CDX2, VENUS and YAP from embryos at early morula (8–16 cells, upper row), late morula (17–32 cells, middle row) and blastocyst (lower row) stage. n = 277 blastomeres from 21 embryos (8–16 cell morulae); n = 211 blastomeres from 12 embryos (17–32 cell morulae); n = 428 blastomeres from six embryos (blastocysts). Person correlation (R2) is indicated for each correlation. (D) Venn diagram showing number of positive cells for CBF1-VENUS, YAP and CDX2 at morula stage. n = 415 blastomeres from 28 morulae.
Figure 1—figure supplement 1
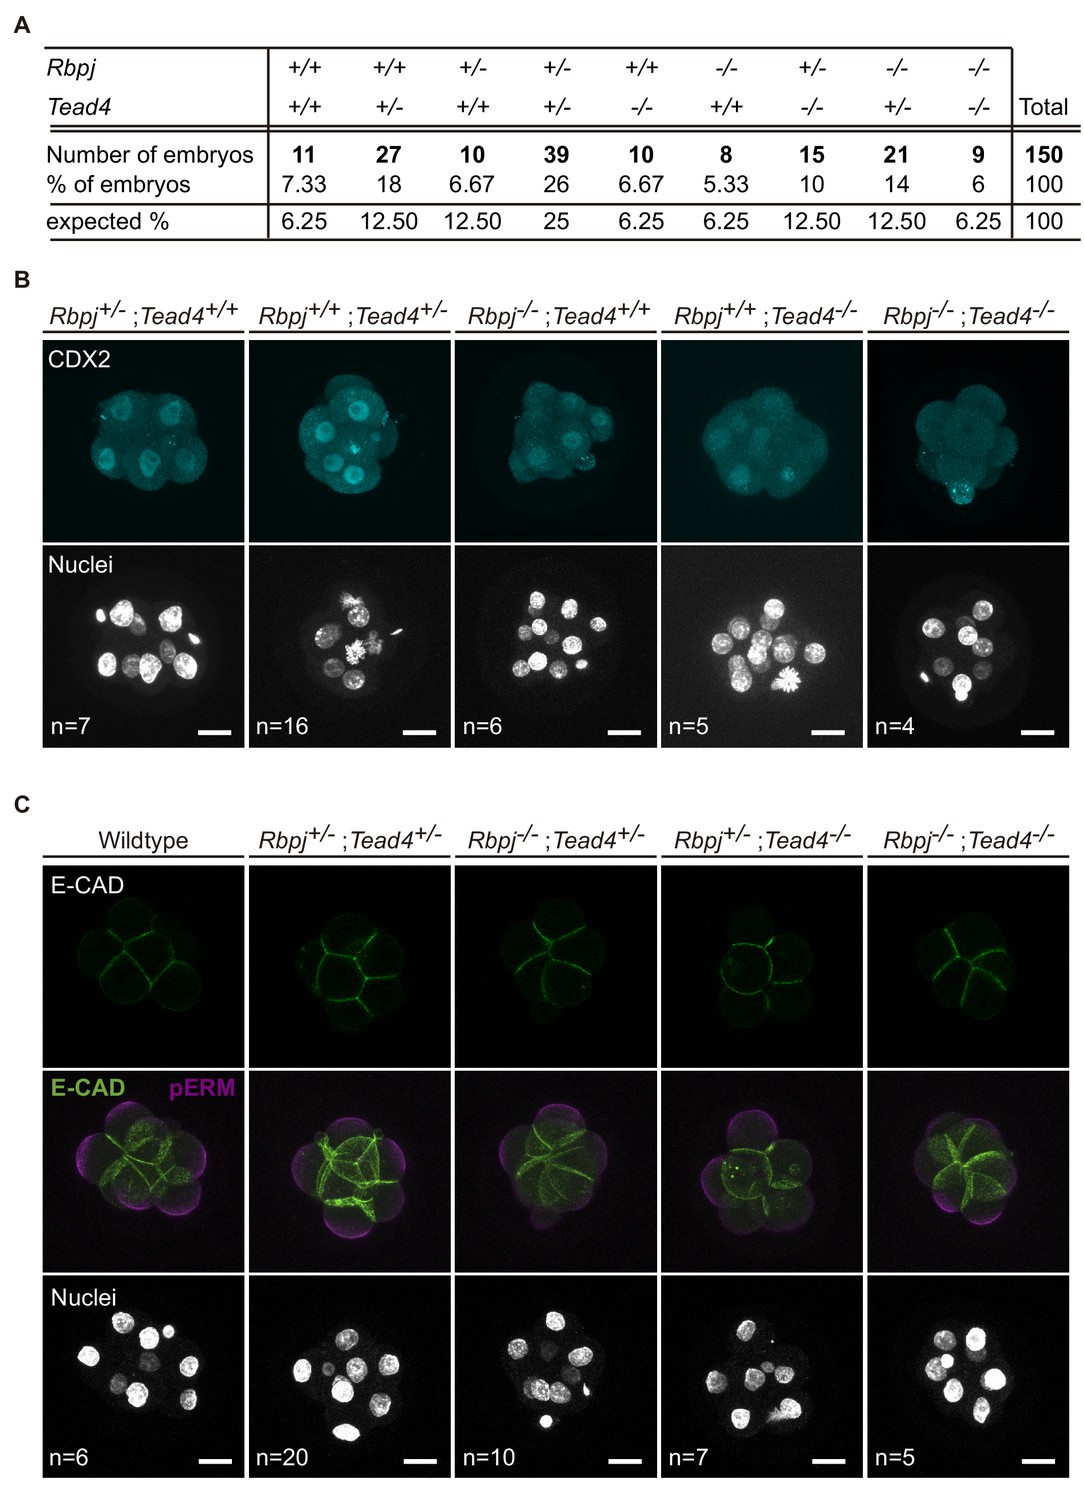
Lack of Rbpj and Tead4 does not affect compaction or polarization.
(A) Distribution (in %) of E2.5 embryos for the different allelic combinations of Rbpj and Tead4, compared with the expected distribution. (B) Maximal projections of confocal images after immunostaining for CDX2 in different combinations of wildtype and mutant alleles for Rbpj and Tead4 at E2.5. Nuclei were stained with DAPI. Number of embryos (n) is indicated. Scale bars, 20 μm. (C) Single confocal plane for E-cadherin immunostaining (top row), and maximal projections of confocal images after immunostaining for E-Cadherin and pERM (middle row) in different combinations of wildtype and mutant alleles for Rbpj and Tead4 at E2.5. Nuclei were stained with DAPI. Number of embryos (n) is indicated. Scale bars, 20 μm.
Figure 1—figure supplement 2
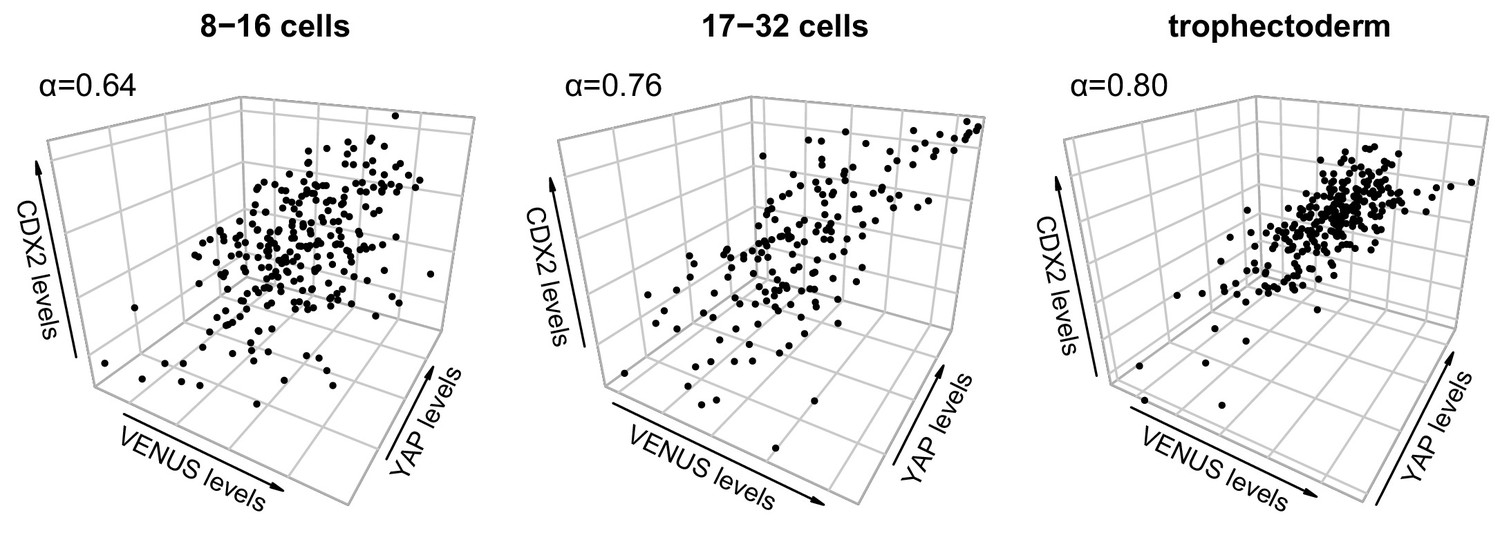
Combinatorial input from Notch and Hippo progressively accounts for CDX2 levels from morula to blastocyst.
Three-way correlations of single cell fluorescence intensity levels for CDX2, VENUS and YAP from embryos at early morula (8–16 cells, left), late morula (17–32 cells, middle) and blastocyst (right) stage. Cronbach Alpha (α) to measure internal consistency reliability among the three variables is indicated. n = 252 blastomeres from 19 embryos (8–16 cell morulae); n = 163 blastomeres from nine embryos (17–32 morulae); n = 264 blastomeres from six embryos (blastocysts).
Figure 1—figure supplement 3
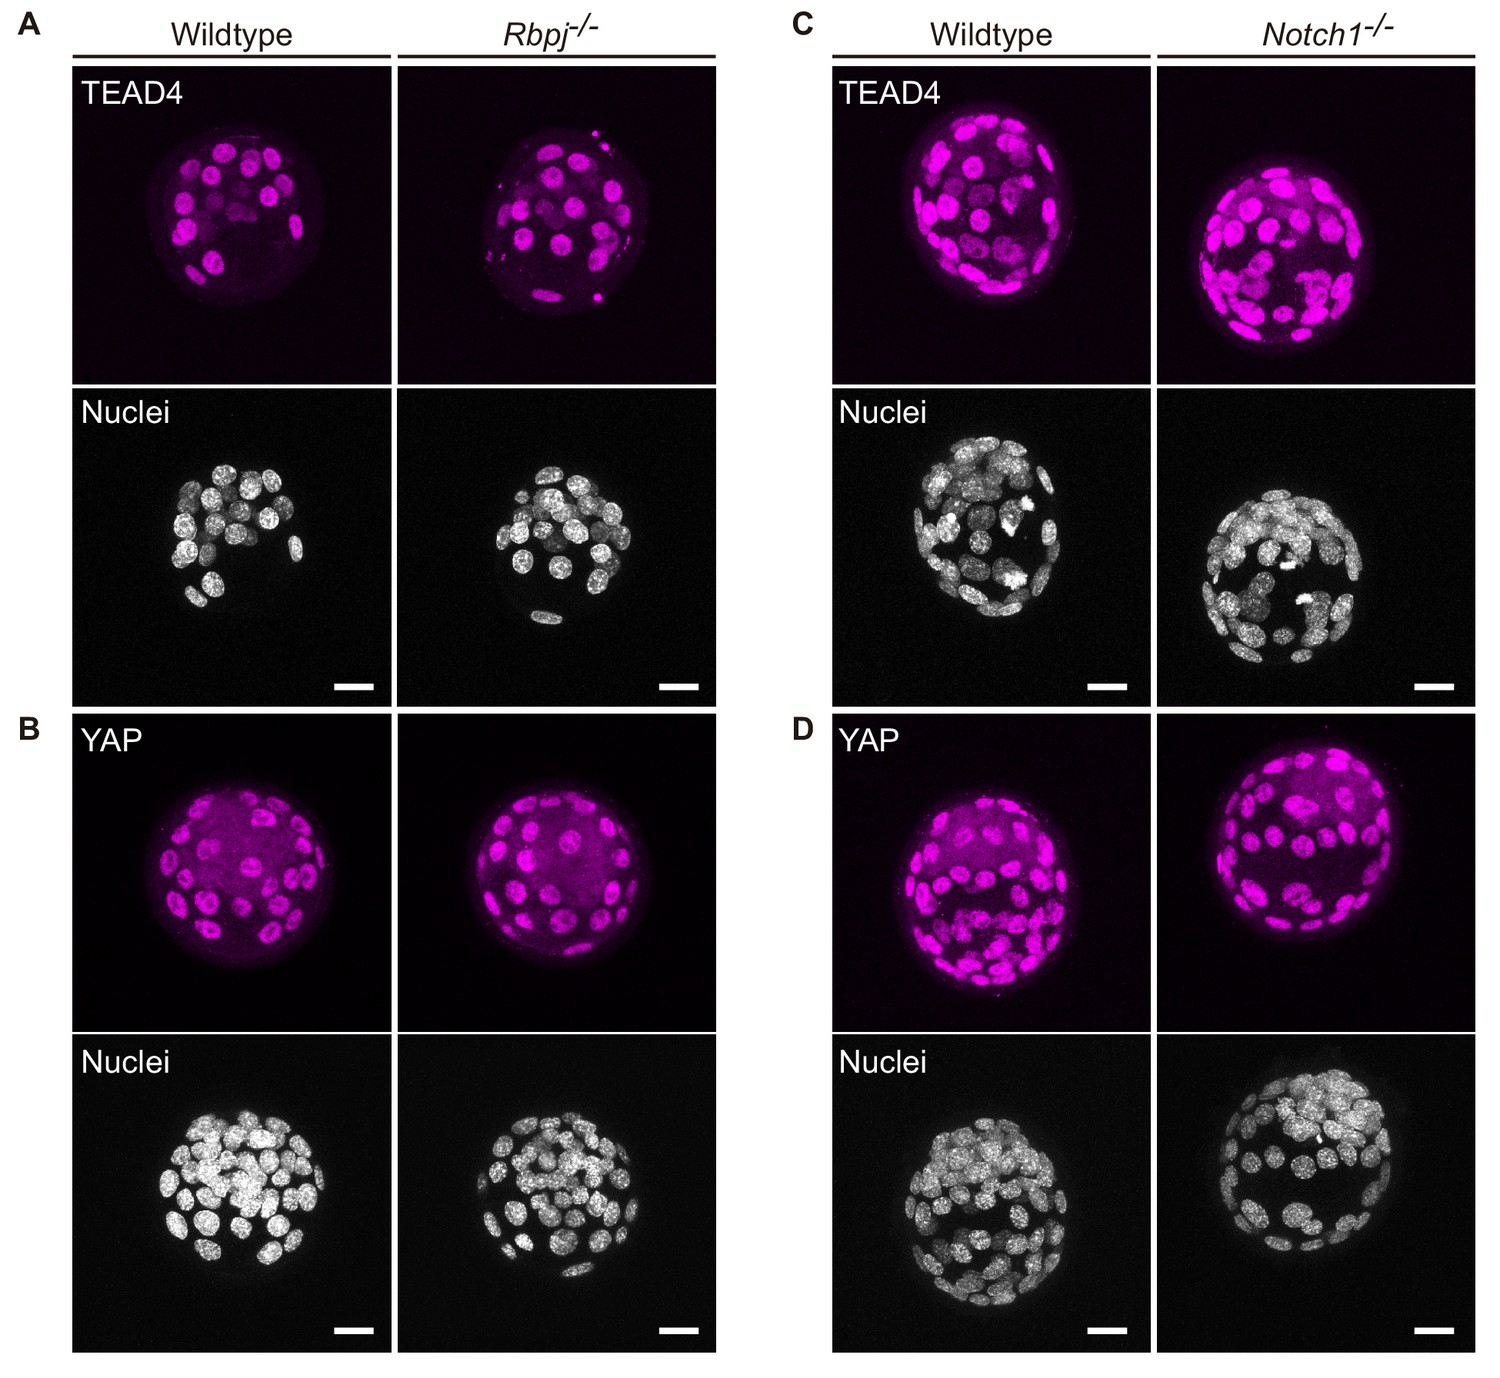
Hippo components are not affected in Notch loss of function mutant blastocysts.
(A–B) Maximal projections of confocal images after immunostaining for TEAD4 (A) or YAP (B) in wildtype (n = 7) and Rbpj-/- embryos (n = 4). (C–D) Maximal projections of confocal images after immunostaining for TEAD4 (C) or YAP (D) in wildtype (C, n = 7; D, n = 11) and Notch1-/- (C, n = 13; D, n = 7) embryos.
Figure 1—figure supplement 4
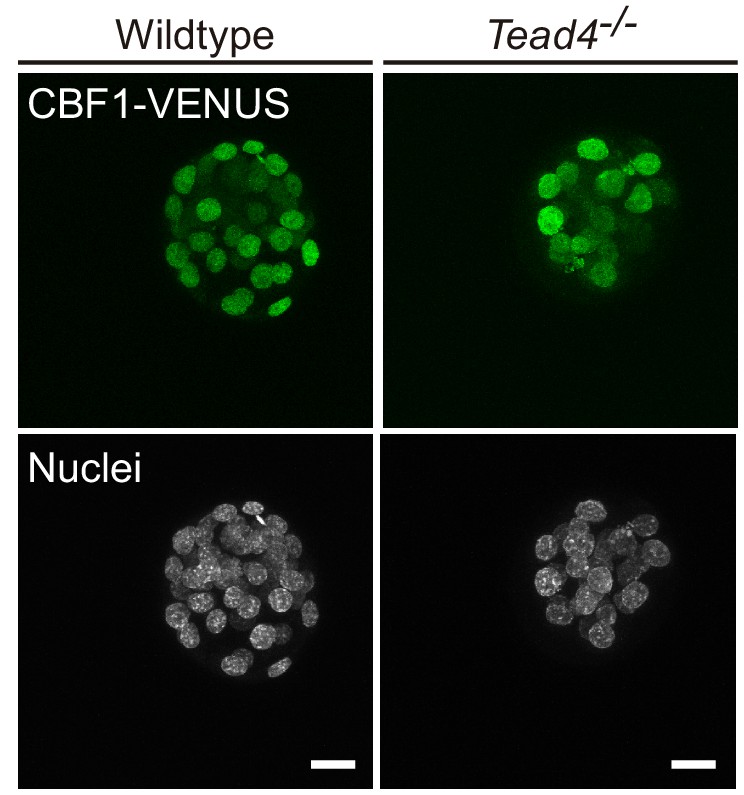
CBF1-VENUS expression is maintained in Tead4 mutants.
Maximal projections of confocal images of the CBF1-VENUS line in wildtype and Tead4-/- embryos (n = 7).
Figure 2 with 2 supplements
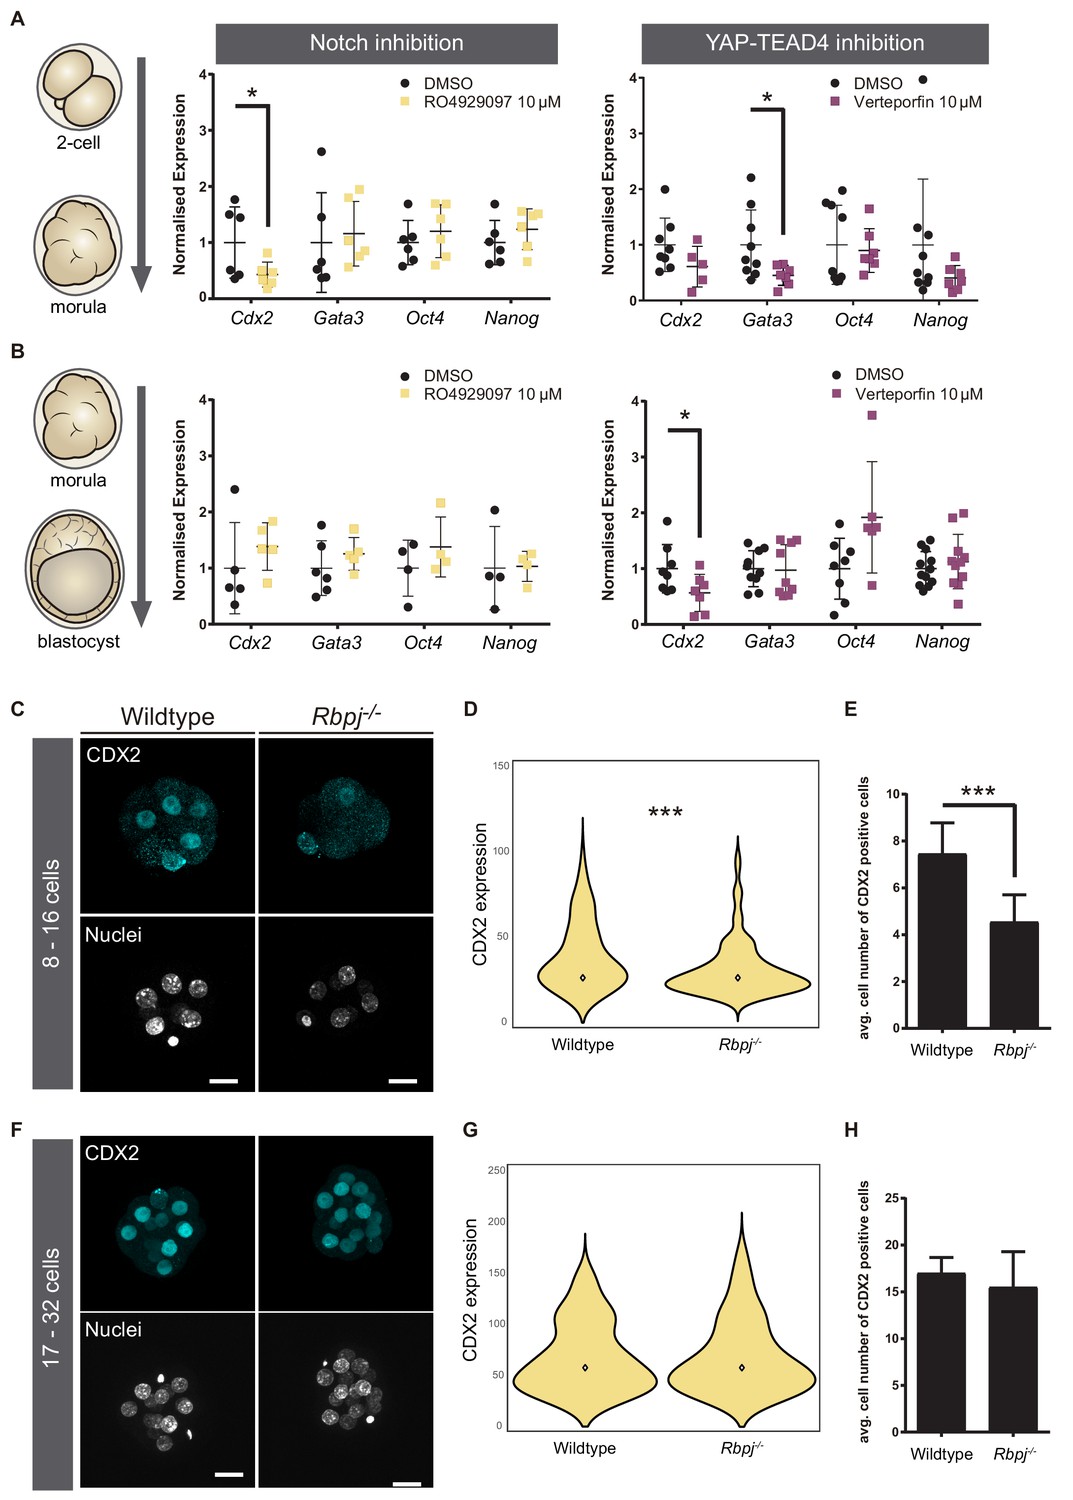
Notch regulates CDX2 in the early morula.
(A–B) Normalised expression of Cdx2, Gata3, Oct4 and Nanog in pools of 25 embryos treated with RO4929097 to inhibit Notch (left) or with Verteporfin to inhibit YAP/TEAD interaction (right), from the 2 cell to morula stage (A; Notch inhibition, n = 6); YAP/TEAD inhibition, n = 6–9) or from morula to blastocyst stage (B; Notch inhibition, n = 4–6; YAP/TEAD inhibition, n = 6–11). n represents number of unique pools of 25 embryos. Pools of embryos treated with DMSO were used as controls. * p-value<0.05 by Student’s t test. (C) Maximal projections of confocal images after immunostaining of CDX2 in wildtype and Rbpj-/- early morulae. (D) Violin plots of CDX2 intensity levels and (E) quantification of number of CDX2 positive cells in wildtype and Rbpj-/- early morulae (n = 11 embryos). (F) Maximal projections of confocal images after immunostaining of CDX2 in wildtype and Rbpj-/- late morulae. (G) Violin plots of CDX2 intensity levels and (H) quantification of number of CDX2 positive cells in wildtype and Rbpj-/- late morulae (wildtype, n = 4 embryos; Rbpj-/-, n = 5 embryos). Nuclei were stained with DAPI. Scale bar, 20 μm. Data are means ± s.d. ***p<0.001 by Student’s t test (D) or by Fisher’s exact test (E).
Figure 2—figure supplement 1
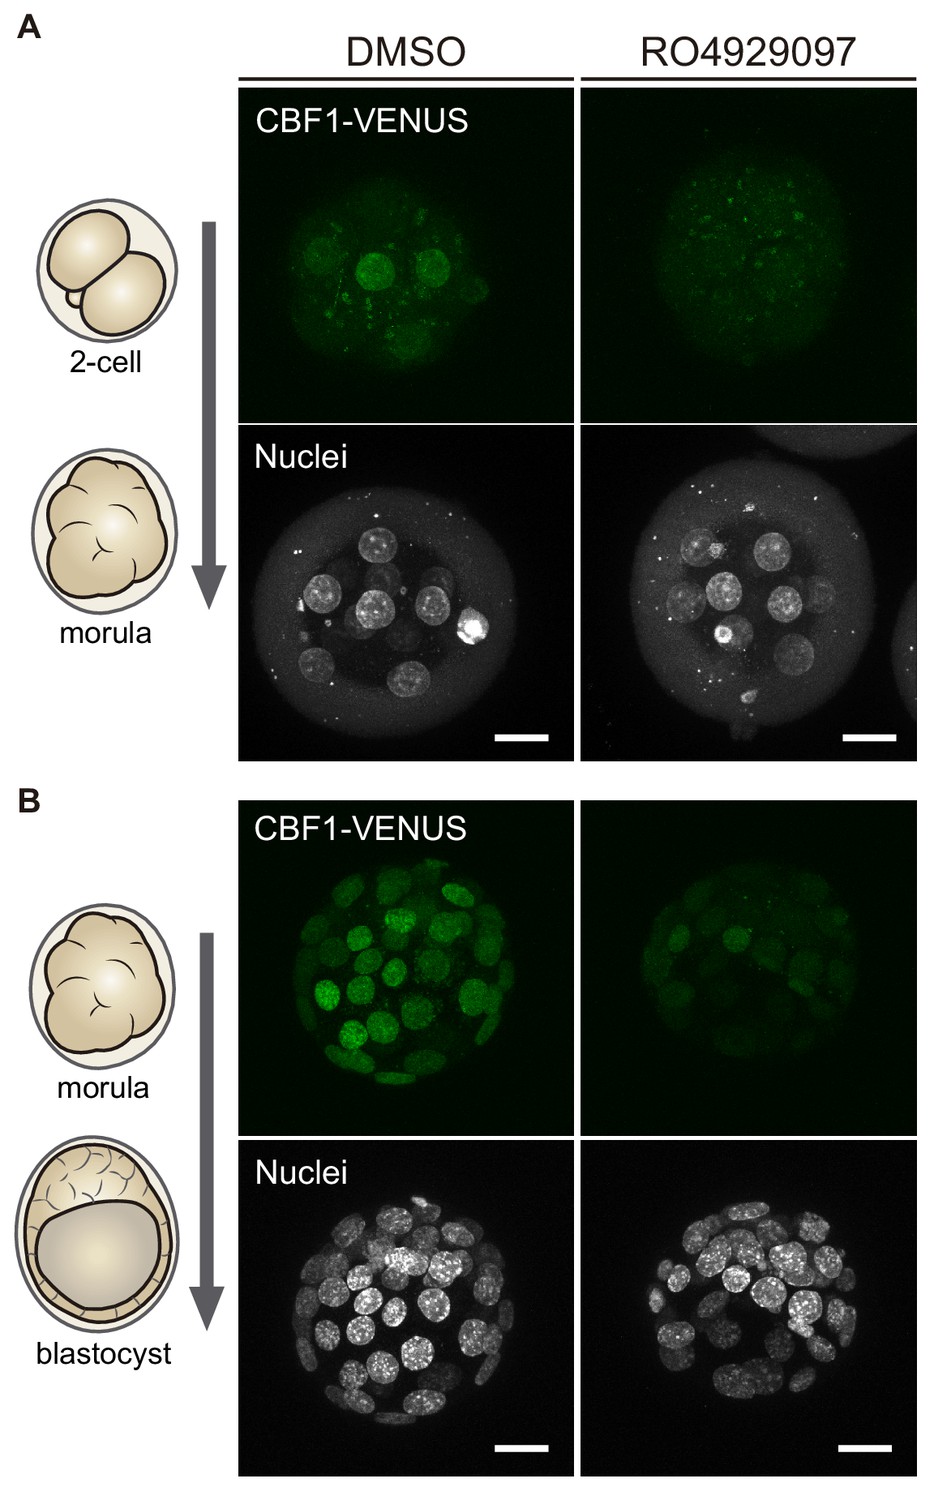
CBF1-VENUS levels decrease upon Notch inhibition.
Maximal projections of confocal images of embryos from the CBF1-VENUS mouse line after treatment with RO4929097 to inhibit Notch or with DMSO as control. Treatments were performed in embryos from 2 cell to morula stage (A, n = 6) or from morula to blastocyst stage (B, n = 3). Nuclei were stained with DAPI. Scale bars, 20 μm.
Figure 2—figure supplement 2
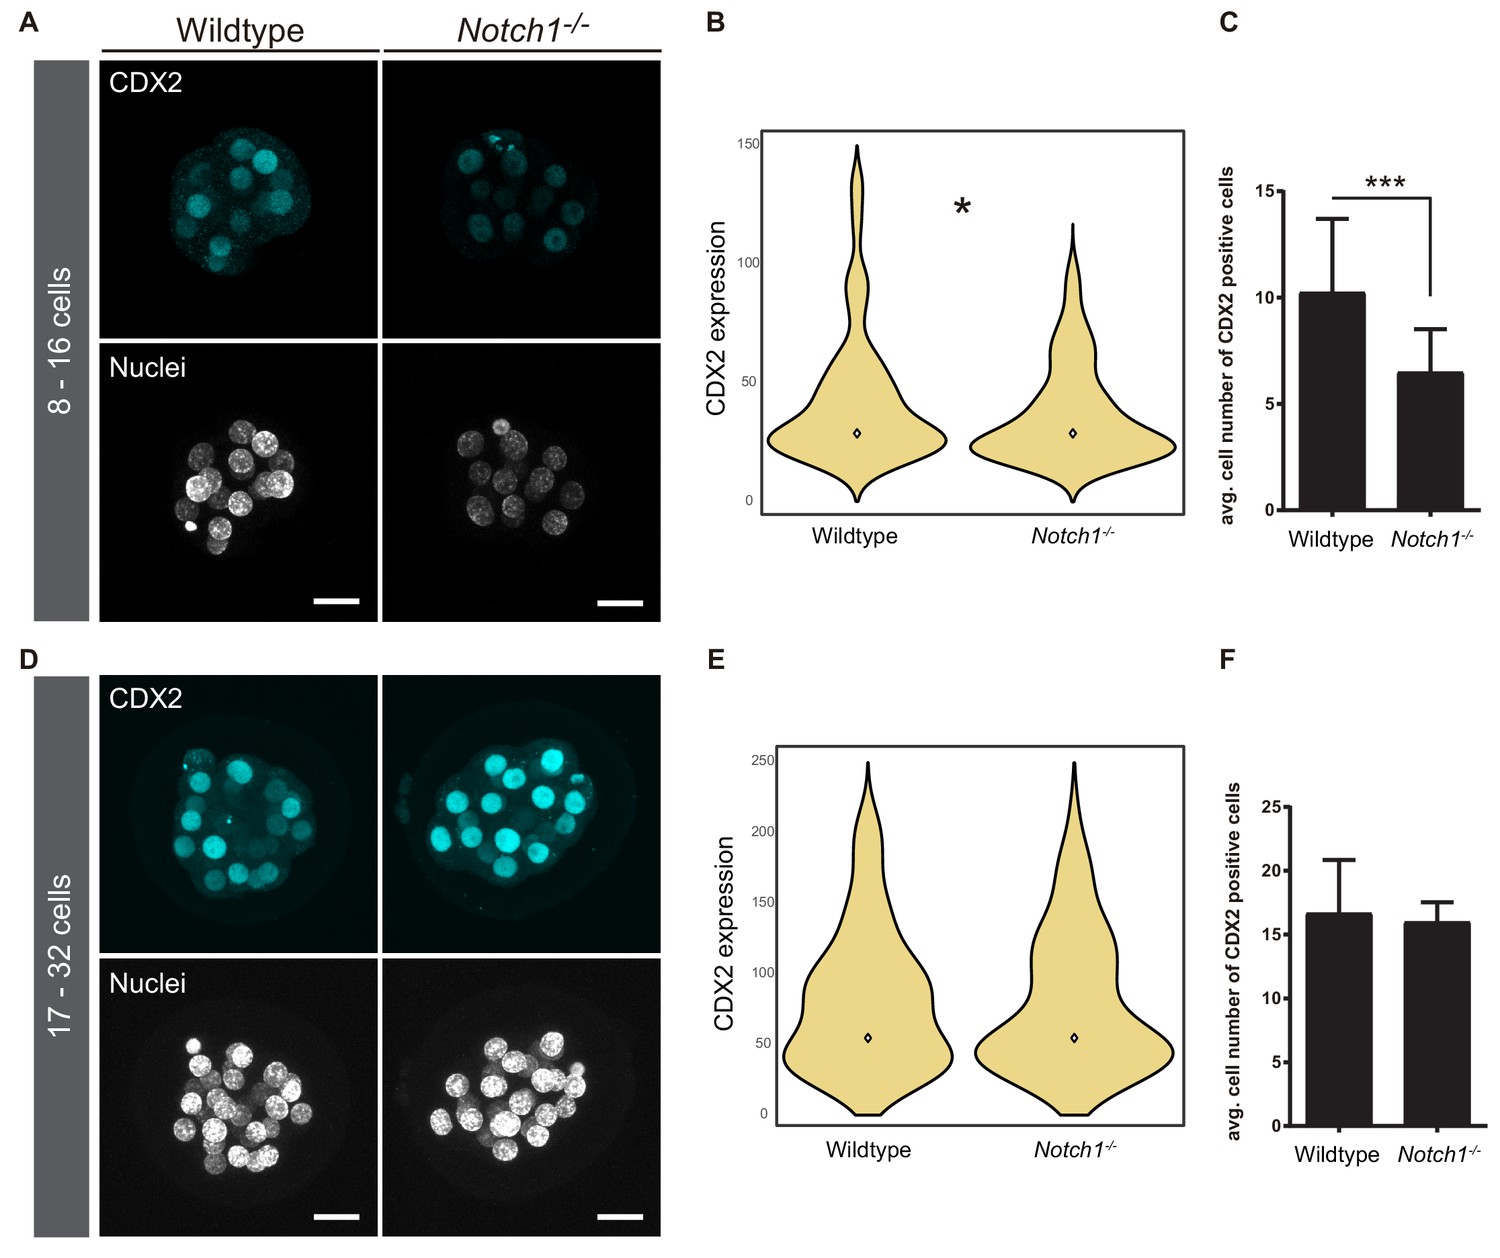
Downregulation of CDX2 in Notch1-/- early morulae.
(A) Maximal projections of confocal images after immunostaining of CDX2 in wildtype and Notch1-/- early morulae. (B) Violin plots of CDX2 intensity levels and (C) quantification of the number of CDX2 positive cells in wildtype (n = 11) and Notch1-/- (n = 11) early morulae. (D) Maximal projections of confocal images after immunostaining of CDX2 in wildtype and Notch1-/- late morulae. (E) Violin plots of CDX2 intensity levels and (F) quantification of the number of CDX2 positive cells in wildtype (n = 5) and Notch1-/- (n = 3) late morulae. Nuclei were stained with DAPI. Scale bars, 20 μm. *p<0.05 by Student’s t test (B); ***p<0.001 by Fisher’s exact test (C).
Figure 3 with 2 supplements
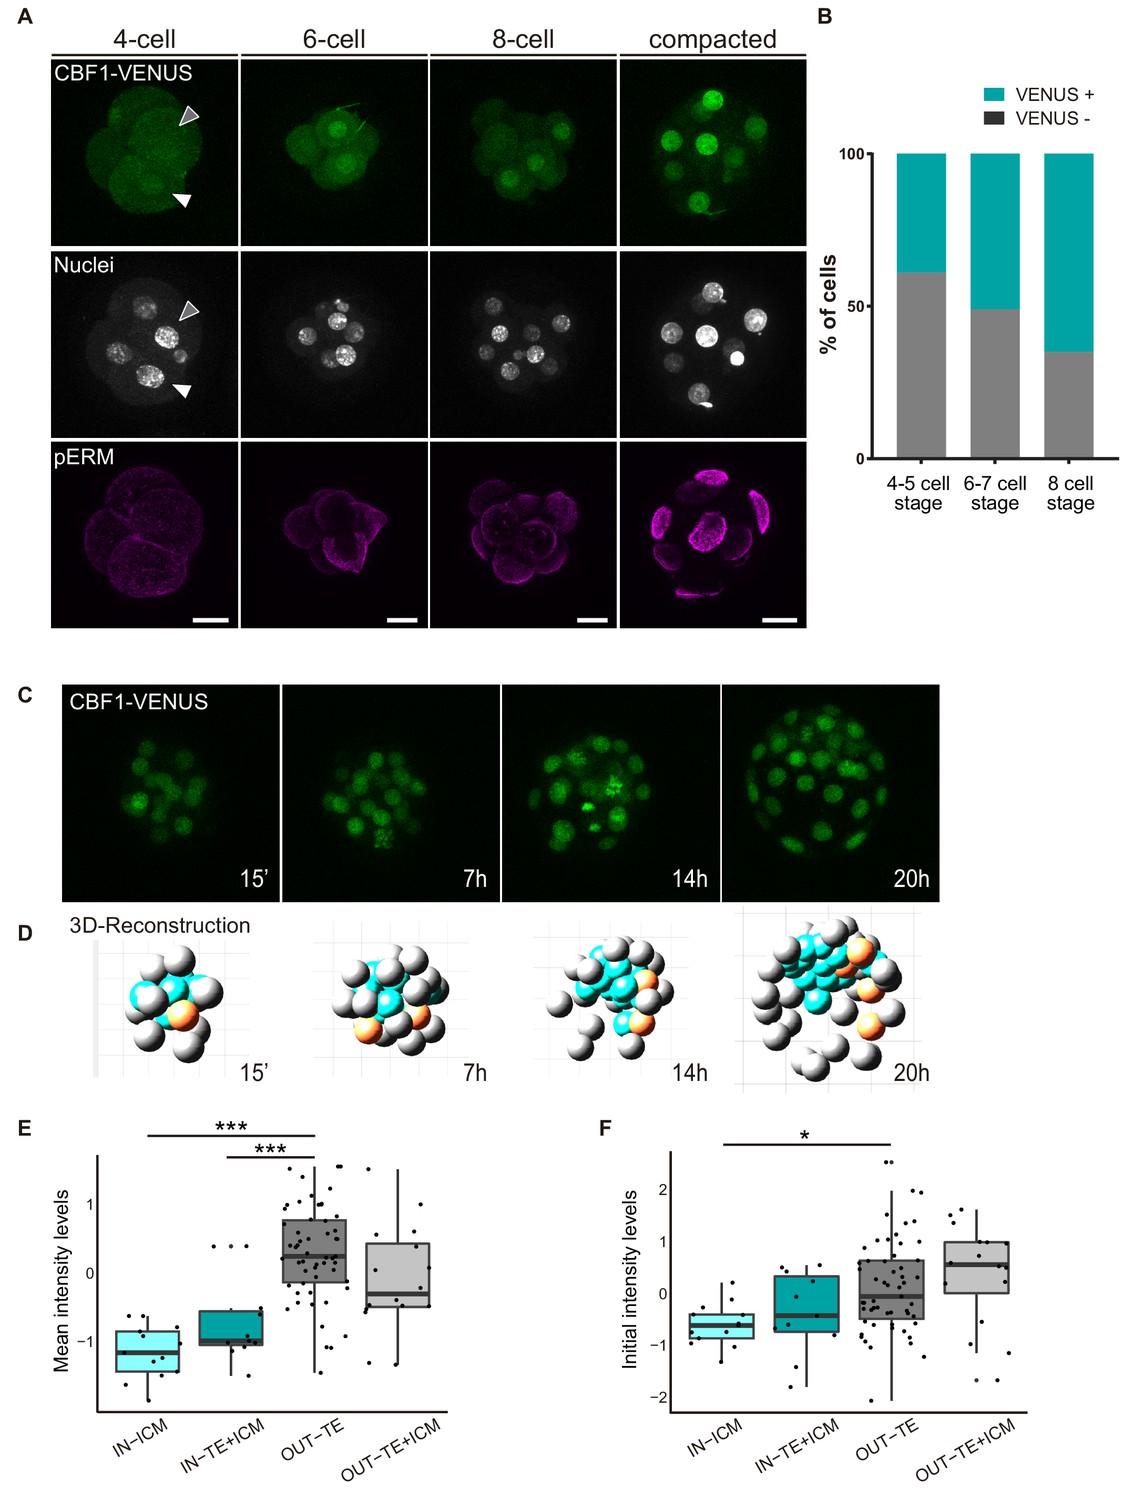
CBF1-VENUS dynamics in the mouse preimplantation embryo.
(A) Maximal projections of confocal images of CBF1-VENUS reporter line in 4 cell, 6 cell, 8 cell and compacted morula stages. A white and a grey arrowhead respectively indicate a positive and a negative cell for VENUS in a 4 cell embryo. Immunostaining of pERM (bottom row) confirms acquisition of apical polarity in compacted morulae. Nuclei were stained with DAPI. Scale bar, 20 μm. (B) Percentage of VENUS positive cells per embryo at different stages (4–5 cell embryos, n = 24; 6–7 cell embryos, n = 7; 8 cell embryos, n = 9). (C) Maximal projections of four time-frames during live imaging of embryos from the CBF1-VENUS reporter line. Time since the onset of time lapse is indicated. (D) 3D reconstruction of the time-lapse imaging of a representative embryo. A selected cell and its progeny are highlighted in orange. Blue blastomeres indicate inner position and gray blastomeres indicate outer position. (E) Mean intensity levels of VENUS in all the families of the live imaged embryos (n = 7) according to the position of a cell and their progeny in the first and the last time frame. (F) Initial intensity levels of VENUS in all the families of the live imaged embryos according to the position of a cell and their progeny in the first and the last time frame. For (E) and (F), n = 13 families for IN-ICM, n = 11 families for IN–TE + ICM, n = 55 families for OUT TE, n = 16 families for OUT–TE + ICM. ***p<0.001, *p<0.05 by ANOVA with Bonferroni post-test.
Figure 3—figure supplement 1
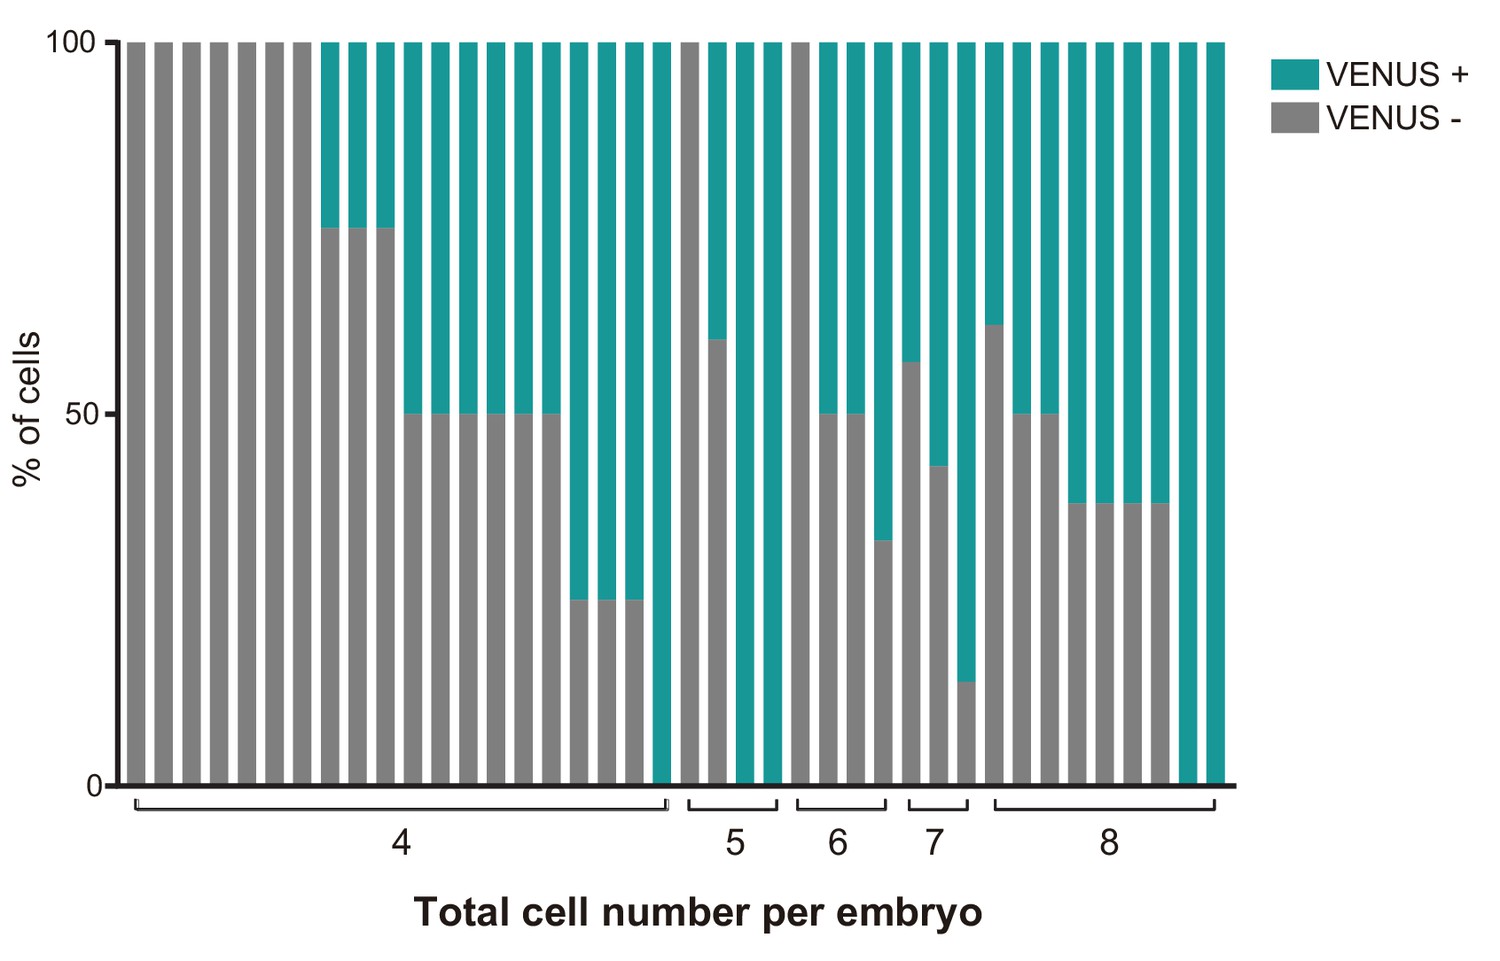
CBF1-VENUS activity in embryos before compaction.
Percentage of VENUS positive cells in individual embryos of 4- to 8-cell stage (indicated on the x-axis) from the CBF1-VENUS line.
Figure 3—figure supplement 2

CBF1-VENUS dynamics in morula to blastocyst transition.
(A) Example of cell tracking and family tree (each family in a different colour) after live imaging of a CBF1-VENUS embryo from morula to blastocyst stage (see Video 1). (B) Percentage of cells from the ICM or from the TE according to the position (IN/OUT) of their progenitor cell in the first frame of the time lapse (n = 7). (C–E) Representative examples of VENUS intensity levels of various cells from the same embryo showing families with different outcomes in relation to their position in the first and last frame of the time lapse movies. Dotted lines represent mitosis.
Figure 4 with 3 supplements
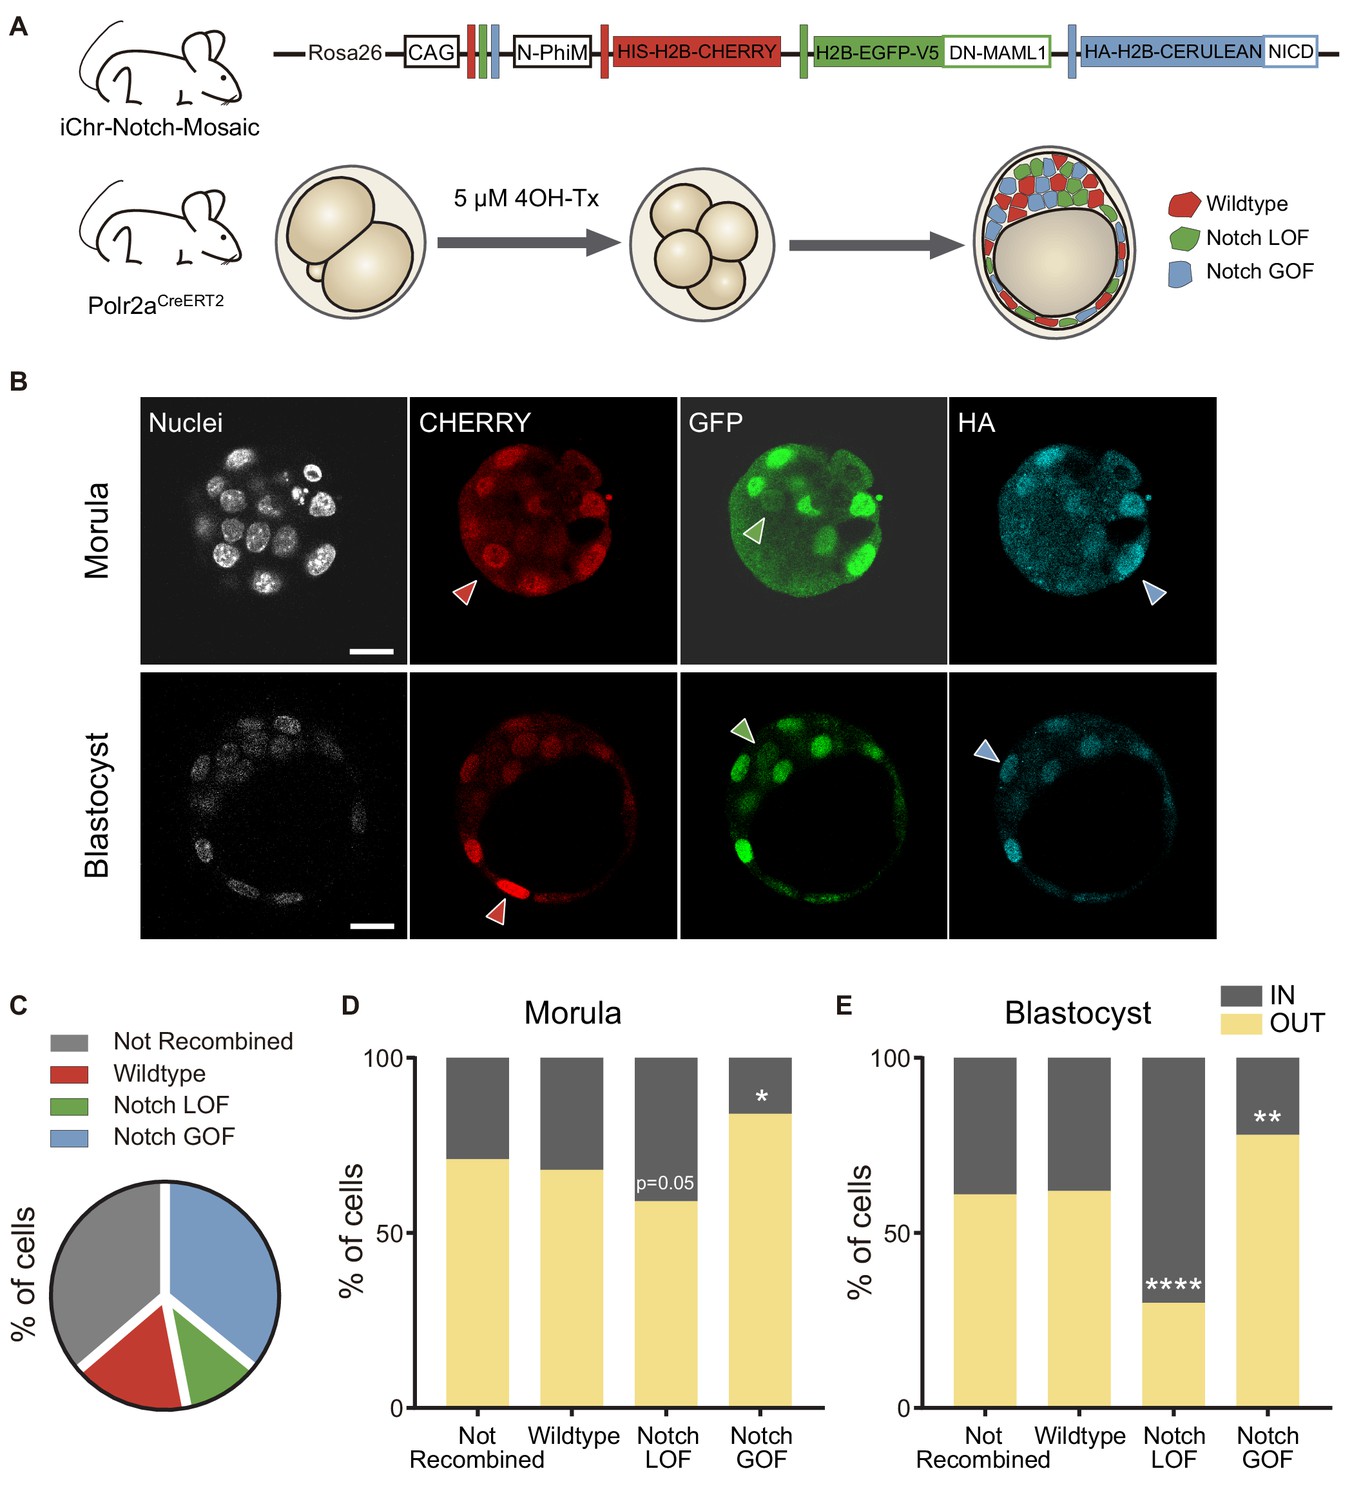
Differences in Notch activity drive cell fate in the preimplantation embryo.
(A) Schematic diagram of the experimental strategy, where iChr-Notch-Mosaic mice were crossed with Polr2aCreERT2 driver. Embryos were collected and treated with 4OH-Tamoxifen from 2- to 4-cell stage to induce recombination. At morula and blastocyst stage, embryos were fixed and immunostained. (B) Optical section of confocal images after immunostaining for RFP, GFP and HA. Arrowheads indicate examples of cells recombined for the wildtype cassette (red), the Notch loss of function cassette (LOF, green) or the Notch gain of function cassette (GOF, blue). Nuclei were stained with DAPI. Scale bars, 20 μm. (C) Percentage of not recombined cells or recombined for each cassette in morulae (n = 10) and blastocysts (n = 11). (D–E) Percentage of not recombined cells or recombined for each cassette that are in an inner or outer position at the morula (D; not recombined, n = 69; wildtype, n = 33; LOF, n = 29; GOF, n = 83) or blastocyst stage (E; not recombined, n = 190; wildtype, n = 87; LOF, n = 50; GOF, n = 173). *p<0.05, **p<0.01, ****p<0.0001 in relation to not recombined cells by Chi-square test.
Figure 4—figure supplement 1

Differences in Notch activity correlate with CDX2 levels.
(A) Confocal images after immunostaining for CHERRY, GFP and HA of sorted cell populations from the iChr-Notch-Mosaic ES cell line according to the colour of each cassette (wildtype, red; Notch LOF, green; Notch GOF, cerulean). Nuclei were stained with DAPI. Scale bars, 20 μm. (B) CDX2 intensity levels of Notch LOF, wildtype and Notch GOF blastomeres in blastocysts from the iChr-Notch-Mosaic mouse line. **p<0.01; ****p<0.0001 by ANOVA with Tukey post-test. Notch LOF, n = 30 blastomeres; wildtype, n = 55 blastomeres; Notch GOF, n = 106 blastomeres from six blastocysts.
Figure 4—figure supplement 2
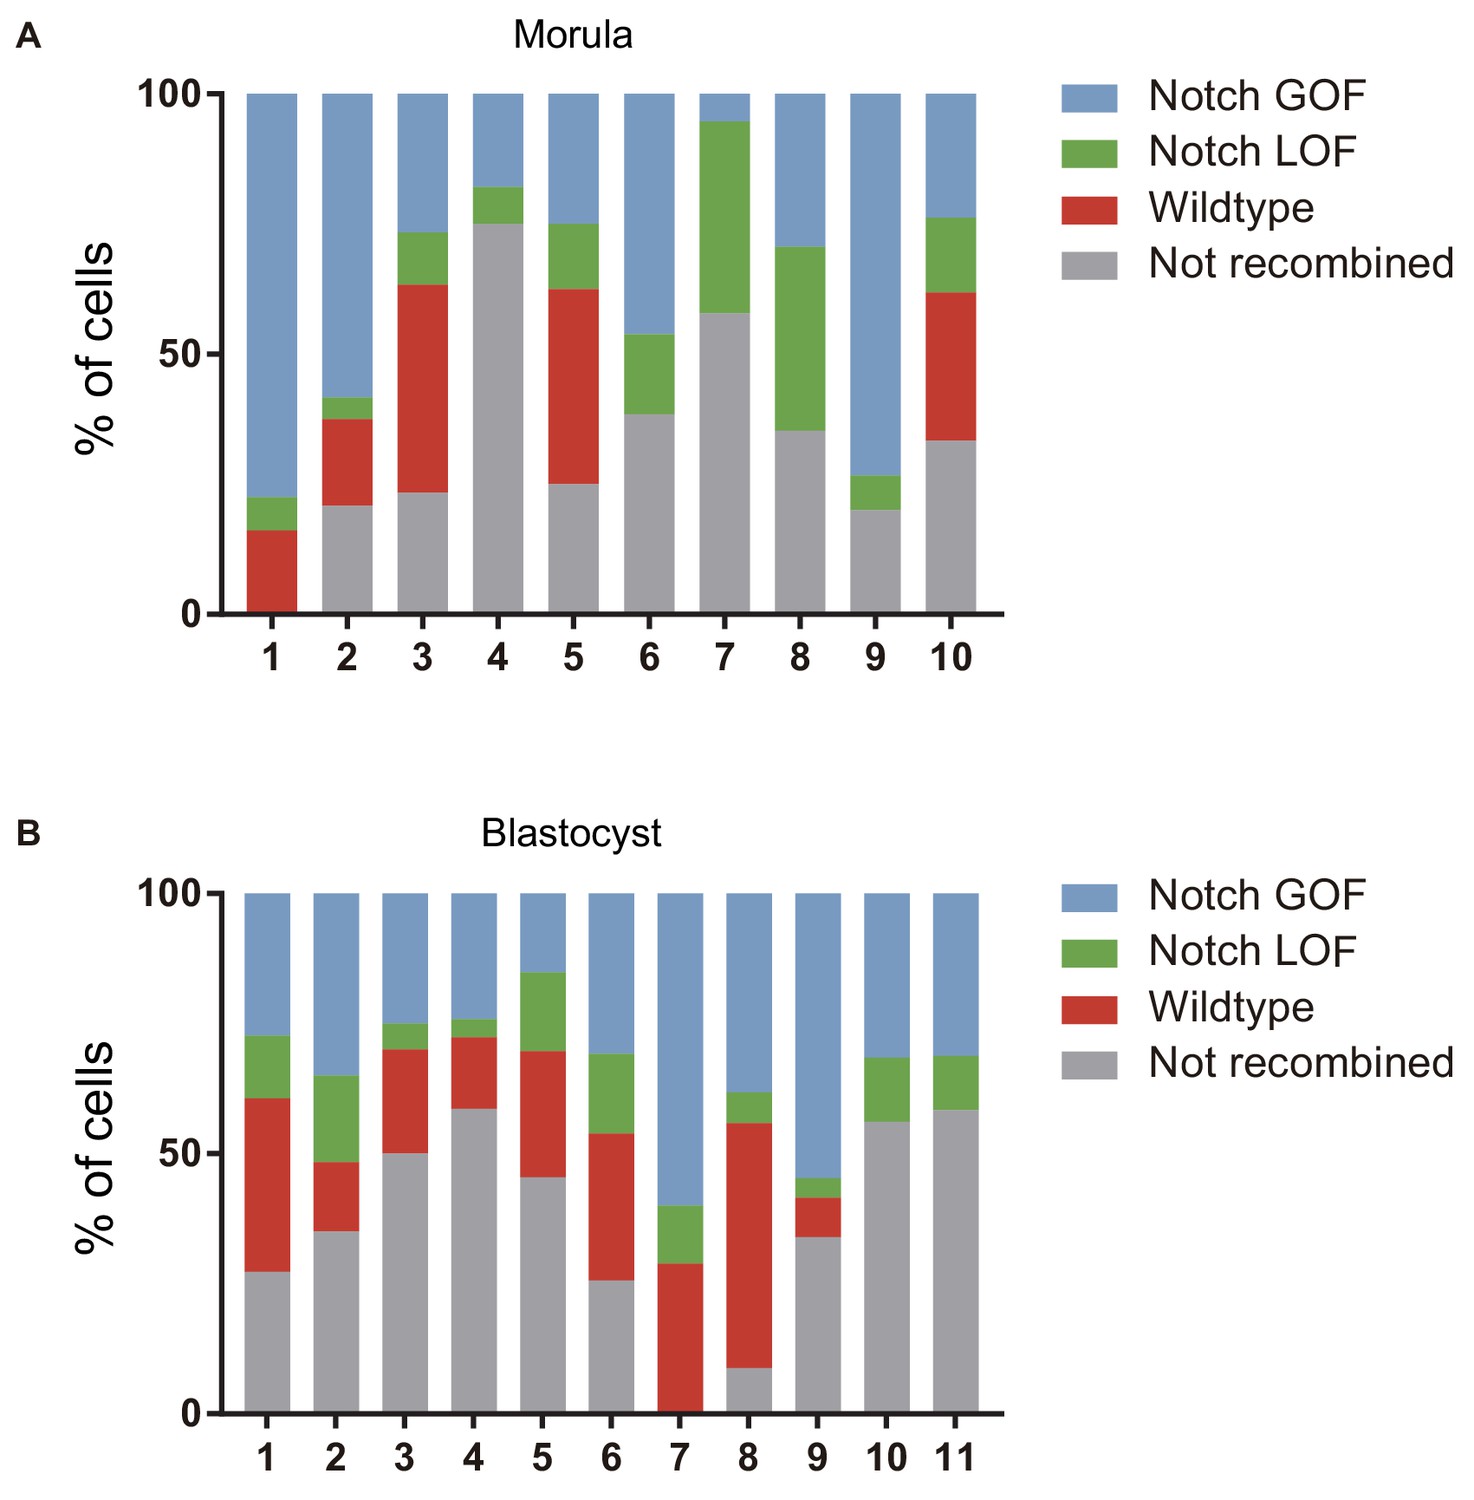
Confronting Notch activity levels in the preimplantation embryo.
(A–B) Percentage of cells recombined for each cassette (wildtype, red; LOF, green; GOF, cerulean) or not recombined in individual morulae (A) or blastocysts (B) from the iChr-Notch-Mosaic mouse line.
Figure 4—figure supplement 3

Distribution of recombination events in a control mosaic mouse line.
(A) Schematic diagram of the experimental strategy, where iChr-Control-Mosaic mice were crossed with Polr2aCreERT2 driver. Embryos were collected and treated with 4OH-Tamoxifen from 2- to 4-cell stage to induce recombination. (B) Percentage of not recombined cells or recombined for each cassette (n = 12 embryos). (C) Percentage of not recombined cells or recombined for each cassette that are in an inner or outer position at the blastocyst stage (not recombined, n = 218; CHERRY, n = 215; GFP, n = 86; CERULEAN, n = 122).
Figure 5 with 2 supplements
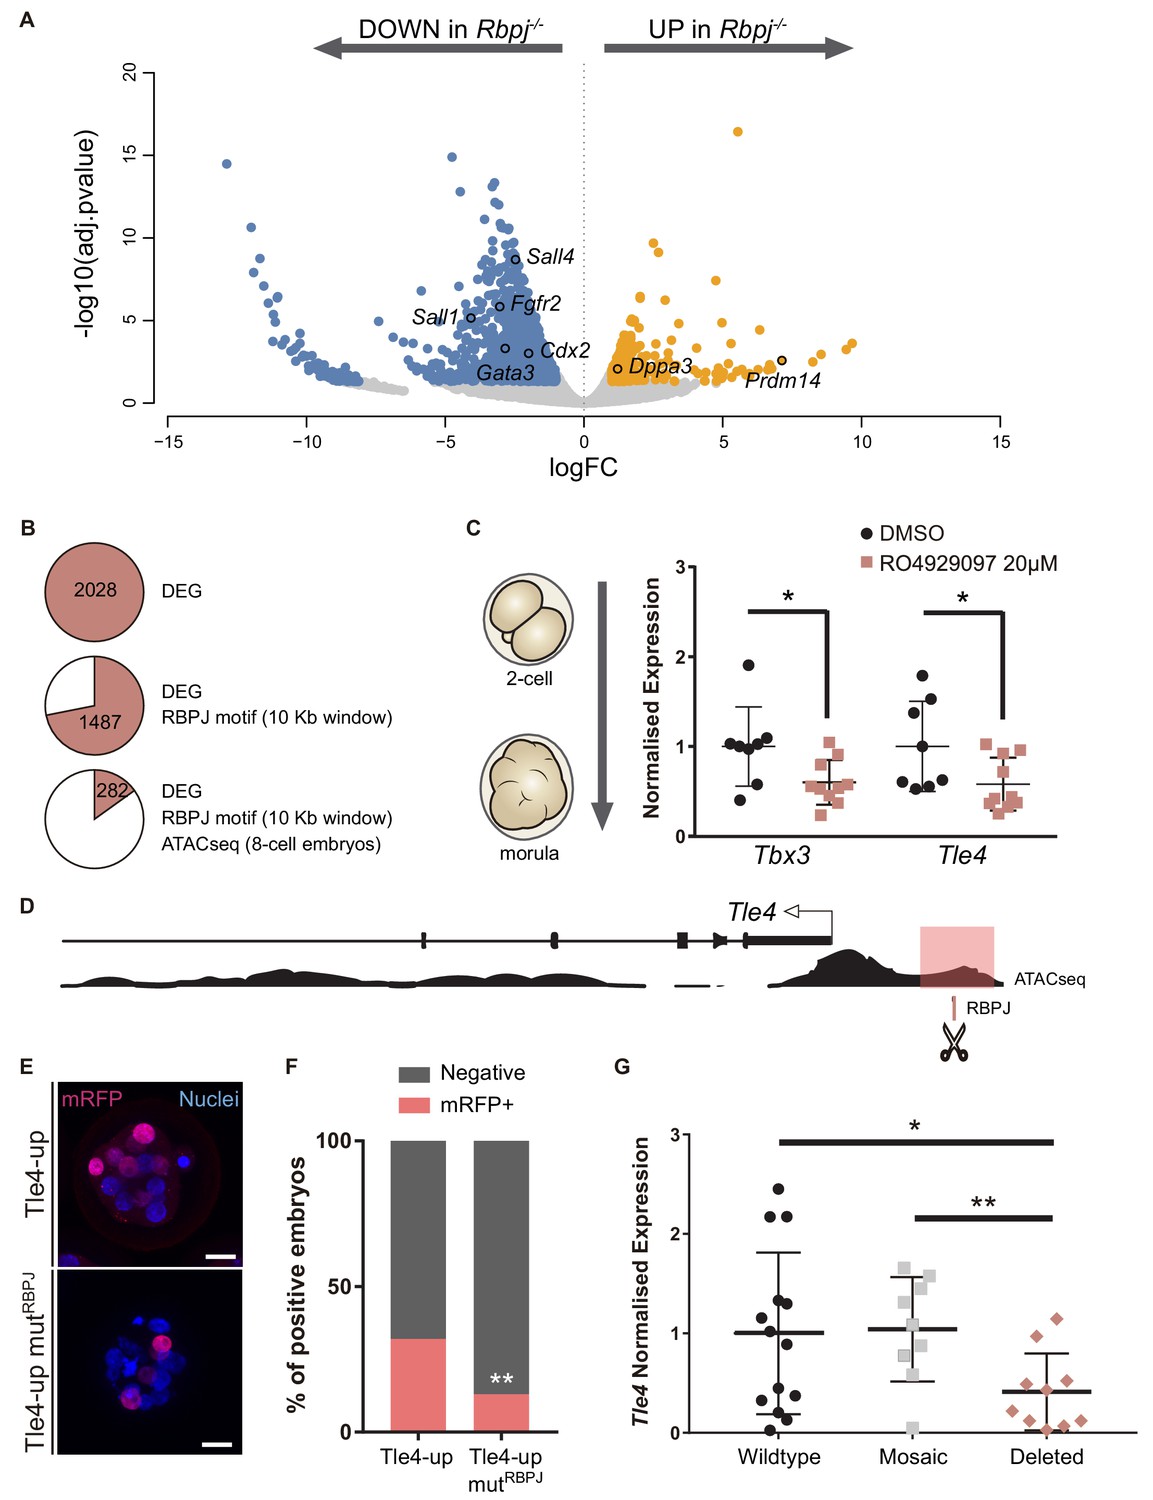
Tle4 is a direct transcriptional target of Notch.
(A) Volcano plot of differentially expressed genes between wildtype and Rbpj-/- single morulae. In blue, genes downregulated in Rbpj-/- (adj.pvalue <0.05 and logFC < −1); in orange, genes upregulated in Rbpj-/- (adj.pvalue <0.05 and logFC >1). Representative genes are indicated. (B) Number of differentially expressed genes (DEG) between wildtype and Rbpj-/- morulae (top), those that have a RBPJ motif in a 10 Kb window surrounding the gene (middle), and those in which this site is included in an open chromatin ATAC-seq peak in 8 cell embryos (Wu et al., 2016) (bottom). (C) Tbx3 and Tle4 normalised expression in pools of 25 embryos after treatment with RO4929097 to block Notch from 2 cell to morula stage. Pools of embryos treated with DMSO were used as controls (n = 8–10). n represents number of unique pools of 25 embryos. (D) Genomic landscape of the region upstream Tle4 indicating the location of the RBPJ motif and the ATAC-seq track. (E) Maximal projection confocal images after RFP immunostaining of representative transgenic embryos for the region highlighted in pink in (D) (top) or the mutated version for the RBPJ site (bottom). Nuclei were stained with DAPI. Scale bar, 20 μm. (F) Percentage of positive embryos in the transient transgenic assay of Tle4-up region (n = 137) or the mutated version (n = 169). (G) Tle4 normalised expression in single embryos (wildtype, n = 14; mosaic, n = 9; deleted, n = 10) after CRISPR/Cas9 deletion of the region containing the RBPJ motif. Data are means ± s.d. *p<0.05 by Student’s t test in (C) and (G). **p<0.01 by Student’s t test in (G) or by Fisher’s exact test in (F).
-
Figure 5—source data 1
Table with differentially expressed genes (DEG) obtained after the RNA-seq analysis in control and Rbpj mutant morulae.
- https://doi.org/10.7554/eLife.42930.023
-
Figure 5—source data 2
Table with differentially expressed genes (DEG) that have an RBPJ consensus binding site included in an open chromatin ATAC-seq peak in a 10 Kb window surrounding the gene.
- https://doi.org/10.7554/eLife.42930.024
Figure 5—figure supplement 1
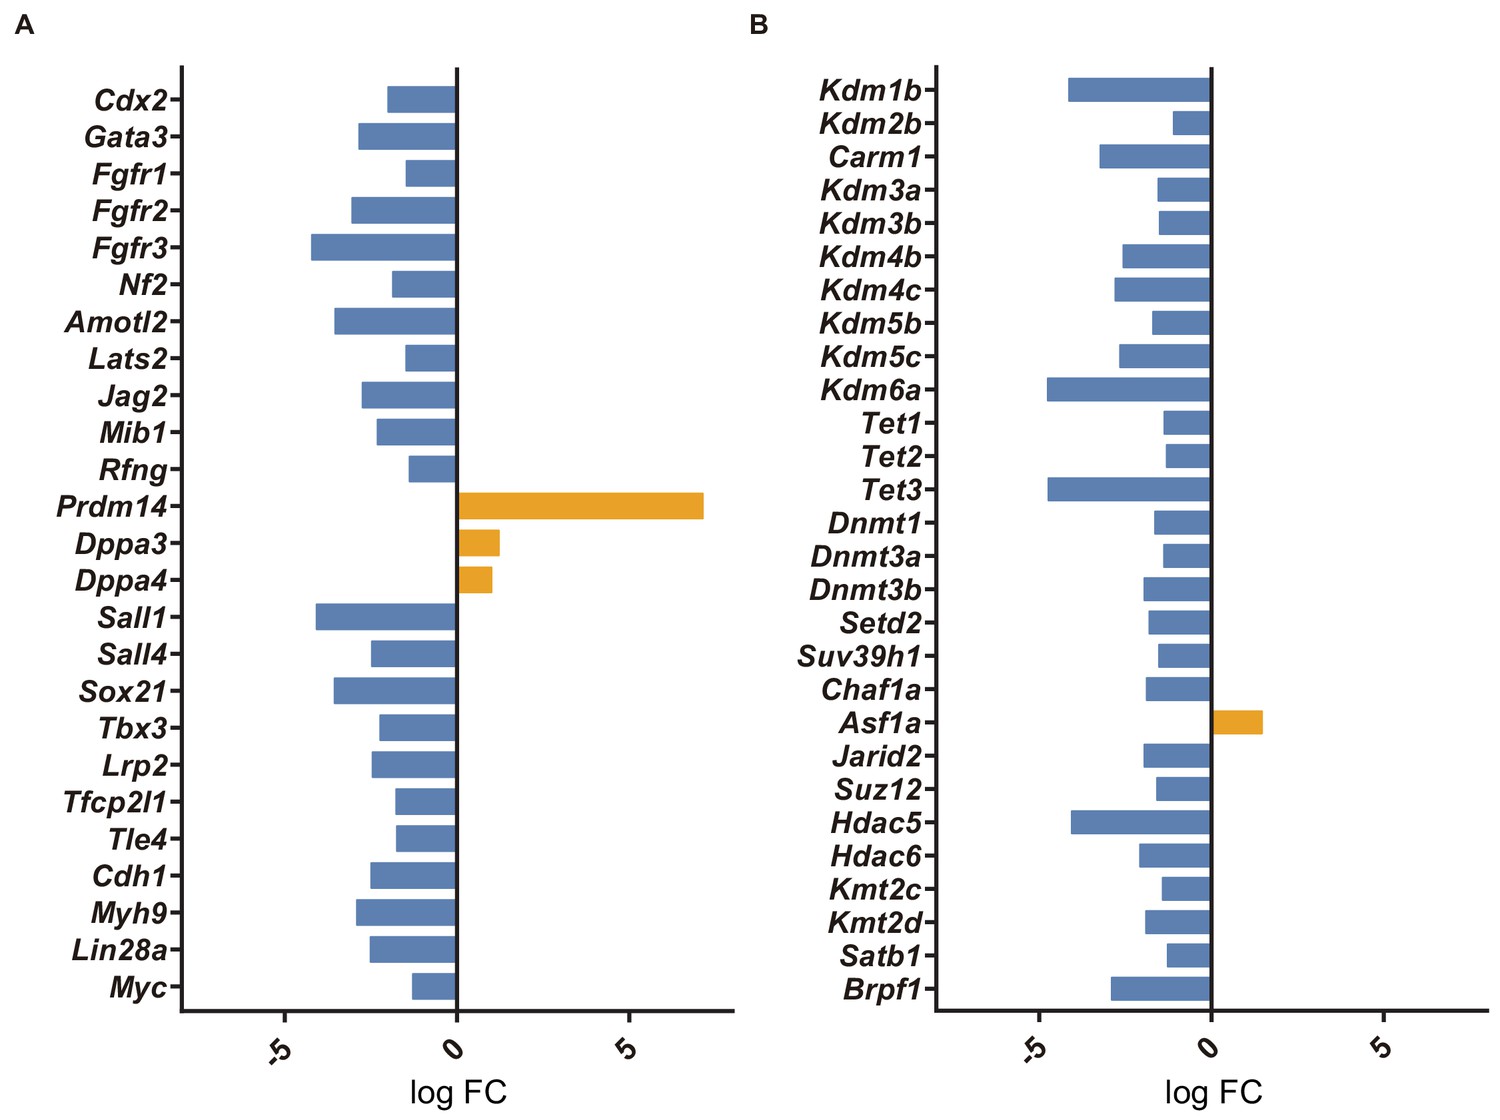
Transcriptome analysis of Rbpj-/- single morulae.
Log FC of selected differentially expressed genes between control and Rbpj-/- embryos related to lineage programs (A) or chromatin modifiers (B).
Figure 5—figure supplement 2
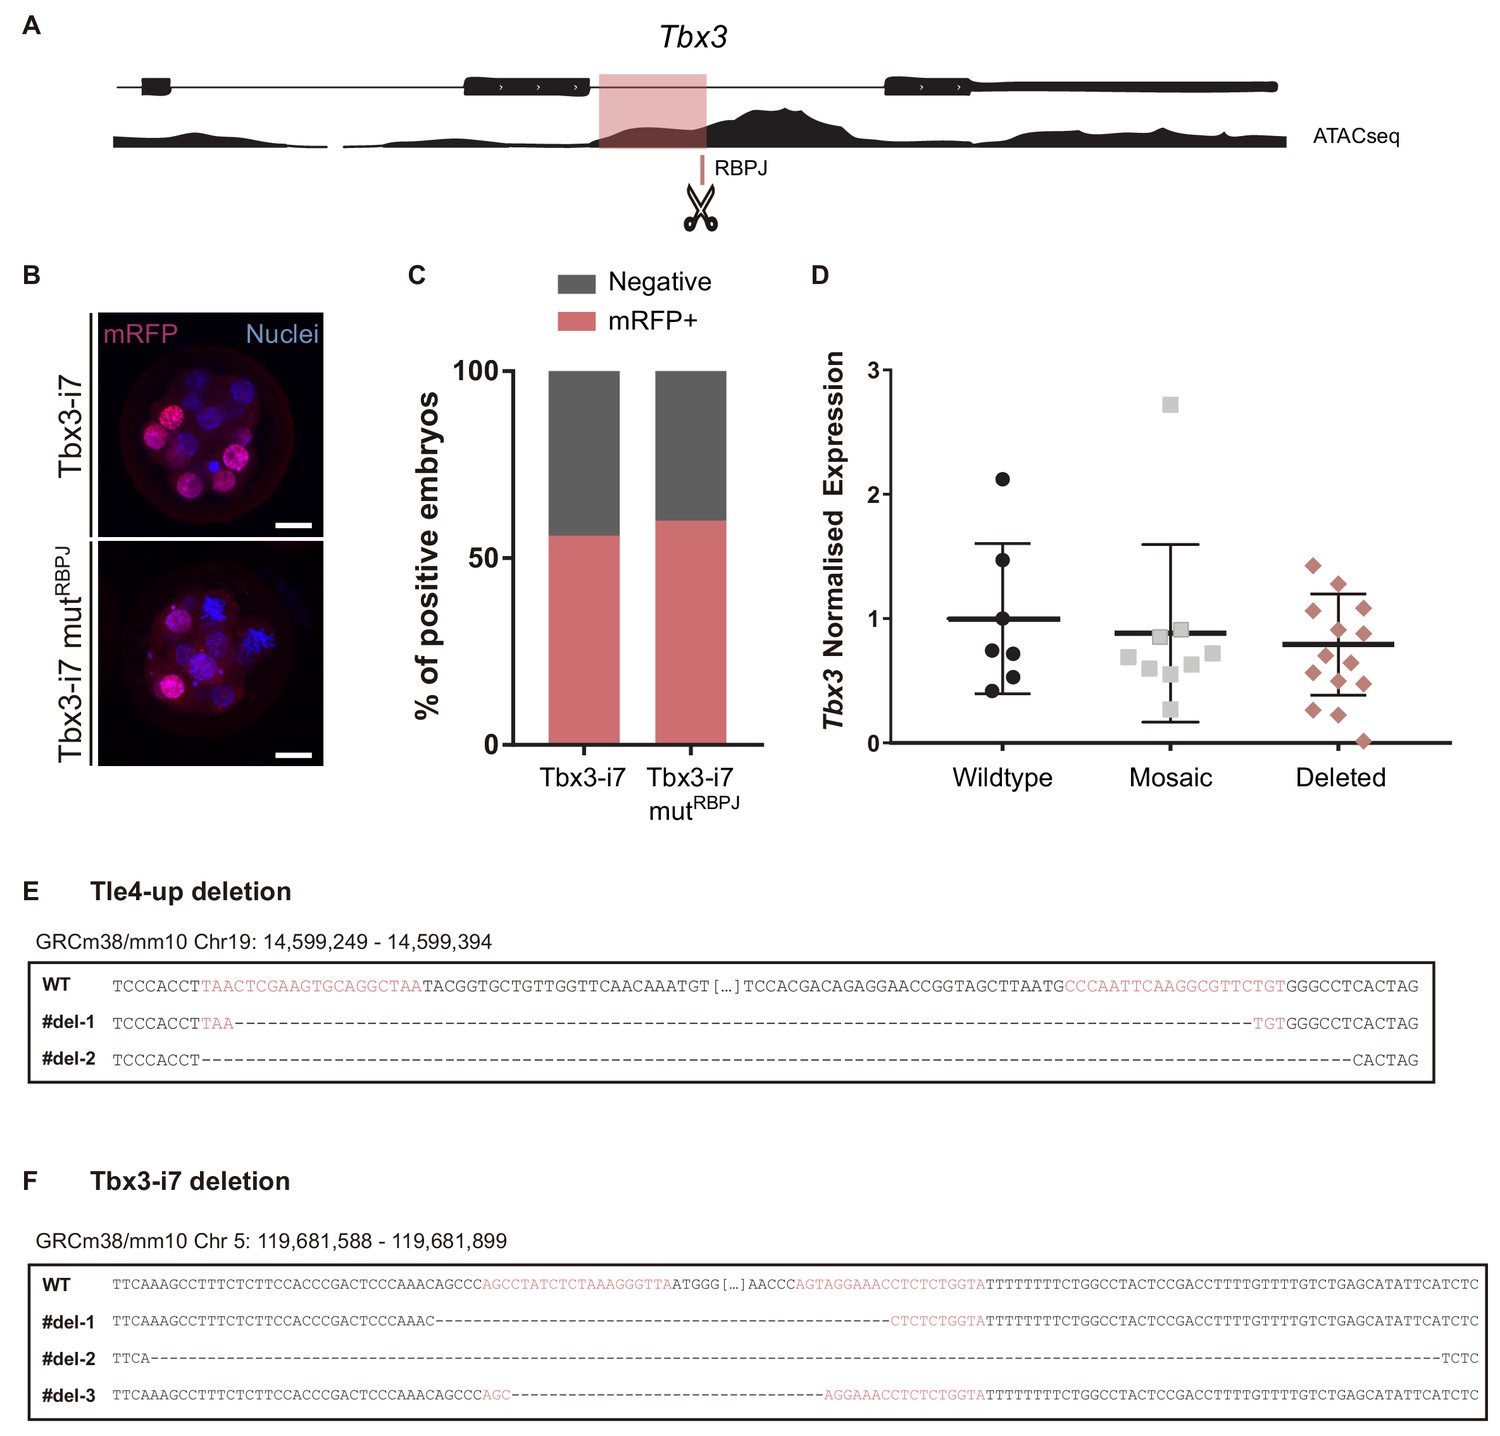
Regulation of Tbx3 in the morula and genome editing.
(A) Genomic landscape of the region surrounding the seventh intron of Tbx3 indicating the location of the RBPJ motif and the ATAC-seq track. (B) Maximal projection confocal images after RFP immunostaining of representative transgenic embryos for the region highlighted in pink in (A) (top) or the mutated version for the RBPJ site (bottom). Nuclei were stained with DAPI. Scale bars, 20 μm. (C) Percentage of positive embryos in the transient transgenic assay of Tbx3-i7 region (n = 75) or the mutated version (n = 80). (D) Tbx3 relative expression in single embryos (wildtype, n = 7; mosaic, n = 9; deleted, n = 10) after CRISPR/Cas9 deletion of the region containing the RBPJ motif. Data are means ± s.d. (E) Wildtype and deleted sequences of the Tle4-up region of embryos after CRISPR/Cas9 editing (mm10; chr19: 14,599,249–14,599,394). Two different deletions were found in seven sequenced embryos with a frequency of 5/7 and 2/7 respectively. (F) Wildtype and deleted sequences of the Tbx3i7 region of embryos after CRISPR/Cas9 editing (mm10; chr5: 119,681,588–119,681,899). Three different deletions were found in seven sequenced embryos with a frequency of 4/7, 2/7 and 1/7 respectively. Guide-RNAs are highlighted in pink.
Figure 6 with 4 supplements

Notch promotes exit from naïve pluripotency and cell differentiation of ES cells.
(A) Construct showing the wildtype (red), Notch loss of function (green) and Notch gain of function (blue) cassettes from iChr-Notch-Mosaic ES cells. (B) Schematic diagram of experimental design, where iChr-Notch-Mosaic ES cells were recombined with Cre and sorted according to Notch activity. (C) Prdm14, Dppa3, Nanog and Esrrb normalised expression in iChr-Notch-Mosaic ESCs after sorting of Notch LOF, wildtype and Notch GOF populations (n = 13 for Prdm14, n = 17 for Dppa3, n = 16 for Nanog, n = 11 for Esrrb). (D) Schematic diagram of experimental design, where sorted recombined iChr-Notch-Mosaic ES cells were differentiated after LIF removal. (E) Tle4, Tbx3, Fgf5 and Pou3f1 normalised expression in Notch LOF, Wildtype and Notch GOF cells at 0 hr, 12 hr, 24 hr and 48 hr after LIF withdrawal (n = 6). Data are means ± s.e.m. *p<0.05, **p<0.01, ***p<0.001, ****p<0.0001 in relation to wildtype cells by ANOVA with Fisher post-test.
Figure 6—figure supplement 1
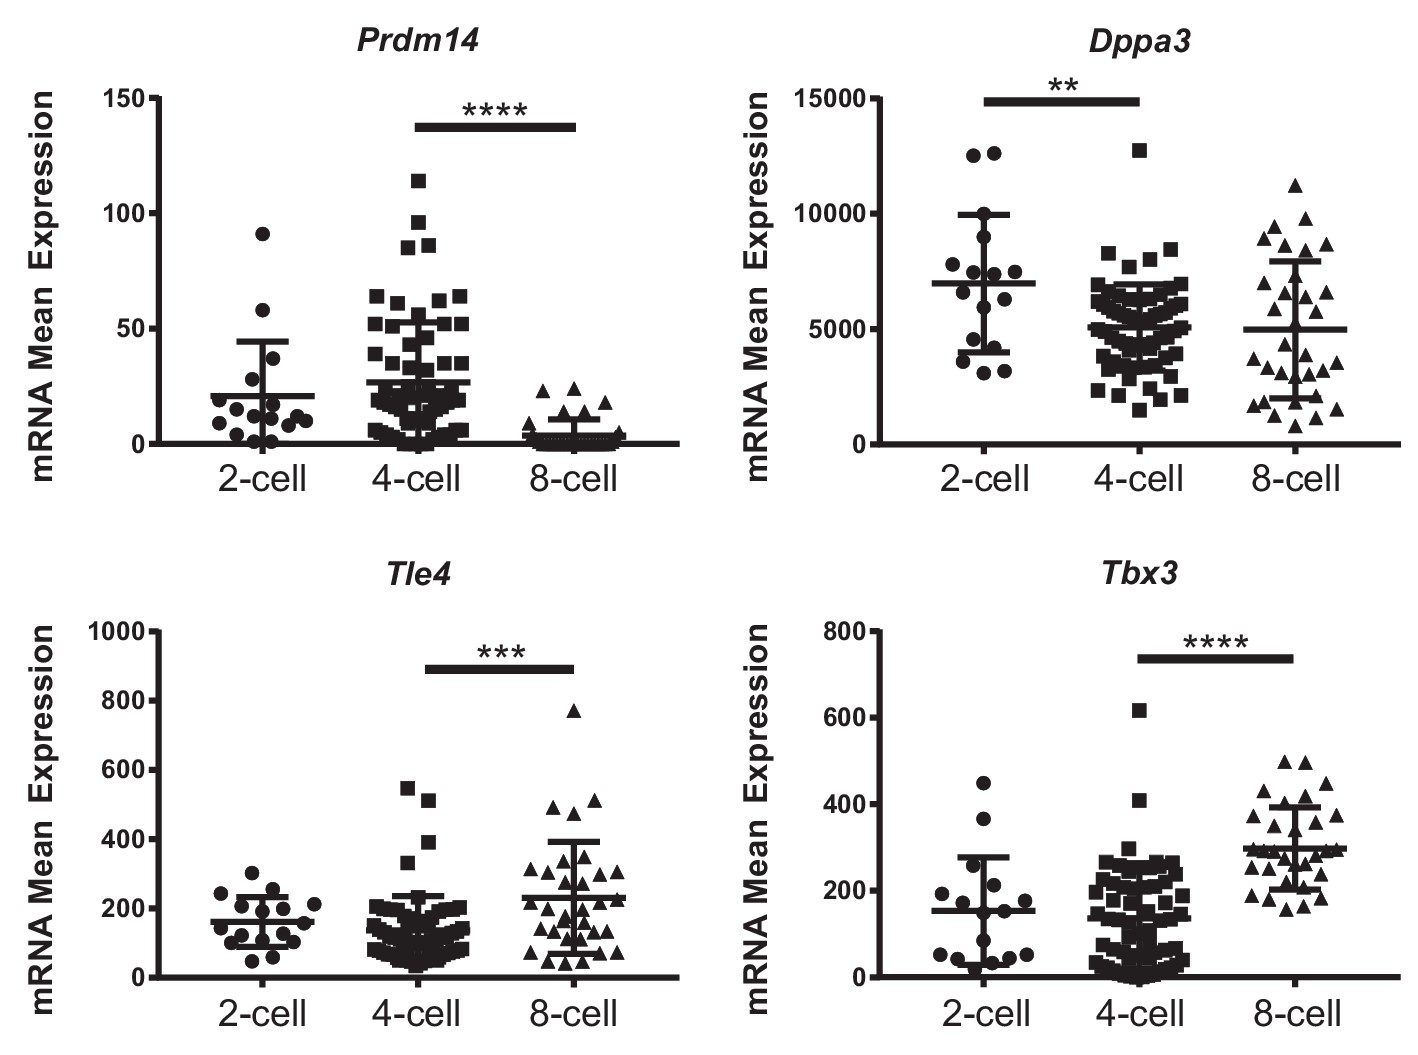
Expression of naïve pluripotency markers in the preimplantation embryo.
Expression of Pdrm14, Dppa3, Tle4 and Tbx3 in 2-, 4- and 8-cell stage single-cell RNA-seq data from Goolam et al. (2016). Data are means ± s.d. **p<0.01, ***p<0.001, ****p<0.0001 by ANOVA with Fisher post-test.
Figure 6—figure supplement 2

Notch inhibition increases Prdm14 in the 4 cell embryo.
Dppa3 and Prdm14 relative expression in pools of 30 embryos after treatment with RO4929097 to block Notch from 2- to 4-cell stage. Pools of embryos treated with DMSO were used as controls (n = 7–13) n represents number of unique pools of embryos. Data are means ± s.d. *p<0.05 by Student’s t-test.
Figure 6—figure supplement 3
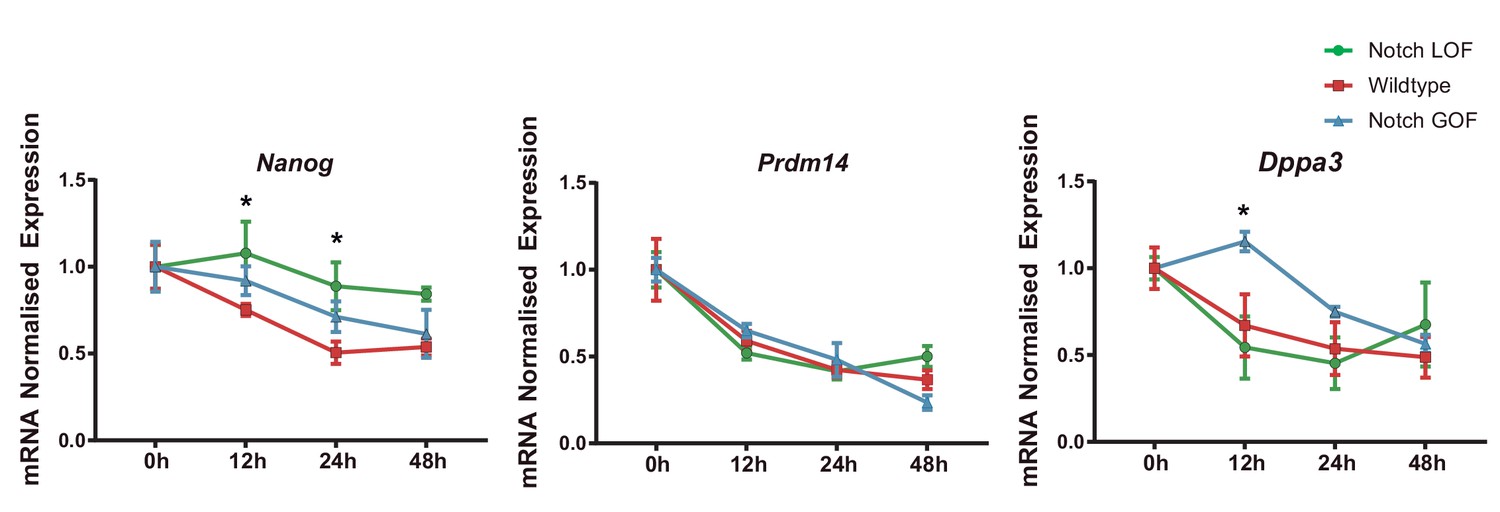
Expression of naïve pluripotency markers in differentiating ES cells.
Nanog, Prdm14 and Dppa3 relative expression in Notch LOF, Wildtype and Notch GOF ES cells at 0 hr, 12 hr, 24 hr and 48 hr after LIF withdrawal to promote differentiation (n = 6). Data are means ± s.e.m. *p<0.05 by ANOVA with Fisher post-test.
Figure 6—figure supplement 4
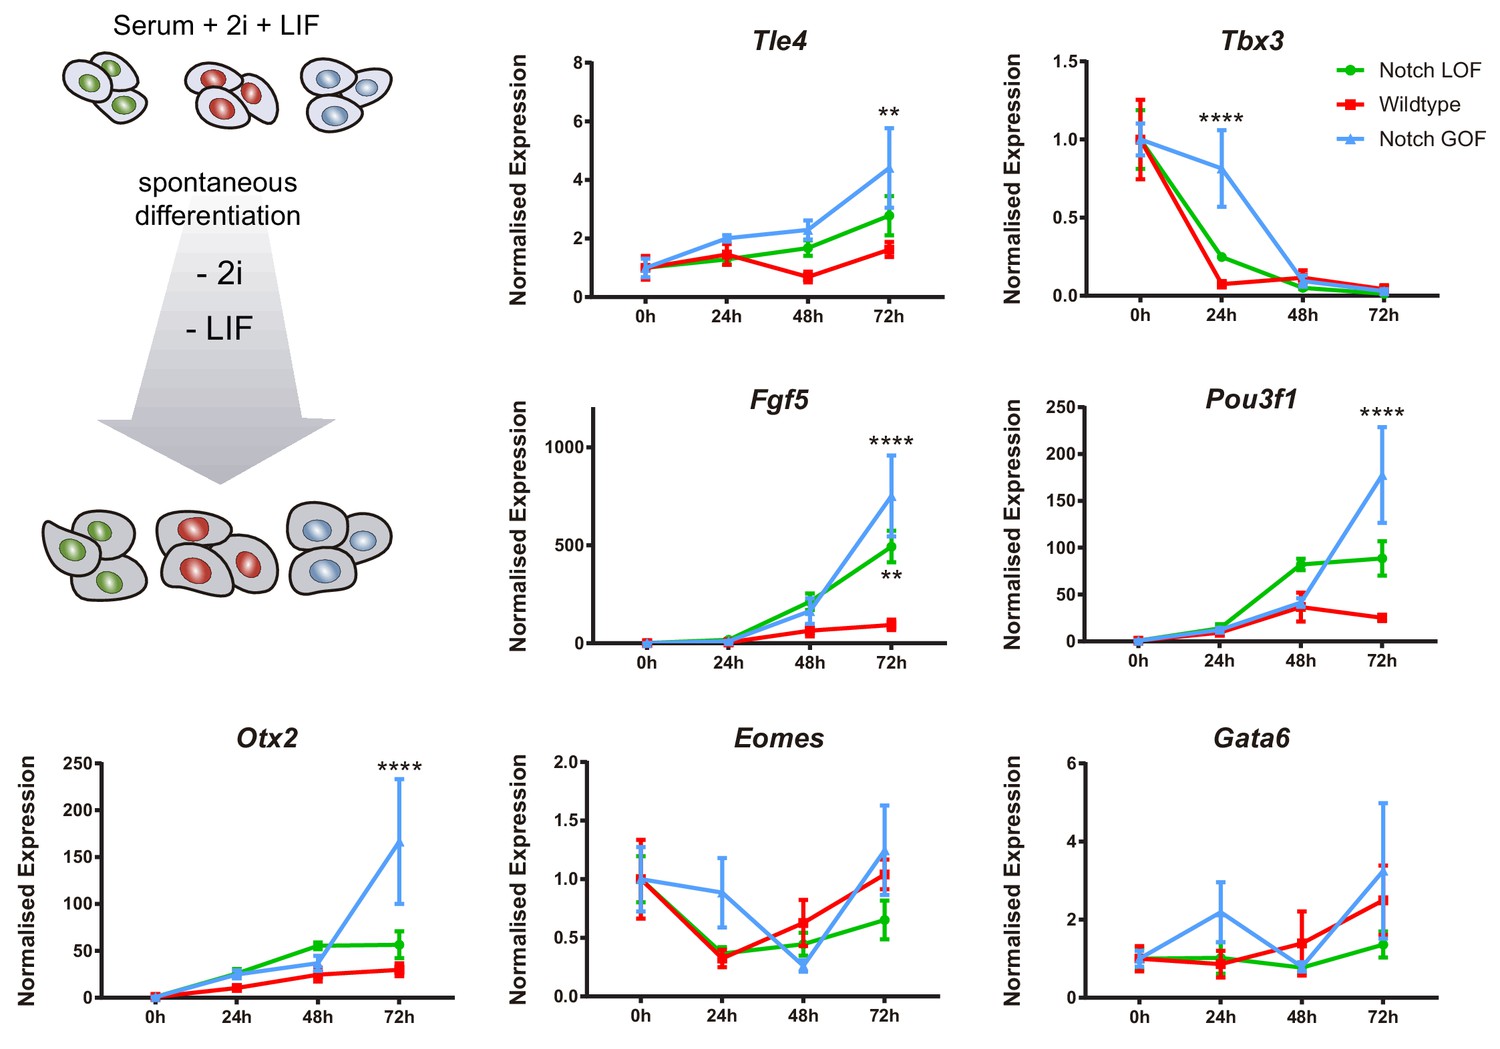
Notch promotes differentiation of naïve ES cells.
Schematic diagram of experimental design, where naïve iChr-Notch-Mosaic ES cells cultured in 2i + LIF conditions were differentiated after removal of 2i + LIF (left). Tle4, Tbx3, Fgf5, Pou3f1, Otx2, Eomes and Gata6 normalised expression in Notch LOF, Wildtype and Notch GOF cells at 0 hr, 24 hr, 48 hr and 72 hr after 2i + LIF withdrawal (n = 3–4). Data are means ± s.e.m. *p<0.05, **p<0.01, ***p<0.001, ****p<0.0001 in relation to wildtype cells by ANOVA with Fisher post-test.
Author response image 1
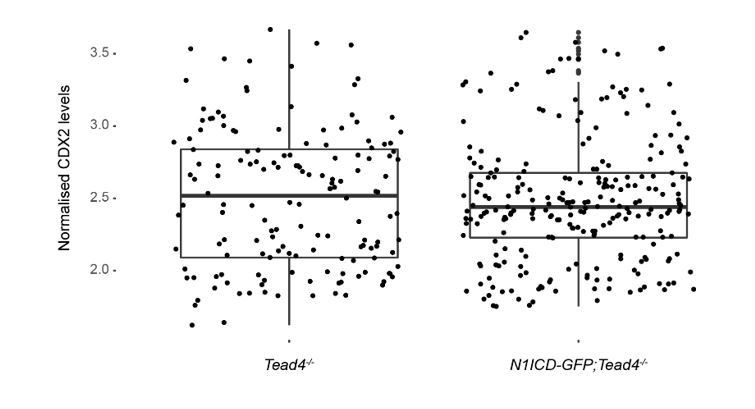
Quantification of CDX2 intensity levels in Tead4-/- (n=153 blastomeres from 3 embryos) and N1ICD-GFP;Tead4-/- (n=224 blastomeres from 5 embryos) embryos.
No significant differences in CDX2 levels was found between the two genotypes.
Author response image 2
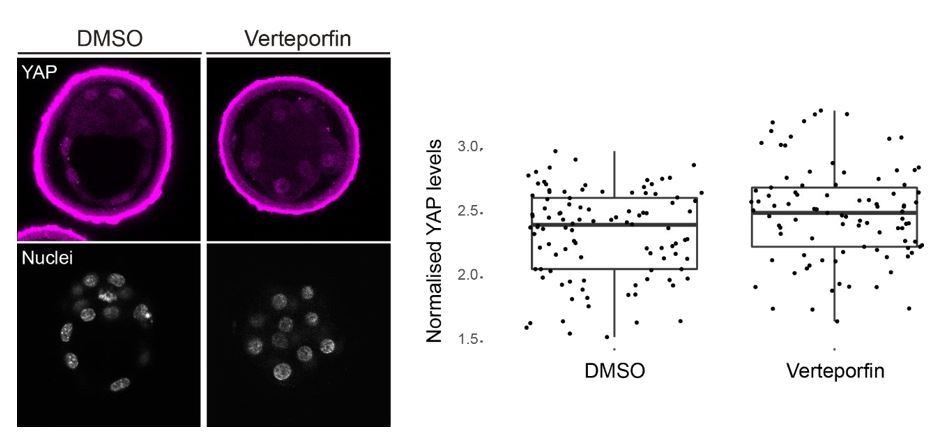
Nuclear localization of YAP is not altered by Verteporfin treatment of preimplantation mouse embryos.
Left, representative images of DMSO (n=3) and Verteporfin (10 µm; n=4) treated embryos stained for YAP; nuclei, stained with DAPI, are shown below. Right, quantification of nuclear YAP levels in DMSO and Verteporfin treated embryos. We observe no difference between treatments.
Videos
Video 1
Time lapse imaging of a mouse embryo from the CBF1-VENUS line during morula to blastocyst transition.
https://doi.org/10.7554/eLife.42930.014
Video 2
3D reconstruction of a mouse embryo from the CBF1-VENUS line after live imaging during morula to blastocyst transition.
https://doi.org/10.7554/eLife.42930.015Tables
Key resources table
| Reagent type (species) or resource | Designation | Source or reference | Identifiers | Additional information |
|---|---|---|---|---|
| Strain (Mus musculus) | CD1 | Charles Rivers | ||
| Strain (Mus musculus) | C57Bl/6 | Charles Rivers | ||
| Strain (Mus musculus) | CBA | Charles Rivers | ||
| Genetic reagent (M. musculus) | CBF1-VENUS | Nowotschin et al., 2013 | MGI:5487911 | Dr. Anna-Katerina Hadjantonakis |
| Genetic reagent (M. musculus) | Rbpj null | Oka et al., 1995 | MGI:1857411 | Dr. Jose Luis de la Pompa |
| Genetic reagent (M. musculus) | Notch1 null | Conlon et al., 1995 | MGI:1857230 | Dr. Jose Luis de la Pompa |
| Genetic reagent (M. musculus) | Tead4 null | Nishioka et al., 2008 | MGI:3770620 | Dr. Hiroshi Sasaki |
| Genetic reagent (M. musculus) | iChr-Control-Mosaic | Pontes-Quero et al., 2017 | MGI:6108166 | Dr. Rui Benedito |
| Genetic reagent (M. musculus) | iChr-Notch-Mosaic | Pontes-Quero et al., 2017 | Dr. Rui Benedito | |
| Genetic reagent (M. musculus) | Polr2a-CreERT2 | Guerra et al., 2003 | MGI:3772332 | Dr. Miguel Torres |
| Cell line (M. musculus) | iChr-Notch-Mosaic ESC | Pontes-Quero et al., 2017 | Dr. Rui Benedito | |
| Antibody | anti-CDX2 (mouse monoclonal) | BioGenex | MU392-UC | (1:200) |
| Antibody | anti-CDX2 (rabbit monoclonal) | Abcam | ab76541 | (1:200) |
| Antibody | anti-YAP (mouse monoclonal) | Santa Cruz Biotechnology | sc-101199 | (1:200) |
| Antibody | anti-pERM (rabbit polyclonal) | Cell Signalling | 3141 | (1:250) |
| Antibody | anti-E-Cadherin (rat monoclonal) | Sigma | U3254 | (1:250) |
| Antibody | anti-TEAD4 (mouse monoclonal) | Abcam | ab58310 | (1:100) |
| Antibody | anti-DsRed (rabbit polyclonal) | Living Colors, Clontech | 632496 | (1:400) |
| Antibody | anti-GFP (goat polyclonal) | Acris, Origene | R1091P | (1:200) |
| Antibody | anti-HA (rat monoclonal) | Sigma | 11867423001 | (1:200) |
| Recombinant DNA reagent | Tle4-up_H2BmRFP | This paper | modified pBluescript vector | |
| Recombinant DNA reagent | Tbx3-i7_H2BmRFP | This paper | modified pBluescript vector | |
| Sequence-based reagent | qPCR primers | This paper | SeeSupplementary file 1 | |
| Commercial assay or kit | PicoPure RNA Isolation Kit | ThermoFisher | KIT0204 | |
| Chemical compound, drug | RO4929097 | Selleckchem | S1575 | |
| Chemical compound, drug | Verteporfin | Sigma | SML0534 | |
| Software, algorithm | MINS | Lou et al., 2014 | ||
| Software, algorithm | GraphPad Prism | www.graphpad.com | RRID:SCR_015807 | |
| Software, algorithm | Fiji | fiji.sc | RRID:SCR_002285 | |
| Software, algorithm | R Project for Statistical Computing | www.r-project.org | RRID:SCR_001905 |
Additional files
-
Supplementary file 1
Primers used in this study.
- https://doi.org/10.7554/eLife.42930.030
-
Transparent reporting form
- https://doi.org/10.7554/eLife.42930.031
Download links
A two-part list of links to download the article, or parts of the article, in various formats.
Downloads (link to download the article as PDF)
Open citations (links to open the citations from this article in various online reference manager services)
Cite this article (links to download the citations from this article in formats compatible with various reference manager tools)
Transitions in cell potency during early mouse development are driven by Notch
eLife 8:e42930.
https://doi.org/10.7554/eLife.42930


