Reward prediction error does not explain movement selectivity in DMS-projecting dopamine neurons

Abstract

Although midbrain dopamine (DA) neurons have been thought to primarily encode reward prediction error (RPE), recent studies have also found movement-related DAergic signals. For example, we recently reported that DA neurons in mice projecting to dorsomedial striatum are modulated by choices contralateral to the recording side. Here, we introduce, and ultimately reject, a candidate resolution for the puzzling RPE vs movement dichotomy, by showing how seemingly movement-related activity might be explained by an action-specific RPE. By considering both choice and RPE on a trial-by-trial basis, we find that DA signals are modulated by contralateral choice in a manner that is distinct from RPE, implying that choice encoding is better explained by movement direction. This fundamental separation between RPE and movement encoding may help shed light on the diversity of functions and dysfunctions of the DA system.

https://doi.org/10.7554/eLife.42992.001

Introduction

A central feature of dopamine (DA) is its association with two apparently distinct functions: reward and movement (Niv et al., 2007; Berke, 2018). Although manipulation of DA produces gross effects on movement initiation and invigoration, physiological recordings of DA neurons have historically shown few neural correlates of motor events (Wise, 2004; Schultz et al., 1997). Instead, classic studies reported responses to rewards and reward-predicting cues, with a pattern suggesting that DA neurons carry a ‘reward prediction error’ (RPE) — the difference between expected reward and observed reward — for learning to anticipate rewards (Schultz et al., 1997; Barto, 1995; Cohen et al., 2012; Coddington and Dudman, 2018; Soares et al., 2016; Hart et al., 2014). In this classic framework, rather than explicitly encoding movement, DA neurons influence movements indirectly by determining which movements are learned and/or determining the general motivation to engage in a movement (Niv et al., 2007; Collins and Frank, 2014; Berke, 2018).

Complicating this classic view, however, several recent studies have suggested that subpopulations of DA neurons may have a more direct role in encoding movement. For example, we recently reported that whereas DA neurons projecting to ventral striatum showed classic RPE signals, a subset of midbrain DA neurons that project to the dorsomedial striatum (DMS) were selective for a mouse’s choice of action (Parker et al., 2016). In particular, they responded more strongly during contralateral (versus ipsilateral) choices as mice performed a probabilistic learning task (Parker et al., 2016). In addition, there have been several other recent studies that reported phasic changes in DA activity at the onset of spontaneous movements (Dodson et al., 2016; Howe and Dombeck, 2016; Howe et al., 2013da Silva et al., 2018; Barter et al., 2015; Syed et al., 2016). Moreoever, other studies have shown that DA neurons may have other forms of apparently non-RPE signals, such as signals related to novel or aversive stimuli (Menegas et al., 2017; Horvitz, 2000; Ungless et al., 2004; Matsumoto and Hikosaka, 2009; Lammel et al., 2011).

These recent observations of movement selectivity leave open an important question: can the putatively movement-related signals be reconciled with Reinforcement Learning (RL) models describing the classic RPE signal? For instance, while it seems plausible that movement-related DA signals could influence movement via directly modulating striatal medium spiny neurons (DeLong, 1990), these signals are accompanied in the same recordings by RPEs which are thought to drive corticostriatal plasticity (Reynolds et al., 2001). It is unclear how these two qualitatively different messages could be teased apart by the recipient neurons. Here we introduce and test one possible answer to this question, which we argue is left open by Parker et al. (2016) results and also by other reports of movement-related DA activity: that these movement-related signals actually also reflect RPEs, but for reward predictions tied to particular movement directions. Specifically, computational models like advantage learning (Baird, 1994) and actor-critic (Barto et al., 1983) learn separate predictions about the overall value of situations or stimuli and about the value of specific actions. It has long been suggested these two calculations might be localized to ventral vs dorsal striatum respectively (Montague et al., 1996; O'Doherty et al., 2004; Takahashi et al., 2008). Furthermore, a human neuroimaging experiment reported evidence of distinct prediction errors for right and left movements in the corresponding contralateral striatum (Gershman et al., 2009).

This leads to the specific hypothesis that putative movement-related signals in DMS-projecting DA neurons might actually reflect an RPE related to the predicted value of contralateral choices. If so, this would unify two seemingly distinct messages observed in DA activity. Importantly, a choice-specific RPE could explain choice-related correlates observed prior to the time of reward. This is because temporal difference RPEs do not just signal error when a reward is received, they also have a phasic anticipatory component triggered by predictive cues indicating the availability and timing of future reward, such as (in choice tasks) the presentation of levers or choice targets (Montague et al., 1996; Morris et al., 2006; Roesch et al., 2007). This anticipatory prediction error is proportional to the value of the future expected reward following a given choice — indeed, we henceforth refer to this component of the RPE as a ‘value’ signal, which tracks the reward expected for a choice. Crucially, a choice-specific value signal can masquerade as a choice signal because, by definition, action and value are closely related to each other: animals are more likely to choose actions that they predict have high value. In this case, a value signal (RPE) for the contralateral choice will tend to be larger when that action is chosen than when it is not (Samuelson, 1938). Altogether, given the fundamental correlation between actions and predicted value, a careful examination of the neural representation of both quantities and a clear understanding of if and how they can be differentiated is required to determine whether or not movement direction signals can be better explained as value-related.

Thus, we examined whether DA signals in DMS-projecting DA neurons are better understood as a contralateral movement signal or as a contralateral RPE. To tease apart these two possibilities, we measured neural correlates of value and lateralized movement in our DA recordings from mice performing a probabilistic learning task. Since value predictions are subjective, we estimated value in two ways: (1) by using reward on the previous trial as a simple, theory-neutral proxy, and (2) by fitting the behavioral data with a more elaborate trial-by-trial Q-learning model. We compared the observed DA modulations to predictions based on modulation either by movement direction and/or the expected value (anticipatory RPE) of contralateral or chosen actions.

Ultimately, our results show that DMS-projecting DA neurons’ signals are indeed modulated by value (RPE), but, crucially, this modulation reflected the value of the chosen action rather than the contralateral one. Thus, the value aspects of the signals (which were not lateralized) could not explain the contralateral choice selectivity in these neurons, implying that this choice-dependent modulation indeed reflects modulation by contralateral movements and not value.

Results

Task, behavior and DA recordings

Mice were trained on a probabilistic reversal learning task as reported previously (Parker et al., 2016). Each trial began with an illumination in the nose port, which cued the mouse to initiate a nose poke (Figure 1a). After a 0–1 second delay, two levers appeared on both sides of the nose port. Each lever led to reward either with high probability (70%) or low probability (10%), with the identity of the high probability lever swapping after a block of variable length (see Materials and methods for more details, Figure 1b). After another 0–1 second delay, the mouse either received a sucrose reward and an accompanying auditory stimulus (positive conditioned stimulus, or CS+), or no reward and a different auditory stimulus (negative conditioned stimulus, or CS-).

Figure 1 with 1 supplement see all
Mice performed a probabilistic reversal learning task during GCaMP6f recordings from VTA/SN::DMS terminals or cell bodies.

(a) Schematic of a mouse performing the task. The illumination of the central nosepoke signaled the start of the trial, allowing the mouse to enter the nose port. After a 0–1 second jitter delay, two levers were presented to the mouse, one of which result in a reward with high probability (70%) and the other with a low probability (10%). The levers swapped probabilities on a pseudorandom schedule, unsignaled to the mouse. (b) The averaged probability of choosing the lever with high value before the switch, 10 trials before and after the block switch, when the identity of the high value lever reversed. Error bars indicate ±1 standard error (n = 19 recording sites). (c) We fit behavior with a trial-by-trial Q learning mixed effect model. Example trace of 150 trials of a mouse's behavior compared to the model’s results. Black bars above and below the plot indicate which lever had the high probability for reward; Orange dots indicate the mouse’s actual choice; Blue dots indicate whether or not mouse was rewarded; Grey line indicates the difference in the model’s Q values for contralateral and ipsilateral choices. (d) Surgical schematic for recording with optical fibers from the GCaMP6f terminals originating from VTA/SN. (e) Example recording from VTA/SN::DMS terminals in a mouse expressing GCaMP6f (top) or GFP (bottom). (f, g) Previous work has reported contralateral choice selectivity in VTA/SN::DMS terminals (Parker et al., 2016) when the signals are time-locked to nose poke (f) and lever presentation (g). ‘Contra’ and ‘Ipsi’ refer to the location of the lever relative to the side of the recording. Colored fringes represent ±1 standard error (n=12 recording sites).

https://doi.org/10.7554/eLife.42992.002

Given that block transitions were not signaled to the mouse, mice gradually learned to prefer the lever with the higher chance of reward after each transition. To capture this learning, we fit their choices using a standard trial-by-trial Q-learning model that predicted the probability of the animal's choice at each trial of the task (Figure 1c, Table 1). In the model, these choices were driven by a pair of decision variables (known as Q-values) putatively reflecting the animal’s valuation of each option.

Table 1
Fitted Parameters for Q-learning model from PyStan.

25th, 50th, and 75th percentile of the alpha, beta, and stay parameters of the Q-learning mixed effect model. These are the the group-level parameters that reflect the distribution of the subject-level parameters.

https://doi.org/10.7554/eLife.42992.004
25th percentile50th percentile (median)75th percentile
Alpha (learning rate)0.5816070.6116930.639946
Beta (inverse temperature)0.9265010.9902751.058405
Stay0.8836700.9453851.008465
Table 1—source data 1

Mixed effect Q-learning model parameters.

Parameters from the mixed effect Q-learning model, including group-level and individual-level parameters, and the mean and range of data across samples from the model. See 'Q Learning Mixed Effect Model' in the Materials and methods section for more details. 

https://doi.org/10.7554/eLife.42992.005

As mice performed this task, we recorded activity from either the terminals or cell bodies of DA neurons that project to DMS (VTA/SN::DMS) using fiber photometry to measure the fluorescence of the calcium indicator GCaMP6f (Figure 1d,e; Figure 1—figure supplement 1a,b). As previously reported, this revealed elevated activity during contralateral choice trials relative to ipsilateral choice trials, particularly in relation to the nose poke and lever presentation events (Figure 1f,g; Figure 1—figure supplement 1c) (Parker et al., 2016).

Predictions of contralateral and chosen value models

In order to examine how value-related activity might (or might not) explain seemingly movement-related activity, we introduced two hypothetical frames of reference by which the DMS DA neurons’ activity may be modulated by predicted value during trial events prior to the outcome: the DA signals could be modulated by the value of the contralateral option (relative to ipsilateral; Figure 2a) or by the value of the chosen option (relative to unchosen; Figure 2b). Note that both of these modulations could be understood as the anticipatory component (occasioned at lever presentation) of a temporal difference RPE, with respect to the respective action’s value.

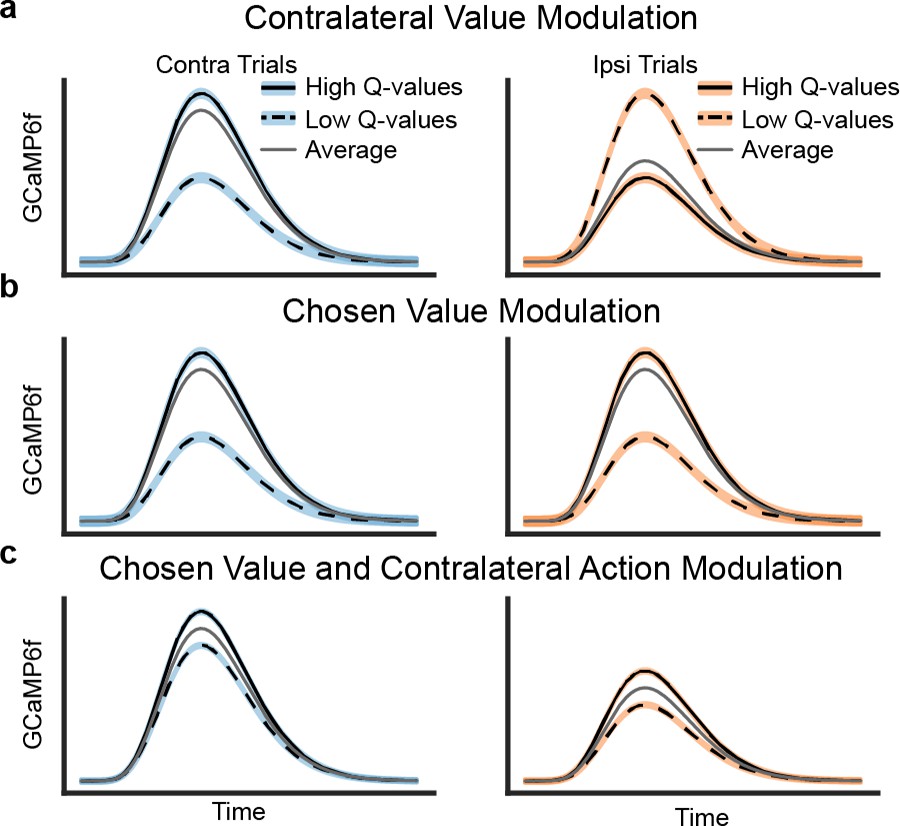
Schematics of three possible types of value modulation at lever presentation.

Trials here are divided based on the difference in Q values for chosen and unchosen action. (a) Contralateral value modulation postulates that the signals are selective for the value of the contralateral action (relative to ipsilateral value) instead of the action chosen. This means that the direction of value modulation should be flipped for contralateral versus ipsilateral choices. Since mice would more often choose an option when its value is higher, the average GCaMP6f signals would be higher for contralateral than ipsilateral choices. (b) Alternatively, the signals may be modulated by the value of the chosen action, resulting in similar value modulation for contralateral and ipsilateral choices. This type of value modulation will not in itself produce contralateral selectivity seen in previous results. (c) However, if the signals were modulated by the chosen value and the contralateral choice, the averaged GCaMP6f would exhibit the previously seen contralateral selectivity.

https://doi.org/10.7554/eLife.42992.006

The first possibility is modulation by the value of the contralateral (relative to ipsilateral) action (Figure 2a; such signals have been reported in human neuroimaging, [Gershman et al., 2009, Palminteri et al., 2009] but not previously, to our knowledge examined in DA recordings in animals). The motivation for this hypothesis is that, if neurons in DMS participate in contralateral movements, such a side-specific error signal would be appropriate for teaching them when those movements are valuable. In this case, the relative value of the contralateral (versus ipsilateral) choice modulates DA signals, regardless of whether the choice is contralateral or ipsilateral. Thus, when the DA signals are broken down with respect to both the action chosen and its value, the direction of value modulation would depend on the choice: signals are highest for contralateral choices when these are relatively most valuable, but lowest for ipsilateral choices when they are most valuable (because in this case, contralateral choices will be relatively less valuable). Assuming mice tend to choose the option they expect to deliver more reward, such signals would be larger, on average, during contralateral choices than ipsilateral ones (Figure 2a), which could in theory explain the contralateral choice selectivity that we observed (Figure 1f,g).

The second possibility is that value modulation is relative to the chosen (versus unchosen) option (Figure 2b). This corresponds to the standard type of ‘critic’ RPE most often invoked in models of DA: that is, RPE with respect to the overall value of the current state or situation (where that state reflects any choices previously made), and not specialized to a particular class of action. Indeed, human neuroimaging studies have primarily reported correlates of the value of the chosen option in DA target areas (Daw et al., 2006; Boorman et al., 2009; Li and Daw, 2011), and this also has been observed in primate DA neurons (Morris et al., 2006).

If DMS-projecting DA neurons indeed display chosen value modulation (Figure 2b), rather than contralateral value modulation, the value modulation for both contralateral and ipsilateral choices would be similar. In this case, value modulation could not in itself account for the neurons’ elevated activity during contralateral trials, which we have previously observed (Figure 1f,g). Therefore, to account for contralateral choice preference, one would have to assume DA neurons are also selective for the contralateral action itself (unrelated to their value modulation; Figure 2c).

DA in dorsomedial striatum is modulated by chosen value, not contralateral value

Next, we determined which type of value modulation better captured the signal in DA neurons that project to DMS by comparing the GCaMP6f signal in these neurons for high and low value trials. We focused on the lever presentation since this event displayed a clear contralateral preference (Figure 1g). As a simple and objective proxy for the value of each action (i.e., the component of the RPE at lever presentation for each action), we compared signals when the animal was rewarded (high value), or not (low value) on the previous trial. (To simplify the interpretation of this comparison, we only included trials in which the mice made the same choice as the preceding trial, which accounted for 76.6% of the trials.) The traces (Figure 3a) indicated that the VTA/SN::DMS terminals were modulated by the previous trial’s reward. The value-related signals reflected chosen value — responding more when the previous choice was rewarded, whether contralateral or ipsilateral — and therefore did not explain the movement-related effect. This indicated that the DMS-projecting DA neurons represented both chosen value and movement direction (similar to Figure 2c). The effect of contralateral action modulation was also visible in individual, non-z-scored data in both VTA/SN::DMS terminals (Figure 3—figure supplement 1) and VTA/SN::DMS cell-bodies (Figure 3—figure supplement 2).

Figure 3 with 7 supplements see all
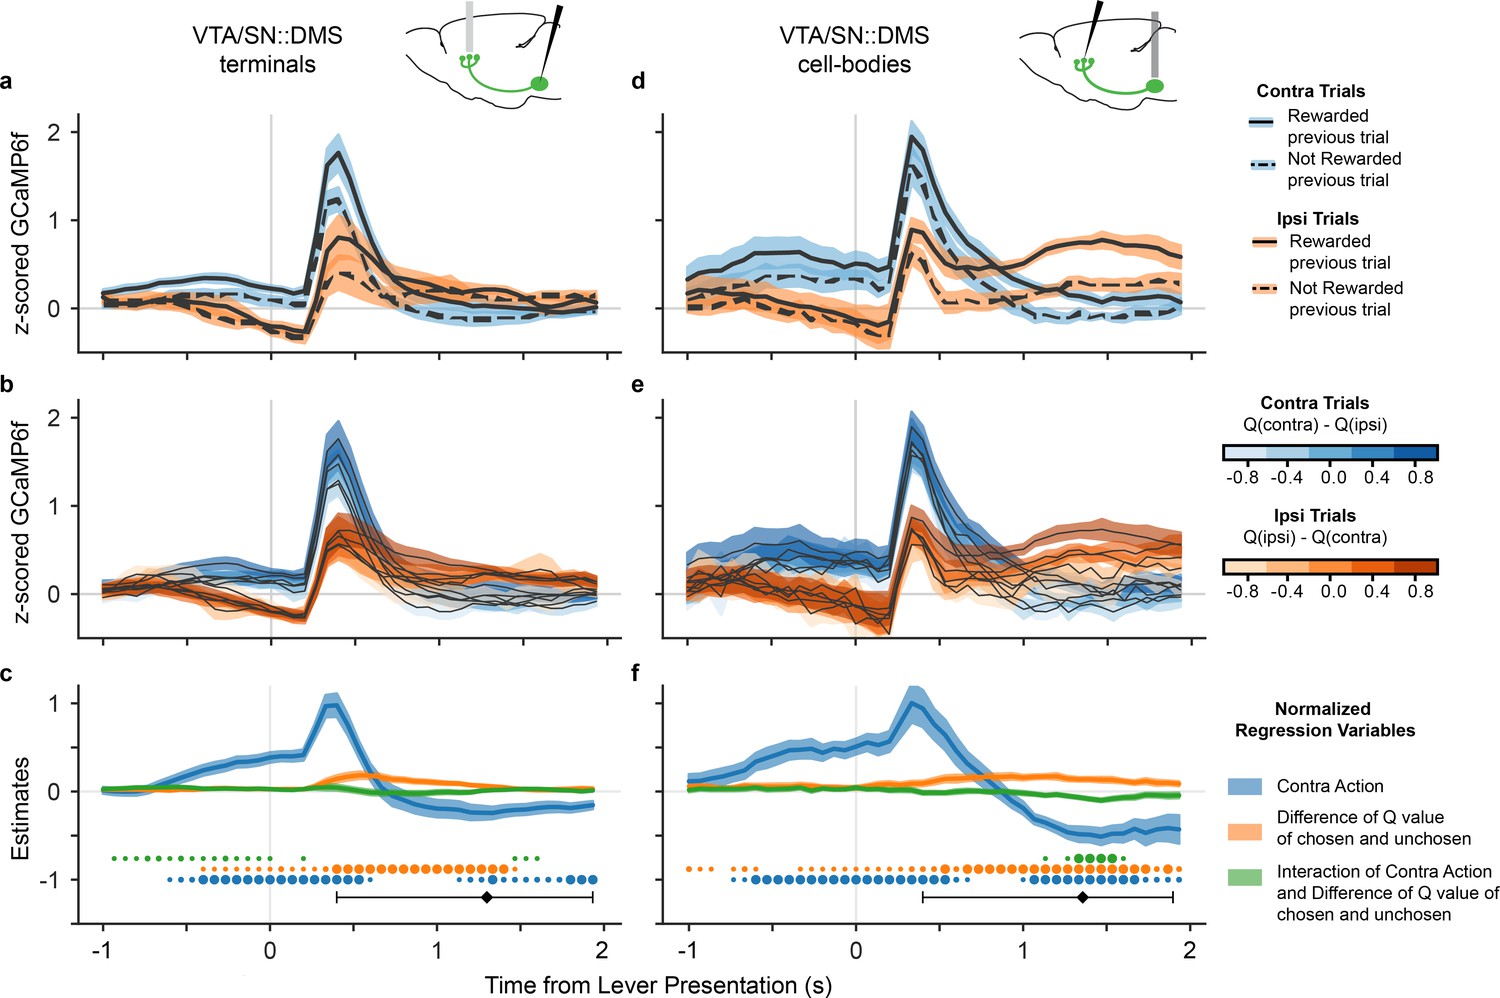
DA neurons that project to DMS were modulated by both chosen value and movement direction.

(a) GCaMP6f signal time-locked to lever presentation for contralateral trials (blue) and ipsilateral trials (orange), as well as rewarded (solid) and non-rewarded previous trial (dotted) from VTA/SN::DMS terminals. Colored fringes represent ±1 standard error from activity averaged across recording sites (n = 12). (b) GCaMP6f signal for contralateral trials (blue) and ipsilateral trials (orange), further binned by the difference in Q values for chosen and unchosen action. Colored fringes represent ±1 standard error from activity averaged across recording sites (n = 12). (c) Mixed effect model regression on each datapoint from 3 seconds of GCaMP6f traces. Explanatory variables include the action of the mice (blue), the difference in Q values for chosen and unchosen actions (orange), their interaction (green), and an intercept. Colored fringes represent ±1 standard error from estimates (n = 12 recording sites). Black diamond represents the average latency for mice pressing the lever, with the error bars showing the spread of 80% of the latency values. Dots at bottom mark timepoints when the corresponding effect is significantly different from zero at p<0.05 (small dot), p<0.01 (medium dot), p<0.001 (large dot). P values were corrected with Benjamini Hochberg procedure. (d-f) Same as (a-e), except with signals from VTA/SN::DMS cell bodies averaged across recording sites (n = 7) instead of terminals.

https://doi.org/10.7554/eLife.42992.007

We repeated this analysis using trial-by-trial Q values extracted from the model, which we reasoned should reflect a finer grained (though more assumption-laden) estimate of the action’s value. (For this analysis, we were able to include both stay and switch trials.) Binning trials by chosen (minus unchosen) value, a similar movement effect and value gradient emerged as we have seen with the previous trial outcome analysis (Figure 3b). Trials with higher Q values had larger GCaMP6f signals, regardless which side was chosen, again suggesting that VTA/SN::DMS terminals were modulated by the expected value of the chosen (not contralateral) action, in addition to being modulated by contralateral movement.

To quantify these effects statistically, we used a linear mixed effects regression at each time point of the time-locked GCaMP6f. The explanatory variables included the action chosen (contra or ipsi), the differential Q values (oriented in the reference frame suggested by the data, chosen minus unchosen), the value by action interaction, and an intercept (Figure 3c). The results verify significant effects for both movement direction and action value; that is, although a significant value effect is seen, it does not explain away the movement effect. Furthermore, the appearance of a consistent chosen value effect across both ipsilateral and contralateral choices is reflected in a significant value effect and no significant interaction during the period when action and value coding are most prominent (0.25–1 seconds after lever presentation), as would have been predicted by the contralateral value model. (There is a small interaction between the variables earlier in the trial, before 0.25 seconds, reflecting small differences in the magnitude of value modulation on contralateral versus ipsilateral trials.) Conversely, when the regression is re-estimated in terms of contralateral value rather than chosen value, a sustained, significant interaction does emerge, providing formal statistical support for the chosen value model; see Figure 3—figure supplement 3.

We performed the same value modulation analyses on the cell bodies, rather than terminals, of VTA/SN::DMS neurons (Figure 3d–f). This was motivated by the possibility that there may be changes in neural coding between DA cell bodies and terminals due to direct activation of DA terminals. In this case, we found very similar modulation by both chosen value and contralateral movement in both recording locations.

To verify the robustness of these findings, we conducted further followup analyses. In one set of analyses, we investigated to what extent the DA signals might be tied to particular events other than the lever presentation. First, we repeated our analyses on DA signals time-locked to nose poke event (Figure 3—figure supplement 4) and found the same basic pattern of effects. The effect was still clearest close to the average lever presentation latency, suggesting that the modulation of DA signals is more closely related to lever presentation. To more directly verify that our conclusions are independent of the specific choice event alignment, we fit a linear regression model with kernels capturing the contribution of three different events (Nose Poke, Lever Presentation, and Lever Press) simultaneously (Figure 3—figure supplement 5). The results of this multiple event regression were consistent with the simpler single-event regression in Figure 3a,d.

Next, we examined a few other factors that might have affected movement-specific activity. Taking advantage of the fact that the VTA/SN::DMS cell-bodies data had recordings from both hemispheres in three animals, we directly compared signals across hemispheres in individual mice and observed that the side-specific effects reversed within animal (Figure 3—figure supplement 6). This speaks against the possibility that they might reflect animal-specific idiosyncrasies such as side biases. Finally, we considered whether the contralateral action modulation might in part reflect movement vigor rather than action value. We addressed this by repeating the analysis in Figure 3c,f, but including as an additional covariate the log lever-press latency as a measure of the action’s vigor. For both VTA/SN::DMS terminals and cell-bodies data, the lever-press latency was not a strong predictor for GCaMP6f signals, and the effect of the original predictors largely remained the same (Figure 3—figure supplement 7).

Direction of movement predicts DMS DA signals

An additional observation supported the interpretation that the contralateral choice selectivity in DMS-projecting DA neurons is related to the direction of movement and not the value of the choice. When the signals were time-locked to the lever press itself, there was a reversal of the signal selectivity between contralateral and ipsilateral trials, shortly after the lever press (Figure 4). Although body tracking is not available, this event coincided with a reversal in the animal’s physical movement direction, from moving towards the lever from the central nosepoke before the lever press, to moving back to the central reward port after the lever press. In contrast, there is no reversal in value modulation at the time of lever press. The fact that the side-specific modulation (and not the value modulation) followed the mice's movement direction during the trial further indicated that movement direction explains the choice selectivity in these DA neurons, and resists explanation in terms of RPE-related signaling.

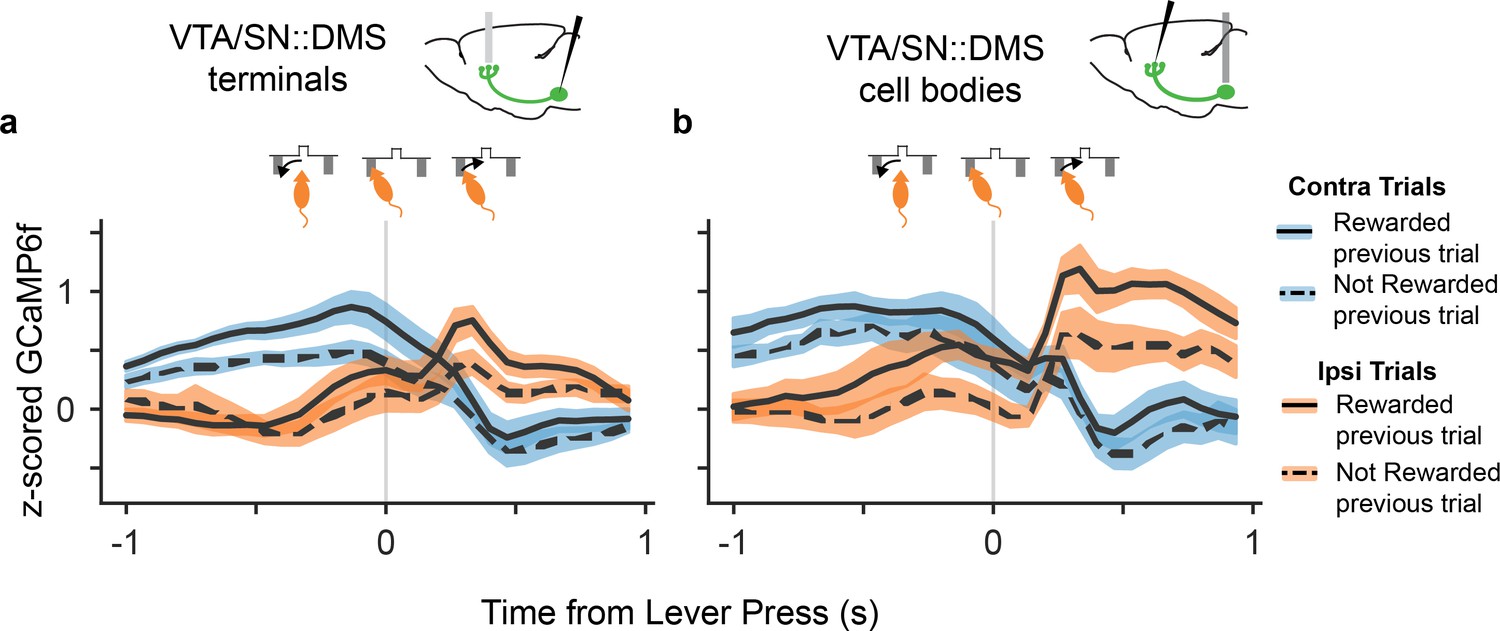
DA neurons that project to DMS reversed their choice selectivity after the lever press, around the time the mice reversed their movement direction.

(a). GCaMP6f signal from VTA/SN::DMS terminals time-locked to the lever press, for contralateral choice trials (blue) and ipsilateral choice trials (orange), as well as rewarded (solid) and non-rewarded previous trial (dotted). The GCaMP6f traces for each choice cross shortly after the lever-press, corresponding to the change in the mice's head direction around the time of the lever press (shown schematically above the plot). Colored fringes represent ±1 standard error from activity averaged across recording sites (n = 12). (b) Same as (a), except with signals from VTA/SN::DMS cell bodies averaged across recording sites (n = 7) instead of terminals.

https://doi.org/10.7554/eLife.42992.015

Discussion

Recent reports of qualitatively distinct DA signals — movement and RPE-related — have revived perennial puzzles about how the system contributes to both movement and reward, and more specifically raise the question whether there might be a unified computational description of both components in the spirit of the classic RPE models (Parker et al., 2016; Berke, 2018; Coddington and Dudman, 2018; Syed et al., 2016). Here we introduce and test one possible route to such a unification: action-specific RPEs, which could explain seemingly action-selective signals as instead reflecting RPE related to the value of those actions. To investigate this possibility, we dissected movement direction and value selectivity in the signals of terminals and cell bodies of DMS-projecting DA neurons (Figure 3). Contrary to the hypothesis that lateralized movement-related activity might reflect a RPE for contralateral value, multiple lines of evidence clearly indicated that the neurons instead contain distinct movement- and value-related signals, tied to different frames of reference. We did observe value-related signals preceding and following the lever press, which we did not previously analyze in the DMS signal and which are consistent with the anticipatory component of a classic RPE signal (Parker et al., 2016). But because these were modulated by the value of the chosen action, not the contralateral one, they cannot explain the side-specific movement selectivity. The two signals also showed clearly distinct time courses; in particular, the side selectivity reversed polarity following the lever press, but value modulation did not.

Our hypothesis that apparently movement-related DA correlates might instead reflect action-specific RPEs (and our approach to test it by contrasting chosen vs. action-specific value) may also be relevant to other reports of DAergic movement selectivity. For example, Syed et al. recently reported that DA release in the nucleus accumbens (NAcc) was elevated during ‘go’, rather than ‘no-go’, responses, alongside classic RPE-related signals (Syed et al., 2016). This study in a question analogous to the one we raise about Parker’s (Parker et al., 2016) DMS results: could NAcc DA instead reflect an RPE specific for ‘go’ actions? This possibility would be consistent with the structure’s involvement in appetitive approach and invigoration (Parkinson et al., 2002), and might unify the RPE- and ‘go’-related activity reported there via an action-specific RPE (argument analogous to Figure 2a). The analyses in the Syed et al. study did not formally compare chosen- vs. action-specific value, and much of the reward-related activity reported there appears consistent with either account (Syed et al., 2016). However, viewed from the perspective of our current work, the key question becomes whether the value-related DA signals on ‘go’ cues reverses for ‘no-go’ cues, as would be predicted for an action-specific RPE. There is at least a hint (albeit significant only at one timepoint in Syed et al.’s Supplemental Figure 9E) that it does not do so (Syed et al., 2016). This suggests that NAcc may also have parallel movement-specific and chosen value signals, which would be broadly confirmatory for our parallel conclusions about DMS-projecting DA neurons.

The RPE account of the DA signal has long held out hope for a unifying perspective on the system’s dual roles in movement and reward by proposing that the system’s reward-related signals ultimately affect movement indirectly, either by driving learning about movement direction preferences (Montague et al., 1996) or by modulating motivation to act (Niv et al., 2007). This RPE theory also accounts for multiple seemingly distinct components of the classic DA signal, including anticipatory and reward-related signals, and signals to novel neutral cues. However, the present analyses clearly show that side-specific signals in DMS resist explanation in terms of an extended RPE account, and may instead simply reflect planned or ongoing movements.

Specifically, our results are consistent with the longstanding suggestion that DA signals may be important for directly initiating movement. Such a signal may elicit or execute contralateral movements via differentially modulating the direct and indirect pathways out of the striatum (Alexander and Crutcher, 1990; Collins and Frank, 2014; DeLong, 1990). The relationship between unilateral DA activity and contralateral movements is also supported by causal manipulations. For instance, classic results demonstrate that unilateral 6-hydroxydopamine (6-OHDA) lesions increase ipsilateral rotations (Costall et al., 1976; Ungerstedt and Arbuthnott, 1970). Consistent with those results, a recent study reports that unilateral optogenetic excitation of midbrain DA neurons in mice led to contralateral rotations developed over the course of days (Saunders et al., 2018). Importantly, however, our own results are correlational, and we cannot rule out the possibility that the particular activity we study could be related to a range of functions other than movement execution, such as planning or monitoring. Another function that is difficult to distinguish from movement execution is the motivation to move. Although motivation is a broad concept and difficult to operationalize fully, our results address two aspects of it. First, one way to quantify the motivation to act is by the action’s predicted value; thus, our main result is to rule out the possibility that neural activity is better accounted for by this motivational variable. We also show that lever press latency (arguably another proxy for motivation) does not explain the contralateralized DA signals (Figure 3—figure supplement 7).

Although the movement-related DA signal might be appropriate for execution, it is less clear how it might interact with the plasticity mechanisms hypothesized to be modulated by RPE aspects of the DA signal (Frank et al., 2004; Steinberg et al., 2013; Reynolds and Wickens, 2002). For instance, how would recipient synapses distinguish an RPE component of the signal (appropriate for surprise-modulated learning) from an overlapping component more relevant to movement elicitation (Berke, 2018)? We have ruled out the possibility that the activity is actually a single RPE for action value, but there may still be other sorts of plasticity that might be usefully driven by a purely movement-related signal. One possibility is that plasticity in the dorsal striatum itself follows different rules, which might require an action rather than a prediction error signal (Saunders et al., 2018; Yttri and Dudman, 2016) For instance, it has been suggested that some types of instrumental learning are correlational rather than error-driven (Doeller et al., 2008) and, more specifically, an early model of instrumental learning (Guthrie, 1935) recently revived by (Miller et al., 2019) posits that stimulus-response habits are not learned from an action’s rewarding consequences, as in RPE models, but instead by directly memorizing which actions the organism tends to select in a situation. Although habits are more often linked to adjacent dorsolateral striatum (Yin et al., 2004), a movement signal of the sort described here might be useful to drive this sort of learning. Investigating this suggestion will likely require new experiments centered around causal manipulations of the signal. Overall, our results point to the need for an extended computational account that incorporates the movement direction signals as well as the RPE ones.

Another striking aspect of the results is the co-occurrence of two distinct frames of reference in the signal. Lateralized movement selectivity tracks choices contralateral versus ipsilateral of the recorded hemisphere — appropriate for motor control — but the value component instead relates to the reward expected for the chosen, versus unchosen, action. This value modulation by the chosen action is suitable for a classic RPE for learning ‘state’ values (since overall value expectancy at any point in time is conditioned on the choices the animal has made; Morris et al., 2006), and also consistent with the bulk of BOLD signals in human neuroimaging, where value-related responding throughout DAergic targets tends to be organized on chosen-vs-unchosen lines (Daw et al., 2006; Boorman et al., 2009; Li and Daw, 2011; O'Doherty, 2014).

At the same time, there have been persistent suggestions that given the high dimensionality of an organism’s action space, distinct action-specific error signals would be useful for learning about different actions (Russell and Zimdars, 2003; Frank and Badre, 2012; Diuk et al., 2013) or types of predictions (Gardner et al., 2018; Lau et al., 2017). Along these lines, there is evidence from BOLD neuroimaging for contralateral error and value signals in the human brain (Gershman et al., 2009; Palminteri et al., 2009). Here, we have shown how a similar decomposition might explain movement-related DA signals, and also clarified how this hypothesis can be definitively tested. Although the current study finds no evidence for such laterally decomposed RPEs in DMS, the decomposition of error signals remains an important possibility for future work aimed at understanding heterogeneity of DA signals, including other anomalous features like ramps (Howe et al., 2013Berke, 2018Gershman, 2014Hamid et al., 2016Engelhard et al., 2018). Recent studies, for instance, have shown that midbrain DA neurons may also encode a range of behavioral variables, such as the mice’s position, their velocity, their view-angle, and the accuracy of their performance (da Silva et al., 2018; Howe et al., 2013 Engelhard et al., 2018). Our modeling provides a framework for understanding how these DA signals might be interpreted in different reference frames and how they might ultimately encode some form of RPEs with respect to different behavioral variables in the task.

Interestingly, our results were consistent across both recording sites with DMS-projecting DA neurons: the cell bodies and the terminals (Figure 3d–f, Figure 4b). This indicates that the movement selectivity is not introduced in DA neurons at the terminal level, for example via striatal cholinergic interneurons or glutamatergic inputs (Kosillo et al., 2016).

An important limitation of the study is the use of fiber photometry, which assesses bulk GCaMP6f signals at the recording site rather than resolving individual neurons. Thus it remains possible that individual neurons do not multiplex the two signals we observe, and that they are instead segregated between distinct populations. Future work should use higher resolution methods to examine these questions at the level of individual DA neurons. A related limitation of this study is the relatively coarse behavioral monitoring; notably, we infer that the reversal in selectivity seen in Figure 4 reflects a change in movement direction, but head tracking would be required to verify this more directly. More generally, future work with finer instrumentation could usefully dissect signal components related to finer-grained movements, and examine how these are related to (or dissociated from) value signals.

Materials and methods

Mice and surgeries

Request a detailed protocol

This article reports new analysis on data originally reported by (Parker et al., 2016). We briefly summarize the methods from that study here. This article reports on data from 17 male mice expressing Cre recombinase under the control of the tyrosine hydroxylase promoter (ThIRES-Cre), from which GCaMP6f recordings were obtained from DA neurons via fiber photometry.

In the case of DA terminal recordings, Cre-dependent GCaMP6f virus (AAV5-CAG-Flex-GCamp6f-WPRE-SV40; UPenn virus core, 500nL, titer of 3.53 × 1012 pp ml) was injected into the VTA/SNc, and fibers were placed in the DMS (M–L ± 1.5, A–P 0.74 and D–V −2.4 mm), with one recording area per mouse (n = 12 recording sites). The recording hemisphere was counterbalanced across mice. The mice were recorded bilaterally, with the second site in nucleus accumbens, which is not analyzed in this paper.

In the case of VTA/SN::DMS cell body recordings, Cre-dependent GCaMP6f virus (AAV5-CAG-Flex-GCamp6f-WPRE-SV40; UPenn virus core, 500nL, titer of 3.53 × 1012 pp ml) was injected into the DMS, and fibers were placed on the cell bodies in VTA/SNc (M–L ± 1.4, A–P 0.74, D–V −2.6 mm) to enable recordings from retrogradely labeled cells (n = 4 mice). Three of the mice were recorded from both hemispheres, providing a total of n = 7 recording sites.

One mouse was used for the GFP recordings as a control condition for VTA/SNc::DMS terminals recordings (Figure 1e).

Instrumental reversal learning task

Request a detailed protocol

The recordings were obtained while the mouse performed a reversal learning task in an operant chamber with a central nose poke, retractable levers on each side of the nose poke, and reward delivery in a receptacle beneath the central nose poke.

Each trial began with the illumination of the center nose port. After the mouse entered the nose port, the two levers were presented with a delay that varied between 0–1 second. The mouse then had 10 seconds to press a lever, otherwise the trial was classified as an abandoned trial and excluded from analysis (this amounted to <2% of trials for all mice). After the lever-press, an additional random 0–1 second delay (0.1 seconds intervals, uniform distribution) preceded either CS- with no reward delivery or CS+ with a 4 µl reward of 10% sucrose in H20. Reward outcomes were accompanied by different auditory stimul: 0.5 seconds of white noise for CS- and 0.5 seconds of 5 kHz pure tone for CS+. Every trial ended with a 3 seconds inter-trial delay (after the CS- auditory stimulus or the mice exit the reward port).

For the reversal learning, each of the levers either had a high probability for reward (70%) or low probability for reward (10%). Throughout the session, the identity of the high probability lever changed in a pseudorandom schedule; specifically, each block consisted of at least 10 rewarded trials plus a random number of trials drawn from a Geometric distribution of p=0.4 (mean 2.5). On average, there were 23.23 ± 7.93 trials per block and 9.67 ± 3.66 blocks per session. Both reported summary statistics are mean ± standard deviation.

Data processing

Request a detailed protocol

All fiber photometry recordings were acquired at 15 Hz. 2–6 recording sessions were obtained per recording site (one session/day), and these recordings were concatenated across session for all analyses. On average, we had 1307.0 ± 676.01 trials per mouse (858.09 ± 368.56 trials per mouse for VTA/SN::DMS Terminals recordings and 448.91 ± 455.61 trials per mouse for VTA/SN::DMS Cell-bodies recordings).

The signals from each recording site were post-processed with a high-pass FIR filter with a passband of 0.375 Hz, stopband of 0.075 Hz, and a stopband attenuation of 10 dB to remove baseline fluorescence and correct drift in baseline. We derived dF/F by dividing the high-pass filtered signal by the mean of the signal before high-pass filtering. We then z-scored dF/F for each recording site, with the the mean and standard error calculated for the entire recording from each site.

The VTA/SN::DMS terminals data consisted of 10108 total trials across 12 recording sites, and VTA/SN::DMS cell-bodies consisted of 4938 total trials across 7 recording sites.

Q learning mixed effect model

Request a detailed protocol

We fit a trial-by-trial Q-learning mixed effect model to the behavioral data from each of the 12 mice on all recording sites and combined data across mice with a hierarchical model. The model was initialized with a Q value of 0 for each action and updated at each trial according to:

Qt+1(ct)=Qt(ct)+α(rtQt(ct))

where Q is the value for both options, ct is the option chosen on trial t (lever either contralateral or ipsilateral to recording site), and 0 <= α <= 1 is a free learning rate parameter. The subject's probability to choose choice c was then given by a softmax equation:

P(ct=c)exp(βQt(c)+stayI(c,ct1))

where β is a free inverse temperature parameter, stay is a free parameter encoding how likely the animal will repeat its choice from the last trial, and I is a binary indicator function for choice repetition (1 if c was chosen on the previous trial; 0 otherwise). The three free parameters of the model were estimated separately for each subject, but jointly (in a hierarchical random effects model) with group-level mean and variance parameters reflecting the distribution, over the population, of each subject-level parameter.

The parameters were estimated using Hamiltonian Monte Carlo, as implemented in the Stan programming language (version 2.17.1.0; Carpenter et al., 2017). Samples from the posterior distribution over the parameters were extracted using the Python package PyStan (Carpenter et al., 2017). We ran the model with 4 chains of 1000 iterations for each (of which the first 250 were discarded for burn-in), and the parameter adapt_delta set to 0.99. We verified convergence by visual inspection and by verifying that the potential scale reduction statistic Rhat (Gelman and Rubin, 1992) was close to 1.0 (<0.003 for all parameters) (Table 1).

We used the sampled parameters to compute per-trial Q values for each action, trial, and mouse. We calculated the difference between the Q values for the chosen action and unchosen action for each trial. We binned the difference in these Q values for each trial and plotted the average GCaMP6f time-locked to lever presentation for each bin (Figure 3b,e).

Regression model

Request a detailed protocol

In Figure 3c,f, we performed a linear mixed effect model regression to predict GCaMP6f signal at each time point based on Q-values, choice (contralateral vs ipsilateral), their interaction, and an intercept. We took the difference in Q values for the chosen vs unchosen levers, then we standardized the difference in Q values for each mouse and each recording site. GCaMP6f was time-locked to lever presentation, regressing to data points 1 second before and 2 seconds after the time-locked event for 45 total regressions. The regression, as well as the calculation of p values, was performed with the MixedModels package in Julia (Bezanson et al., 2014). The p values were corrected for false discovery rate over the ensemble of timepoints for each regression variable separately, using the procedure of Benjamini and Hochberg (Benjamini and Hochberg, 1995) via the MultipleTesting package in Julia (Bezanson et al., 2014).

Multiple event kernel analysis

Request a detailed protocol

In Figure 3—figure supplement 5, we fit a linear regression model to determine the contributions to the ongoing GCaMP6f signal of three simultaneously modeled events (nose poke, lever presentation, lever press). To do this, we used kernels, or sets of regressors covering a series of time lags covering the period from 1 second before to 2 seconds after each event. Each event had four kernels, corresponding to the four conditions from Figure 3a,c (all combinations of contralateral vs ipsilateral trials and previous reward vs no previous reward trials). We solved for the kernels by regressing the design matrix against GCaMP6f data using least squares in R with the rms package (Harrell, 2018). The standard error (colored fringes) was calculated using rms’ robcov (cluster robust-covariance) function to correct for violations of ordinary least squares assumptions due to animal-by-animal clustering in the residuals.

Data availability

All data generated or analysed during this study are included in the manuscript and supporting files.

References

  1. Conference
    1. Baird LC
    (1994) Reinforcement learning in continuous time: advantage updating
    Proceedings of 1994 IEEE International Conference on Neural Networks (ICNN’94). pp. 2448–2453.
    https://doi.org/10.1109/ICNN.1994.374604
    1. Barto AG
    (1995)
    Models of Information Processing in the Basal Ganglia
    1 ‘1 Adaptive Critics and the Basal Ganglia, Models of Information Processing in the Basal Ganglia, MIT Press.
  2. Book
    1. Guthrie ER
    (1935)
    Psychology of Learning
    Oxford, England: Harper.
    1. Russell S
    2. Zimdars AL
    (2003)
    Proceedings of the Twentieth International Conference on International Conference on Machine Learning
    656–663, Q-Decomposition for Reinforcement Learning Agents, Proceedings of the Twentieth International Conference on International Conference on Machine Learning, Washington, DC, USA, AAAI Press.

Decision letter

  1. Timothy E Behrens
    Senior Editor; University of Oxford, United Kingdom
  2. Geoffrey Schoenbaum
    Reviewing Editor; National Institute on Drug Abuse, National Institutes of Health, United States
  3. Geoffrey Schoenbaum
    Reviewer; National Institute on Drug Abuse, National Institutes of Health, United States
  4. Ingo Willuhn
    Reviewer

In the interests of transparency, eLife includes the editorial decision letter and accompanying author responses. A lightly edited version of the letter sent to the authors after peer review is shown, indicating the most substantive concerns; minor comments are not usually included.

Thank you for submitting your article "Value representations do not explain movement selectivity in DMS-projecting dopamine neurons" for consideration by eLife. Your article has been reviewed by three peer reviewers, including Geoffrey Schoenbaum as the Reviewing Editor and Reviewer #1, and the evaluation has been overseen by Timothy Behrens as the Senior Editor. The following individual involved in review of your submission has agreed to reveal their identity: Ingo Willuhn (Reviewer #3).

The reviewers have discussed the reviews with one another and the Reviewing Editor has drafted this decision to help you prepare a revised submission.

Summary:

This study involves a reanalysis of data published previously (Parker et al., 2016), examining signaling in DMS-projecting dopamine neurons in mice performing a probabilistic reversal task. Bulk Ca++ signaling was recorded from cell bodies and terminals in DMS using fiber photometry, and activity was examined for correlates of RPE's versus movement direction. In the new analyses, the authors show in more detail than previously that these dopamine neurons carry a movement or action related signal in addition to the RPE signal.

Essential revisions:

The reviewers agreed that the new results provide potentially important new information regarding movement-related dopaminergic correlates. Generally however each reviewer had some difficulties following methodological details necessary to fully evaluate the new data. While the details differ across the reviews, the general issue was a lack of clarity regarding what was analyzed. The additional details might also include additional analyses looking at data before the lever press or versus baseline (reviewer 2) and analyses showing that the relatively high remaining probability for contralateral lever presses at 0.35-0.4 (Figure 1B) is not a problem (first point, reviewer 3). Finally, the reviewers also felt that more needed to be done in the Introduction and Discussion to make clear what was new here, and also in the Discussion to relate the current findings to other data that has been presented regarding movement correlates.

Reviewer #1:

In the current study the authors examine dopamine signaling in DMS projecting midbrain neurons in mice performing a probabilistic reversal task. Bulk Ca++ signaling was recorded from cell bodies and terminals in DMS using fiber photometry, and activity was examined for correlates of RPE's versus movement direction. The authors report that both signals were observed in both locations. They conclude that dopamine neurons carry a movement or action related signal in addition to the RPE signal. The results are of potential significance given the historical involvement of dopamine in movement function, which has been eclipsed by the error signaling function in recent years, along with the increasing evidence that the RPE hypothesis does not fully explain phasic dopaminergic signaling. Finding of action correlates, particularly if they could be argued to be action-related error signals, would be quite interesting. That said I have a conceptual question and several methodological concerns.

Conceptually, I think what is most interesting is the possibility this is an error-related signal that is simply not in the value domain. This possibility is alluded to in the Discussion. But not much is said there, nothing is said earlier, and it is unclear to me what evidence there is for this? Did I understand this right? Is there evidence? If I did and there is not, can the authors expand on this speculation and what experiment would show it? This is very important because otherwise it is not clear to me where this study goes beyond other studies, such as the prior Witten report or the one by Walton. A paragraph reviewing and contrasting this result with those would help also.

Methodologically, I am concerned because I may not be following where the trials are coming from with the sparse design. The mice are performing a choice task in which there is a high value on one side and low value on the other. The location of the high value option switches frequently, it looks like after 40ish trials. And on each trial the mouse is free to go in either direction. As a result, most of the responses in one direction are early in a block, whereas most of the responses in the other direction are late in the block. There are no forced trials, so this results in a dramatic asymmetry in where the relevant data comes from in a block it seems to me. In other words, in any block the comparison is largely between trials in one direction early in learning (or before) and the other mostly late (after) learning. Further, the comparison is made between trials after a rewarded trial and trials after a non-rewarded trial. Given the different probabilities, if the directions are not segregated, then there will be an asymmetry here also, since there will be many more trials after reward on the 70% reward schedule and many more trials after non-reward on the 10% reward schedule. Of course, I realize the authors know this, but the manuscript does not explain well how this is handled. If possible, I'd like a clean comparison of trials matched for the stage of task to show the effect. If this is not possible, then if the shape of the data can be made more clear and how these issues are handled, that might be sufficient. But a naïve reader who is not deeply familiar with the task, as the authors are, needs to be able to understand where the trials are coming from. At present, I could not do this.

Reviewer #2:

This study involves a deeper analysis of a previously published data set from the Witten group concerning the correlates of dopamine axonal activity in dorsomedial striatum. The previous paper reported direction specific effects in DMS (but not ventral striatal) axons and DMS-projecting cell bodies; the current study investigates whether the DMS dopamine represents a signal more closely aligned to the relative value of making an ipsilateral v contralateral action or the value of the chosen response (interacting with action). The authors' analyses point towards a conclusion that the dopamine signal is shaped by the value of the chosen action and by the direction of movement.

The original finding of a direction specific dopamine response was already interesting, and this study certainly finesses that result in a clean manner. However, I was not entirely convinced of how much this really advances from the original finding to tell us what dopamine is doing.

The different predictions are nicely set out in Figure 2 (though it might be best not to include the "chosen value modulation" option here given it is already a non-starter for DMS dopamine based on the Parker data set) and one model is clearly supported based on the data are presented in Figure 3. But what the authors focus on – is the dopamine best described as RPE x action or chosen value x action – struck me as rather small scale, particularly given there is much more evidence for dopamine encoding chosen value in some form. While I found this an interesting conclusion, it seemed hardly like it would really help advance the ongoing and passionate RPE v movement debates.

Moreover, it appears as if there is a lot more in these data than is remarked upon. For instance, there appears already to be a meaningful relationship between dopamine activity and the animal's upcoming action in the pre-lever period. Indeed, at least in the cell bodies, if you account for this baseline shift – and what the baseline is in these analyses was never clearly defined for me – the phasic action component looks like it would be much weaker at the time of lever extension. This interaction between timescales is worth considering and commenting on in more detail, particularly in the light of the Hamid/Berke findings that what can look like an RPE when baselined pre-event of interest might look very different if a baseline is taken at an earlier timepoint. Another important idea that was not specifically addressed was whether dopamine activity reflects the reward prediction or the vigour of the (contralateral) action. Is there enough variance between the Q value and, say, initiation speed to include that as an additional regressor? The chosen minus unchosen value signals come pretty late given the speed of the GCaMP6f, so what is actually driving these here?

Reviewer #3:

The authors investigated the activity of dopamine neurons that project from the midbrain to the dorsomedial striatum (DMS) during a probabilistic instrumental reversal-learning task in mice using fiber photometry for calcium imaging of both neuron terminals in the DMS and cell bodies in the midbrain. Specifically, they explored dopamine neuron activity during the time when choices were made towards an operandum of the Skinner box located contralaterally to the recording site in the brain. This data had been published in Nature Neuroscience previously (Parker et al., 2016), but in that publication the authors had not studied the reported modulation of DMS-projecting neurons by contralateral choices in as much depth as they do here. Here, the authors aimed at determining whether these signals are related to movement or contralateral reward prediction errors (RPEs). The authors report that dopamine neuron activity modulated by contralateral choices is distinct from RPEs, which according to them implies that it is better explained by movement direction.

The topic of this study is of great interest to the fields of behavioral and computational neuroscience, as the mechanisms by which regional differences in dopamine signaling contribute to behavioral flexibility are still not understood. The authors conducted sophisticated and computationally challenging analyses that deliver highly interesting findings. It speaks for their thoroughness that results were assessed on both the level of terminals and cell bodies. Furthermore, experimental design and data presentation are sound, and the manuscript is well-written. However, I have a few concerns:

- A remaining probability for contralateral lever presses at 0.35-0.4 (Figure 1B), 7-10 trials after the ipsilateral lever has become the high-probability option, seems quite high. Especially, since probability for choosing the contralateral lever, when it is the high-probability option, gets to around 0.9. Is the animals' behavior towards the two sides comparable? Is there a bias? This is essential for the analyses performed (e.g., if the number of rewarded trials is different, interpreting how trial history affects activity becomes more difficult). The authors need to both test and discuss this.

- Can the authors exclude that the position of the optic fiber on the skull (and attached equipment; above left or right hemisphere) contributed to contralateral movements being different in their execution compared to ipsilateral movements? In other words, did implanting on one side of the skull influence the animals' balance or their ability to move in any direction due to tethering or did animals' heads tilt towards or away from the implant (due to weight or torque)? A photo of the setup including a connected animal performing in the task may prove useful in this context.

- The authors frequently refer to movement signals. Can the authors distinguish between movement and motivation?

- Does the contralateral movement-related calcium signal correlate with lever-press latency (on a trial-by-trial basis)?

- In the Discussion, the authors should speculate on how unilateral dopamine neuron signals affect the contralateral side of the body (e.g., limbs or else) in order to initiate/support/perform a movement. This is a central part of the conclusion, if I am not mistaken, and should be honored with a speculation on how this may be implemented in terms of functional neuroanatomy. Also, rotation behavior after 6-OHDA lesion should be addressed in this context.

- In the Materials and methods section, it is stated that 1-5 recordings were obtained per recording site. Does that mean that some animals contributed a lot more data than others? For example, 10.108 "terminal" trials were recorded. That makes about 840 per animal on average. Is that roughly the average number of trials per animal? If not, it should be reported.

https://doi.org/10.7554/eLife.42992.025

Author response

Essential revisions:

The reviewers agreed that the new results provide potentially important new information regarding movement-related dopaminergic correlates. Generally however each reviewer had some difficulties following methodological details necessary to fully evaluate the new data. While the details differ across the reviews, the general issue was a lack of clarity regarding what was analyzed. The additional details might also include additional analyses looking at data before the lever press or versus baseline (reviewer 2) and analyses showing that the relatively high remaining probability for contralateral lever presses at 0.35-0.4 (Figure 1B) is not a problem (first point, reviewer 3). Finally, the reviewers also felt that more needed to be done in the Introduction and Discussion to make clear what was new here, and also in the Discussion to relate the current findings to other data that has been presented regarding movement correlates.

Thank you so much for the feedback. We have included more details on the set up and structure of the reversal learning task in order to help clear up any confusion on the methodological details.

We addressed reviewer 2’s request with additional analyses on the data time-locked to the nose poke event and also using a multiple event regression that does not a priori choose which event to time-lock the GCaMP6f. Our regression model instead characterized the response as arising from contributions linked to each task event (nose poke, lever presentation, lever press), each captured with a separate kernel. We showed that this analysis supports our original results.

In addition, we performed additional analyses showing that the mice did not have a direction or reward bias before or after a block switch. For reviewer 3’s specific concern, we showed that the higher preference for the contralateral side is not an issue: the way the data was depicted previously gave a misleading impression, but overall the behavior around the time of both types of block switches (contralateral to ipsilateral and vice versa) is very similar.

Finally, we expanded our literature review in our Introduction and Discussion to include relevant findings, how they relate to our results, and how our results are novel in comparison. We appreciate the reviewers’ helpful comments, which helped us greatly improve our manuscript with further analyses that helped solidify our results.

We included a number of additional figures and results in this letter; although we are open to advice on this point, we have not included some of them in the supplementary material for the paper because, should the paper be accepted, we understand the response would also be published.

Reviewer #1:

[…] Conceptually, I think what is most interesting is the possibility this is an error-related signal that is simply not in the value domain. This possibility is alluded to in the Discussion. But not much is said there, nothing is said earlier, and it is unclear to me what evidence there is for this? Did I understand this right? Is there evidence? If I did and there is not, can the authors expand on this speculation and what experiment would show it? This is very important because otherwise it is not clear to me where this study goes beyond other studies, such as the prior Witten report or the one by Walton. A paragraph reviewing and contrasting this result with those would help also.

Thank you for this comment, and in particular for bringing up the Walton study, which leaves open very similar interpretational questions as the ones we address from Parker’s study. The Parker and Walton studies each report correlates in DA activity of both value expectation and of action identity. Whereas Parker shows that DA activity in DMS is elevated for contralateral choices; Walton shows that NAcc DA activity is elevated for “go” responses relative to “no-go”. While both of these articles show in different ways that the activity also reflects more conventional RPEs related to overall reward expectancy (i.e. PEs in state values V(s), which are sensitive in Walton’s case to things like cues about reward size), both leave open a central interpretational question about the action-related responses that is, to our knowledge, first clearly identified and also first decisively addressed in the current study.

This interpretational question is whether the apparently action-related responses are truly related to the action identity in a categorical sense, or whether they might actually instead be, in effect, artifacts of action-specific error signals (e.g., PEs for action values Q(s,a), sensitive to predictions about the value of a particular action in a situation). In Parker’s case, if DMS selectively processes value for contralateral movements, then elevated activity may be seen, on average, on trials when the contralateral action is chosen, because those also tend to be trials when that action predicts relatively higher value and RPEs for contralateral movements are positive. In Walton’s case, NAcc might analogously represent the value of “go” (relative to “no-go”) responses, producing greater responding when “go” (relative to “no-go”) responses are valued: again, on average, those trials and conditions when “go” is correctly chosen. This hypothesis is plausible given NAcc DA’s role in appetitive approach. (Parkinson et al., 2002). In any case, we were able to decisively rule out this concern in Parker’s data by articulating the distinction between chosen value and action value and showing that DMS DA follows the former. Although given hindsight and the conceptual advances in the current paper, we can observe hints of a similar distinction in the Walton results (and in the current revision we discuss how these help to buttress our interpretation), we would stress that almost all the significant action-related value results in the Walton paper (with the exception of a single time point in Supplementary Figure 9E) concern the modulation of “go”-related activity by reward expectancy (consistent with both chosen and action value), and so do not directly test or address what we identify as the key differentiating question of whether this reverses for “no-go” responses.

Why is all this important, and what does it have to do with the reviewer’s question about error signals for motor responses? The reports of activity apparently related to movement per se are important both in a positive sense (because they suggest a function more directly related to movement elicitation or control, as Walton and Parker both point out and we also now say more clearly); yet at the same time they are deeply puzzling in that it is difficult to understand how they can be reconciled with the substantial evidence for RPE signaling–how, for instance, can recipient structures distinguish the error-related components of the signal that should control plasticity vs. the interleaved movement-related ones that should initiate actions?

Against this background, one of the main conceptual advances of our article was to articulate clearly, and then show how to test definitively, a way in which the RPE and motor responses could have been reconciled: specifically, we posited that DMS carries an RPE for action value that would account for both responses. In fact, having set up and tested this possibility, we end up rejecting it: This strengthens the (still important and still puzzling) case for truly movement-related signaling. That said, we agree with the reviewer that our closing suggestion about whether this signal is a truly movement- rather than value-related error is indeed a novel conceptual advance, although not the main one of the paper. Our point (which we have tried to clarify and elaborate) is that another possibility is that the movement direction signal whose existence we verify might be useful as different a sort of error signal, for training a class of S-R habit models that goes back to Guthrie, E.R. (Guthrie, 1935), and has recently been rediscovered. But this is more in the category of interpretations left open by the current study. We do not as yet have direct evidence bearing on this point either way, and it remains for future work (probably using causal manipulations) to address it.

Methodologically, I am concerned because I may not be following where the trials are coming from with the sparse design. The mice are performing a choice task in which there is a high value on one side and low value on the other. The location of the high value option switches frequently, it looks like after 40ish trials. And on each trial the mouse is free to go in either direction. As a result, most of the responses in one direction are early in a block, whereas most of the responses in the other direction are late in the block. There are no forced trials, so this results in a dramatic asymmetry in where the relevant data comes from in a block it seems to me. In other words, in any block the comparison is largely between trials in one direction early in learning (or before) and the other mostly late (after) learning. Further, the comparison is made between trials after a rewarded trial and trials after a non-rewarded trial. Given the different probabilities, if the directions are not segregated, then there will be an asymmetry here also, since there will be many more trials after reward on the 70% reward schedule and many more trials after non-reward on the 10% reward schedule. Of course, I realize the authors know this, but the manuscript does not explain well how this is handled. If possible, I'd like a clean comparison of trials matched for the stage of task to show the effect. If this is not possible, then if the shape of the data can be made more clear and how these issues are handled, that might be sufficient. But a naïve reader who is not deeply familiar with the task, as the authors are, needs to be able to understand where the trials are coming from. At present, I could not do this.

Thank you for this comment. As we understand it, the reviewer raises a family of potential concerns that the data underlying either or both factors in the 2x2 (rewarded/non by ipsi/contra) in Figure 3A, D might be incomparable due to tending to arise at different times in the progression of learning and relearning given the free-choice, frequently reversing design. We have examined this concern in a number of ways.

First, in general, we would note that any imbalance isn’t especially severe. First, the animals adapt to value changes fairly rapidly, favoring the new best lever within a few trials, as shown in the updated Figure 1B. Given that the average block length is 23.23 ± 7.93 trials per block (minimum, 12; n = 19 recording sites across both terminals and cell-bodies data), the majority of the data are collected during periods when the choices favor whichever lever is currently best. This figure also indicates that even asymptotically, choices aren’t especially exclusive to the high-value side; there is decent sampling of both options.

We should also point out that there are many reversals per session (mean +/ sd: 8.67 ± 3.66, as is now reported in the revised manuscript); thus ipsilateral and contralateral each serve as both high and low value options many times, and are fully counterbalanced in this respect. Thus, in particular, any imbalances with respect to early and late sampling of (or to rewarded and nonrewarded sampling from) high vs. low value levers are counterbalanced with respect to their relationship with the factor of interest, ipsi vs. contra. Finally, although the reviewer doesn’t raise it explicitly here, there might be an additional, related concern that some animals tend to favor one lever (e.g., the contralateral one) overall, leading to another possible avenue for unbalanced sampling. However, as we discuss below at several points in the response to reviewer 3, this also turns out not to have a noticeable effect, as these biases are small and not consistent, and we have data from a subset of animals obtained from both sides simultaneously.

Finally, to ensure more directly that our results are not affected by whether choices occurred early versus late in a block, we repeated the analysis by splitting the trials to early (first 6 trials in the block) and late trials (last 6 trials in the block) (Author response image 1; Author response image 2 The shortest length for a block was 12 trials, so we used only the first 6 and last 6 trials from each block to ensure all blocks contributed equally to the averaged traces. (For the plots depicting activity by ranges of Q values, we also split them into four bins due to the smaller amount of data.)

Note that we see similar results in both VTA/SN::DMS terminals and VTA/SN::DMS cell-bodies even after splitting the data into early vs. late in the blocks as we did for Figure 3. In particular, we see that the signals are modulated by contralateral movement and whether or not the mice were rewarded previously. We also see similar results when breaking out responses by Q values. As in the main analysis, the regression results indicate that there are some significant effects for contralateral action and difference in Q values for chosen and unchosen, but no significant effect for the interaction between the two. Thank you again to the reviewer for suggesting this additional analysis to confirm that our results still hold even taking into account the stage of relearning.

Author response image 1
Early and late trials in block are both modulated by chosen value and contralateral action (VTA/SN::DMS Terminals, n = 12 sites)

(A) GCaMP6f signal from VTA/SN::DMS Terminal (n = 12 sites) from first 6 trials of each block. Traces are time-locked to the lever presentation for contralateral trials (blue) and ipsilateral trials (orange), as well as rewarded (solid) and non-rewarded previous trial (dotted). Colored fringes represent 1 standard error from activity averaged across recording sites (n = 12) (B) GCaMP6f signal for contralateral trials (blue) and ipsilateral trials (orange), and further binned by the difference in Q values for chosen and unchosen action. Colored fringes represent 1 standard error from activity averaged across recording sites (n = 12). (C) Mixed effect model regression on each datapoint from 3 seconds of GCaMP6f traces. Explanatory variables include the action of the mice (blue), the difference in Q values for chosen vs. unchosen actions (orange), their interaction (green), and an intercept. Colored fringes represent 1 standard error from estimates. Dots at bottom mark timepoints when the corresponding effect is significantly different from zero at p<.05 (small dot), p<.01 (medium dot), p<.001 (large dot). P values were corrected with Benjamini Hochberg procedure. (D-F) Same as (A-E), except using the last 6 trials of each block.

https://doi.org/10.7554/eLife.42992.030
Author response image 2
Early and late trials in block are both modulated by chosen value and contralateral action (VTA/SN::DMS Cell-bodies, n = 7 sites)

(A) GCaMP6f signal from VTA/SN::DMS Cell-bodies (n = 7 sites) from first 6 trials of a block. Traces are time-locked to the lever presentation for contralateral trials (blue) and ipsilateral trials (orange), as well as rewarded (solid) and non-rewarded previous trial (dotted). Colored fringes represent 1 standard error from activity averaged across recording sites (n = 7). (B) GCaMP6f signal for contralateral trials (blue) and ipsilateral trials (orange), and further binned by the difference in Q values for chosen and unchosen action. Colored fringes represent 1 standard error from activity averaged across recording sites (n = 12). (C) Mixed effect model regression on each datapoint from 3 seconds of GCaMP6f traces. Explanatory variables include the action of the mice (blue), the difference in Q values for chosen vs. unchosen actions (orange), their interaction (green), and an intercept. Colored fringes represent 1 standard error from estimates. Dots at bottom mark timepoints when the corresponding effect is significantly different from zero at p<.05 (small dot), p<.01 (medium dot), p<.001 (large dot). P values were corrected with Benjamini Hochberg procedure. (D-F) Same as (A-E),except using trials from the last 6 trials of the block.

https://doi.org/10.7554/eLife.42992.031

Reviewer #2:

[…] The original finding of a direction specific dopamine response was already interesting, and this study certainly finesses that result in a clean manner. However, I was not entirely convinced of how much this really advances from the original finding to tell us what dopamine is doing.

The different predictions are nicely set out in Figure 2 (though it might be best not to include the "chosen value modulation" option here given it is already a non-starter for DMS dopamine based on the Parker data set) and one model is clearly supported based on the data are presented in Figure 3. But what the authors focus on – is the dopamine best described as RPE x action or chosen value x action – struck me as rather small scale, particularly given there is much more evidence for dopamine encoding chosen value in some form. While I found this an interesting conclusion, it seemed hardly like it would really help advance the ongoing and passionate RPE v movement debates.

Thank you for this comment. We chose to include the “chosen value modulation” option for pedagogical reasons, because it was helpful to first introduce the idea of “chosen value modulation,” then include the contralateral action modulation on top of that. The second theory helps readers understand the two types of modulations involved in the third theory.

We also appreciate the opportunity to do a clearer job explaining the contributions of our study. We have attempted to sharpen these points in the current revision. (We would also direct your attention to the first reviewer’s first comment for more discussion about this.) The discussion on how to reconcile dopamine’s involvement in reward vs. movement is perhaps the single central puzzle in the study of this neuromodulatory system going back decades to the initial discoveries of its involvement in self-stimulation and disorders of movement. One of the reasons for the excitement surrounding the RPE theories was that they seemed to offer a detailed, quantitative (though of course stylized) way to reconcile these views. However, recent reports (among them ours) of seemingly motor-related responses that are apparently distinct from RPEs have recently reopened the classic questions, and–given the substantial evidence for the RPE account– introduced new questions, such as how recipient structures could possibly distinguish interleaved RPE and movement signals with different functions.

A chief contribution of the current study is to articulate a proposal for how the movement-related responses might be interpreted in the RPE framework, by extending it to include action RPEs. The action value vs. chosen value distinction is central for posing, testing, and ultimately rejecting this possibility. While it is true that we end up restoring Parker’s conclusion, we now know more about this important issue–both in the substantive sense that we have identified and closed interpretational ambiguities in Parker’s (and other) results, and in laying conceptual groundwork that will be relevant going forward.

In particular, as we now say in the revised article, we believe that our basic framework and approach will be relevant in confronting other aspects of the growing body of evidence that DA signals may encode for variables beyond RPE. Recent studies, for instance, showed that midbrain DA neurons may also encode behavioral variables relevant to the task, such as the mice’s position, their velocity, their view-angle, and the accuracy of their performance (Howe et al., 2013; da Silva et al., 2018; Engelhard et al., 2018). Our modeling provides a framework for understanding how these DA responses can be interpreted in different reference frames and how they might ultimately encode some form of RPEs with respect to different behavioral variables in the task. Even though this turned out not to be the case for Parker’s results, it may well apply elsewhere. This conceptual framework can be extended to help understand the heterogeneous DA responses from more complicated real-world, high-dimensional reinforcement learning tasks.

Moreover, it appears as if there is a lot more in these data than is remarked upon. For instance, there appears already to be a meaningful relationship between dopamine activity and the animal's upcoming action in the pre-lever period. Indeed, at least in the cell bodies, if you account for this baseline shift – and what the baseline is in these analyses was never clearly defined for me – the phasic action component looks like it would be much weaker at the time of lever extension. This interaction between timescales is worth considering and commenting on in more detail, particularly in the light of the Hamid/Berke findings that what can look like an RPE when baselined pre-event of interest might look very different if a baseline is taken at an earlier timepoint.

Thank you for this comment. We did not baseline our responses when analyzing the GCaMP6f time-locked to the lever presentation, and we agree it is important to better understand the extent to which the key effects are already present in the signal at earlier timepoints and to what extent taking this into account changes the picture at the time of lever presentation. We now include a number of additional analyses examining these issues, which in general do not change our overall conclusions.

First, we found the same basic pattern of effects when we aligned signals to the nose poke event, in an analysis which we have now included as Figure 3—figure supplement 4. Just as in Figure 3, we see clear modulation by chosen value and contralateral action when we break down signals both by previous reward and action (Figure 3—figure supplement 4A) and by Q values and action (Figure 3—figure supplement 4B). The regression results in Figure 3—figure supplement 4C indicate that the signals were significantly modulated by the contralateral action and Q values. Although (especially in the cell bodies results in Figure 3—figure supplement 4D-F) there appears to be a distinct component of response time-locked to the nose poke, the bulk of the response is more smeared out and at higher latency, such that the significant effects of both action and value actually occur shortly following the mean time of lever presentation (denoted by the black diamond with a line indicating the range containing 80% of latency values). All this suggests the modulation of DA signals is more closely related to lever presentation. As before, we see similar effects for both VTA/SNc::DMS terminals and VTA/SNc::DMS cell bodies (Figure 3—figure supplement 4D-F).

Finally, to more directly verify that our conclusions are independent of baseline effects and of responses to the other events, we also modeled the GCaMP6f signals independent of the time-locked event. This approach, in effect, takes account of any baseline signal related to other events, which we believe is more flexible, and more interpretable, than subtracting off a single baseline arbitrarily defined at some other time point. In particular, we performed a multiple regression with response kernels capturing the contribution of components linked to each of the three time-locked events simultaneously. To parallel the analysis from Figure 3A, D, we included, for each event, a kernel (i.e. a series of time-lagged regressors, covering timesteps from 1 second before until 2 seconds after each event) for each combination of action (contra or ipsi), and previous reward (or none). We estimated all the effects simultaneously using least-squares regression, thereby trading off the responsibility of the different events in explaining components of the signal (see Materials and methods subsection “Multiple event Kernel Analysis” for more details). The resulting output is kernels for each of the time-locked events and for each of the four conditions. We included these results as part of Figure 3—figure supplement 5

Although weaker (due to dividing variance up among many more explanatory variables), these analyses basically recapitulate the results of the simpler peri-event analyses. The key ipsi-contra separation is visible in all three kernels, and the direction of the reward effect is consistent as well, with at least a trend toward higher signal following non-reward than reward consistently across both ipsi and contra trials and across most of the kernels. Although this analysis does not entirely attribute the effect to any single event (and this may either reflect that the data really do arise from multiple effects time-locked to different events, or a failure of least squares regression and the linear convolutional model to completely identify an actually isolated effect), the sharp phasic signal to the lever presentation remains similar to the initial time-locked analysis, despite the portion of the effect taken by the other events. Note also that the lever press kernels in Figure 3—figure supplement 5C verify the same clear crossing effect that occurs right after the mice press the lever, as also noted in Figure 4.

Finally, we also performed a multiple event regression examining the effects of action value as a continuous variable, to parallel to the results from Figure 3C, F. In this case, we include time-lagged regressors (kernels) for intercept, contralateral action, Q values for each trial, and the interaction between Q values and contralateral action for each kernel. Again, we solved for the regressors simultaneously using least-squares regression. As before, we calculated p values (corrected with Benjamini Hochberg procedure) to determine when the regressors’ effects were significantly different from zero.

Author response image 3
Kernels for each significant behavioral event for mixed effect model regression

(A) Nose poke kernel output from linear regression model using GCaMP6f from VTA/SN::DMS terminals. Each line represents a normalized regression variable: action (blue; 0 for ipsilateral, 1 for contralateral), difference in Q values for chosen direction and unchosen direction (orange), and the interaction between the two (green). Colored fringes represent 1 standard error from activity averaged across recording sites (n = 12). Black diamond represents the average latency for lever presentation from nose poke with the error bars showing the spread of 80% of the latency values. (B) Lever presentation kernels, with the black diamond representing the average latency from lever press to lever presentation. (C) Lever press kernels, with the black diamond representing the average latency from CS+ or CS- to lever press. (D-F) Same as (A-E), except with signals from VTA/SN::DMS cell bodies averaged across recording sites (n = 7) instead of terminals.

https://doi.org/10.7554/eLife.42992.032

As before, we see significant effects of contralateral action in all three kernels (Author response image 3A-C). Significant positive modulation by chosen Q value is still seen primarily in the lever presentation and lever press kernels (Author response image 3B, C). As with in Figure 3C, F, we do not see a significant effect from the interaction terms, suggesting that value effects reflect chosen value rather than side-specific value. In the lever press kernels (Author response image 3C), we again see the contralateral action regressors cross from positive to negative soon after the lever press, reaffirming results from Figure 4. We see similar results in VTA/SN::DMS cell-bodies recordings, though the effect is weaker in the lever presentation kernels (Author response image 3D-F).

Another important idea that was not specifically addressed was whether dopamine activity reflects the reward prediction or the vigour of the (contralateral) action. Is there enough variance between the Q value and, say, initiation speed to include that as an additional regressor? The chosen minus unchosen value signals come pretty late given the speed of the GCaMP6f, so what is actually driving these here?

Thank you for this important question. We considered the lever-press latency as a measure of vigor as we did not have video or other measures of vigor available. To investigate this issue we redid the regression analysis in Figure 3C, F but included the latency of lever press as an additional nuisance covariate (Figure 3—figure supplement 7). Our results indicated that latency of the lever press was not a strong predictor for GCaMP6f signals. Our conclusions with regards to the original variables remained the same. In order also to address the reviewer’s parenthetical note that the DA activity might reflect the vigor of contralateral action specifically, we also repeated this analysis on only contralateral trials (not shown). As with the results, the latency of lever press was still not a strong or significant predictor for GCaMP6f signals on contralateral choice trials. We’d like to thank the reviewer for suggesting this additional analysis, which confirmed that the DA activity was related to both chosen value and contralateral choice, unconfounded by response vigor insofar as we can estimate it.

Reviewer #3:

[…] - A remaining probability for contralateral lever presses at 0.35-0.4 (Figure 1B), 7-10 trials after the ipsilateral lever has become the high-probability option, seems quite high. Especially, since probability for choosing the contralateral lever, when it is the high-probability option, gets to around 0.9. Is the animals' behavior towards the two sides comparable? Is there a bias? This is essential for the analyses performed (e.g., if the number of rewarded trials is different, interpreting how trial history affects activity becomes more difficult). The authors need to both test and discuss this.

Thank you for this important question. We apologize that the plot originally shown in the paper gave a misleading impression, which we discuss below. But first, on examining the preferences of the mice overall, we did not find that they strongly or consistently preferred the contralateral or ipsilateral action.

On average, the mice preferred the contralateral action 53.07% ± 9.73 (averaged across n =19 recording sites for terminals and cell-bodies data): any side bias was weak and not consistent from animal to animal. In response to another one of your questions, we also presented data from both hemispheres in a subset of animals we recorded from the same recording site bilaterally (Figure 3—figure supplement 6). The activity from each hemisphere still favored the contralateral choice, showing that the effect is not some accident of animals favoring one side or the other.

Regarding Figure 1B, we apologize for arbitrarily depicting the reversals as a switch from contralateral to ipsilateral as the high-value lever. This gave a misleading impression that there was a ipsi vs. contra bias, when the difference in responding simply reflected the progression of relearning (from late in the block on the left of the plot, to early in the block on the right). In fact, when we repeat the analysis to depict block switches from both contralateral to ipsilateral and vice versa, the results are very similar:

Note that both plots show that, by the time of a switch, reasonably high preference had developed for whichever lever was serving as high value, followed by gradual relearning after the reversal. Our own impression is this adjustment is pretty nimble, and a bit of probability matching rather than really exclusive focus on the better lever is not too surprising. In any case, these plots clearly reflect the difference in behavior between before and after the switch, not between ipsi and contra. This further shows that the higher probability for contralateral lever is part of the mice’s behavior during switch transitions, and not an indication of some choice bias. Since there was no difference between sides (and we had not intended to suggest one) we updated Figure 1B to average over both types of switches in a single plot. Thank you again to the reviewer for noticing the potential asymmetry that pointed us to the additional analysis that clarified the mice’s behavior.

- Can the authors exclude that the position of the optic fiber on the skull (and attached equipment; above left or right hemisphere) contributed to contralateral movements being different in their execution compared to ipsilateral movements? In other words, did implanting on one side of the skull influence the animals' balance or their ability to move in any direction due to tethering or did animals' heads tilt towards or away from the implant (due to weight or torque)? A photo of the setup including a connected animal performing in the task may prove useful in this context.

Thank you for this question. We did not implant on one side– all mice were implanted bilaterally to help with symmetry and balance. (For the DMS terminal animals, the second site was in the nucleus accumbens, and not analyzed in the current study.) The implant did not lead to any visible unbalance that we think could favor one direction of movement over the other. Consistent with that, in our nucleus accumbens recordings in our previous paper, we did not observe an overall contralateral bias in neural activity in DA terminals (Parker et al., 2016).

- The authors frequently refer to movement signals. Can the authors distinguish between movement and motivation?

Thank you for this question, which is subtle and thought-provoking. To clarify, when we described “movement signals,” we meant signals specific to the movement direction. Of course, as the reviewer points out below, there is reason to speculate this activity is well positioned to participate in the execution of contralateral movements; however, from mainly correlational data we cannot speak definitively about the function of these signals, and, in particular, we cannot and do not intend to rule out that these side-specific signals are related to functions like planning or monitoring of a lateralized movement, rather than movement execution per se. As for motivation, of course this is a broad term, but to some extent the central premise of our study is interrogating one version of this distinction. In particular, we distinguish whether the signals are best explained as related to the lateralized choice direction per se, or instead by the value that we estimate the animals attribute to that action. The underlying question here is precisely whether the seemingly side-specific responses are in fact instead related to the degree to which the animals are drawn to the action. We are mindful that the term “motivation” might have many meanings and some are difficult to pin down, but we do think the action value is one useful way to operationalize an aspect of it. Thus we conclude the activity is not related to motivation in this sense. We have added a brief comment on these issues to the Discussion.

- Does the contralateral movement-related calcium signal correlate with lever-press latency (on a trial-by-trial basis)?

Thank you for this important question. We address this in our response to reviewer 2’s final major point (above) with an analysis showing that lever-press latency was not significantly related to the calcium signals.

- In the Discussion, the authors should speculate on how unilateral dopamine neuron signals affect the contralateral side of the body (e.g., limbs or else) in order to initiate/support/perform a movement. This is a central part of the conclusion, if I am not mistaken, and should be honored with a speculation on how this may be implemented in terms of functional neuroanatomy. Also, rotation behavior after 6-OHDA lesion should be addressed in this context.

We appreciate your correctly intuiting our speculation and pointing out that it was not made explicit in the previous manuscript. We indeed envision that DA signals in each side might be important for initiating contralateral movement directly. This fits well with the classic picture of the functional anatomy of the basal ganglia (i.e., the direct and indirect pathways and their modulation by dopamine; (DeLong, 1990), together with the contralateral organization of the motor system, including striatum (Tai et al., 2012; Kitama et al., 1991). As the reviewer points out, there is also causal evidence for such a function: previous work has shown that unilateral excitation of DA neurons or neurons innervated by DA neurons has led to increased contralateral rotations or contralateral movement (Saunders et al., 2018). Moreover, classic results on unilateral lesions via 6-OHDA show that impairing DA neurons in one hemisphere of the brain led to increased ipsilateral rotations, further showing that the causal relationship between unilateral signals and contralateral movements (Costall, Naylor, and Pycock, 1976; Ungerstedt and Arbuthnott, 1970). We have included discussion of these points in the revised manuscript.

- In the Materials and methods section, it is stated that 1-5 recordings were obtained per recording site. Does that mean that some animals contributed a lot more data than others? For example, 10.108 "terminal" trials were recorded. That makes about 840 per animal on average. Is that roughly the average number of trials per animal? If not, it should be reported.

Thank you for this comment. We recorded on average 791.89 ± 371.80 (mean ± SD) trials per mouse. For VTA/SN::DMS Terminals recordings specifically, we had 842.33 ± 356.72 trials per mouse. For VTA/SN::DMS Cell-Bodies recordings specifically, we had 705.43 ± 381.10 trials per mouse. We have now included this information in the Materials and methods section.

https://doi.org/10.7554/eLife.42992.026

Article and author information

Author details

  1. Rachel S Lee

    Department of Psychology, Princeton Neuroscience Institute, Princeton University, New Jersey, United States
    Contribution
    Conceptualization, Software, Formal analysis, Validation, Investigation, Methodology, Writing—original draft, Writing—review and editing
    Competing interests
    No competing interests declared
    ORCID icon "This ORCID iD identifies the author of this article:" 0000-0001-7984-1942
  2. Marcelo G Mattar

    Department of Psychology, Princeton Neuroscience Institute, Princeton University, New Jersey, United States
    Contribution
    Investigation, Methodology
    Competing interests
    No competing interests declared
  3. Nathan F Parker

    Department of Psychology, Princeton Neuroscience Institute, Princeton University, New Jersey, United States
    Contribution
    Data curation, Investigation, Methodology
    Competing interests
    No competing interests declared
  4. Ilana B Witten

    Department of Psychology, Princeton Neuroscience Institute, Princeton University, New Jersey, United States
    Contribution
    Conceptualization, Resources, Data curation, Supervision, Funding acquisition, Validation, Methodology, Writing—original draft, Writing—review and editing
    For correspondence
    iwitten@princeton.edu
    Competing interests
    No competing interests declared
    ORCID icon "This ORCID iD identifies the author of this article:" 0000-0003-0548-2160
  5. Nathaniel D Daw

    Department of Psychology, Princeton Neuroscience Institute, Princeton University, New Jersey, United States
    Contribution
    Conceptualization, Formal analysis, Funding acquisition, Investigation, Methodology, Writing—original draft, Writing—review and editing
    For correspondence
    ndaw@princeton.edu
    Competing interests
    No competing interests declared
    ORCID icon "This ORCID iD identifies the author of this article:" 0000-0001-5029-1430

Funding

National Institute for Health Research (5R01MH106689-02)

  • Ilana B Witten

New York Stem Cell Foundation (Robertson Investigator)

  • Ilana B Witten

Army Research Office (W911NF-16-1-0474)

  • Nathaniel D Daw

Army Research Office (W911NF-17-1-0554)

  • Ilana B Witten

The funders had no role in study design, data collection and interpretation, or the decision to submit the work for publication.

Acknowledgements

We thank the entire Witten and Daw labs for comments, advice and support on this work. IBW is a New York Stem Cell Foundation—Robertson Investigator.

Senior Editor

  1. Timothy E Behrens, University of Oxford, United Kingdom

Reviewing Editor

  1. Geoffrey Schoenbaum, National Institute on Drug Abuse, National Institutes of Health, United States

Reviewers

  1. Geoffrey Schoenbaum, National Institute on Drug Abuse, National Institutes of Health, United States
  2. Ingo Willuhn

Version history

  1. Received: October 19, 2018
  2. Accepted: April 3, 2019
  3. Accepted Manuscript published: April 4, 2019 (version 1)
  4. Version of Record published: April 15, 2019 (version 2)

Copyright

© 2019, Lee et al.

This article is distributed under the terms of the Creative Commons Attribution License, which permits unrestricted use and redistribution provided that the original author and source are credited.

Metrics

  • 6,110
    Page views
  • 684
    Downloads
  • 21
    Citations

Article citation count generated by polling the highest count across the following sources: Crossref, PubMed Central, Scopus.

Download links

A two-part list of links to download the article, or parts of the article, in various formats.

Downloads (link to download the article as PDF)

Open citations (links to open the citations from this article in various online reference manager services)

Cite this article (links to download the citations from this article in formats compatible with various reference manager tools)

  1. Rachel S Lee
  2. Marcelo G Mattar
  3. Nathan F Parker
  4. Ilana B Witten
  5. Nathaniel D Daw
(2019)
Reward prediction error does not explain movement selectivity in DMS-projecting dopamine neurons
eLife 8:e42992.
https://doi.org/10.7554/eLife.42992

Further reading

    1. Computational and Systems Biology
    2. Neuroscience
    Marjorie Xie, Samuel P Muscinelli ... Ashok Litwin-Kumar
    Research Article Updated

    The cerebellar granule cell layer has inspired numerous theoretical models of neural representations that support learned behaviors, beginning with the work of Marr and Albus. In these models, granule cells form a sparse, combinatorial encoding of diverse sensorimotor inputs. Such sparse representations are optimal for learning to discriminate random stimuli. However, recent observations of dense, low-dimensional activity across granule cells have called into question the role of sparse coding in these neurons. Here, we generalize theories of cerebellar learning to determine the optimal granule cell representation for tasks beyond random stimulus discrimination, including continuous input-output transformations as required for smooth motor control. We show that for such tasks, the optimal granule cell representation is substantially denser than predicted by classical theories. Our results provide a general theory of learning in cerebellum-like systems and suggest that optimal cerebellar representations are task-dependent.

    1. Neuroscience
    Mariana R Melo, Alexander D Wykes ... Andrew M Allen
    Research Article

    The preBötzinger Complex (preBötC), a key primary generator of the inspiratory breathing rhythm, contains neurons that project directly to facial nucleus (7n) motoneurons to coordinate orofacial and nasofacial activity. To further understand the identity of 7n-projecting preBötC neurons, we used a combination of optogenetic viral transgenic approaches to demonstrate that selective photoinhibition of these neurons affects mystacial pad activity, with minimal effects on breathing. These effects are altered by the type of anesthetic employed and also between anesthetised and conscious states. The population of 7n-projecting preBötC neurons we transduced consisted of both excitatory and inhibitory neurons that also send collaterals to multiple brainstem nuclei involved with the regulation of autonomic activity. We show that modulation of subgroups of preBötC neurons, based on their axonal projections, is a useful strategy to improve our understanding of the mechanisms that coordinate and integrate breathing with different motor and physiological behaviours. This is of fundamental importance, given that abnormal respiratory modulation of autonomic activity and orofacial behaviours have been associated with the development and progression of diseases.