Reprogramming the antigen specificity of B cells using genome-editing technologies
- The Scripps Research Institute, United States
- Universidad Autónoma de Madrid (UAM) and Instituto de Investigaciones Biomédicas Alberto Sols (CSIC-UAM), Spain
- University of California, San Diego, United States
- Karolinska Institutet, Sweden
- University College London, United Kingdom
- Keck School of Medicine, University of Southern California, United States
- Ragon Institute of Massachusetts General Hospital, Massachusetts Institute of Technology, and Harvard, United States
Figures
Figure 1 with 4 supplements
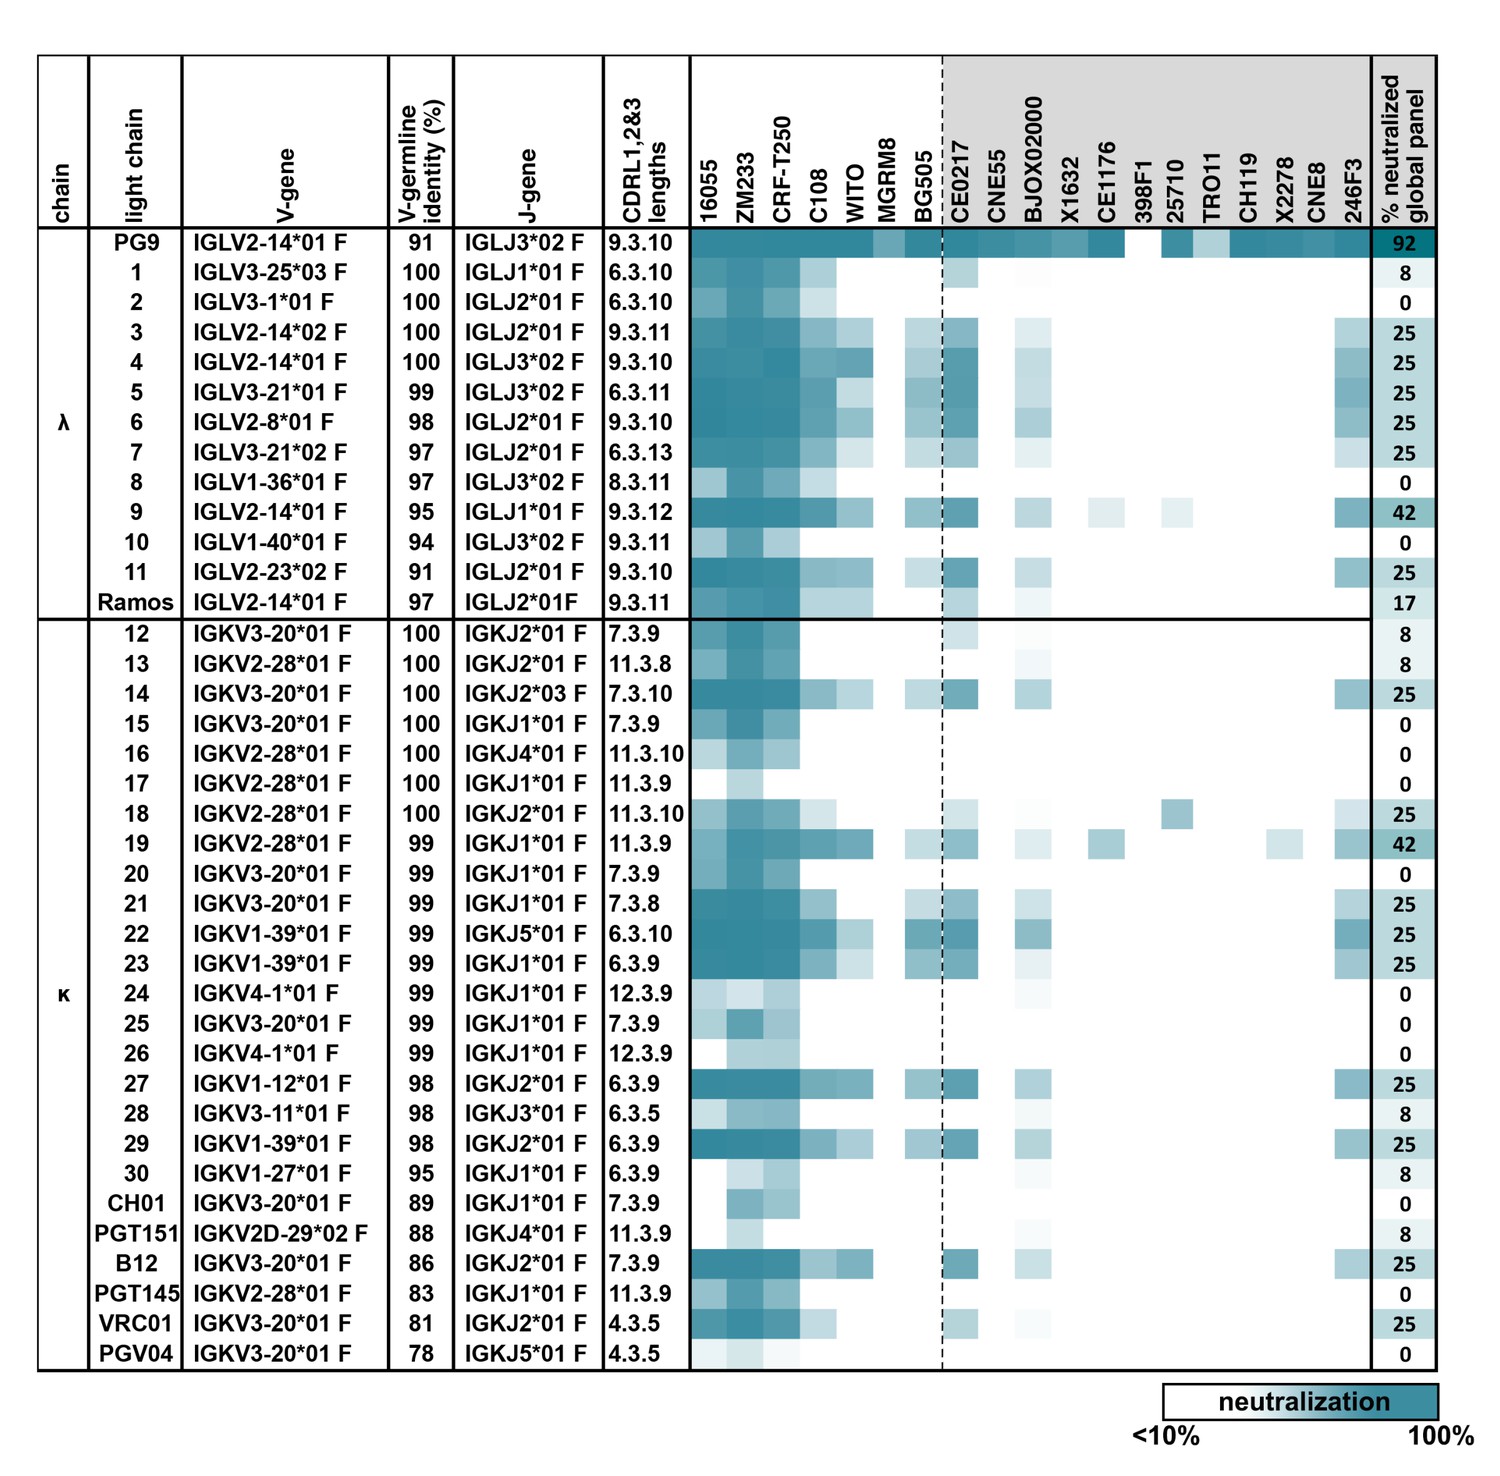
PG9 IgG heavy chains neutralize HIV when paired with a diversity of light chains.
Sensitivity of 19 HIV isolates to PG9 HC-chimeric LC antibodies are shown in a heat map. Viruses include: six strains especially sensitive to PG9 (leftmost) and 12 viruses representative of the global diversity of HIV (rightmost). The PG9 chimeras are grouped according to lambda and kappa gene usage in order of least to most somatically mutated (amino acid sequences are given in Figure 1—figure supplement 1, with the PG9HC/PG9LC control antibody at the top. A diversity of LCs was chosen including several LCs derived from other known HIV bnAbs. LC features are given including IMGT-derived V and J germline gene assignments and sequence identity to the assigned V-gene. CDRL (1, 2 and 3) amino acid lengths are also given. A dark teal to white heat map represents 100% to 10% or less neutralization of the indicated strain of psuedovirus at a concentration of 10 µg/ml of PG9 chimera IgG as described in Materials and methods. The percentage of viruses from the global panel showing at least 10% neutralization for each PG9 chimeric antibody is given on the right.
Figure 1—figure supplement 1
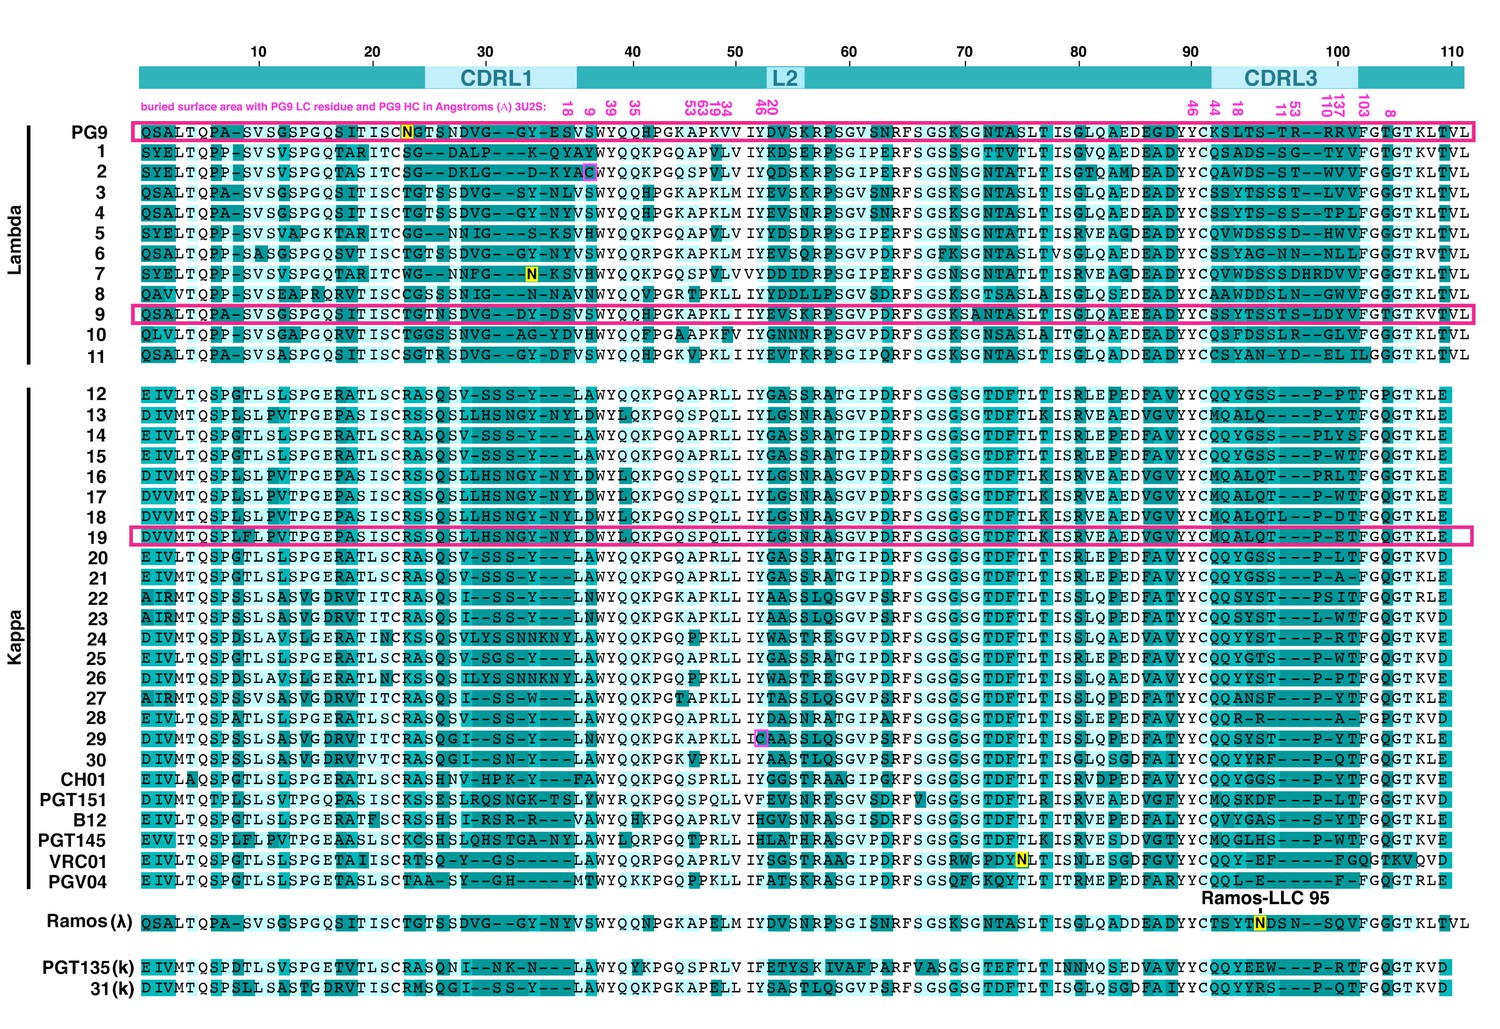
Amino acid alignment of human antibody light chain (LC) variable region sequences expressed as PG9 HC chimeras in 293 cells .
Sequences named 1–31 were cloned from a human donor. Others are the LCs derived from select HIV bnAbs or the Ramos B cell light chain. PGT135 and K31 did not express. The top line shows the locations for the complementarity determining regions (CDRs), numbering is based on PG9 LC. PG9 LC residues that make contact with the heavy chain in the crystal structure (PDB:3U2S) are indicated immediately below the top line with buried surface area in angstroms (Å) in pink font. LCs from PG9 chimeras neutralizing five or more viruses on the 12-virus global panel are highlighted with pink boxes. An important CDRL3 glycan in the Ramos B cell lambda LC that is modified during directed evolution to enhance affinity to HIV envelopes is indicated (LC res. 95).
Figure 1—figure supplement 2
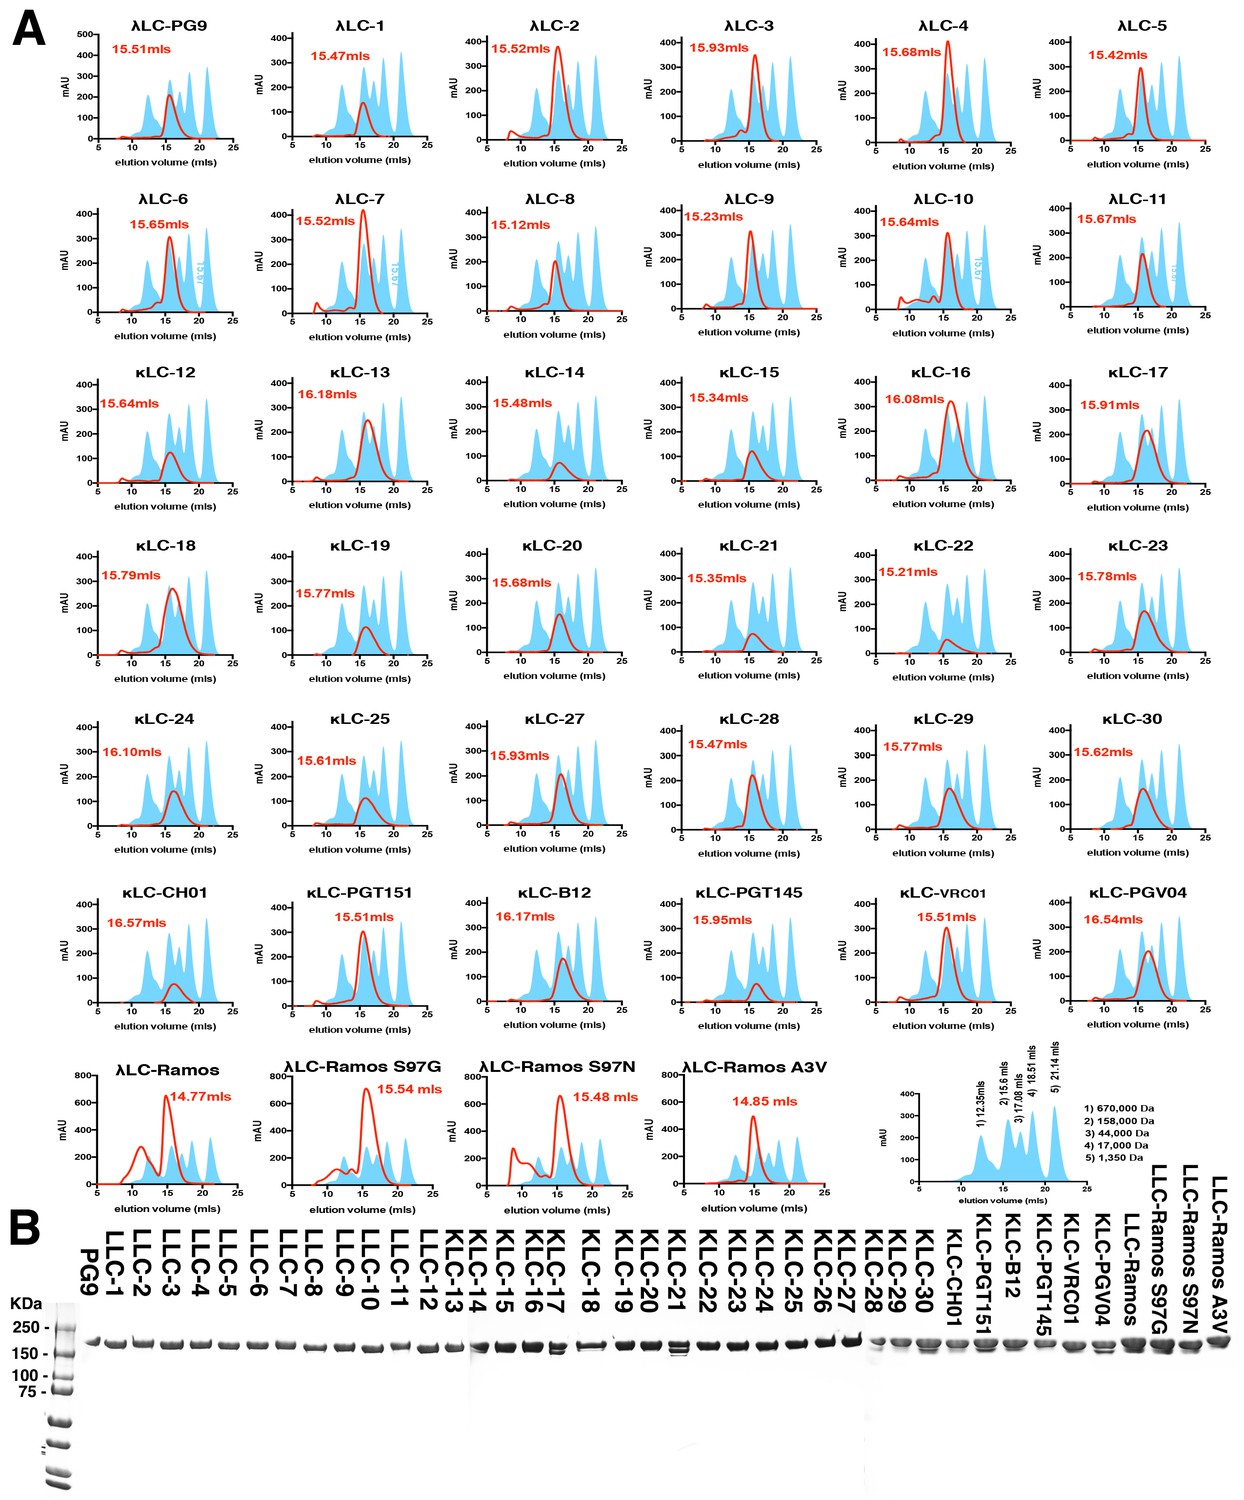
PG9 chimera purification.
(A) IgG chimeras were produced by cotransfecting mature PG9 HC with a panel of lambda or kappa LCs (S1A) in 293 cells. Secreted IgG was purified using protein A/G and run on a S200 10/30 size exclusion column (SEC) in PBS. Elution volumes following absorbance at 280 nm (mAU) were recorded and are given as a red line with peak volumes given in red font. Molecular weight standard elution volumes are shown as blue shaded peaks. The last trace shows elution volumes and corresponding weights for the standards. (B) Non-reducing SDS-PAGE gels of the SEC purified chimeras corresponding to the 158,000 Da MW species.
Figure 1—figure supplement 3
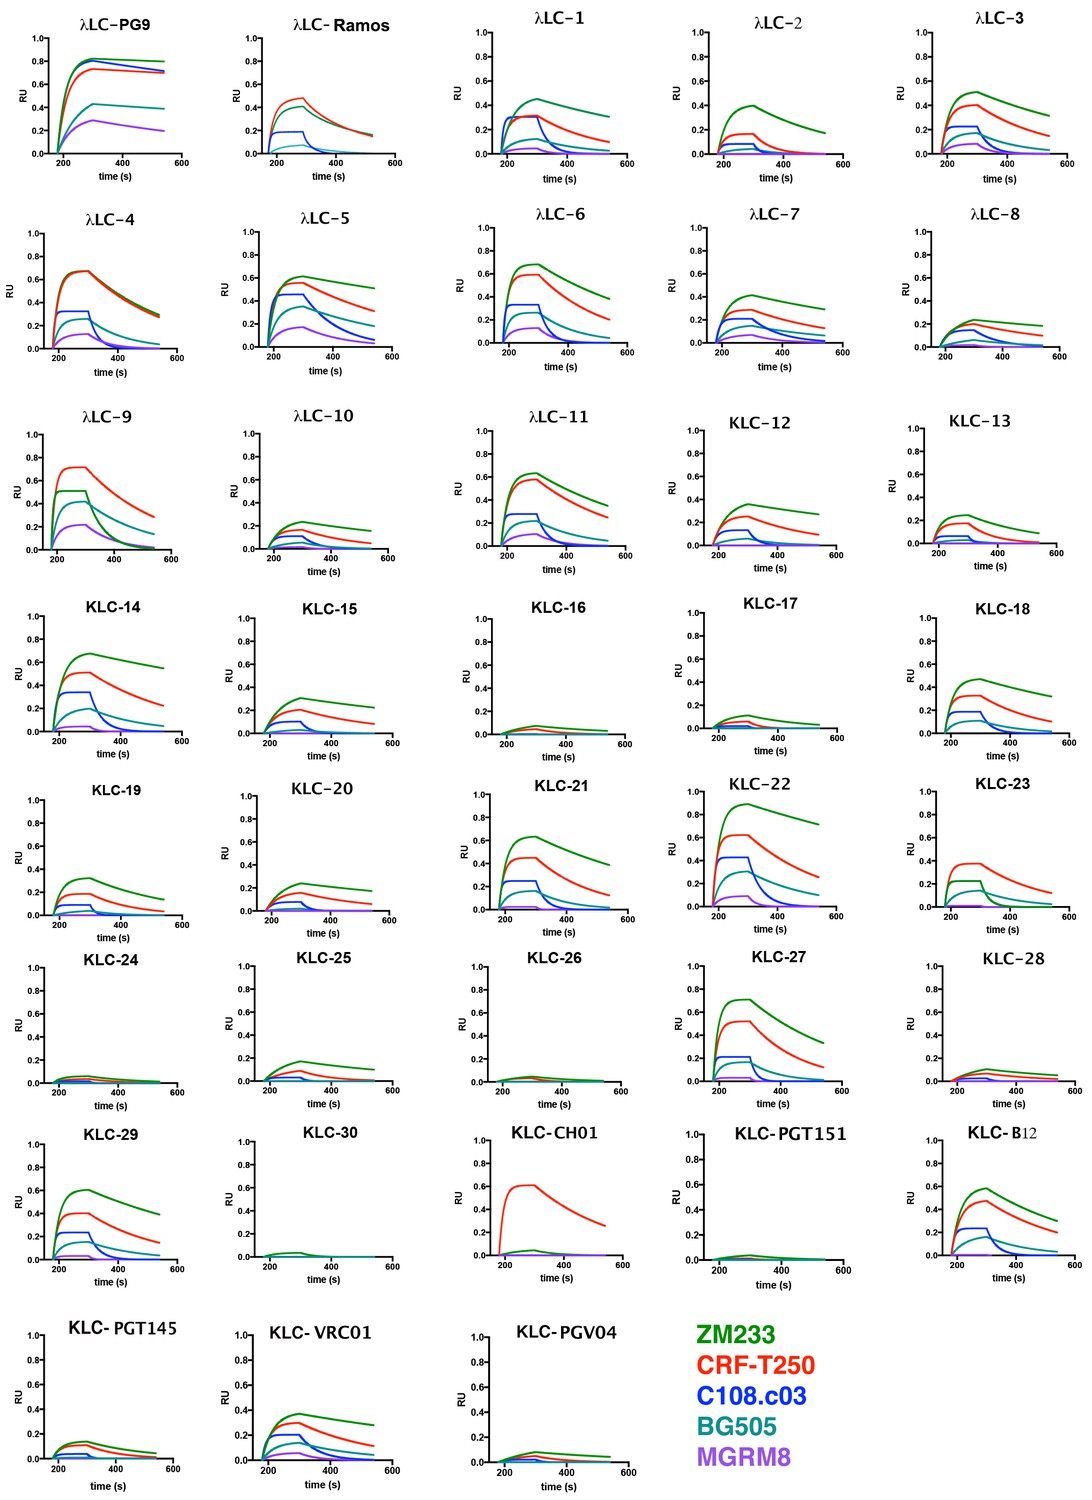
PG9 chimera IgG binding to HIV Envelope (SOSIP) by Biolayer interferometry.
PG9 chimeric IgGs were bound to protein G optical sensors. PGT145 purified soluble recombinant HIV Envelope trimers (color legend at bottom of page) were then bound at 500 nM for 120 s (180-300) and then dissociated in PBS for 250 s (300-550). Association and dissociation curves are shown with bound SOSIP-IgG complex measured as response units (RU) vs time in seconds (s). PG9HC/LC control is the first plot.
Figure 1—figure supplement 4

PG9 chimeric IgG autoreactivity test.
Purified IgGs were incubated with HEp-2 cells mounted on glass slides. Antibodies that bind human antigens are detected with anti-human IgG-FITC and visualized. A negative and positive control were included at the bottom right of the figure along with PG9 (HC/LC) IgG. 14 chimeras out of 37: LLC-3,4,6, KLC 12,14–17,24,26,27, CHO1, PGT151 and Ramos LC compare with the PG9 HC/LC control which is not autoreactive.
Figure 2 with 10 supplements
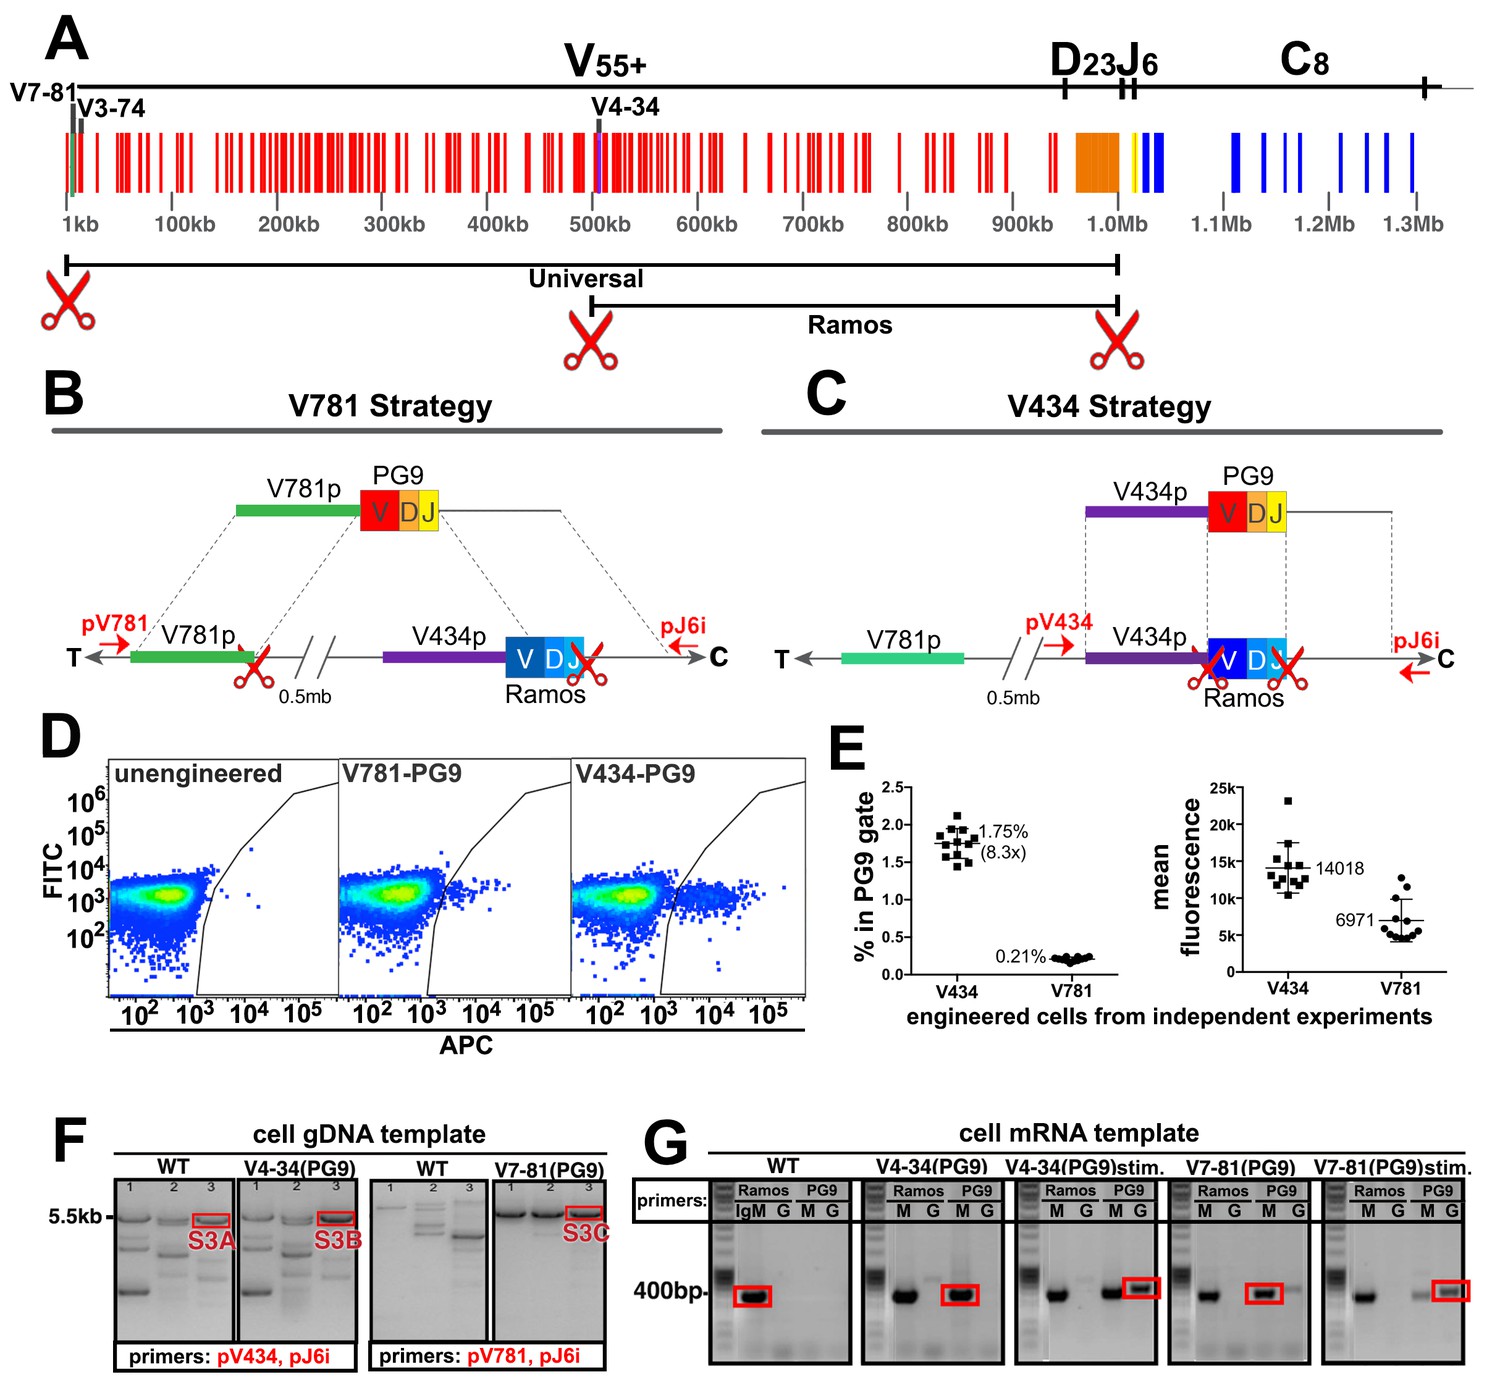
Engineering the HC VDJ locus in Ramos B cells.
(A) Germline configuration of the human immunoglobulin heavy chain locus. The locus is in reverse orientation running 5’ to 3’ from the telomeric ‘T’ end towards the centromere ‘C’ of the long arm of chromosome 14 (14q32.33). It starts with the variable gene region containing at least 55 functional V-genes (in red), 23 functional D-genes (in orange), and six functional J-genes (in yellow) to span almost 1 Mb. The variable region is followed by an intron containing an enhancer element that activates the 5’ proximal V-gene promoter in mature B-cells after VDJ recombination. This is followed by the constant gene region (in blue) comprised of 8 functional genes, which is followed by more enhancer elements. The 5’ most functional V gene promoter is V7-81 followed by V3-74. The V-gene recombined in the Ramos B cell lymphoma line is V4-34. Scissors represent the location of cas9 dsDNA cut sites developed for BCR editing outlined in this report. (B) The universal editing strategy uses cut sites after the V7-81 promoter and J6 gene to replace approximately 0.5 Mb in the Ramos B cell line with PG9 bnAb HC from a donor DNA with HRs upstream and downstream of these cut sites. (C) The Ramos specific strategy uses cut sites after the V4-34 promoter and J6 genes to replace only the native Ramos VDJ region (400 bp) with the PG9 VDJ from a donor with HRs upstream and downstream of these cut sites. (D) FACS plots of engineered Ramos B-cells (RA1), using either the V781 or V434 HDR strategies. Successfully engineered cells expressing chimeric PG9 BCR bind to APC-labeled recombinant C108 HIV Env trimer (SOSIP). APC positive selection gates were set against the FITC channel to eliminate autofluorescent cells. (E) Reproducibility of V781/V434 strategies. Each experiment was reproduced 12 times. The average number of cells able to bind C108 Env (SOSIP) after engineering was 0.21% (SD = 0.03) and 1.75% (SD = 0.20) using the V7-81 and V4-34 strategies respectively. Average fluorescence values of APC+ cells from the 12 transfections are also shown. (F) Genomic DNA analysis confirms native VDJ is replaced with PG9 in engineered cells using the V7-81 and V4-34 strategies. PCR reactions were performed on gDNA templates using three primer sets designed to amplify across the entire engineered site including sequence outside of HRs to ensure that new PG9 gene was in the expected context in the engineered cell genomes. Approximate primer annealing sites are indicated by red arrows in Figure 2B and C. PCR products using V4-34 promoter/J6 intron primers sets amplified a 5.5 Kb fragment in both V4-34 engineered cells as well as in WT cells (outlined in red rectangular boxes). V781 promoter/J6 intron primer sets amplified a 5.5 Kb fragment in V7-81 engineered cells but not in WT cells. Sequences of PCR products outlined with red boxes are shown in (Figure 2—figure supplements 3–5). (G) Engineered cells produce PG9 mRNA transcripts as IgM or as IgG in cytokine-stimulated cells. Ramos 2G6 engineered and C108 SOSIP selected cell mRNA was purified. Primer sets designed to amplify either the wild type or engineered (PG9) heavy chains (IgG or IgM) were used in RT-PCR. Sample template and primers used in the amplification are labelled. Only V4-34 or V7-81 engineered but not WT samples contained PG9-IgM. PG9-IgG could be amplified from CD40L/Il-2/Il-4 stimulated cells. Sanger sequences for the PCR products outlined with red rectangular boxes are given in Figure 2—figure supplement 10.
Figure 2—figure supplement 1
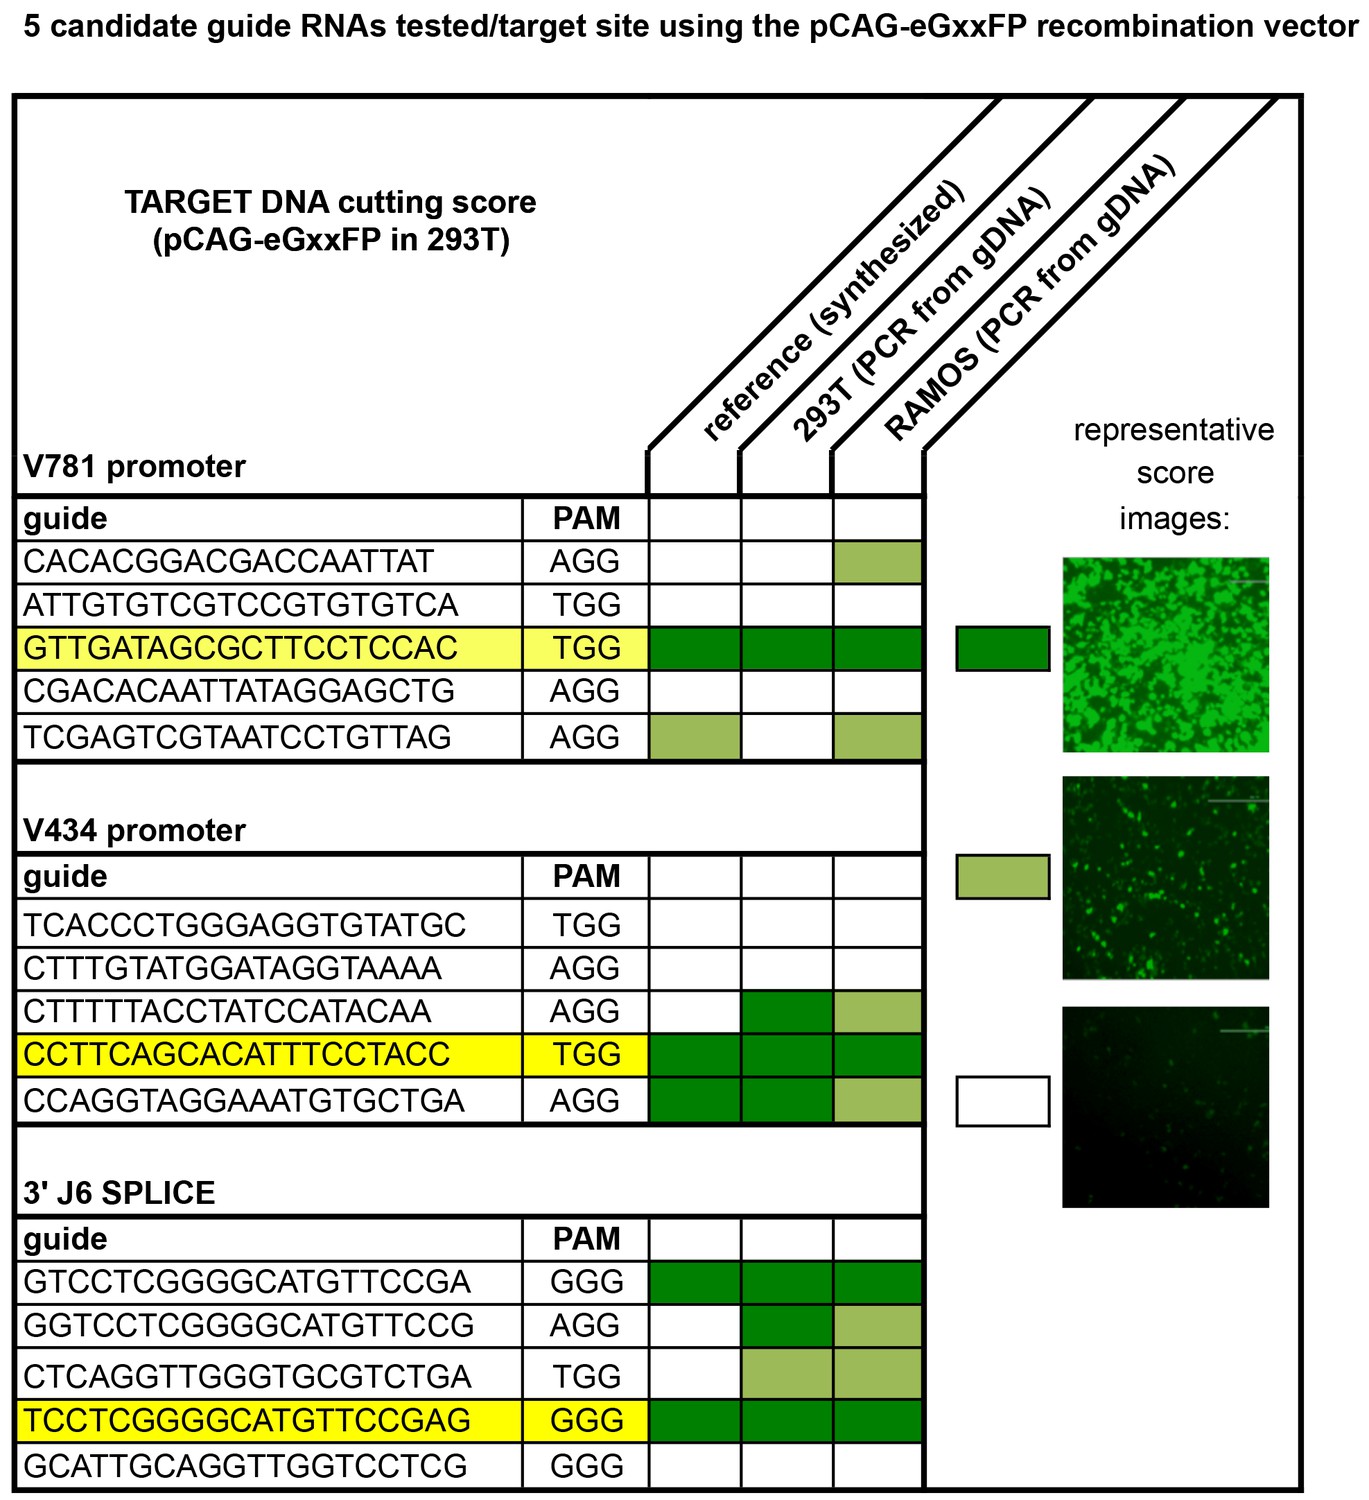
CRISPR/cas9 guide RNA selection.
The human reference genome (GenBank: AB019437, AB019439 and AL122127) used to annotate the IGHV gene locus in the International Immunogenetics Information System (http://www.imgt.org) was used to design CRISPR/cas9 guide RNAs using the Zhang lab-optimized CRISPR Design online platform (http://crispr.mit.edu). Primers were ordered and cloned into the pX330-U6-chimeric_BB-CBh- hSpCas9 vector as described in Materials and methods. Target DNA (genomic sequences to be cleaved by these nucleases) were either synthesized or amplified from 293T or Ramos B-cell gDNA as 250–300 bp products that could be cloned into the pCAG-eGxxFP vector. The pX330 vectors were then co- transfected with their respective target pCAG vectors in 293 T cells as described in Materials and methods. If the target DNA gets cut by the CRISPR/cas9/gRNA complex expressed in the cell, the pCAG vector undergoes homologous recombination to express GFP protein. 2 days after transfection, guide RNAs were scored visually based on GFP expression in the 293 cells according to the sample confocal microscopic images above. Highest scoring guide RNAs which could achieve cutting against the target DNA sequences derived from all three sources were chosen for B-cell engineering experiments to insert PG9 mature HC VDJ genes by homology directed repair.
Figure 2—figure supplement 2
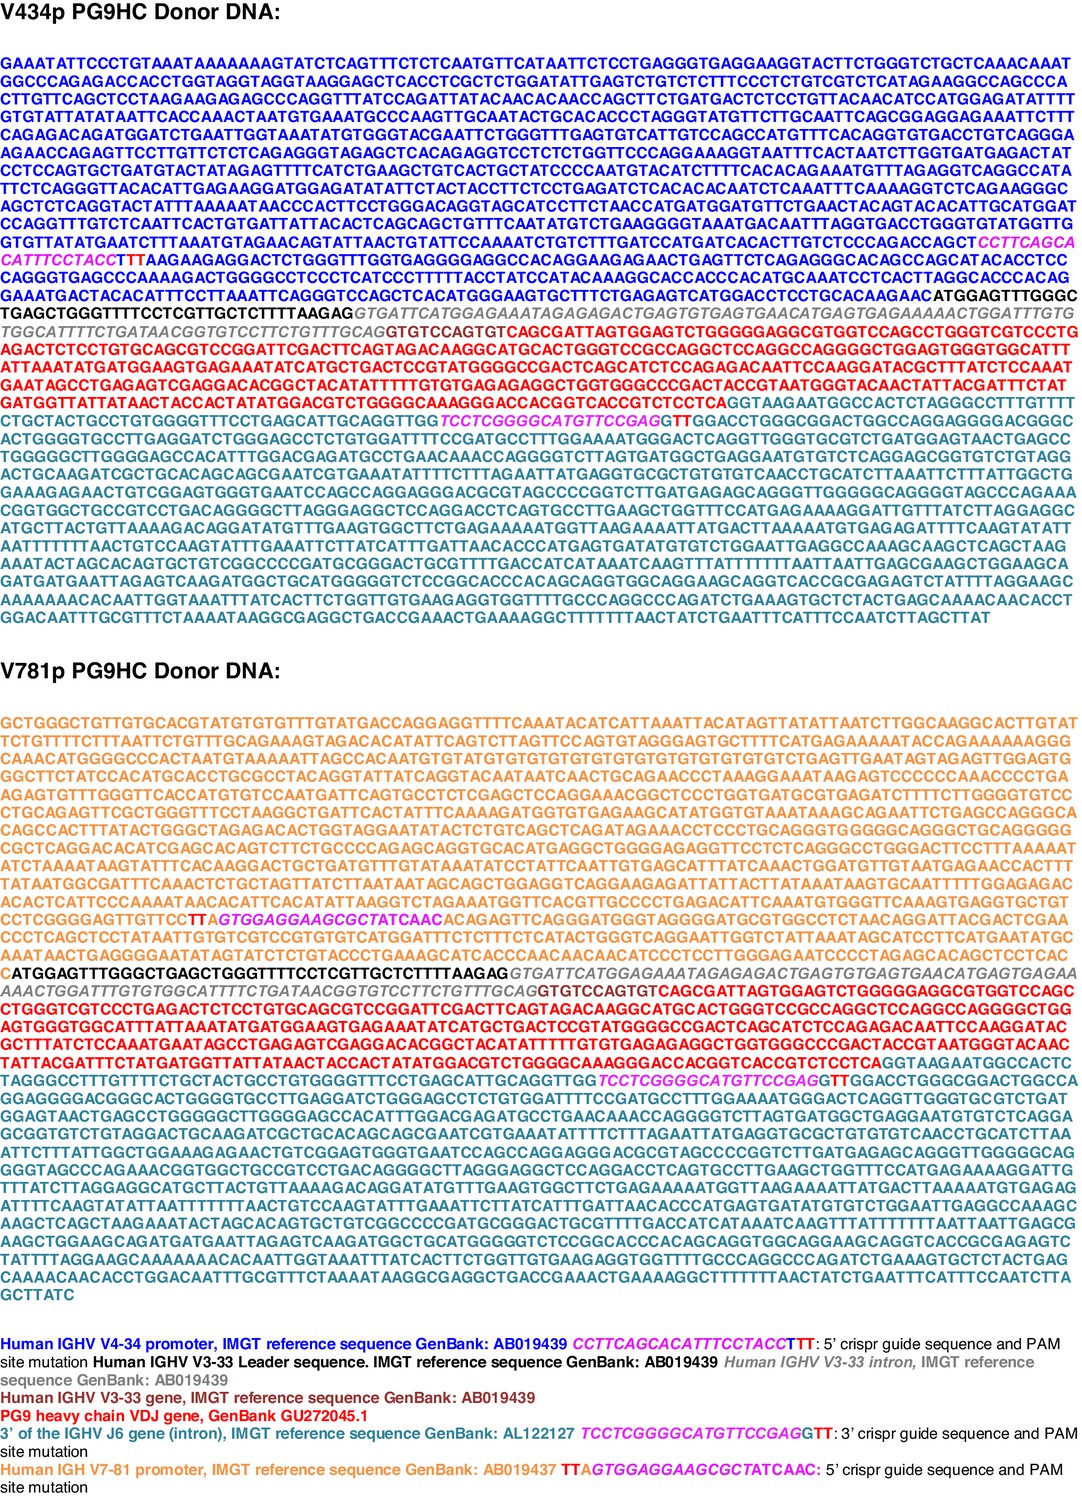
Donor DNA nucleotide sequence for the V434 (PG9) ‘Ramos specific’ and V781 (PG9) ‘Universal’ B cell engineering strategies.
Synthetic genes were assembled into the HR110PA-1 donor DNA backbone. Color annotations are at the bottom of the figure. CRISPR/cas9 PAM sites were mutated to prevent cleavage of donor DNA in B cells.
Figure 2—figure supplement 3
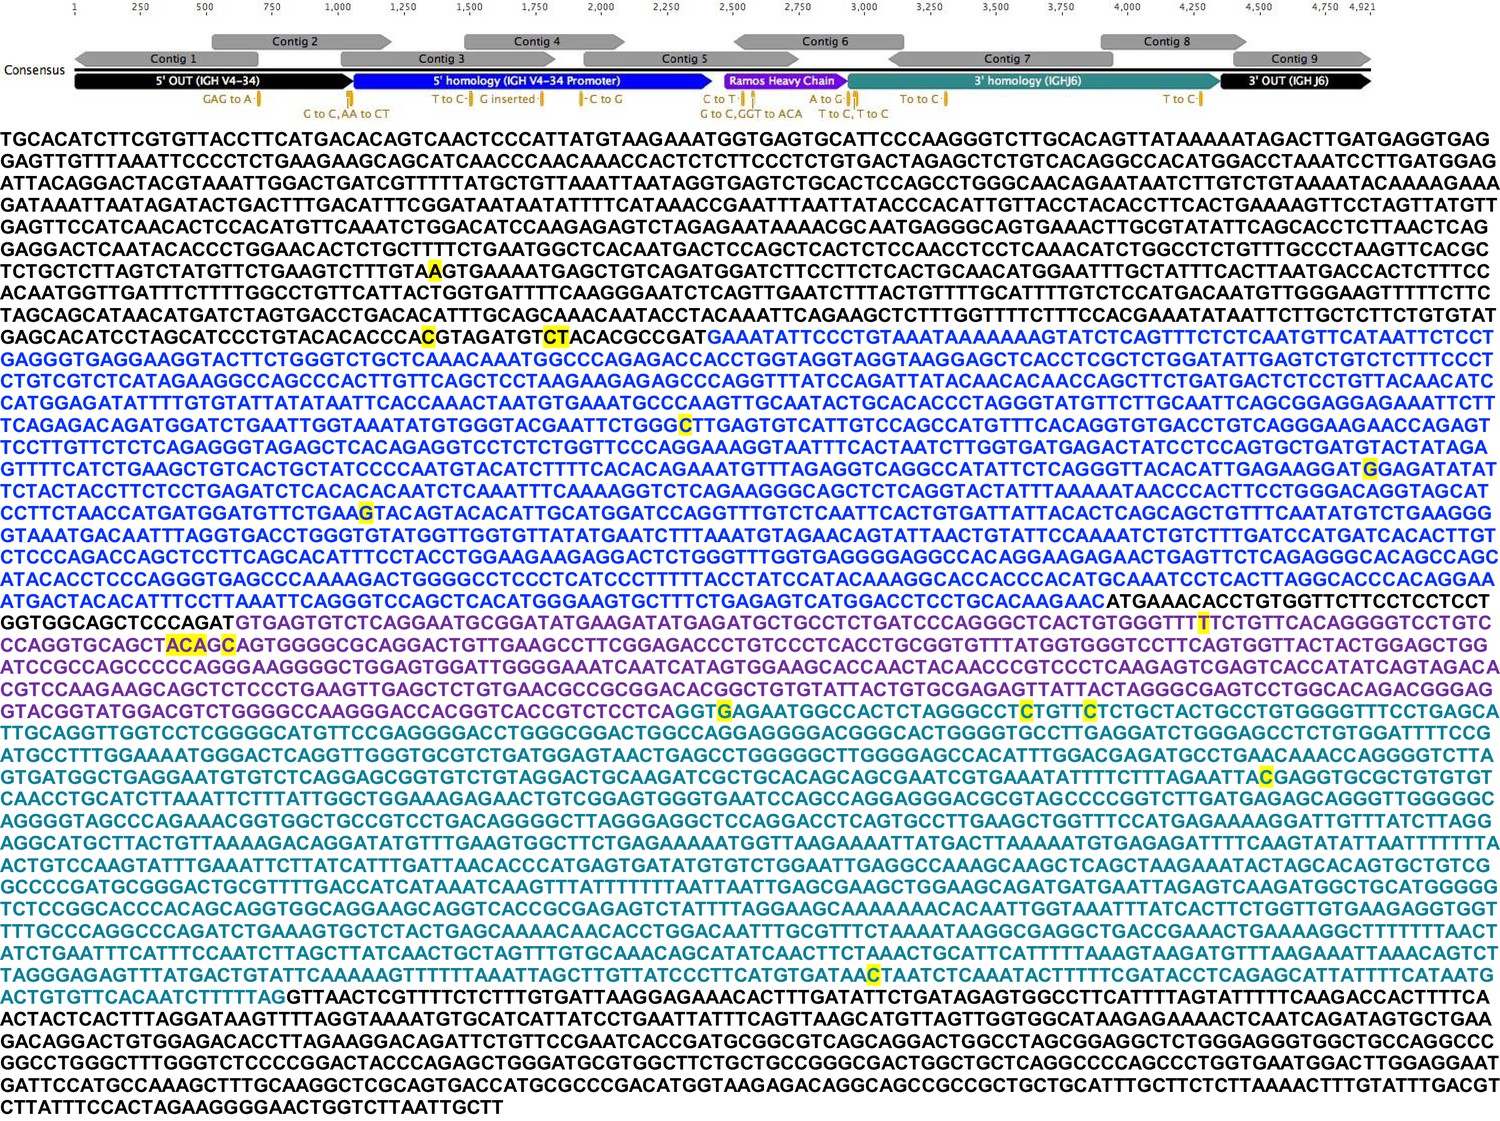
Amplicon sequence from gDNA derived from wild type Ramos lymphoma B cells.
A 5.5 Kb PCR product was obtained (red box 'S3A' Figure 2F) that was gel purified and Sanger sequenced using a series of primers to give overlapping sequence reads indicated by the grey arrows above the linear diagram at the top of the figure. Annotations are represented by font color and correspond to the linear diagram at the top of the page. The PCR product encompasses gDNA sequence from the V434 5’UTR (5’ of the donor DNA HR) to the intron after J6 (3’ of the donor DNA HR) to ensure the gene is placed in the correct location in the genome. Discrepancies between expected sequence (IMGT reference sequence and donor DNA design) are annotated in orange font in the linear diagram and highlighted yellow in the nucleotide sequence.
Figure 2—figure supplement 4
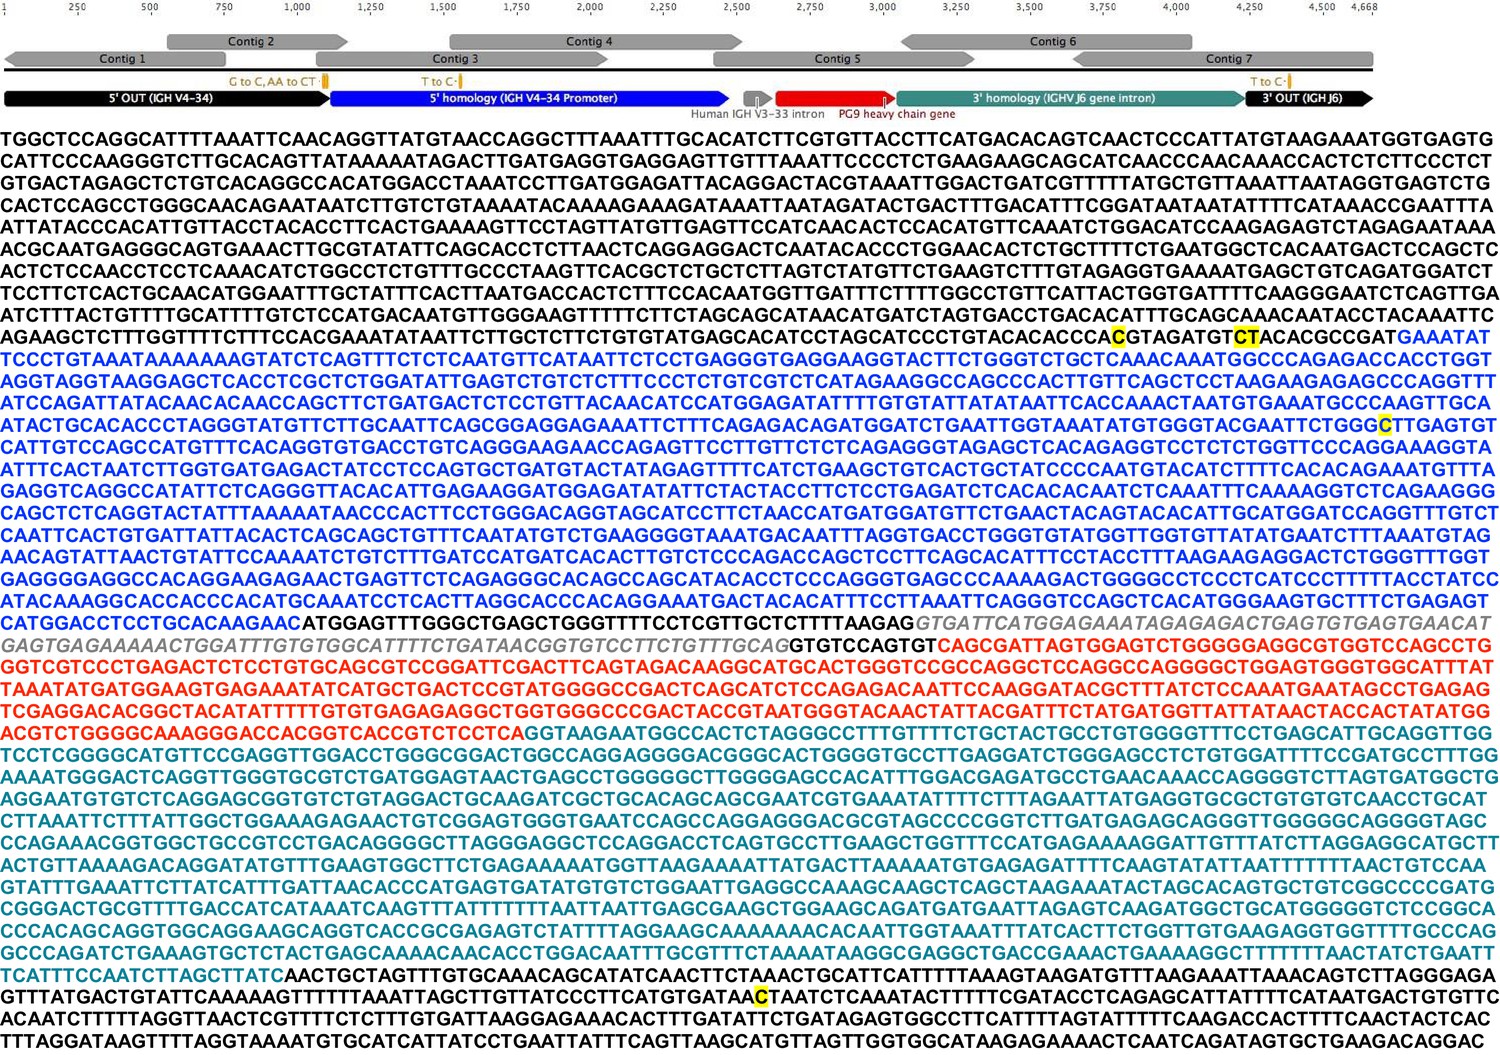
'Out/out PCR' amplicon sequence generated from gDNA derived from Ramos B cells engineered using the ‘V434’ strategy and selected using C108 SOSIP in FACS.
A 5.5 Kb PCR product was obtained (red box 'S3B' Figure 2F) that was gel purified and Sanger sequenced using a series of primers to give overlapping sequence reads indicated by the grey arrows above the linear diagram at the top of the figure. Annotations are represented by nucleotide font color and correspond to the linear diagram at the top of the page. The PCR product encompasses gDNA sequence from the V434 5’UTR (5’ of the donor DNA HR) to the intron after J6 (3’ of the donor DNA HR) to ensure the gene is placed in the correct location in the genome. Discrepancies between expected sequence (IMGT reference sequence and donor DNA design) are annotated in orange font in the linear diagram and are highlighted yellow in the nucleotide sequence.
Figure 2—figure supplement 5
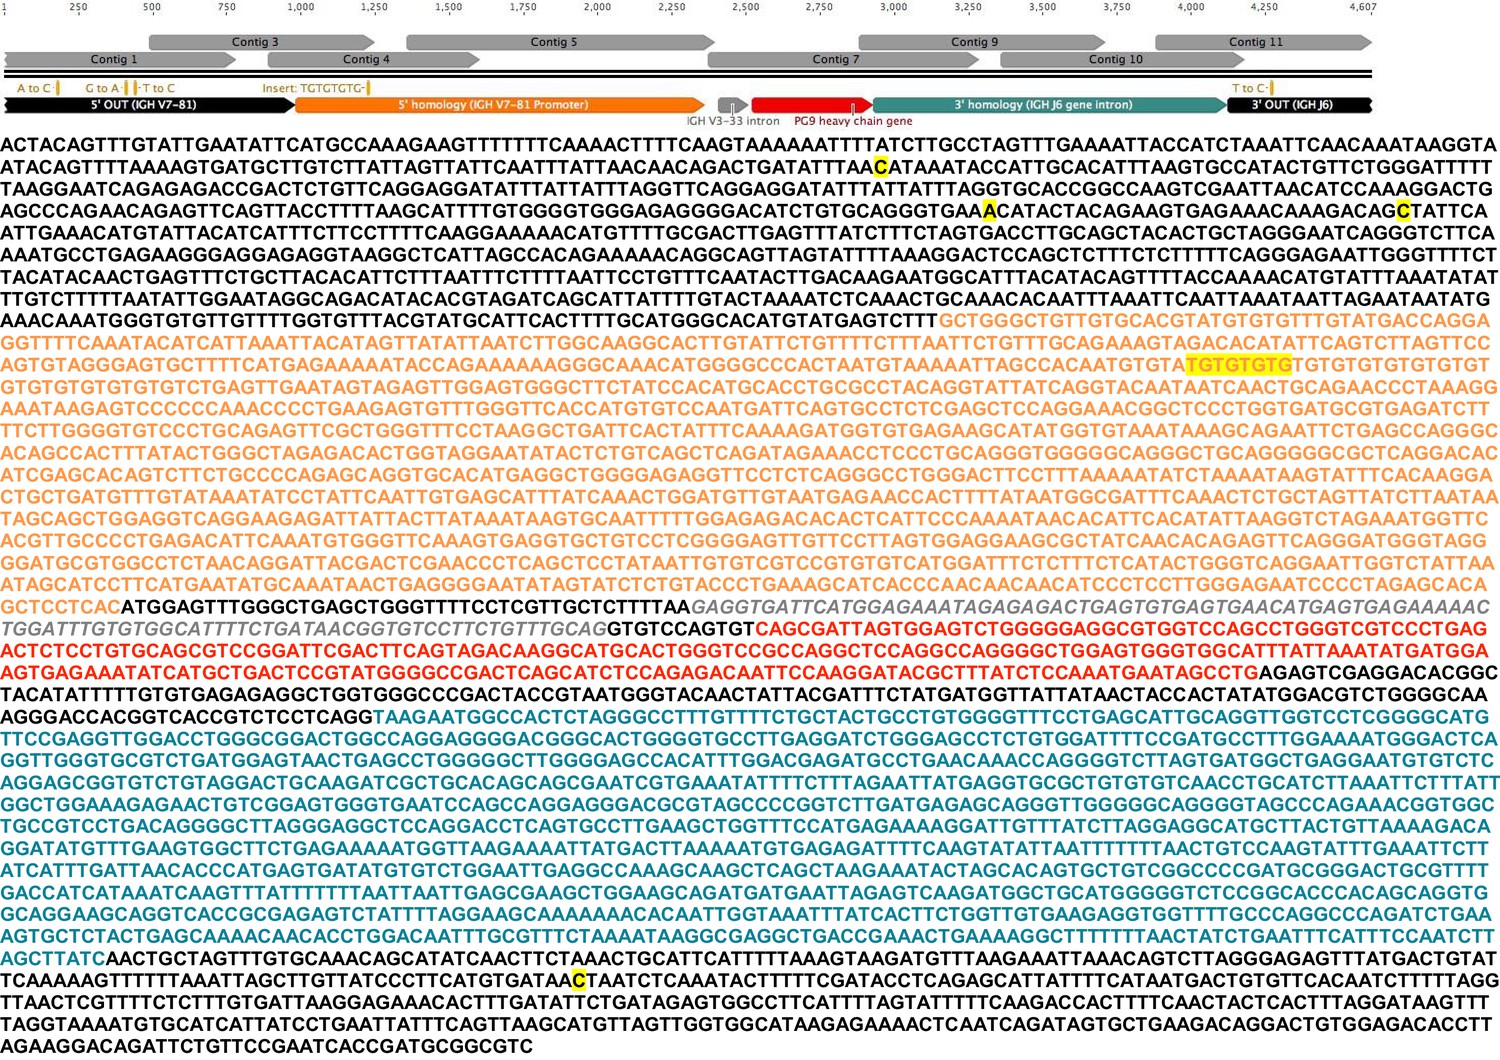
'Out/out PCR' amplicon sequence generated from gDNA derived from EBV transformed polyclonal cells engineered using the ‘V781’ strategy and selected using C108 SOSIP in FACS.
A 5.5 Kb PCR product was obtained (red box 'S3C' Figure 2F) that was gel purified and Sanger sequenced using a series of primers to give overlapping sequence reads indicated by the grey arrows above the linear diagram at the top of the figure. Annotations are represented by font color and correspond to the linear diagram at the top of the page. The PCR product encompasses gDNA sequence from the V781 5’UTR (5’ of the donor DNA HR) to the intron after J6 (3’ of the donor DNA HR) to ensure the gene is placed in the correct location in the genome. Discrepancies between expected sequence (IMGT reference sequence and donor DNA design) are annotated in orange font in the linear diagram and highlighted yellow in the nucleotide sequence.
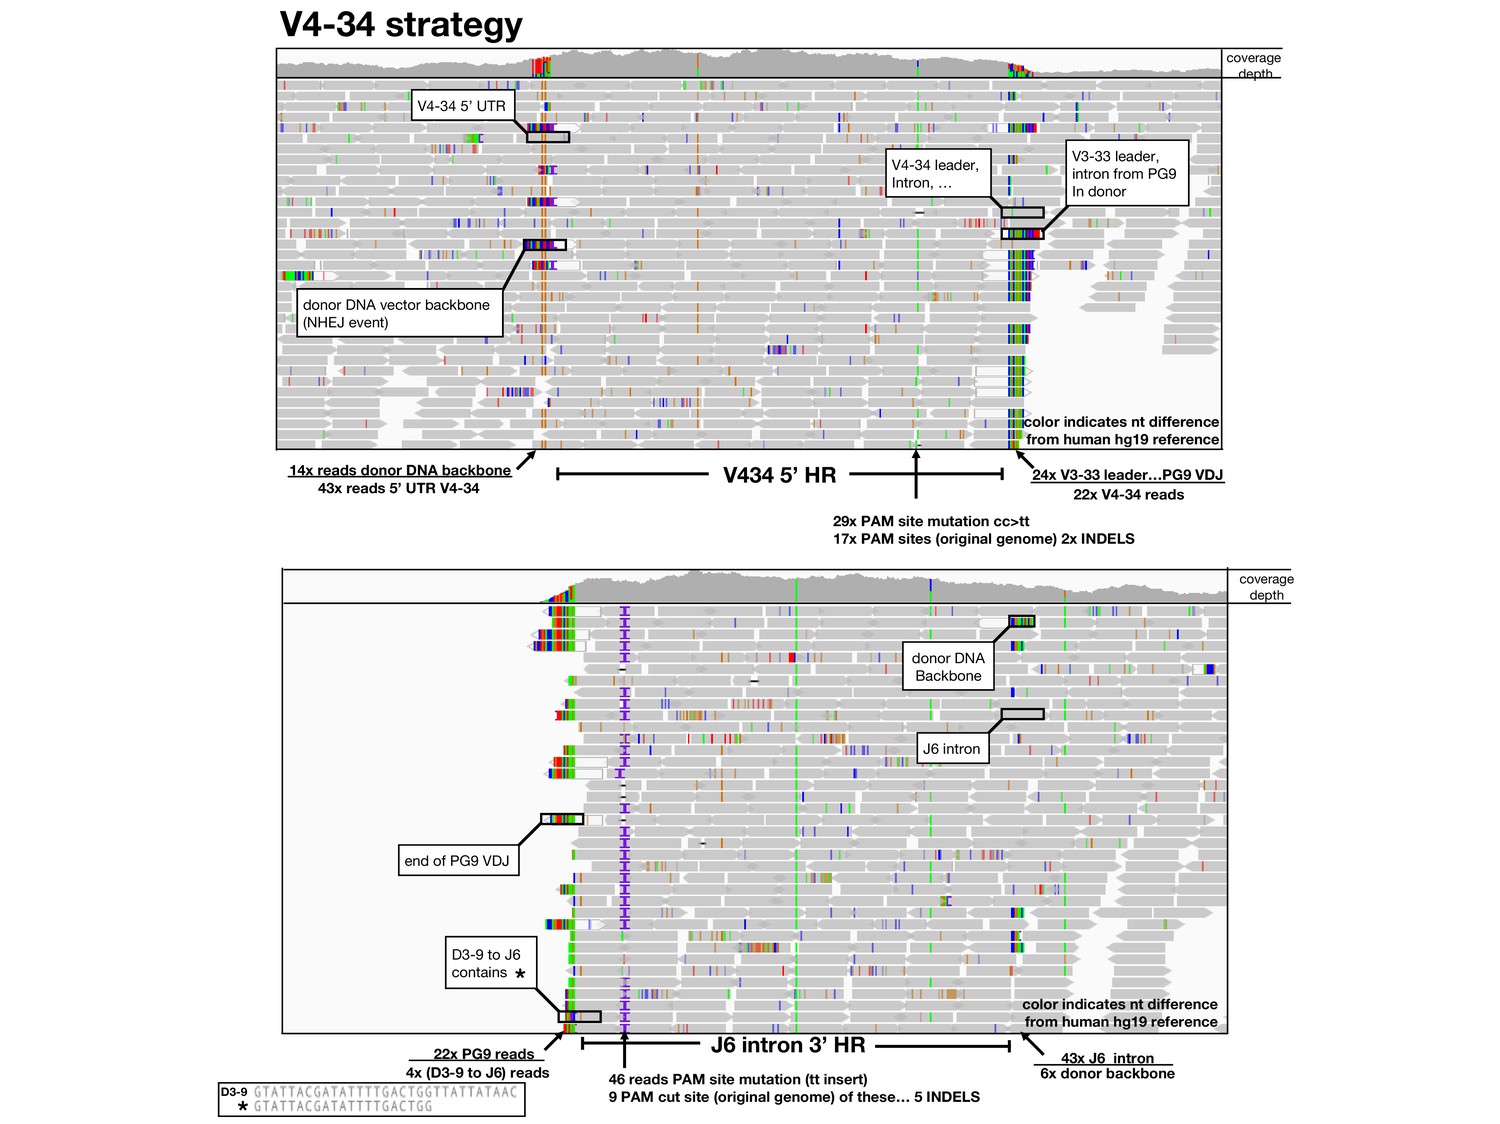
Figure 2—figure supplement 6
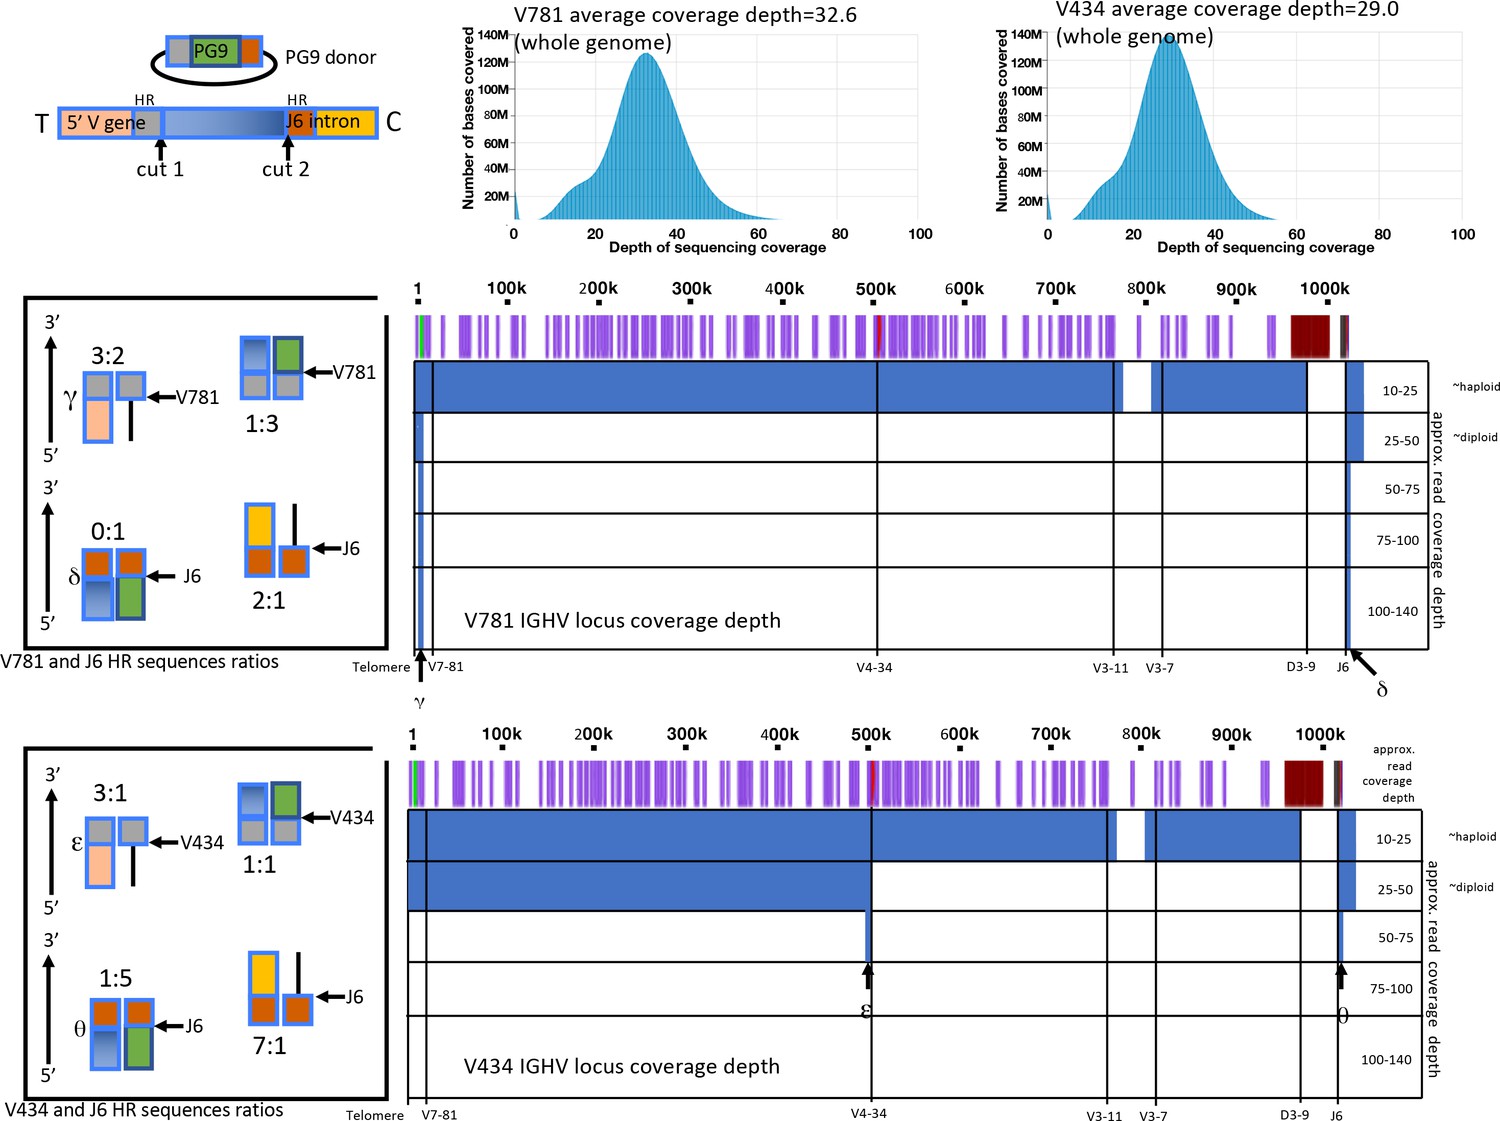
Amplification free genome sequencing analysis.
Histograms (top right) show depth of sequencing coverage over the entire genome for V781 or V434 engineered, C108 selected cells. Approximate sequencing depth coverage for the IGHV locus from these lines are shown below (in blue) by position from the V7-81 5’ region to the J6 intron for both cell lines (Positions of V genes are shown in purple with the V781 and V434 highlighted in green and in red. To the right are ratios of reads with particular sequences at the 5’ and 3’ homology region junctions (by color based on the linear diagram legend at the top left), indicating frequency of HR and NHEJ events.
Figure 2—figure supplement 7
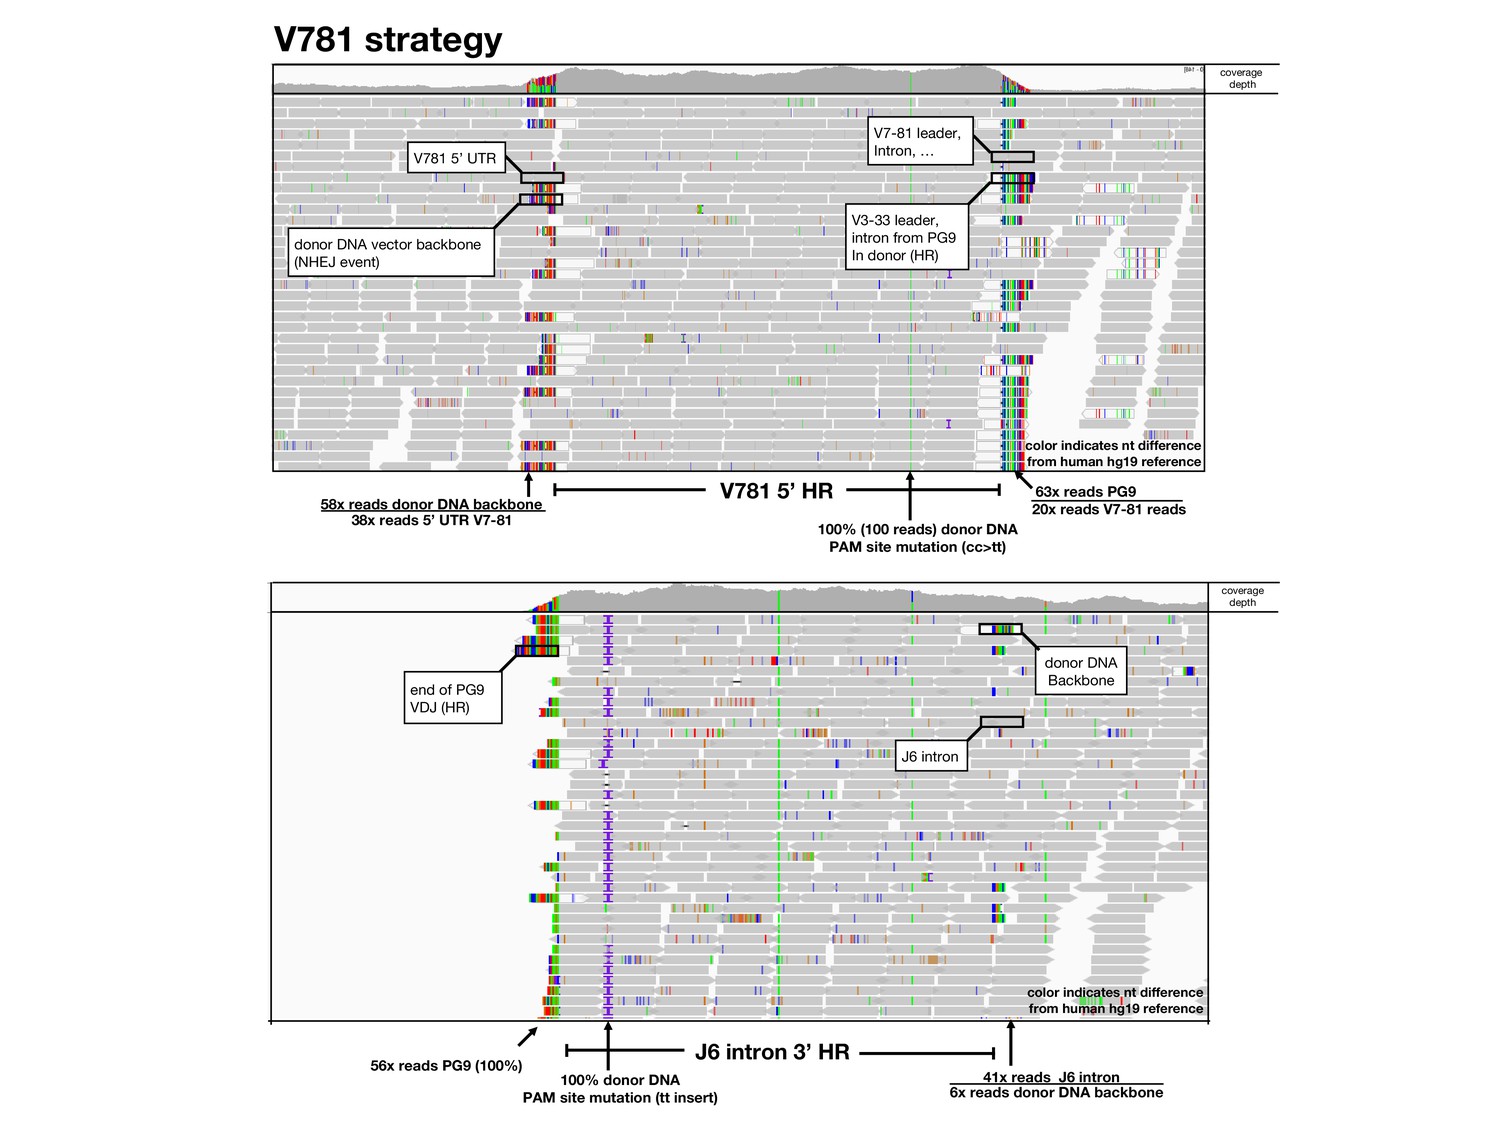
Amplification free genome sequencing analysis.
Using the Integrative Genomics Viewer (IGV), HiSeq reads mapped to 5’ (top) and 3’ (bottom) homology regions of the germline human reference genome are shown as grey arrows below a read coverage depth map from 5’ to 3’ position in the locus. Nucleotides which differ in the read compared with the reference are shown in color. BLASTn or alignments were used to identify sequences and identified sequences are labeled and ratios of sequences in these junction areas are given.
Figure 2—figure supplement 8
Amplification free genome sequencing analysis.
Using the Integrative Genomics Viewer (IGV), HiSeq reads mapped to 5’ (top) and 3’ (bottom) homology regions of the germline human reference genome are shown as grey arrows below a read coverage depth map from 5’ to 3’ position in the locus. Nucleotides which differ in the read compared with the reference are shown in color. BLASTn or alignments were used to identify sequences and identified sequences are labeled and ratios of sequences in these junction areas are given.
Figure 2—figure supplement 9
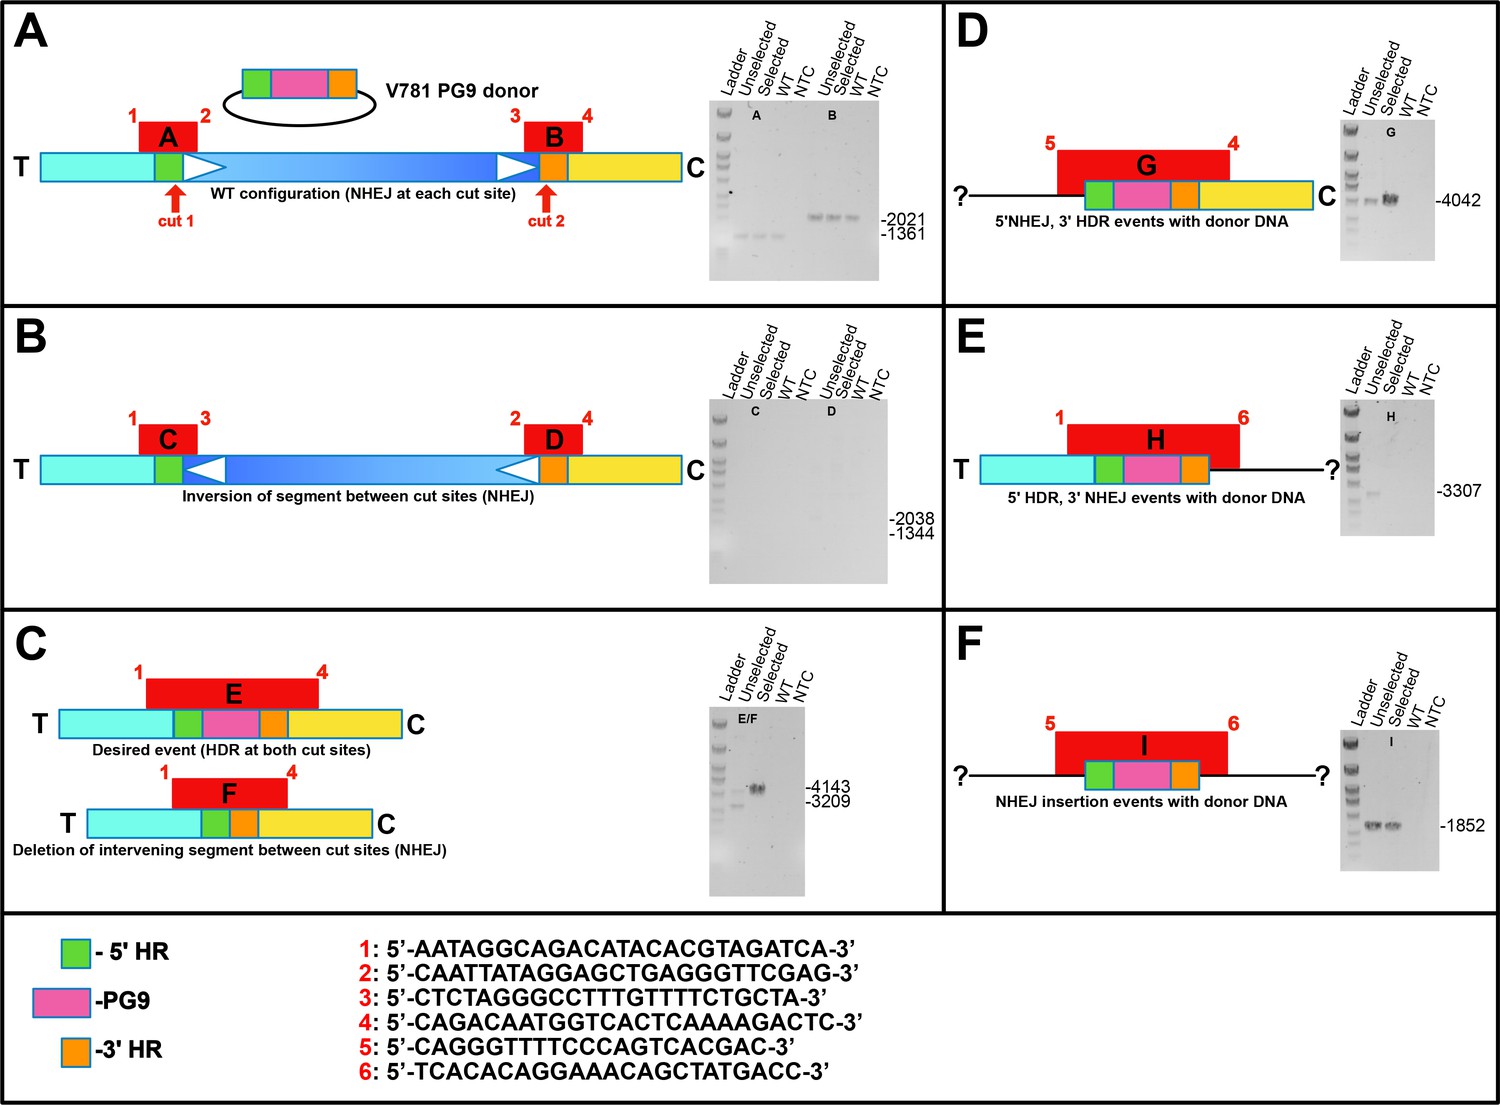
Linear diagram schematics showing organization of V781 Donor DNA and target chromosome as well as different possible NHEJ and HR repair events at 5’ and 3’ crispr/cas9 cut sites.
These possibilities were analyzed by attempting to amplify them by PCR (the various fragments indicated in red using numbered primers shown at the bottom of the figure). Amplifications using gDNA from WT, engineered unselected, engineered C108 selected or from a no template control are shown.
Figure 2—figure supplement 10
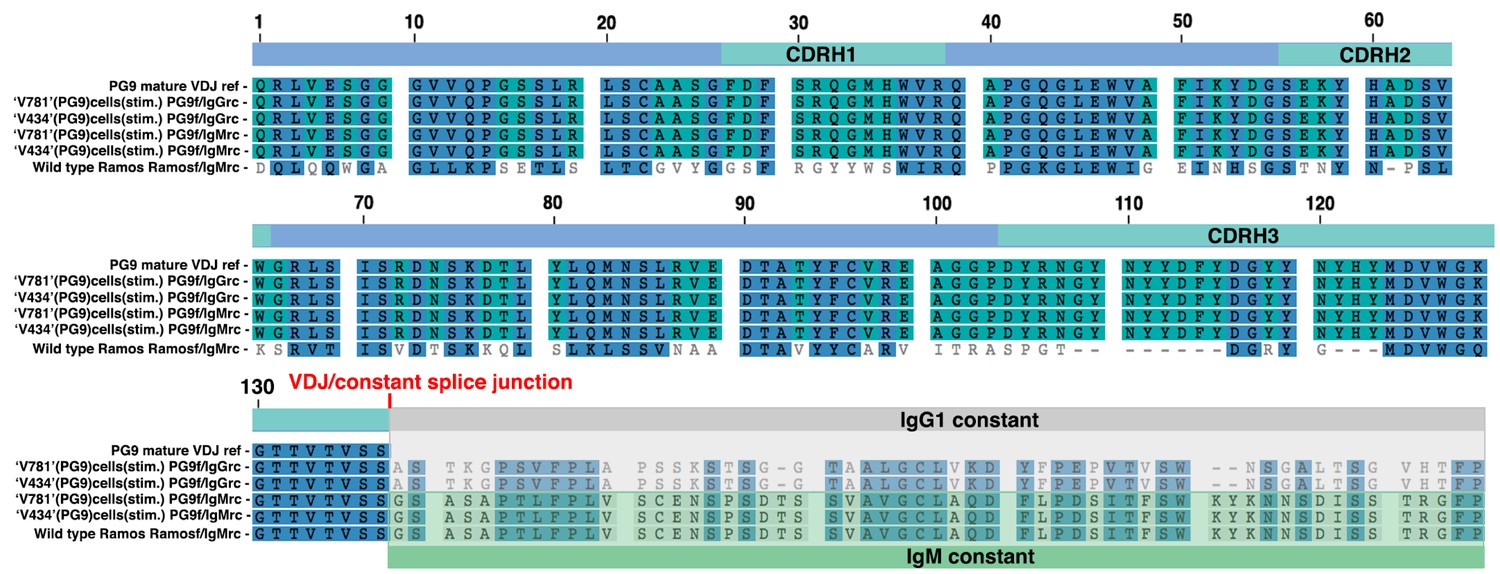
Sanger sequences of PCR products amplified from the cDNA derived from different.
Ramos cell lines and translated in the correct frame into amino acid sequence. Cell line is indicated to the left of the sequence along with the PG9 VDJ reference. Either Ramos VDJ specific or PG9 VDJ forward primers were used with either IgM or IgG specific reverse primers, also indicated to the left of the sequence. HC VDJ numbering and CDRs are indicated in the linear diagram above the sequences.
Figure 3 with 2 supplements
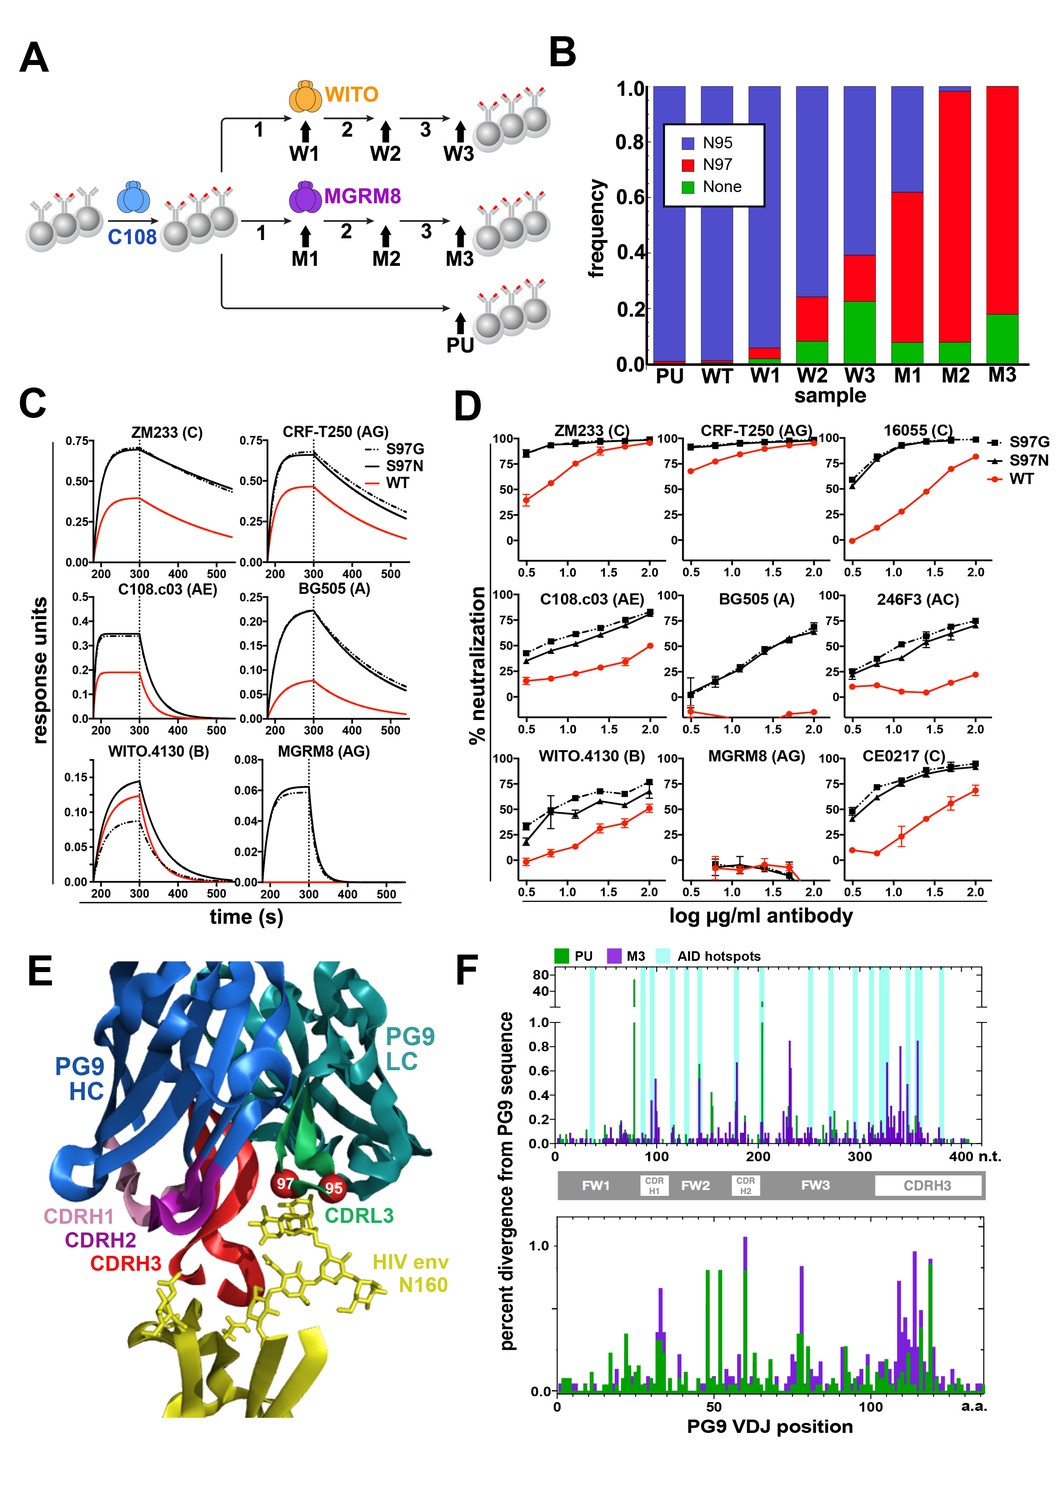
Engineered Ramos cells undergo somatic hypermutation and BCR variants with improved HIV neutralizing breadth and potency can be selected.
(A) Ramos cells engineered to express the PG9 HC VDJ using the V781 universal strategy were enriched using the C108 SOSIP and subsequently passaged without selection (passaged unselected, ‘PU’) or with three rounds of selection using either WITO or MGRM8 SOSIP strains, (W1-3 and M1-3). gDNA and mRNA samples were obtained for analysis from cultures as indicated by black arrows. (B) Ramos LC CDRL3 changes after consecutive WITO or MGRM8 SOSIP selection steps. The bar graph shows sequence read frequencies from each sample containing either the original N95, N97, or glycan deleted phenotypes. (C) The wild type PG9HC/RamosLC chimera as well as representative mutants shifting the LC glycan (S97N), or eliminating it (S97G), were expressed as IgGs and characterized for their binding to various HIV Env trimers using Biolayer interferometry (BLI). PG9 chimera-saturated sensors were exposed to 500 mM SOSIP Env trimer (180–250 s) and then PBS (250–500 s) for binding and dissociation kinetics measured as response units (RU). (D) PG9HC/RamosLC WT chimera and the CDRL3 mutant IgGs were tested for neutralization against the panel of pseudoviruses from Figure 1. Those showing differences between WT and mutant Abs are shown as neutralization titrations using the TZM-bl assay. % neutralization (y-axis) is shown as a function of IgG concentration (log μg/ml) on the x-axis. (E) The approximate positions of the Ramos CDRL3 residues 95 and 97 are modeled onto the atomic coordinates for PG9 antibody in complex with a HIV Env V2 apex scaffold (PDB:3U2S) and visualized using PyMac. (F) Mutations in the new PG9 VDJ gene in C108 enriched (V7-81 engineered) cells were compared after continuous passage without selection (PU), or with 3 rounds of MGRM8 selection (M3). The nucleotide (top graph) or amino acid (bottom graph) changes from the originally inserted gene are shown in green (PU sample) or purple (M3 sample) by gene position along the x-axis as a percentage of the total analyzed sequences (y-axis). Positions of CDRH1, 2 and 3 are shown in the linear diagram and the locations of AID hotspots are indicated by blue columns on the nucleotide position (x)axis.
Figure 3—figure supplement 1
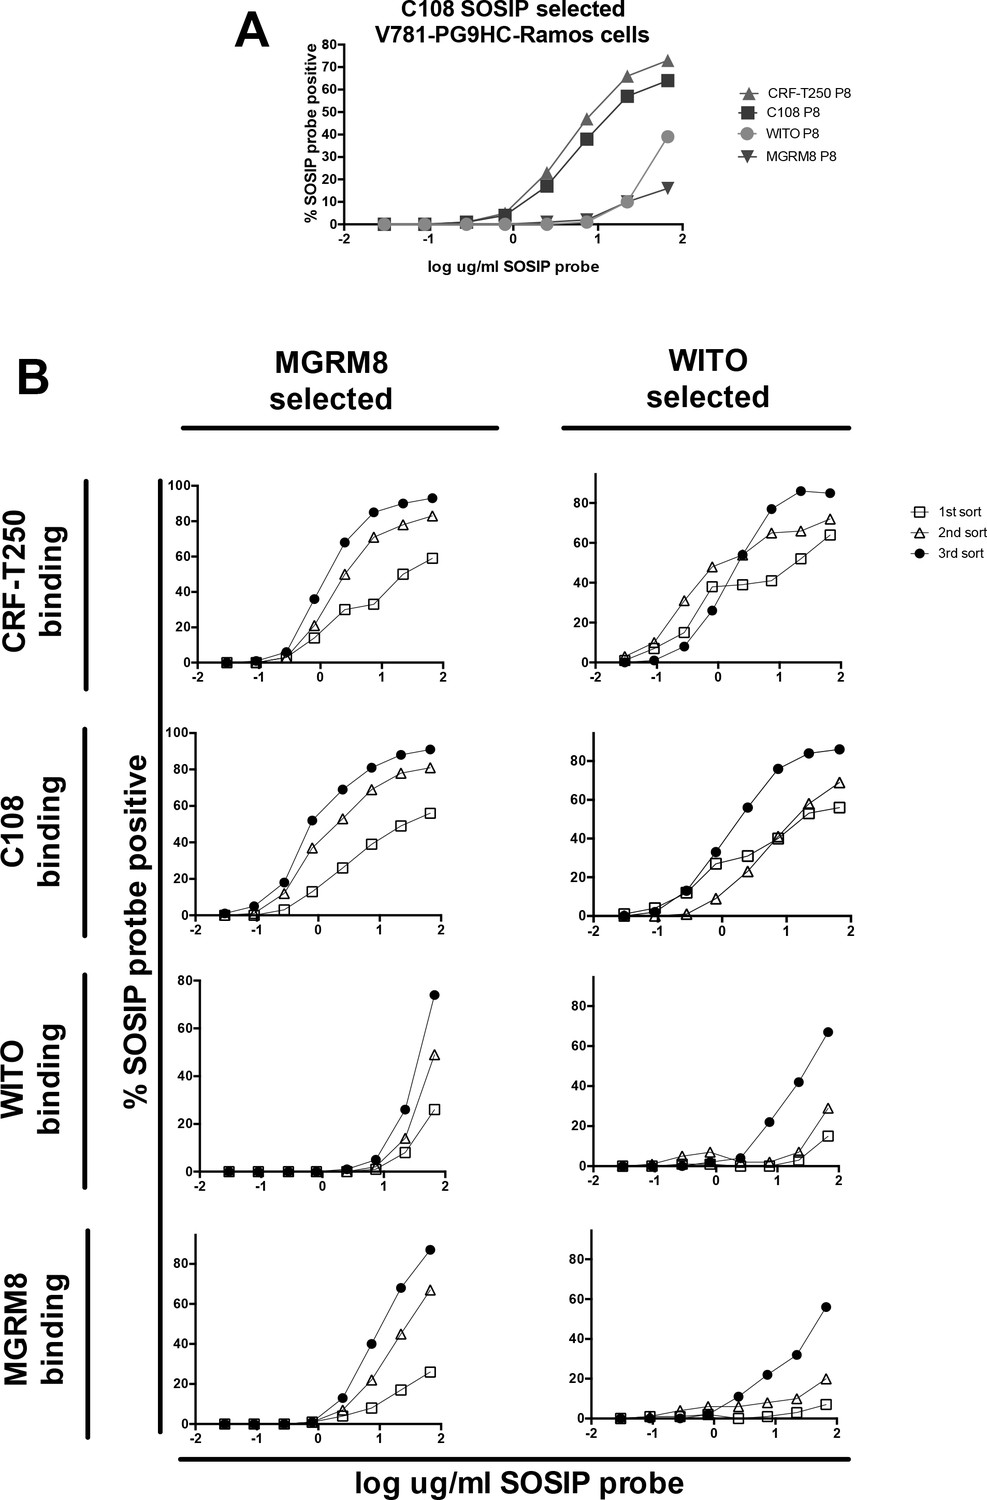
HIV Envelope trimer (SOSIP) binding to engineered Ramos cells after repeated FACS sorts using MGRM8 or WITO SOSIP to enrich higher affinity variants.
(A) Titration curves showing the binding of 4 HIV Envs (SOSIPs) to ‘V781’PG9-engineered Ramos cells eight passages after FACS selection with C108 SOSIP. % SOSIP+ cells (gate set using nonengineered Ramos cells incubated with the same probes), are plotted against log ug/ml SOSIP probe concentration: C108 (blue), CRF-T250 (red), WITO (orange) and MRGM8 (purple). Binding of WITO and MGRM8 SOSIP to the C108 selected B cells is relatively weak. (B) Titration curves as in (A) after one, two, or three steps of cell selection using WITO or MGRM8 SOSIP probes to enrich higher affinity variants. Rounds of selection with either WITO or MGRM8 improved affinity of cells line for all four SOSIPs.
Figure 3—figure supplement 2
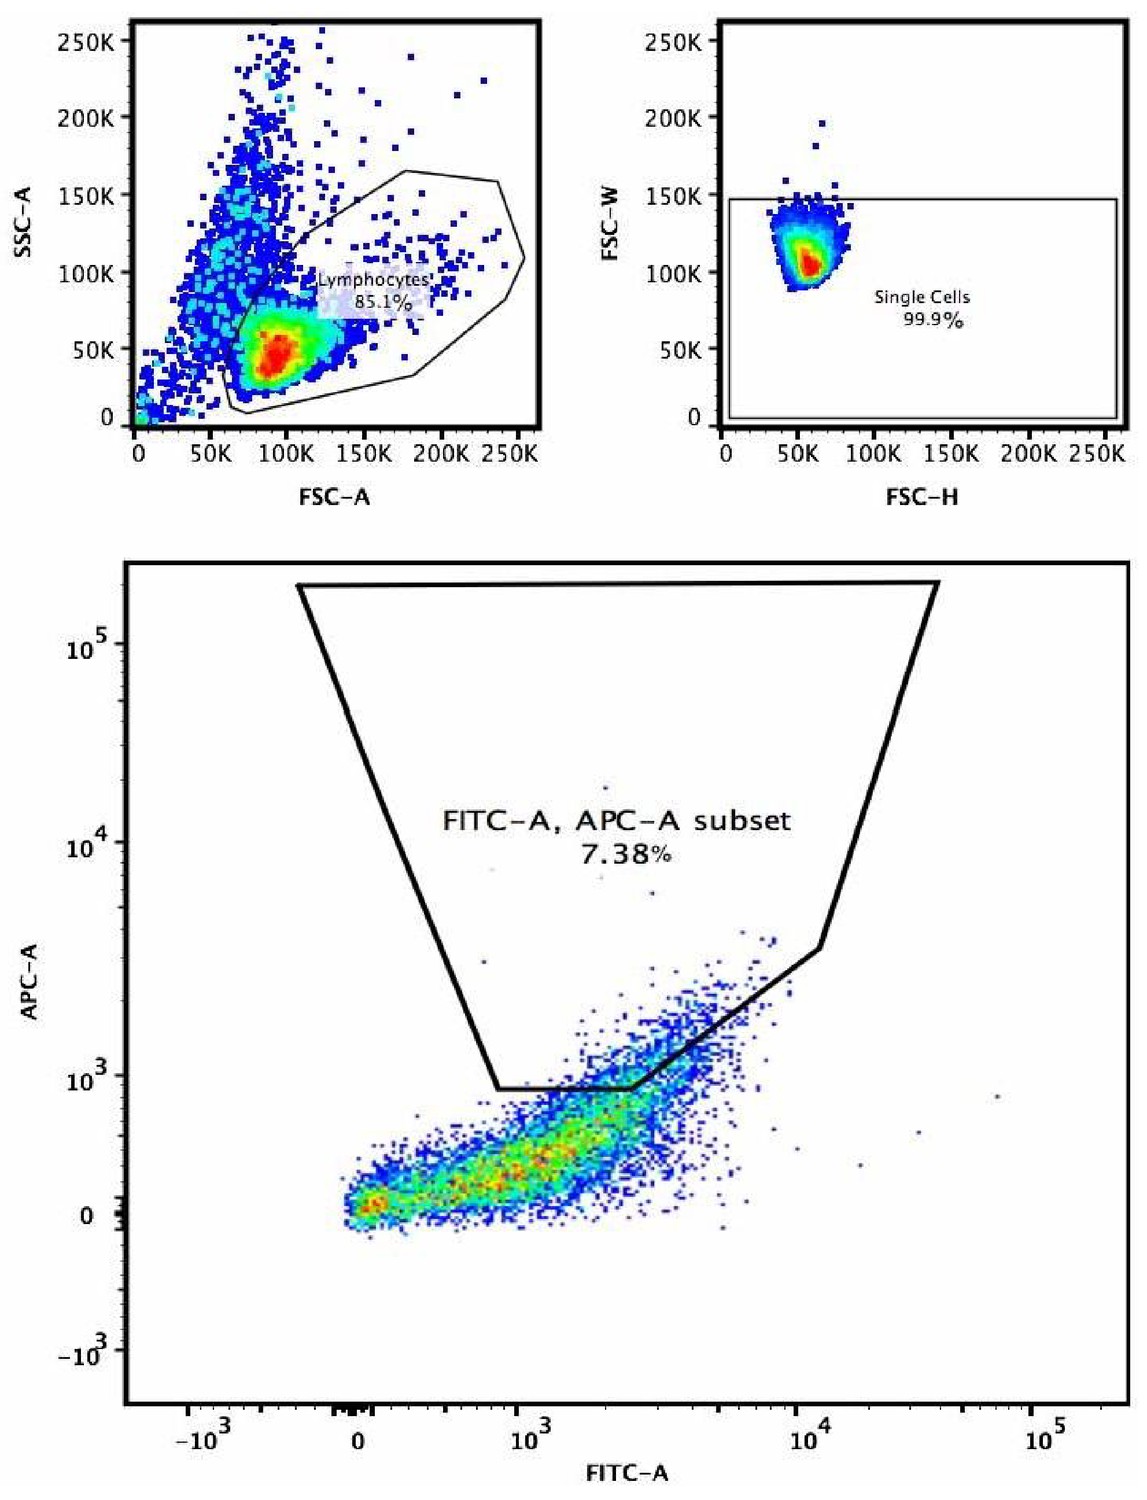
Example of gating strategy for the selection of higher affinity B cell receptor variants in V781(PG9)-engineered and C108 SOSIP-enriched cells.
After determining the EC10 concentrations in preliminary experiments, biotinylated MGRM8 or WITO SOSIP bound to APC labeled streptavidin tetramers were incubated with cells along with FITC labeled anti-lambda LC antibody to normalize for cell variants with higher levels of surface expressed BCR. 5–10% of the live single cell gate that showed the highest FITC normalized fluorescence was sorted for further culture and two subsequent rounds of enrichment. Top left is forward scatter (X-axis) side scatter (Y-axis) plot to gate on live lymphocytes. Top left plot is forwards scatter-H (X-axis) vs. forward scatter-W (Y-axis) to select single cells. Large plot is lambda chain FITC (X-axis) vs. MGRM8 SOSIP-streptavidin-APC.
Figure 4 with 1 supplement
Engineering primary human B cells.
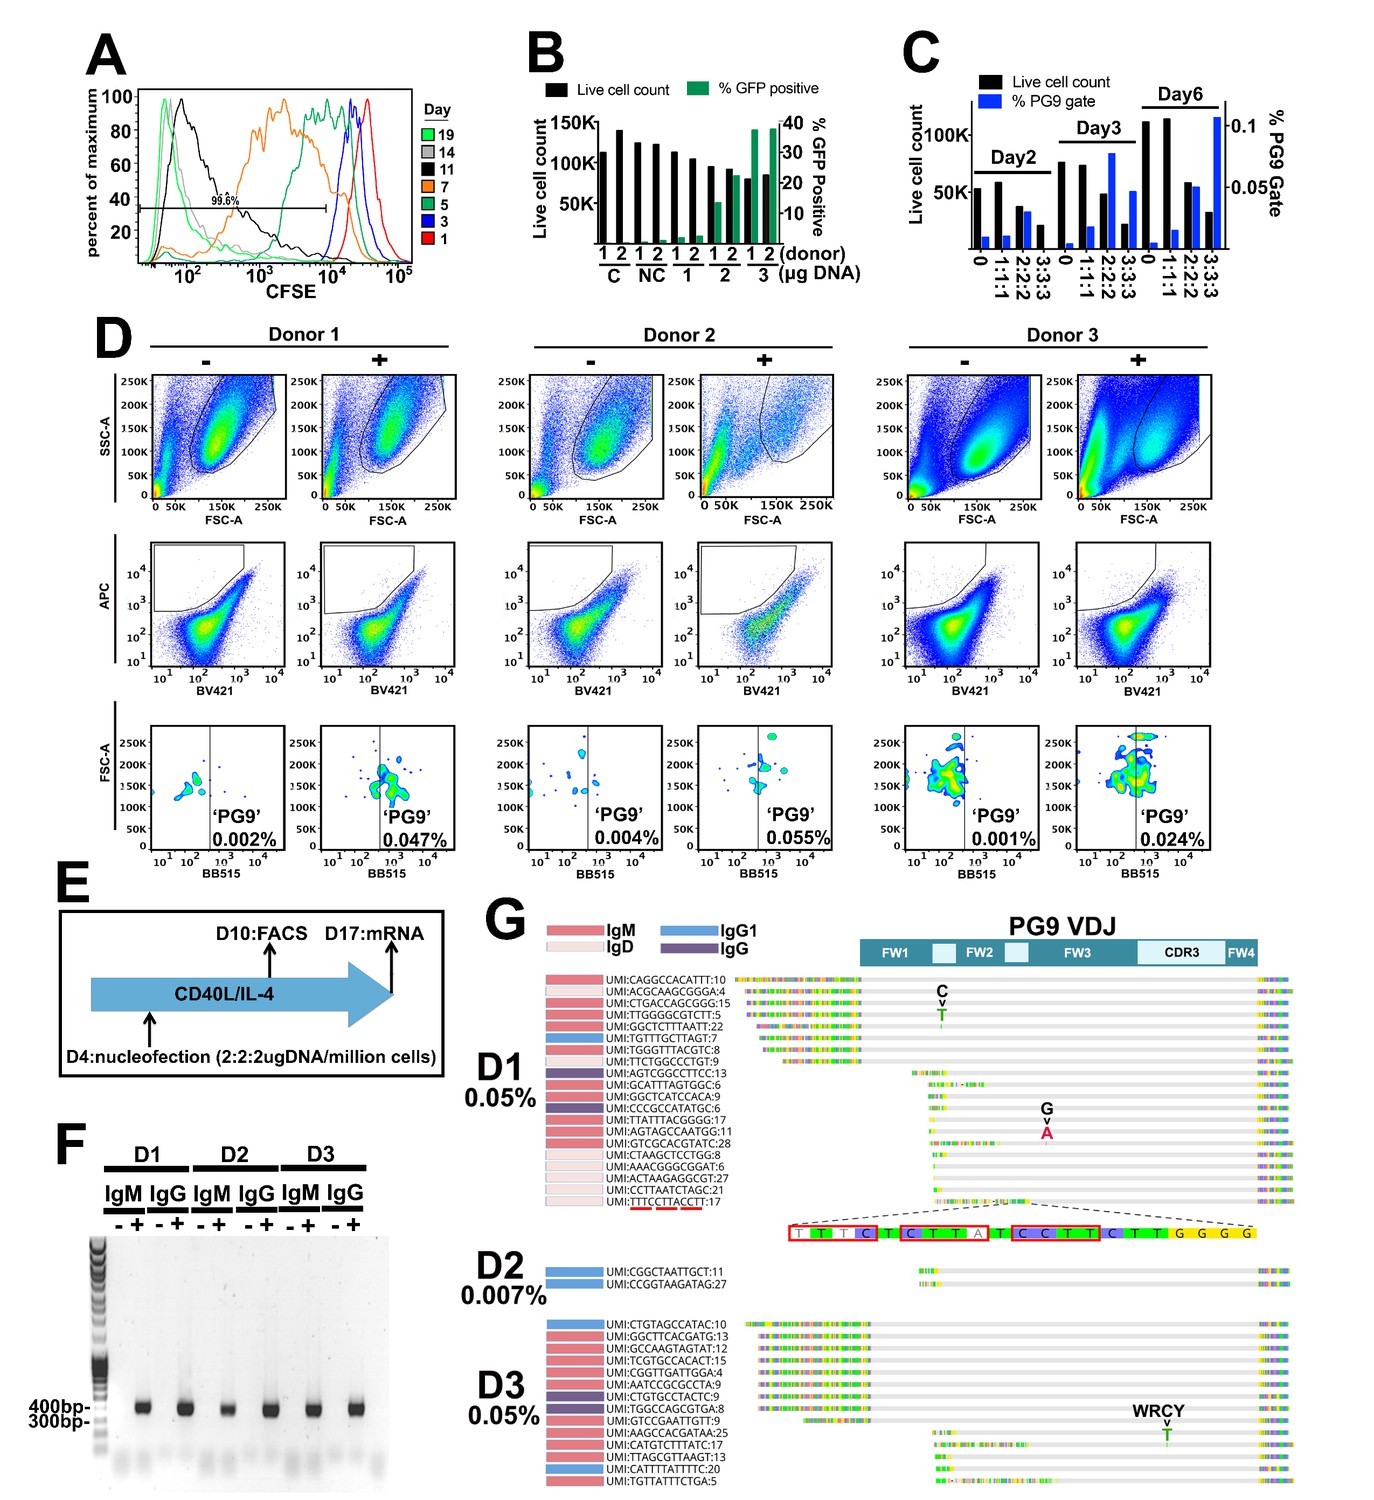
(A) CD19 +B cells were stained with CFSE after purification and cultured in CD40L/IL-4 media. Cells were analyzed for dye brightness on days 1, 3, 5, 7, 11 and 14. Loss of brightness is caused by dilution of the dye that occurs during cell division. Histograms show cell numbers (Y axis) with different CFSE brightness (X axis) on different days from a single donor that was representative of all samples analyzed. (B) Cells were nucleofected on day four of culture with a 7.78 kb GFP plasmid. Live cell counts and GFP expression were analyzed 48 hr later and are displayed in the bar graphs. Samples from two different donors were analyzed (1 or 2). C is a no nucleofection control. NC is a no DNA nucleofected control. Other samples were transfected with 1 2 or 3 ug of GFP plasmid as indicated. (C) Cells nucleofected on day 4 with engineering reagents were stained 2, 3 or 6 days later with ZM233 SOSIP (APC and BB515) and with ZM233 ΔN160 (BV421). Live cell and PG9+ cell gate frequencies for samples nucleofected with 1, 2 or 3 ug of each engineering plasmid are shown. (D) B cells from three different donors were nucleofected on day 4 of culture with 2 ug of each plasmid from the V374 universal B cell editing strategy and stained 6 days later for PG9HC cell surface expression. Frequencies of APC+/BV421-/BB515+ from live single cell gated samples are shown for both engineered (+) and non-engineered (-) controls. (E) Diagram of the engineering and analysis experiment for B cells from three different donors. (F) mRNA from engineered and non-engineered cell cultures was harvested on day 13 post engineering. RT-PCR was performed using PG9 IgM or IgG specific primers. PG9 as both isotypes could be detected in all three engineered donor samples (+) but not in non-engineered controls (-). Sanger sequencing of amplicons confirmed these sequences. (G) Unique molecular identifier (UMI) tagged Ig cDNA libraries were amplified from day 13 mRNA samples using 5’RACE-PCR and sequenced using the MiSeq. PG9 HC was detected in all engineered samples as IgM, IgD, IgG1 and IgG4 isotypes. Frequencies of PG9 reads in these data sets are given. Three molecular identifier groups (MIGs) show mutations in the PG9 VDJ gene as indicated, one of these is in a predicted WRCY AID hotspot motif. N-terminally truncated MIGs from the dataset appear to have template switched prematurely during cDNA synthesis at C-rich regions of the PG9 VDJ gene.
Figure 4—figure supplement 1
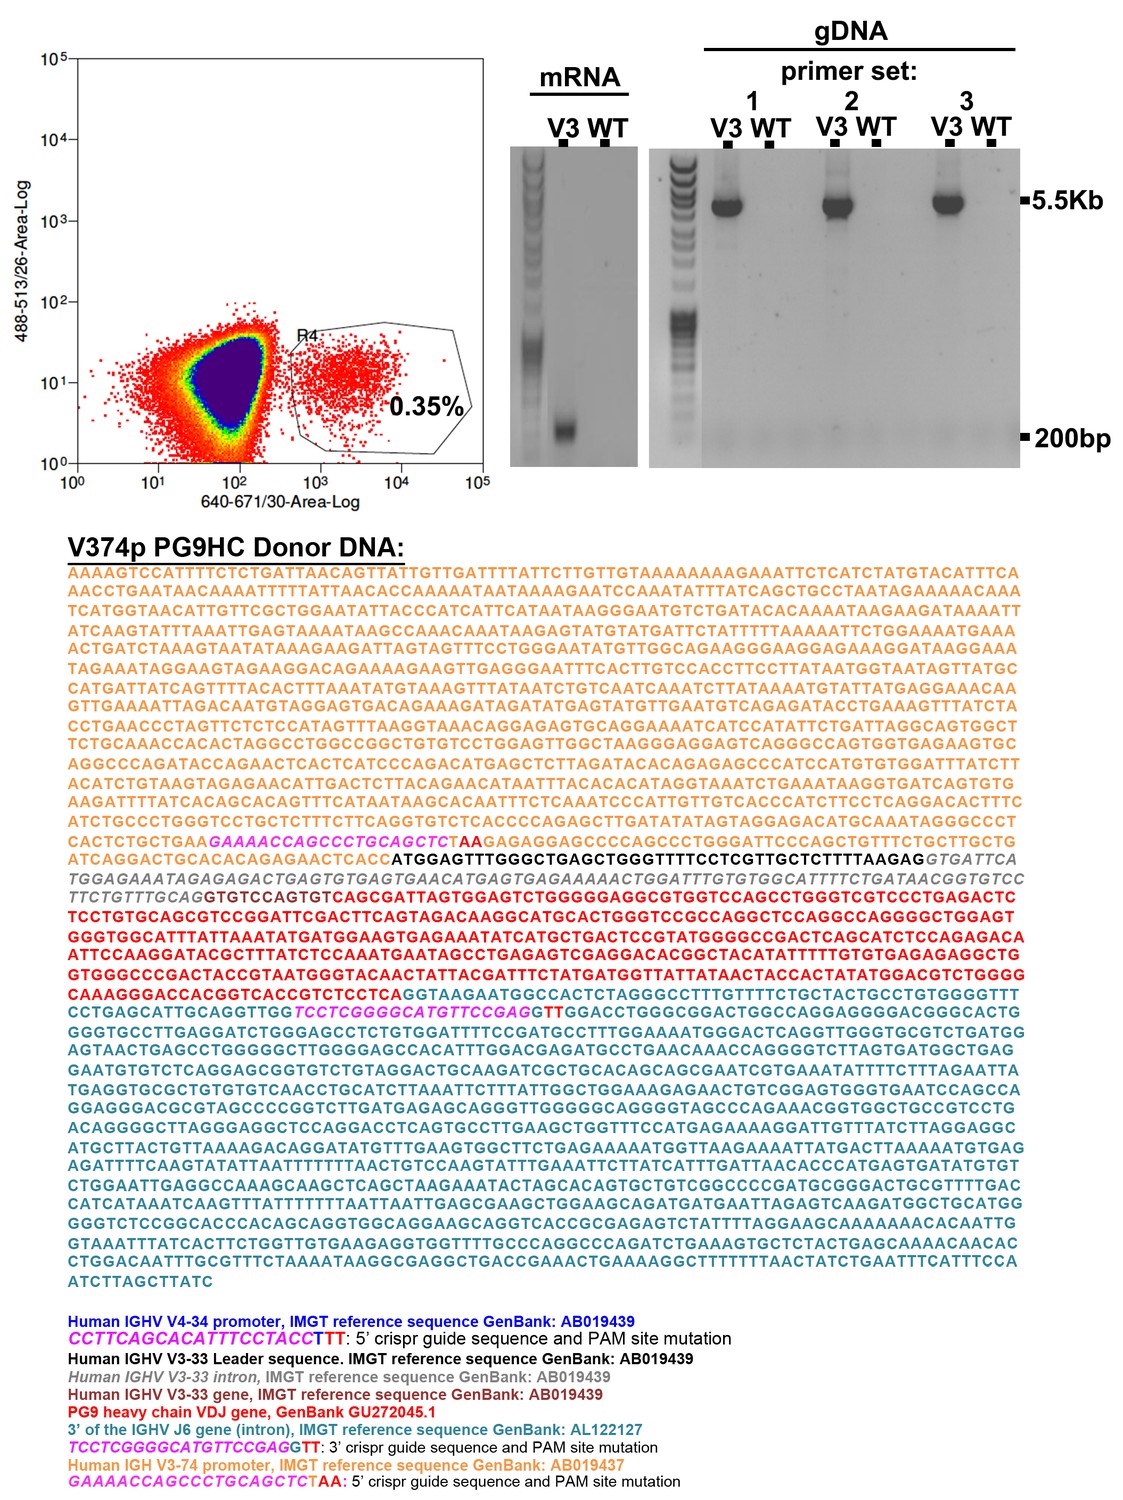
V3-74 Universal B cell engineering strategy.
The annotated donor DNA highlights 5’ and 3’ CRISPR-Cas9 target sequences (PAM sites are mutated in the donor plasmid). When this donor was co-nucleofected into Ramos B cells with the 5’ and 3’ cas9 plasmids, roughly 0.35% of cells could bind C108 SOSIP-APC three days later by FACS (top left). C108 enriched cells were further cultured. gDNA and mRNA from these cells was purified. RT-PCR with PG9 specific primers showed a band made up of PG9-IgM from engineered cells but not non-engineered controls. Out/out PCR on gDNA template across V374 to the J6 intron could amplify bands of the expected size from engineered cells only using three different primer sets (top right). Sanger sequencing of all bands show successful engineering and expression of PG9-IgM in this cell line.
Additional files
-
Supplementary file 1
List of primers used to generate PCR products presented in this study.
- https://doi.org/10.7554/eLife.42995.024
-
Transparent reporting form
- https://doi.org/10.7554/eLife.42995.025
Download links
A two-part list of links to download the article, or parts of the article, in various formats.
Downloads (link to download the article as PDF)
Open citations (links to open the citations from this article in various online reference manager services)
Cite this article (links to download the citations from this article in formats compatible with various reference manager tools)
Reprogramming the antigen specificity of B cells using genome-editing technologies
eLife 8:e42995.
https://doi.org/10.7554/eLife.42995


