MYOD1 functions as a clock amplifier as well as a critical co-factor for downstream circadian gene expression in muscle
- University of Florida, United States
- Genentech Inc, United States
- University of Florida Health Science Center, United States
- Allen Institute for Brain Science, United States
Figures
Figure 1

MYOD1 binding coverage on skeletal muscle circadian genes.
(A) Overlap of genes bound by MYOD1 (red) and circadian genes (grey) in adult skeletal muscle (JTK_CYCLE p-value < 0.03). (B) Gene-ontology enrichment terms for MYOD1-bound, circadian genes in adult skeletal muscle. (C-F) Temporal mRNA expression profiles of MYOD1-bound, circadian genes in adult skeletal muscle from either MYOD1-CE (dotted red) or C57BL/6J (solid black, wildtype) mice. Dark shading indicates the relative dark/active phase as these mice were reared in DD at the time of collection. At each time-point RT-PCR expression values are displayed as average fold-change relative to the Rpl26 house-keeping gene ± SEM (n = 3). Relative gene expression was calculated by the standard curve method. Results were analyzed with one-way ANOVA comparing WT vs. MYOD1-CE, * indicates a p-value less than 0.05. (G) JTK_CYCLE statistics for the RT-PCR results corresponding to the temporal expression values in C-F. ‘BH.Q’ column reports false discover rates and ‘ADJ.P’ reports adjusted p-values.
Figure 2
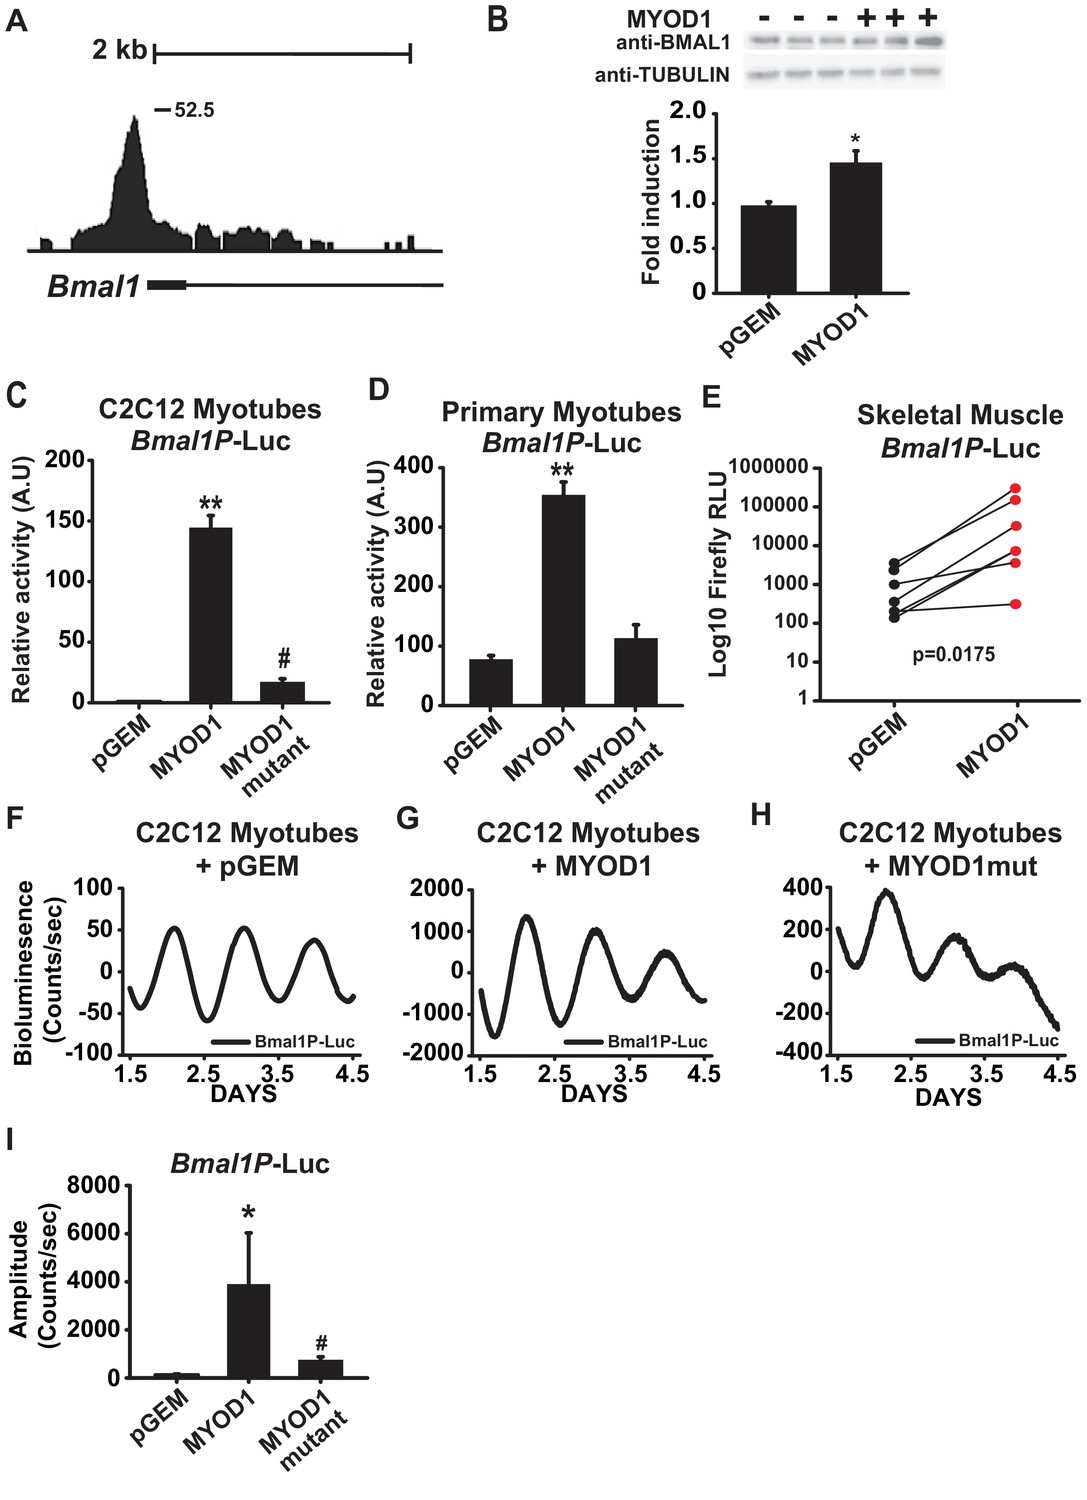
MYOD1 transactivates the Bmal1 promoter and enhances its circadian amplitude in C2C12 myotubes.
(A) UCSC genome browser visualization (mm10 genome) of MYOD1 binding tags within the Bmal1 locus. (B) Representative BMAL1 western blots from C2C12 myoblasts transiently transfected with 150 ng pGEM empty vector (-) or MYOD1 expression vector (+). Densitometric values are expressed as average fold-change of BMAL1 over the Tubulin loading control which was unchanged with MYOD1 transfection ± SEM (n = 3). Results were analyzed with one-way ANOVA, * indicates a p-value less than 0.05 (p = 0.025). Bmal1P-Luc luminescence in C2C12 myotubes (2C, n = 4 biological replicates) and skeletal muscle primary myotubes (D, n = 3 biological replicates) with transient transfection of pGEM control, MYOD1, or MYOD1mut expression vectors. Luciferase activity for each co-transfection is plotted as average fold-change in relation to the pGEM empty vector control ± SEM. Results were analyzed using one-way ANOVA, ** indicates a p-value less than 0.001. # indicates a p-value less than 0.01 comparing MYOD1 vs MYOD1mut. (E) Bmal1P-Luc luminescence in electroporated skeletal muscle. Bmal1P-Luc activity was normalized to Renilla luciferase as an electroporation control with the right-leg receiving MYOD1 expression vector (red circles) and the left leg receiving the pGEM empty vector control (black circles). The p-value statistic was calculated by performing a Mann-Whitney non-parametric t-test. Note, one outlier was removed from each group based upon the Robust regression and outlier removal (ROUT) test, with a false discovery rate of <0.01. Bmal1P-Luc Dual-Luciferase activities in skeletal muscle primary myotubes (F-H) Representative Bmal1P-Luc driven bioluminescence recordings in synchronized C2C12 myotubes co-transfected with pGEM control (F, n = 7), MYOD1 (G, n = 6), or MYOD1mut (H, n = 4) expression vectors. Luminescence recordings are expressed as average counts/sec (base-line subtracted) (I) Average Bmal1P-Luc amplitudes ± SEM calculated by JTK_CYCLE from 1.5 to 4.5 days post-synchronization. Results were analyzed with one-way ANOVA, ** indicates p-value less than 0.001, # indicates p-value less than 0.002 (n = 4 biological replicates per group).
Figure 3
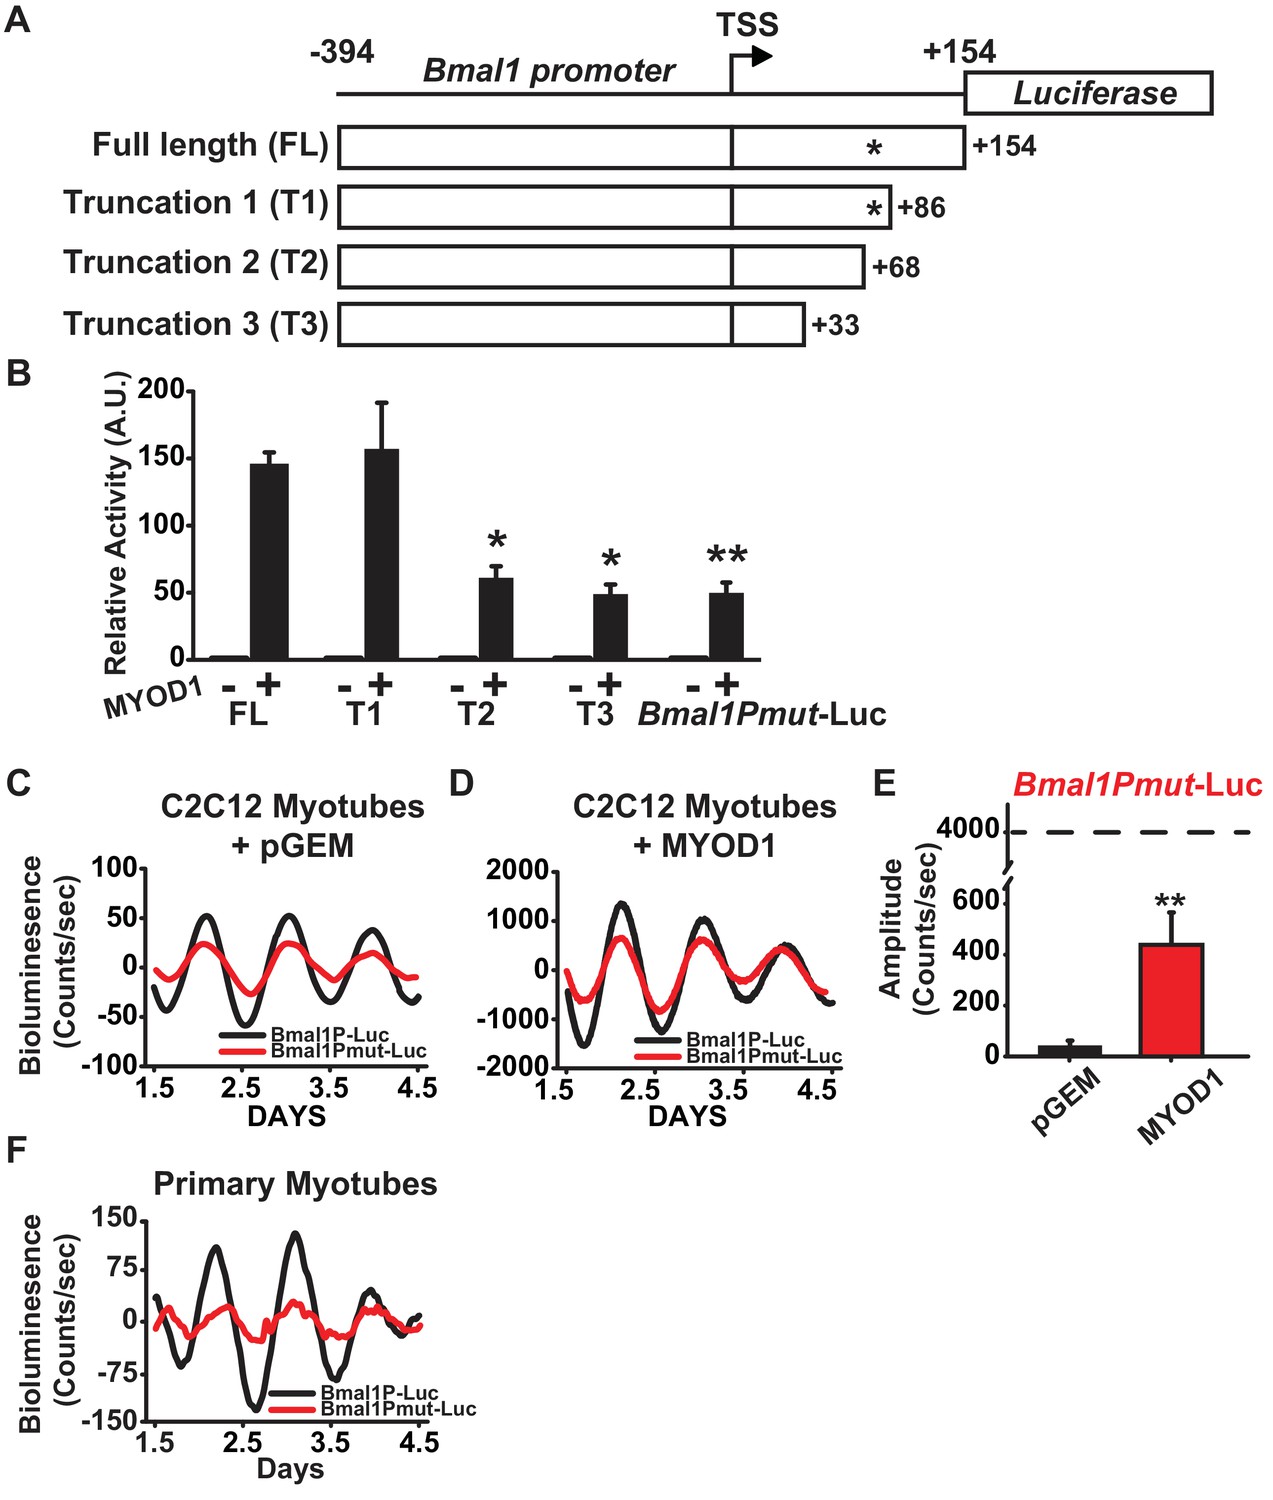
A non-canonical E-box within the Bmal1 promoter is required for amplification by MYOD1.
(A) Representative diagram of the Bmal1P-Luc promoter truncation constructs. TSS indicates transcriptional start site. * indicates the relative location of the non-canonical E-box element. FL indicates the full-length Bmal1P-Luc reporter. T1, T2 and T3 indicate the truncated reporters. (B) Dual-luciferase activities from the full-length Bmal1P-Luc, T1-T3, and Bmal1Pmut-Luc reporters (n = 4/group). Luciferase activity for each co-transfection is plotted as average fold-change in relation to the pGEM empty vector control ±SEM (n = 4). Results were analyzed using one-way ANOVA, ** indicates a p-value less than 0.001 in relation to the FL Bmal1P-Luc + MYOD1 result (p value < 0.001), * indicates a p-value less than 0.029 in relation to the FL BmalP-Luc +MYOD1 result. (C-D) Representative Bmal1P-Luc (black) and Bmal1Pmut-Luc (red) driven bioluminescence recordings in synchronized C2C12 myotubes co-transfected with the pGEM control vector (C), or MYOD1 expression vector (D). Luminescence recordings are expressed as average counts/sec (base-line subtracted). (E) Average Bmal1Pmut-Luc amplitudes calculated by JTK_CYCLE from 1.5 to 4.5 days post-synchronization (n = 3/group). Data are displayed as average amplitude ± SEM . Results were analyzed with one-way ANOVA, ** indicates p-value less than 0.001. (F) Representative Bmal1P-Luc (black) and Bmal1Pmut-Luc (red) driven bioluminescence recordings in synchronized skeletal muscle primary myotubes. Luminescence recordings are expressed as average counts/sec (base-line subtracted) for n = 3 biological replicates per group.
Figure 4 with 1 supplement
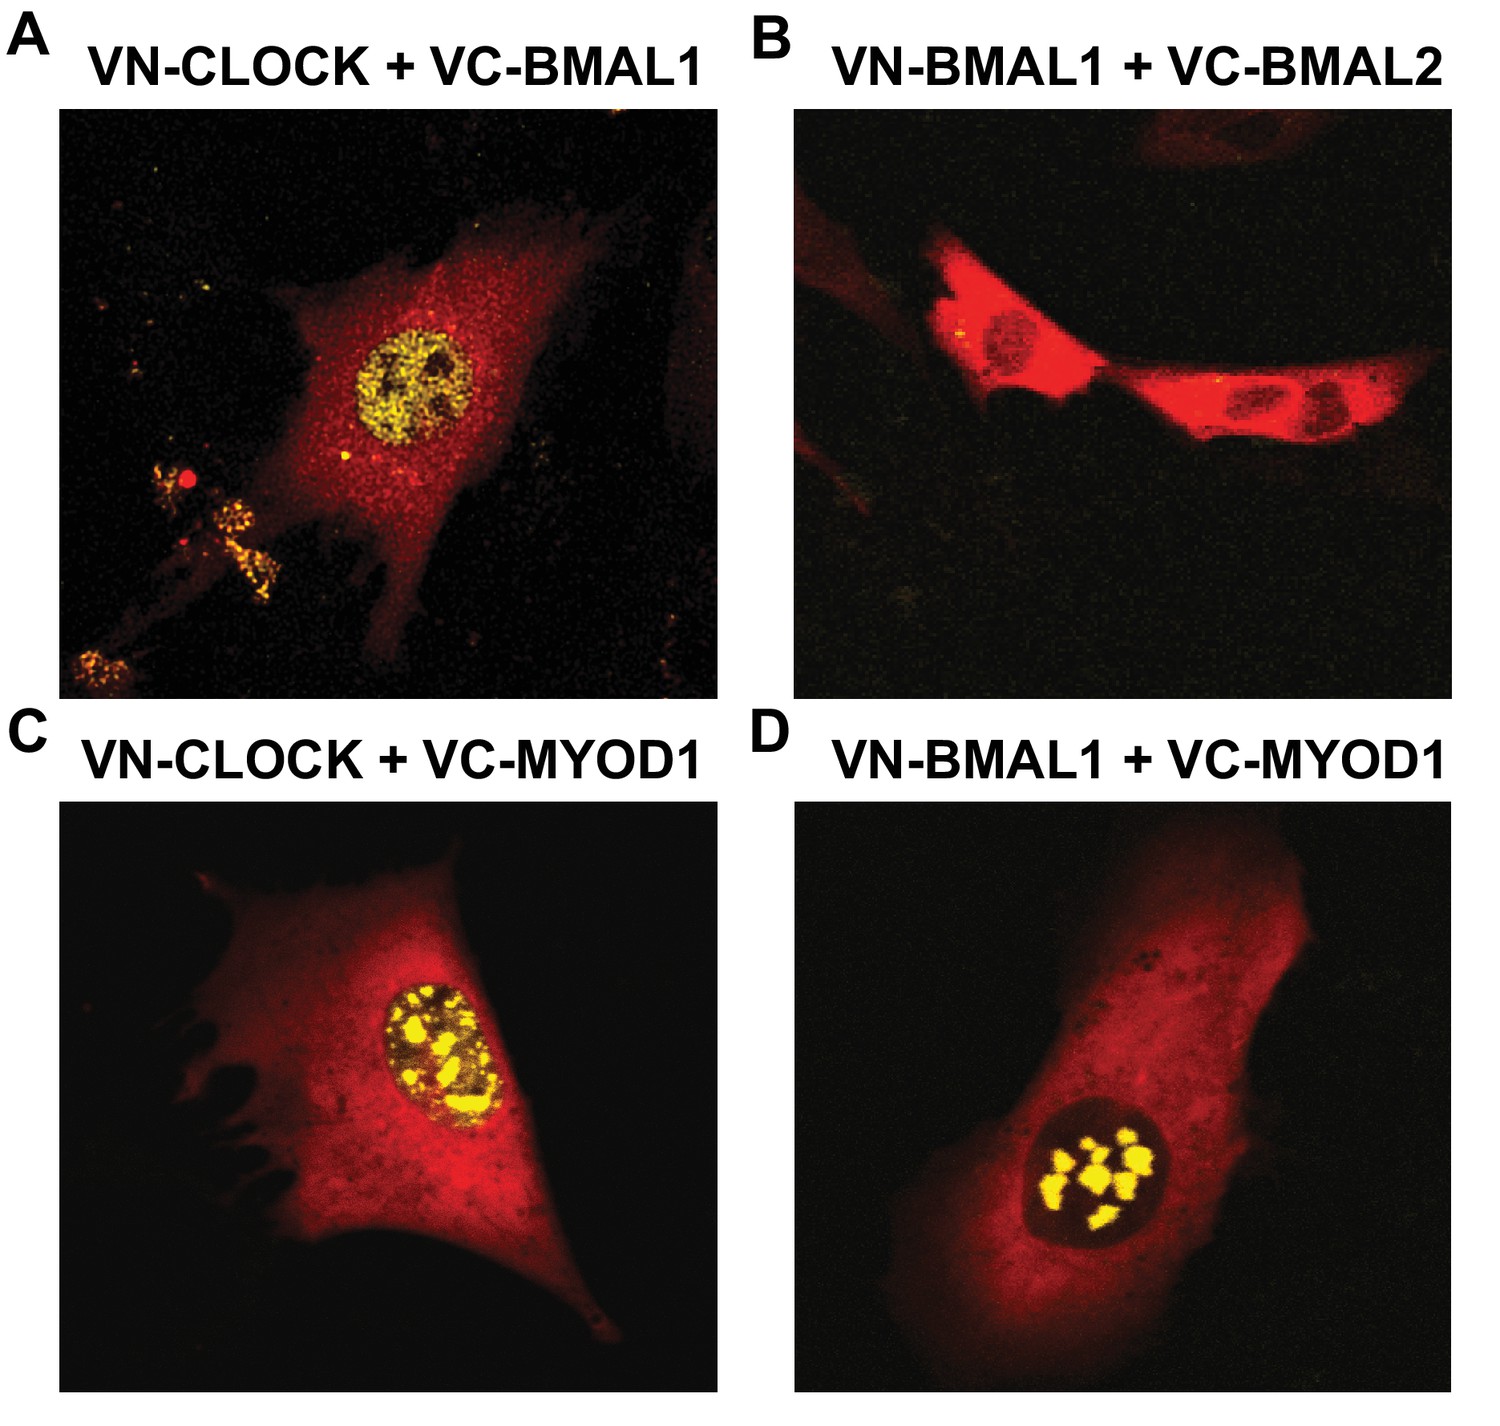
MYOD1 colocalizes with BMAL1 and CLOCK in C2C12 myonuclei.
Representative images from the BiFC assay performed in C2C12 myoblasts co-transfected with (A) VN-CLOCK and VC-BMAL1, (B) VN-BMAL1 and VC-BMAL2, (C) VN-CLOCK and VC-MYOD1, and (D) VN-BMAL1 and VC-MYOD1. mCherry expression plasmids (red fluorescence signal) were co-transfected in each experiment to visualize the myoblasts and ensure successful transfection. Yellow fluorescence signals indicate positive co-localization via the formation of the Venus Luciferase.
Figure 4—figure supplement 1
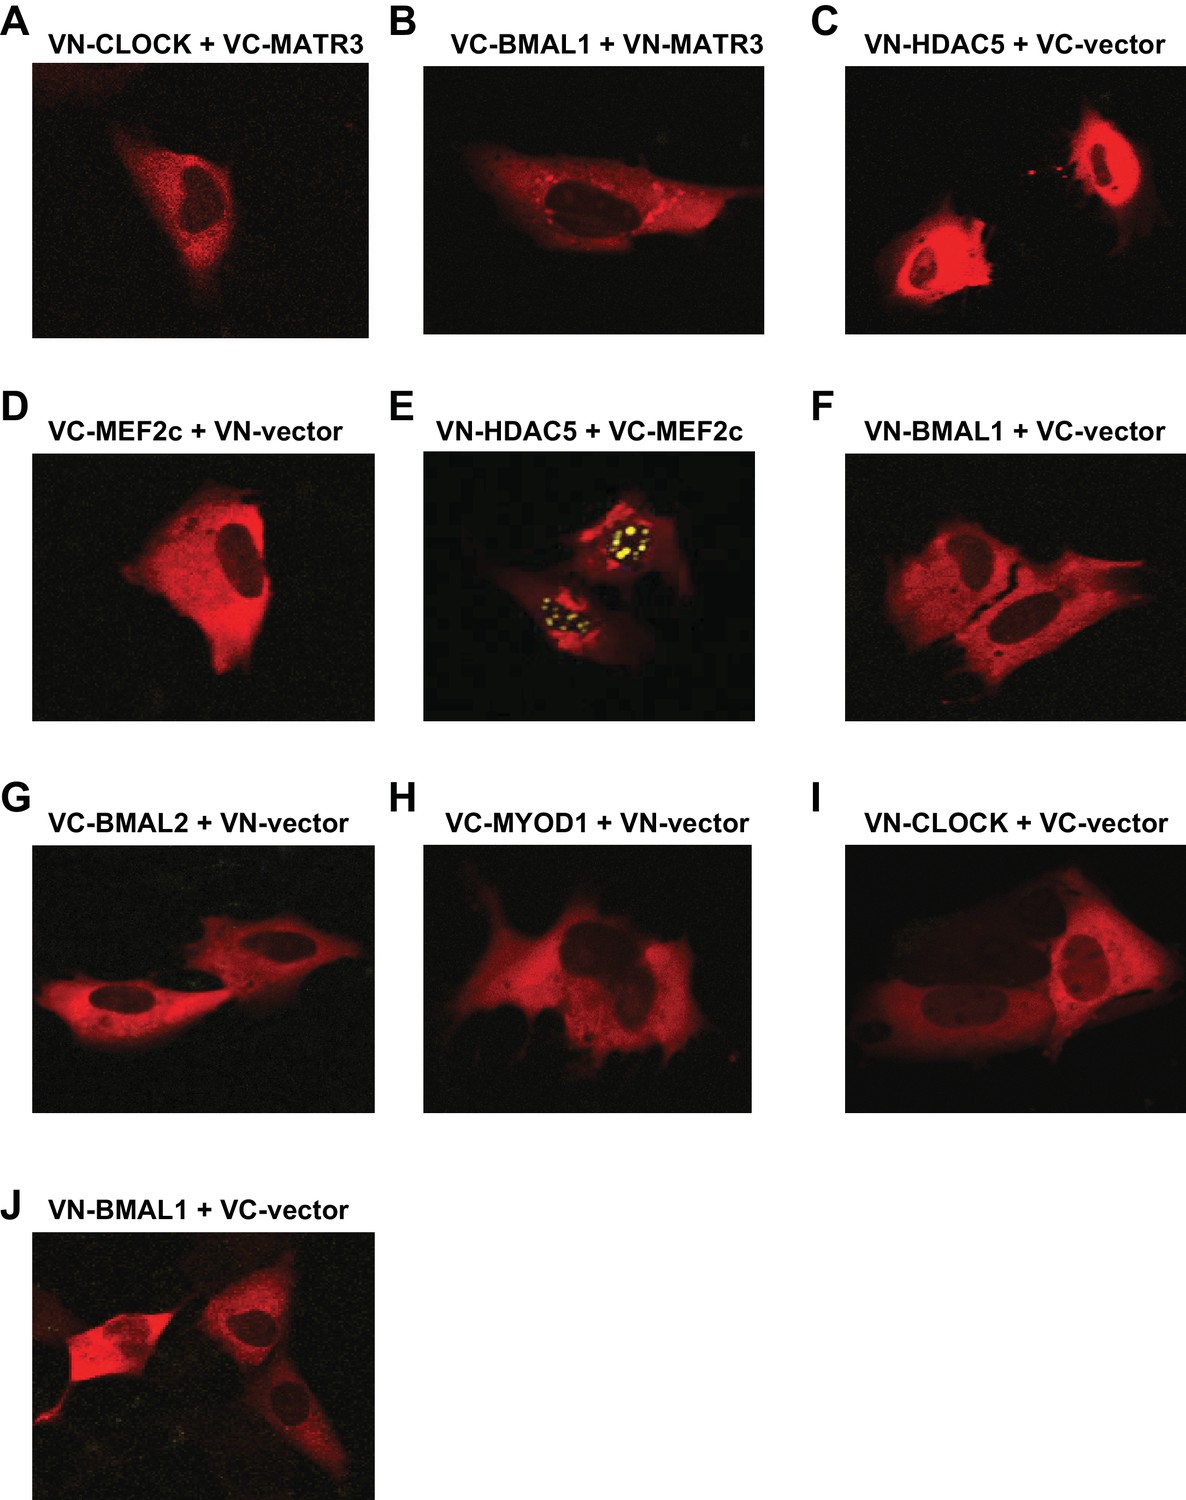
Representative control images for BiFC experiments in C2C12 myotubes.
Interactions were visualized in C2C12 cells by bimolecular fluorescence complementation assay (BiFC). (A) VN-HDAC5 and VC-MATR3; (B) VC-BMAL1 and VN-MATR3; (C) VN-HDAC5 and VC-vector; (D) VC-MEF2C and VN-vector; (E) VN-HDAC5 and VC-MEF2C; (F) VN-BMAL1 and VC-vecctor; (G) VC-BMAL2 and VN-vector; (H) VC-MYOD1 and VN-vector; (I) VN-CLOCK and VC-vector; (J) VN-BMAL1 and VC-vector.
Figure 5 with 1 supplement
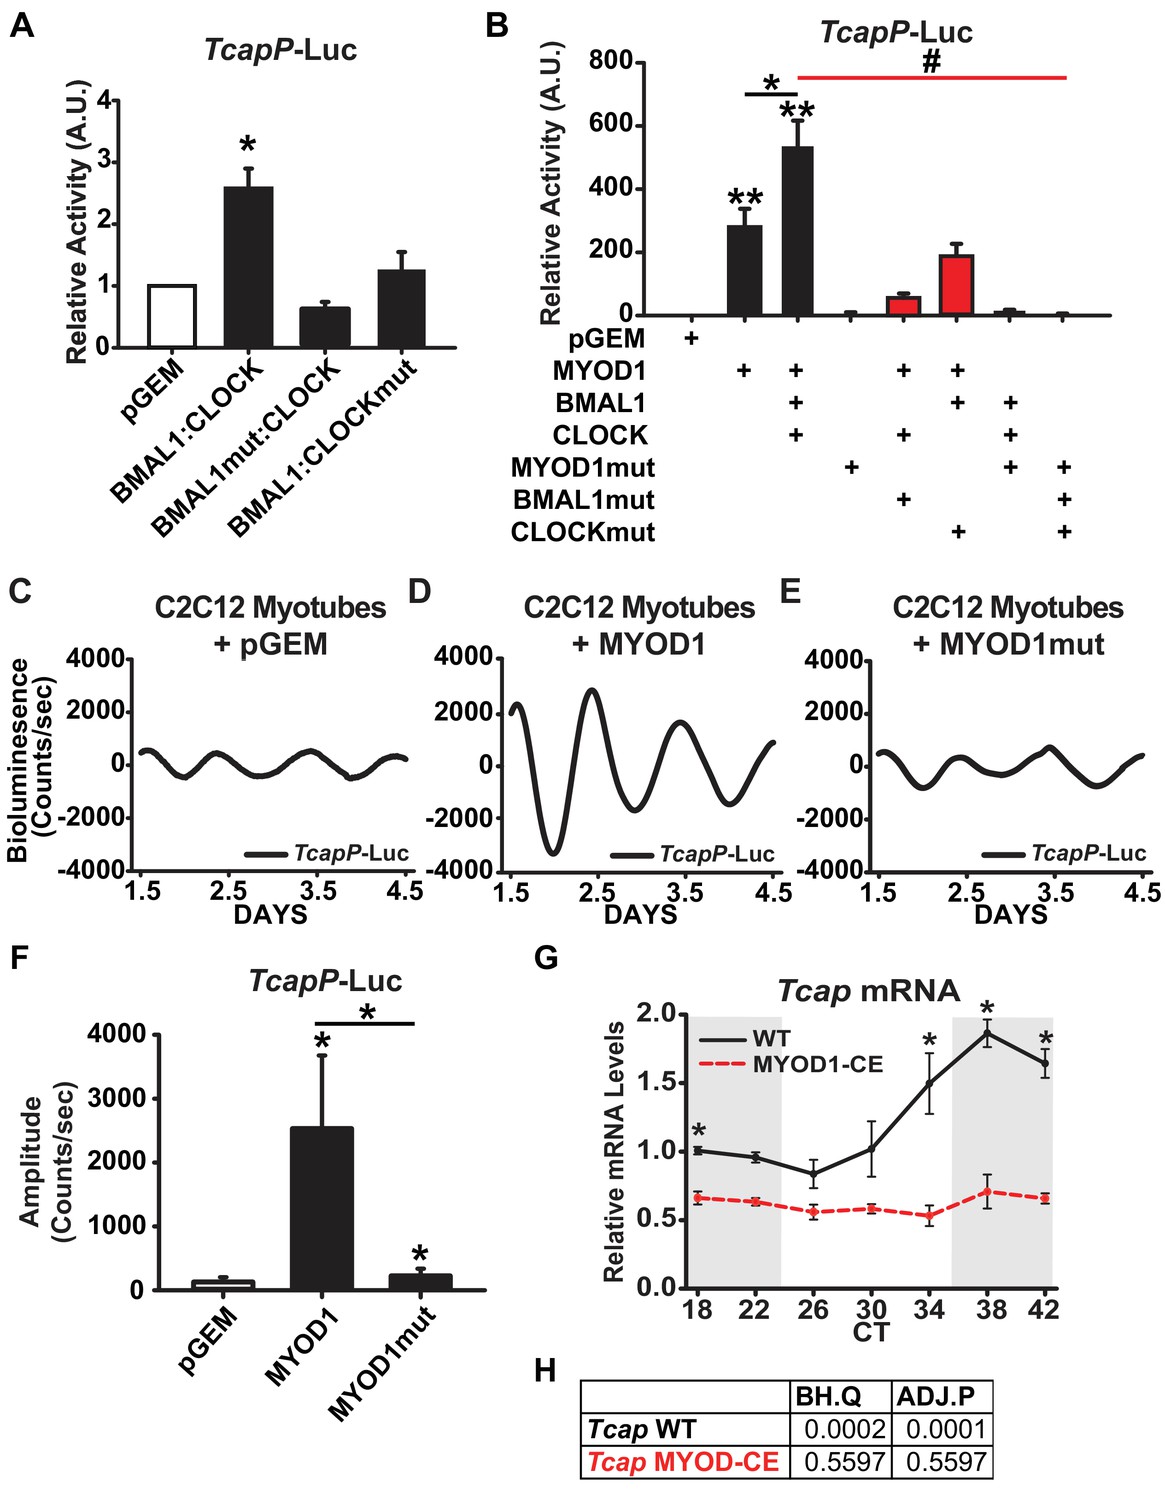
TcapP-Luc is synergistically activated by MYOD1 and BMAL1:CLOCK.
(A) TcapP-Luc Dual-Luciferase activity responses from C2C12 myotubes co-transfected with BMAL1 +CLOCK, BMAL1mut + CLOCK, and BMAL1 +CLOCKmut vectors (n = 4 biological replicates/group). Luciferase activity for each co-transfection is plotted as average fold-change in relation to the pGEM empty vector control ± SEM. Results were analyzed using one-way ANOVA, * indicates p = 0.029. (B) TcapP-Luc Dual-Luciferase activity responses from C2C12 myotubes co-transfected with MYOD1 alone, MYOD1 +BMAL1+CLOCK, or variations of BMAL1mut, CLOCKmut, and MYOD1mut vectors. Luciferase activity for each co-transfection is plotted as average fold-change in relation to the pGEM empty vector control ± SEM (n = 4). Results from MYOD1 and MYOD1 +BMAL1:CLOCK co-transfections were analyzed using one-way ANOVA, ** indicates a p-value less than 0.001 in relation to the pGEM control. Results from the mutant co-transfection experiments (red) were analyzed using one-way ANOVA. # indicates a p-value less than 0.01 relative to the MYOD1 +BMAL1:CLOCK result. (C–E) Representative TcapP-Luc driven bioluminescence recordings in synchronized C2C12 myotubes co-transfected with the pGEM control (C), MYOD1 (D), or MYOD1mut (E) expression vectors. Luminescence recordings are expressed as average counts/sec (base-line subtracted). (F) Average TcapPmut-Luc amplitudes calculated by JTK_CYCLE from 1.5 to 4.5 days post-synchronization. Data are displayed as average amplitude ± SEM (n = 3 biological replicates/group). Results were analyzed with one-way ANOVA, * indicates p-value less than 0.05. (G) Tcap temporal mRNA expression profiles from muscles of MYOD1-CE (dotted red) or C57BL/6J (solid black) mice. Dark shading indicates relative dark/active phase as these mice were reared in DD at the time of collection. At each time-point RT-PCR expression values are displayed as average fold-change relative to the Rpl26 house-keeping gene ± SEM (n = 3). Results were analyzed with one-way ANOVA comparing WT vs. MYOD1-CE at each time-point, * indicates a p-value less than 0.05. (H) JTK_CYCLE statistics for the RT-PCR results corresponding to Tcap’s temporal expression values. ‘BH.Q’ column reports false discover rates and ‘ADJ.P’ reports adjusted p-values.
Figure 5—figure supplement 1
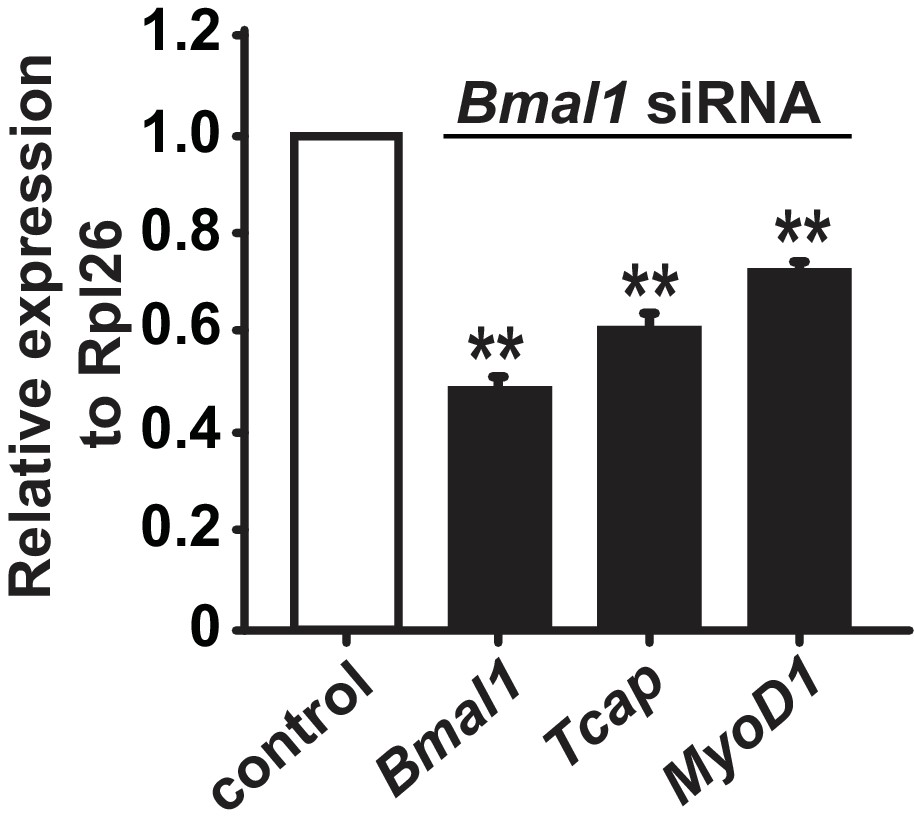
Effect of Bmal1 siRNA mediated knockdown on MyoD1 and Tcap expression.
Relative mRNA expression levels for Bmal1, Tcap, and MYOD1 in C2C12 myotubes transfected with either Bmal1 siRNA (black bars) or a control non-targeting siRNA-A vector (white bar). Results are displayed as average fold-change relative to the control siRNA-A ± SEM (n = 4 biological replicates). Results were analyzed with one-way ANOVA, ** indicates a p-value less than 0.001.
Figure 6
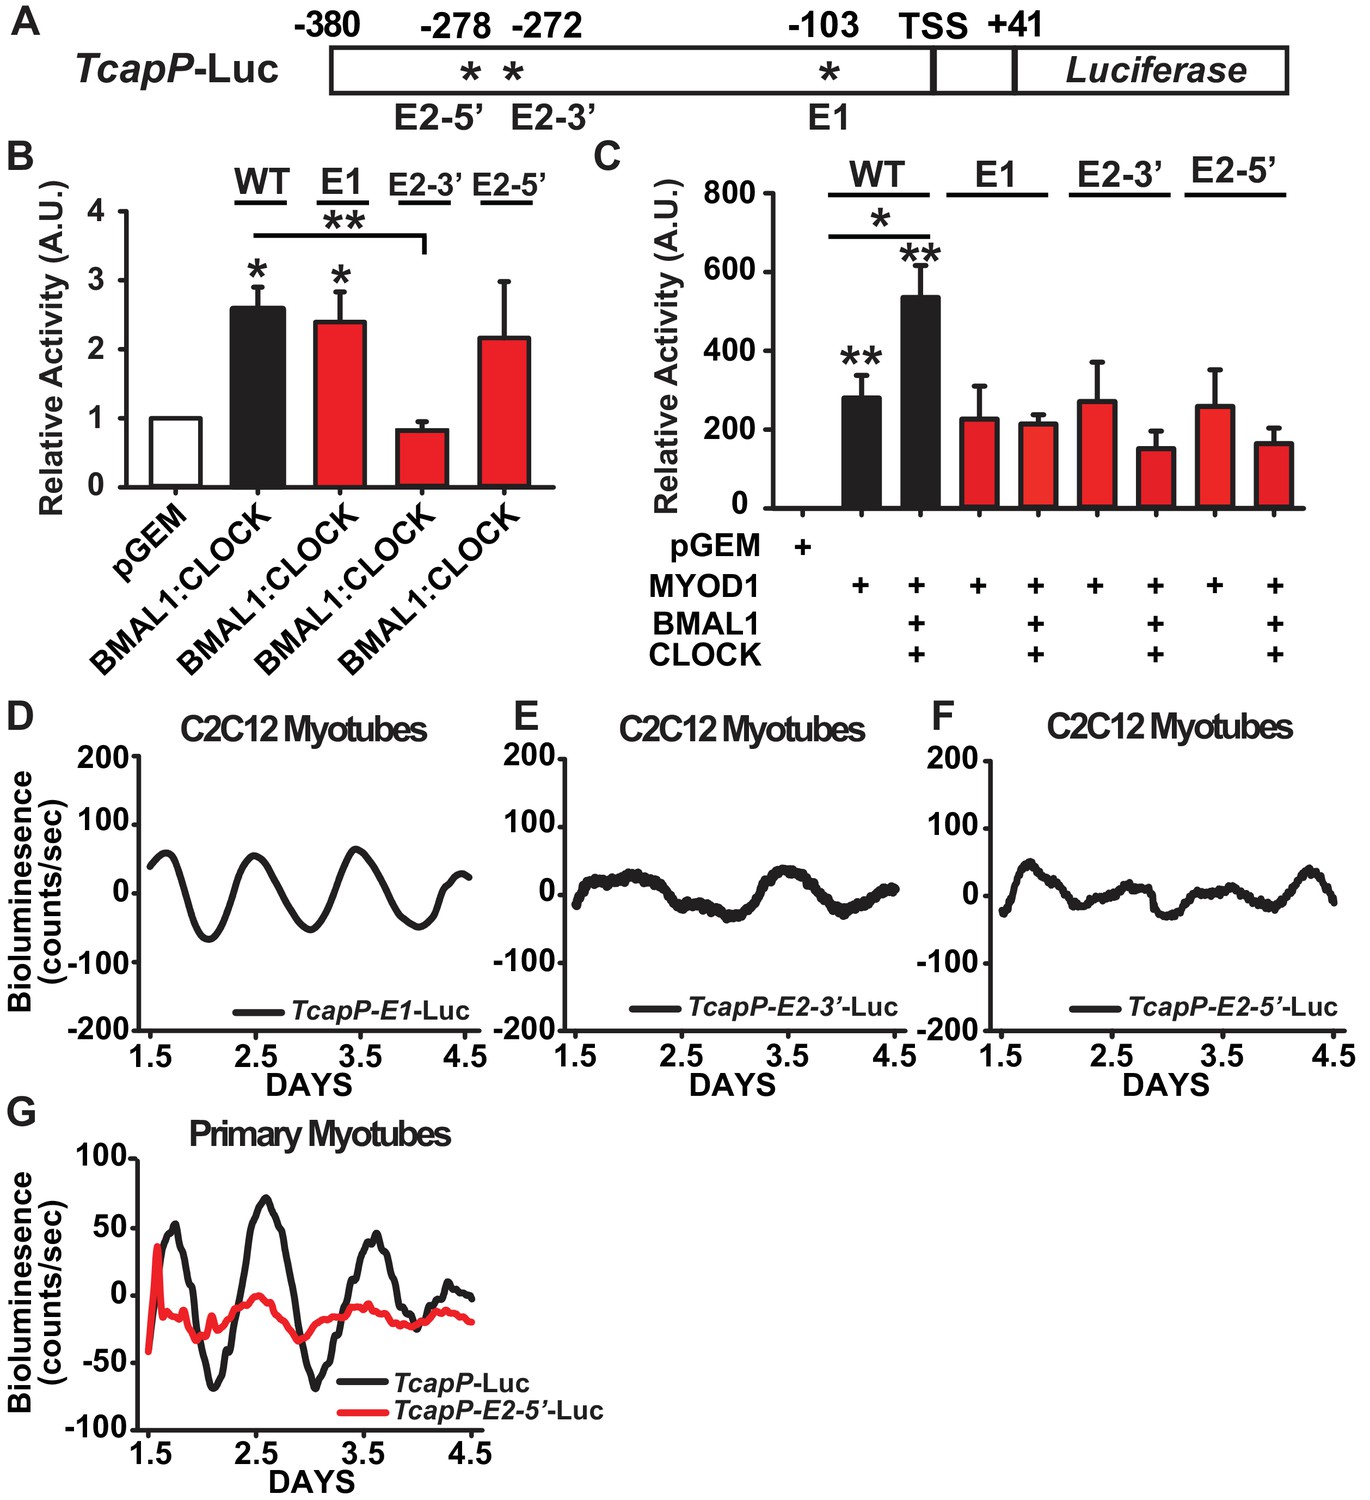
Synergistic activation of the Tcap promoter by MYOD1 +BMAL1:CLOCK requires the tandem E-box element.
(A) Graphical representation of the TcapP-Luc promoter:reporter construct. TSS indicates transcript start site. E1 E-box is located at −103 and E2 tandem E box is located −272 (E2 3’) and −278 (E2 5’) from the TSS. (B) Dual-Luciferase activity responses from the wildtype TcapP-Luc and the Tcap E-box mutants in C2C12 myotubes co-transfected with BMAL1:CLOCK. Luciferase activity for each co-transfection is plotted as average fold-change in relation to the pGEM empty vector control ± SEM (E2-3’ and E2-5’ n = 4, E1 n = 3). Results were analyzed using one-way ANOVA, ** indicates p-value less than 0.01 in relation to the WT TcapP-Luc response, * indicates a p-value less than 0.05 in relation to the pGEM control vector. (C) Dual-Luciferase activity responses from the Tcap E-box mutants with co-transfection of MYOD1 alone or MYOD1 +BMAL1:CLOCK. Luciferase activity for each co-transfection is plotted as average fold-change in relation to the pGEM empty vector control ± SEM (n = 3). Results were analyzed using one-way ANOVA. In comparison to the pGEM control all co-transfections were significantly elevated (p-value < 0.05), ** indicates a p-value of less than 0.01 in relation to the pGEM control, and * indicates a p-value of less than 0.05 comparing TcapP-Luc with over-expression of MYOD1 vs MYOD1+BMAL1:CLOCK. In comparison to the pGEM control all co-transfections were significantly elevated (p-value<0.05). . No statistical differences were observed for each of the Tcap mutant reporters comparing MYOD1 alone to MYOD1 +BMAL1:CLOCK. (D-F) Representative bioluminescence recordings from the TcapP-E1-Luc (D), TcapP-E2-3’-Luc (E), and TcapP-E2-5’mut-Luc (F) in synchronized C2C12 myotubes. (G) Representative TcapP-Luc (black, n = 3 biological replicates) and TcapPmut-E2-5’-Luc (red, n = 3 biological replicates) driven bioluminescence recordings in synchronized skeletal muscle primary myotubes. Luminescence recordings are expressed as average counts/sec (base-line subtracted).
Figure 7
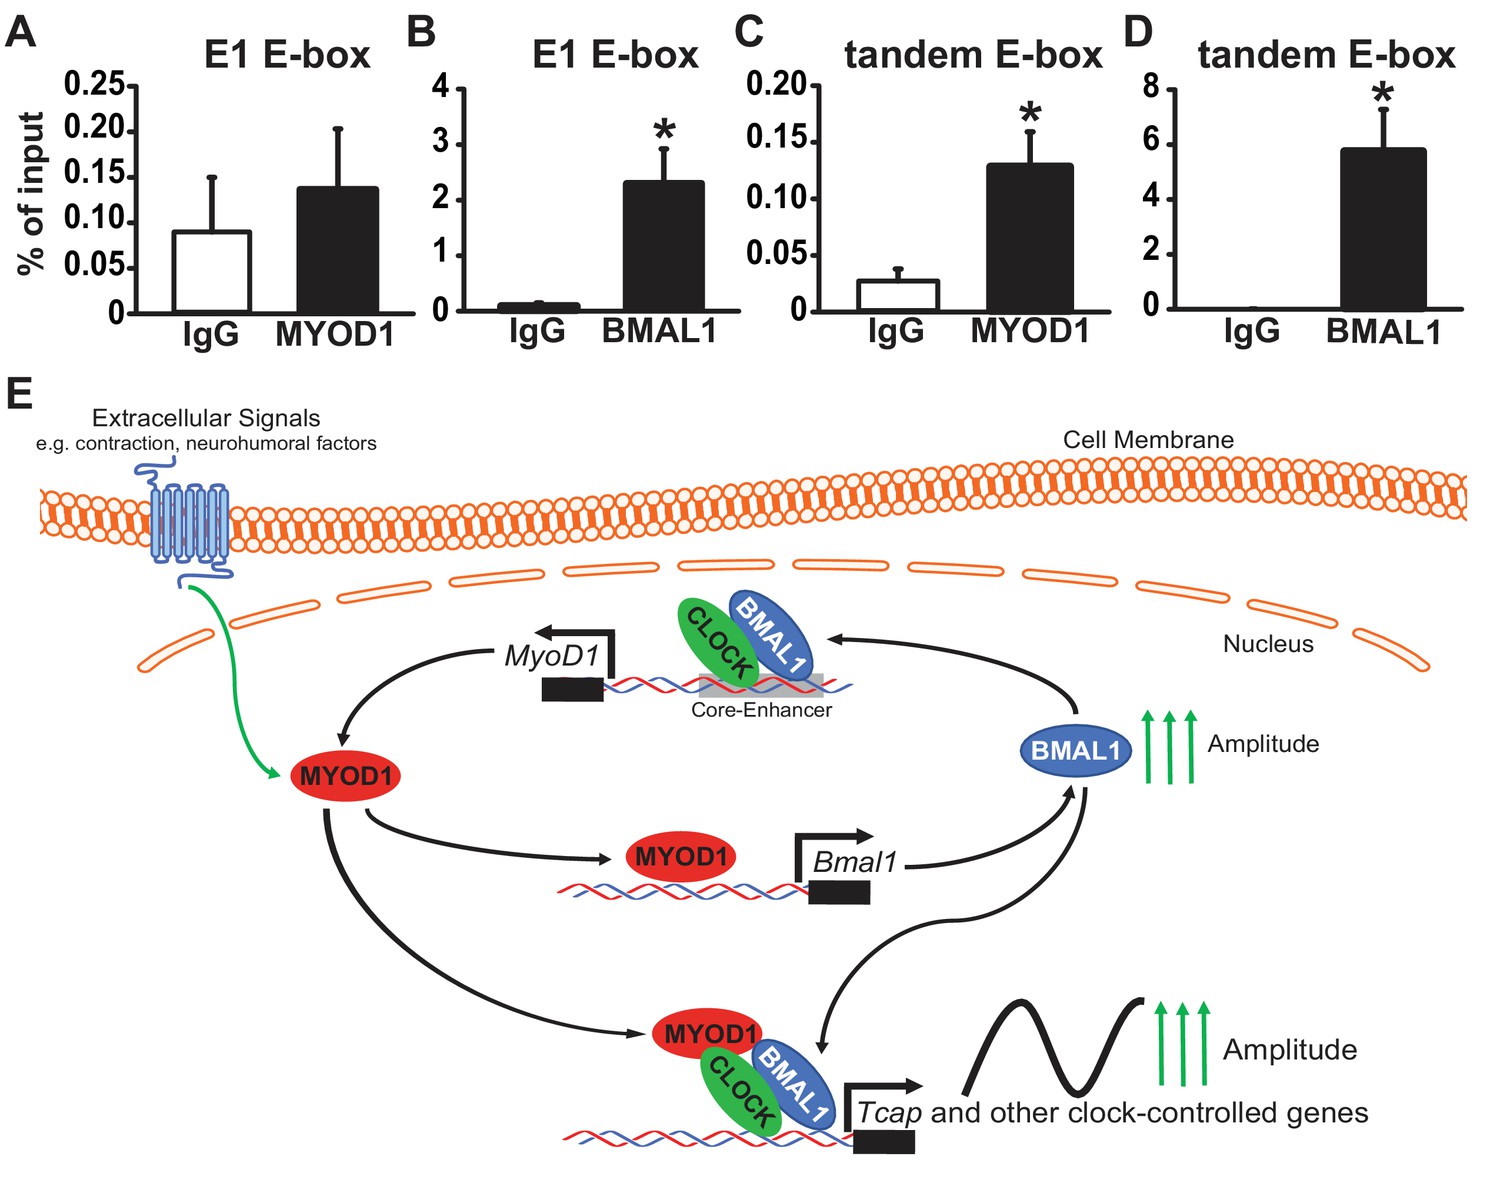
MYOD1 and BMAL1 bind to the Tcap tandem E-box element in adult skeletal muscle.
(A-B) Chromatin Immunoprecipitation-PCR with anti-MYOD1 and -BMAL1 antibody pulldowns (and IgG controls) to detect binding of MYOD1 and BMAL1 within Tcap’s E1 E-box element (A, B) or the tandem E-box (C, D, primers contain 3’ and 5’ Eboxes). Pull-downs were performed with extracts from adult mouse quadricep muscles collected at ZT 2 (2 hours after lights on). Data are displayed as an average % of input ± SEM (n = 3 samples/group). Results were analyzed with a one-way ANOVA and * denotes a p-value ranging from 0.02 to 0.037. (E) Graphical model of depicting the role of MYOD1 in modulating core clock gene expression and working as a co-factor with BMAL1:CLOCK to amplify downstream circadian genes in skeletal muscle. MYOD1 activity is modulated by extracellular signals and it amplifies Bmal1 expression via direct transcriptional activation. BMAL1:CLOCK in turn form a positive feedback loop to regulated the circadian expression of MyoD1 by targeting the core-enhancer element. MYOD1 and BMAL1:CLOCK work in a synergistic fashion to amplify the expression of circadian genes.
Tables
Table 1
MYOD1 binding sites within core clock genes from skeletal muscle ChIP-Seq.
https://doi.org/10.7554/eLife.43017.004| Gene name | Peak score | Distance to TSS | Annotation | BH.Q | Adj.p | Phase | AMP |
|---|---|---|---|---|---|---|---|
| Arntl | 52.5 | −215 | promoter-TSS (NM_007489) | 6.4E-07 | 1.47E-10 | 23 | 0.8400075 |
| Coq10b | 17.5 | −52 | promoter-TSS (NM_001039710) | 1.04E-05 | 9.47E-09 | 9 | 0.5541172 |
| Per3 | 15.3 | 84 | promoter-TSS (NM_001289878) | 1.46E-05 | 1.60E-08 | 10.5 | 0.4985951 |
| Clock | 17.5 | 206 | promoter-TSS (NM_001305222) | 2.96E-05 | 4.38E-08 | 1 | 0.2368383 |
| Tef | 23.3 | 397 | intron (NM_153484, intron 1 of 3) | 0.000268 | 9.96E-07 | 10.5 | 0.1759777 |
| Nr1d2 | 27 | 276 | 5' UTR (NM_011584, exon 1 of 8) | 0.000359 | 1.49E-06 | 9.5 | 0.2442347 |
| Ciart | 19 | −384 | promoter-TSS (NM_001033302) | 0.000626 | 3.24E-06 | 9 | 1.0158296 |
| Hlf | 10.9 | 39 | promoter-TSS (NM_172563) | 0.001343 | 9.73E-06 | 11 | 0.3266197 |
| Cry1 | 16.8 | −40 | promoter-TSS (NM_007771) | 0.026447 | 0.000699 | 19 | 0.0611011 |
Additional files
-
Supplementary file 1
MYOD1 ChIP-Seq genomic binding sites.
- https://doi.org/10.7554/eLife.43017.012
-
Supplementary file 2
MYOD1 ChIP-Seq enriched biological processes.
- https://doi.org/10.7554/eLife.43017.013
-
Supplementary file 3
List of skeletal muscle circadian genes bound by MYOD1.
- https://doi.org/10.7554/eLife.43017.014
-
Supplementary file 4
Expression of 536 circadian MYOD1 target genes in MYOD1-CE muscle tissue.
- https://doi.org/10.7554/eLife.43017.015
-
Supplementary file 5
Bioinformatics approach to identify Tcap as a muscle-specific MYOD1 and BMAL1 target gene (associated gene-lists).
- https://doi.org/10.7554/eLife.43017.016
-
Supplementary file 6
Primer sequences used in RT-PCR of adult skeletal muscle.
- https://doi.org/10.7554/eLife.43017.017
-
Supplementary file 7
Primer sequences used in site-directed mutagenesis.
- https://doi.org/10.7554/eLife.43017.018
-
Supplementary file 8
Primer sequences used in ChIP-PCR.
- https://doi.org/10.7554/eLife.43017.019
-
Supplementary file 9
Primer sequences used in RT-PCR in C2C12 myotubes.
- https://doi.org/10.7554/eLife.43017.020
-
Transparent reporting form
- https://doi.org/10.7554/eLife.43017.021
Download links
A two-part list of links to download the article, or parts of the article, in various formats.
Downloads (link to download the article as PDF)
Open citations (links to open the citations from this article in various online reference manager services)
Cite this article (links to download the citations from this article in formats compatible with various reference manager tools)
MYOD1 functions as a clock amplifier as well as a critical co-factor for downstream circadian gene expression in muscle
eLife 8:e43017.
https://doi.org/10.7554/eLife.43017


