Intrinsically aggregation-prone proteins form amyloid-like aggregates and contribute to tissue aging in Caenorhabditis elegans
- German Center for Neurodegenerative Diseases (DZNE), Germany
- University of Cambridge, United Kingdom
- University of Tübingen, Germany
Figures
Figure 1 with 1 supplement
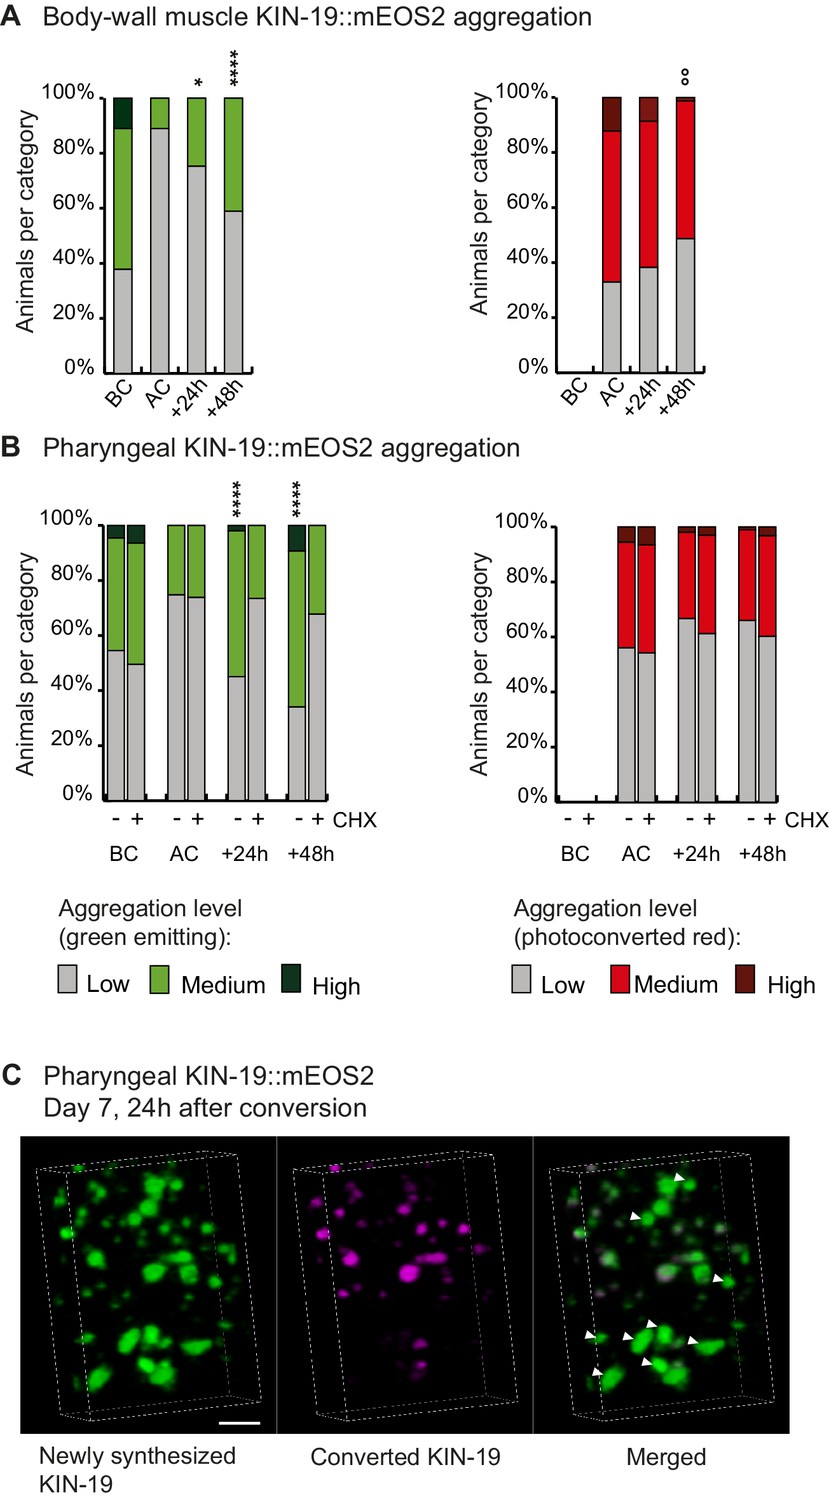
Newly synthesized KIN-19 rapidly transitions into aggregates in aged animals.
(A, B) Following photoconversion at day 5 in the pharynx or in the body-wall muscle, the number of animals with newly synthesized green-emitting non-converted KIN-19::mEOS2 aggregates doubles over 24 hr. Conversely levels of red-emitting converted aggregates slowly declines. Blocking translation with cycloheximide (CHX) prevents new aggregate formation (B). Aggregation is evaluated in Pkin-19::KIN-19::mEOS2 and Pmyo-3::KIN-19::mEOS2 transgenic animals on the basis of the fluorescence intensity in puncta, representing aggregation (see Materials and methods). Quantification was done in the same population of C. elegans before conversion (BC), after conversion (AC), 24 hr after conversion and 48 hr after conversion. Fisher’s exact test comparing low versus medium +high aggregation levels to after conversion: *p<0.05, **p<0.01, ****p<0.0001. Fisher’s exact test comparing low +medium versus high aggregation levels to after conversion: °°p<0.01. See source data including independent biological repeat in Source data 1. (C) 24 hr after photoconversion at day 7, newly synthesized KIN-19::mEOS2 (green emitting) forms new aggregates and associates around older aggregates (red emitting). 3D reconstruction in the pharyngeal anterior bulb region. Arrow heads highlight large new aggregates formed independently of previous aggregates. Scale bar 2 μm.
Figure 1—figure supplement 1
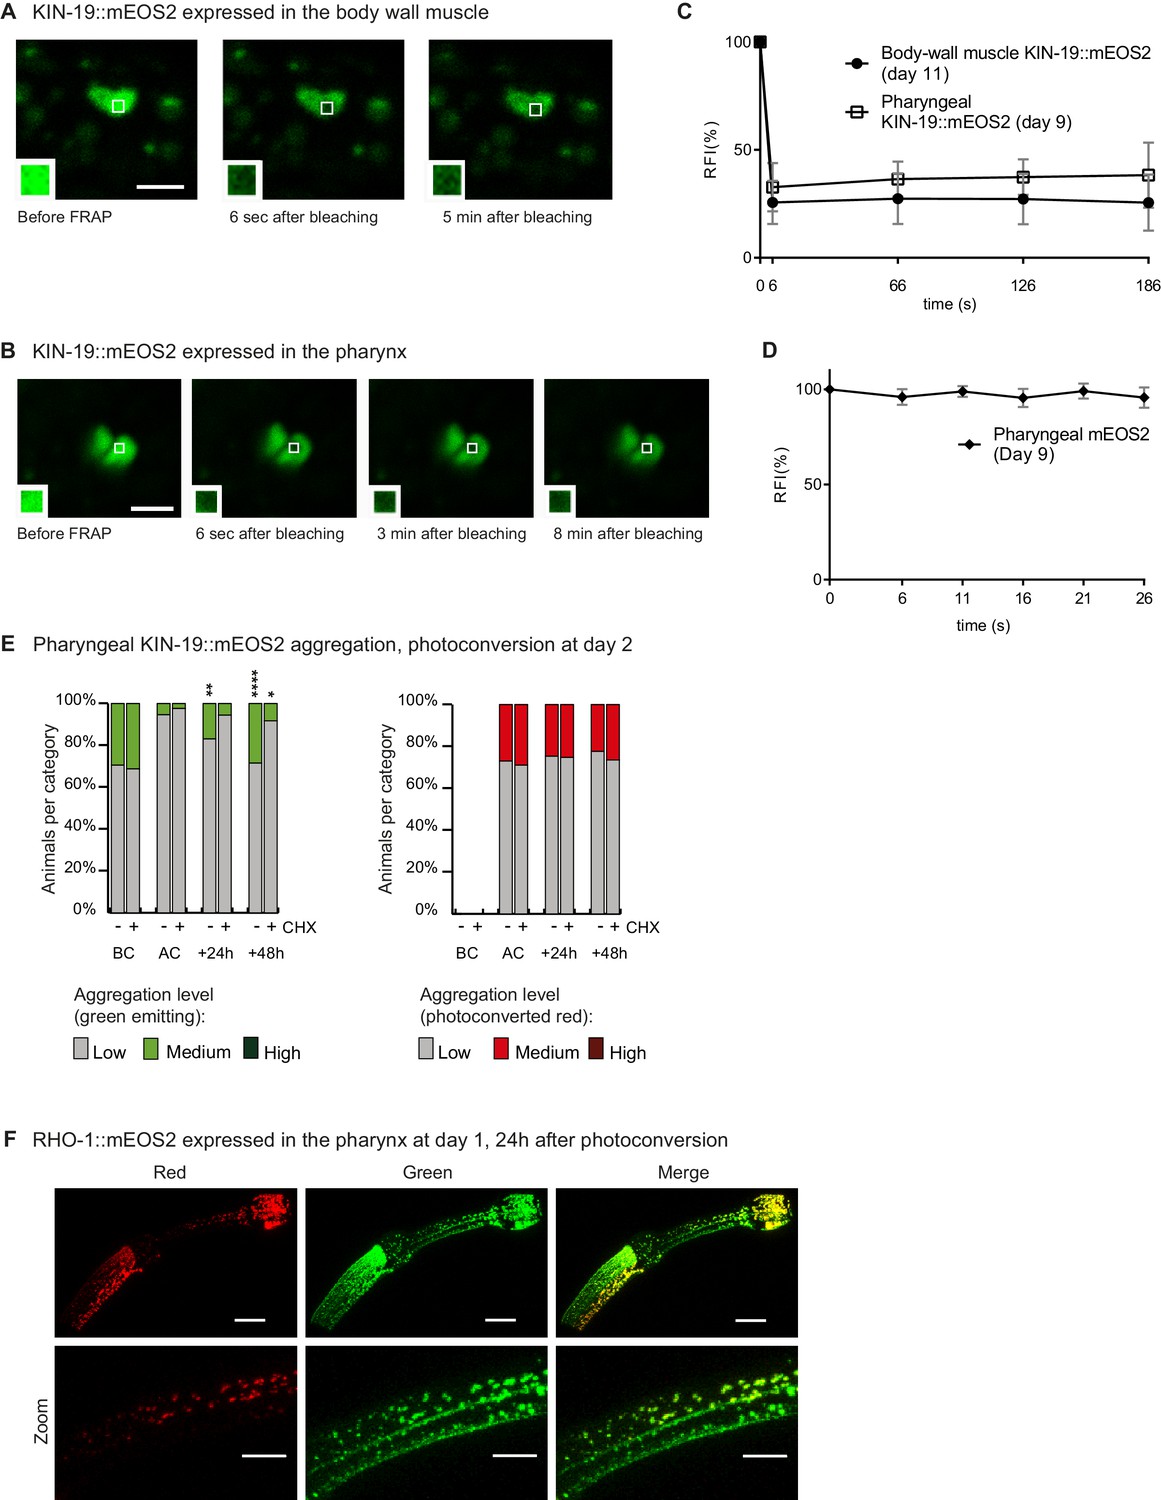
Newly synthesized KIN-19 and RHO-1 rapidly transitions into aggregates in young animals.
(A) KIN-19::mEOS2 puncta visible in the body wall muscle contain immobile protein, demonstrated by lack of fluorescent recovery after photobleaching (FRAP) after 5 min. Area bleached enlarged in caption. Scale bar 2 μm. (B) KIN-19::mEOS2 puncta visible in the pharynx contain immobile protein, demonstrated by FRAP after 8 min. Area bleached enlarged in caption. Scale bar 2 μm. (C) FRAP analysis of KIN-19::mEOS2 puncta present in aged worms. Quantification of relative fluorescence intensity (RFI) over time. Number of animals = 4, puncta evaluated = 6, mean ± SD is represented. See Source data 1. (D) FRAP analysis of mEOS2 puncta/areas of fluorescence present in aged worms. Number of animals = 3, puncta evaluated = 6, mean ± SD is represented. Only a few puncta are present in a population of animals overexpressing Pkin-19::mEOS2 (one in 80 transgenics at day 9 had more than 10 puncta in anterior bulb). (E) In young animals, aggregates are formed by newly synthesized KIN-19 and inhibition of translation (by cycloheximide (CHX)) reduces new aggregate formation. Aggregation is evaluated in Pkin-19::KIN-19::mEOS2 transgenic animals on the basis of the fluorescence intensity in puncta, representing aggregation (see Materials and methods). Quantification was done in the same population of C. elegans before conversion (BC) at day 2, after conversion (AC), 24 hr after conversion and 48 hr after conversion. Fisher’s exact test comparing low versus medium +high aggregation levels to after conversion: *p<0.05, **p<0.01, ****p<0.0001. See Source data 1. (F) RHO-1::mEOS2 aggregates strongly already at day 1 and forms new aggregates (green) 24 hr after photoconversion and associates with older aggregates (red). Scale bar 15 μm, 7 μm in zoom.
Figure 2 with 5 supplements
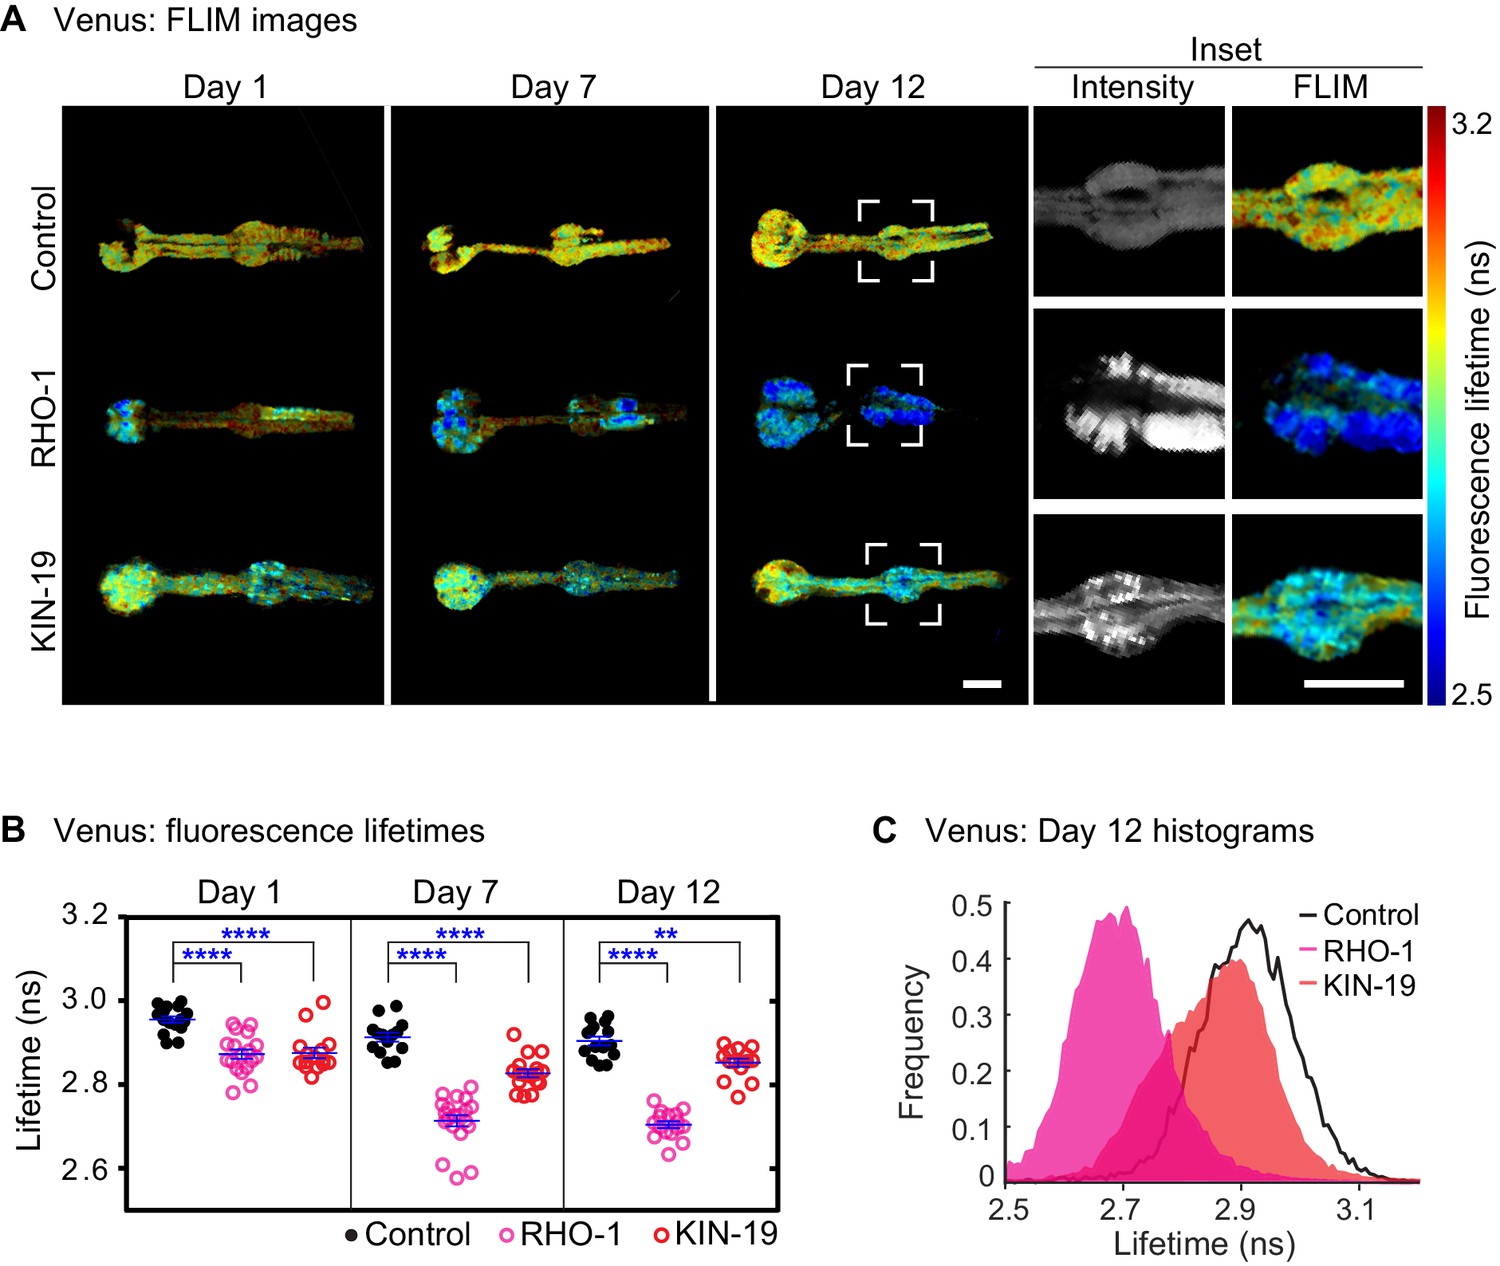
Drop in fluorescence lifetime reveals amyloid-like structure of KIN-19 and RHO-1 aggregates in live C.
elegans. (A) Representative intensity-weighted FLIM images of Venus only (control), RHO-1::Venus and KIN-19::Venus worms. Scale = 25 μm. Inset shows zoomed-in images (intensity and FLIM) of the anterior bulb for Venus only, RHO-1::Venus and KIN-19::Venus worms at day 12. Scale = 25 μm. (B) Scatter plot shows a drop in the intensity-weighted fluorescence lifetime averages in adult worms expressing RHO-1::Venus and KIN-19::Venus compared to worms expressing Venus only (control) in the pharynx. n = 7–10, two independent biological repeats. Data are shown as mean lifetime ± SEM and the statistical analysis was performed using two-way ANOVA with Sidak´s multiple comparisons test: **p<0.01, ****p<0.0001. See Source data 1. (C) Normalized histograms of intensity-weighted fluorescence lifetimes for RHO-1::Venus and KIN-19::Venus show a population shift towards lower lifetimes compared to Venus only (control) worms. The histograms contain information from all pixels of all images acquired for each condition.
Figure 2—figure supplement 1
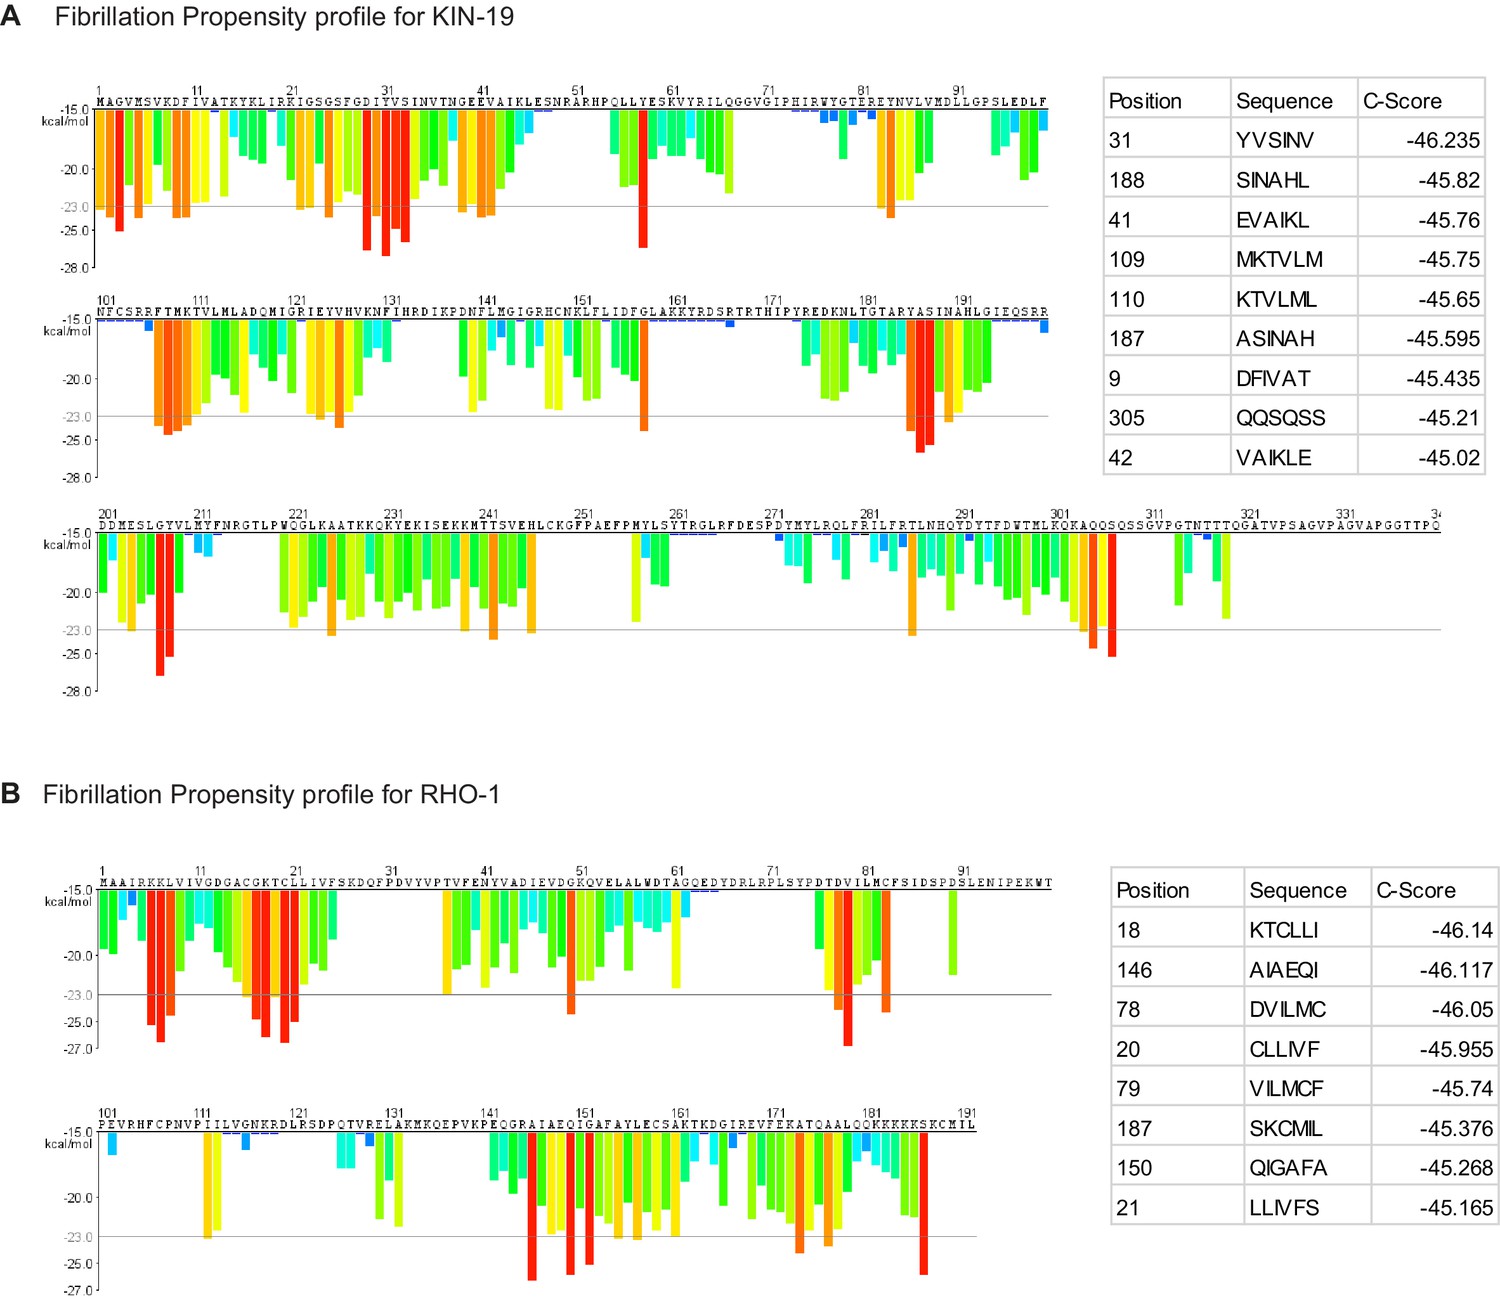
Fibrillation propensity calculate by ZipperDB.
(A) Fibrillation propensity profile for KIN-19. (B) Fibrillation propensity profile for RHO-1. Table inlet shows hexapeptides with Composite scores below −45. ZipperDB: https://services.mbi.ucla.edu/zipperdb/.
Figure 2—figure supplement 2

Aggregation with age of RHO-1::Venus and KIN-19::Venus.
(A) Increased pharyngeal KIN-19 aggregation with age in animals expressing Pkin-19::KIN-19::Venus. Panel reproduced from Lechler et al. (2017). (B) Increased pharyngeal RHO-1 aggregation with age in animals expressing Pmyo-2::RHO-1::Venus. Numbers of worms indicated in the bars. Significance calculated low + medium versus high aggregation levels compared to day 2 of adulthood; Fisher’s exact test: ****p<0.0001. See Source data 1. (C) RHO-1::Venus puncta visible in the pharynx contain immobile protein, demonstrated by absence of fluorescence recovery after 4 min. Scale bar 2 μm. (D) RHO-1::Venus aggregates are highly immobile. Table summarizes FRAP experiments carried out at different ages. (E) FRAP analysis of RHO-1::Venus puncta present in aged worms compared to Venus alone. Quantification of RFI over time. Number of animals = 5, puncta evaluated = 6, mean ± SD is represented. See Source data 1.
© 2017 Lechler et al. All rights reserved. Panel A reproduced from Lechler et al. (2017), published under a Creative Commons Attribution License (CC BY-NC-ND 4.0)
Figure 2—figure supplement 3
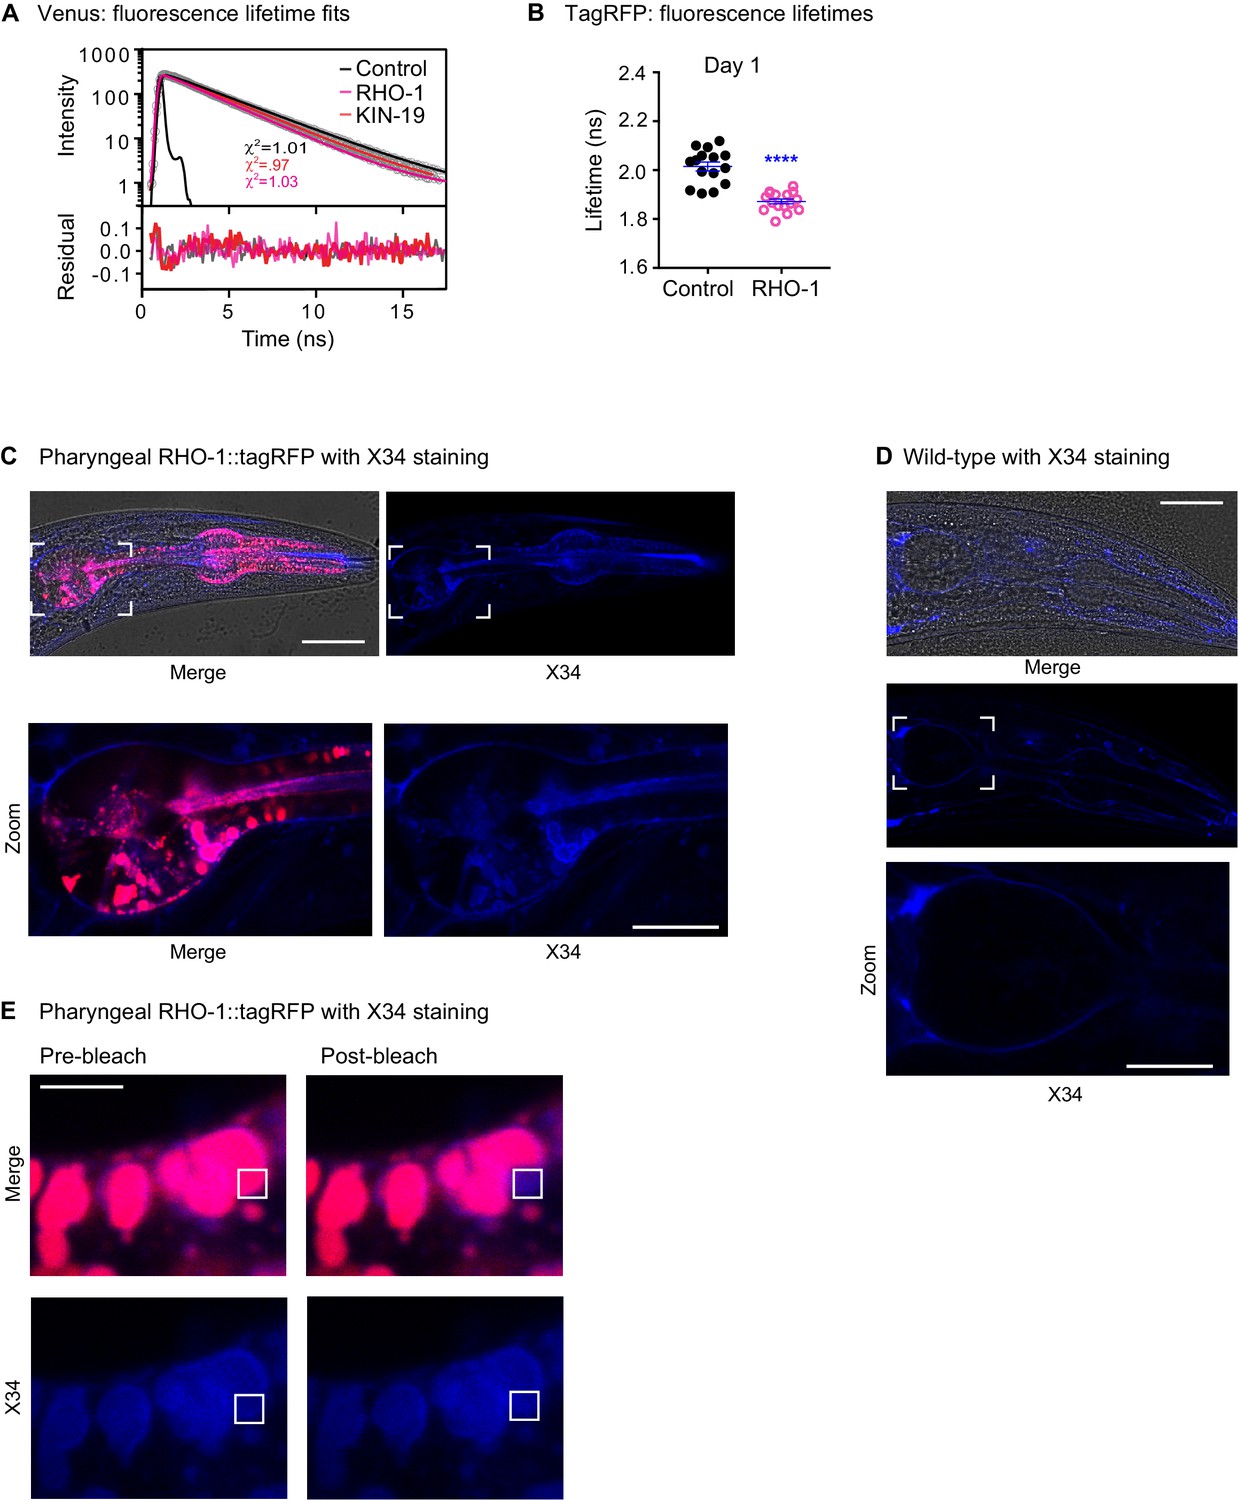
Staining of RHO-1::tagRFP with Congo red derivative X34.
(A) Representative fluorescence decay curves, lifetime fits (with associated chi2 values) and fit residuals for Venus only (control), RHO-1::Venus and KIN-19::Venus adult worms at day 12. The black trace represents the instrument response function (IRF). (B) Drop in fluorescence lifetime upon RHO-1::tagRFP aggregation. Scatter plot showing the intensity-weighted mean fluorescence lifetime values of day 1 old adult worms expressing RHO-1::tagRFP in the pharynx compared to worms expressing tagRFP only. n = 7–8, two independent biological repeats combined. t-test with Welch's correction for unequal standard deviations: ****p<0.0001. See Source data 1. (C) RHO-1 aggregates are stained by Congo red derivative X34. Day 2 old animals expressing Pmyo-2::RHO-1::tagRFP. Scale bar 30 μm. Zoom scale bar 15 μm. (D) Absence of X34 staining in wild-type pharynx. Day 3 old wild-type animals (N2). Scale bar 30 μm. Zoom scale bar 15 μm. (E) RHO-1::tagRFP fluorescence does not interfer with X34 fluorescence as demonstrated by eliminating tagRFP fluorescence by bleaching (in white square). Scale bar 3 μm.
Figure 2—figure supplement 4
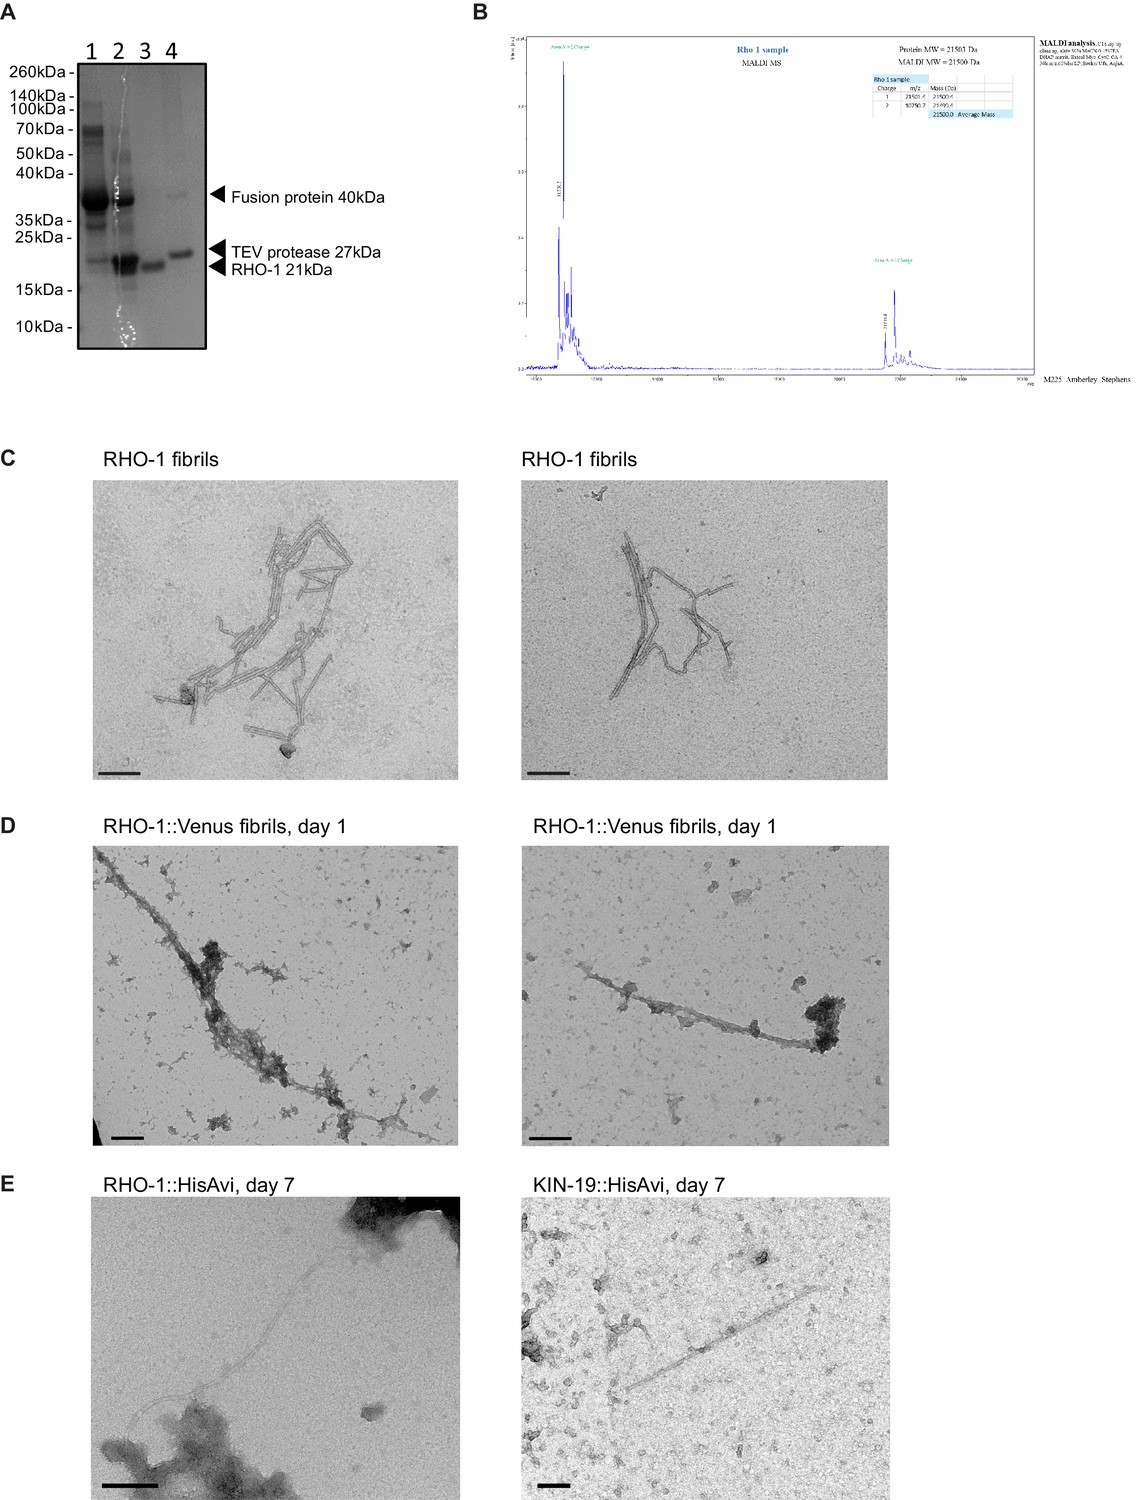
RHO-1 forms amyloid-like fibrils in vitro and in vivo.
(A) Purification steps of recombinant RHO-1 analyzed by SDS-PAGE gel electrophoresis and Coomassie staining. The RHO-1 fusion protein consisting of the thioredoxin protein, His tag and Tobacco etch virus (TEV) cleavage recognition site was purified on a Crude FF column and eluted with imidazole. It ran slightly quicker than the expected 40 kDa predicted size (lane 1). The fusion protein was incubated with recombinant TEV protease overnight in a 1:50 ratio (lane 2). The cleaved RHO-1 protein did not bind to the Crude FF column and eluted in the flow through (lane 3). The TEV protease which has a 6xHis tag and the remaining uncleaved fusion protein were eluted from the column with imidazole (lane 4). (B) Matrix Assisted Laser Desorption/Ionization (MADLI) mass spectrometry of purified RHO-1. Performed by the Proteomics Facility, Biochemistry Department, University of Cambridge. (C) Negative-stain transmission electron micrographs of fibrillised recombinant RHO-1. TEM of RHO-1 negatively stained using 2% uranyl acetate. RHO-1 was incubated for 1 week in a ThT assay to fibrillise. Scale bar = 200 nm. (D) Negative-stain transmission electron micrographs of pmyo-2::RHO-1::Venus worm lysates, day 1. TEM of RHO-1 fibrils negatively stained using 2% uranyl acetate. Scale bar = 200 nm. (E) Negative-stain transmission electron micrographs of RHO-1::HisAvi and KIN-19::HisAvi purified from worms lysates with nickel beads, day 7. Scale bar = 200 nm.
Figure 2—figure supplement 5
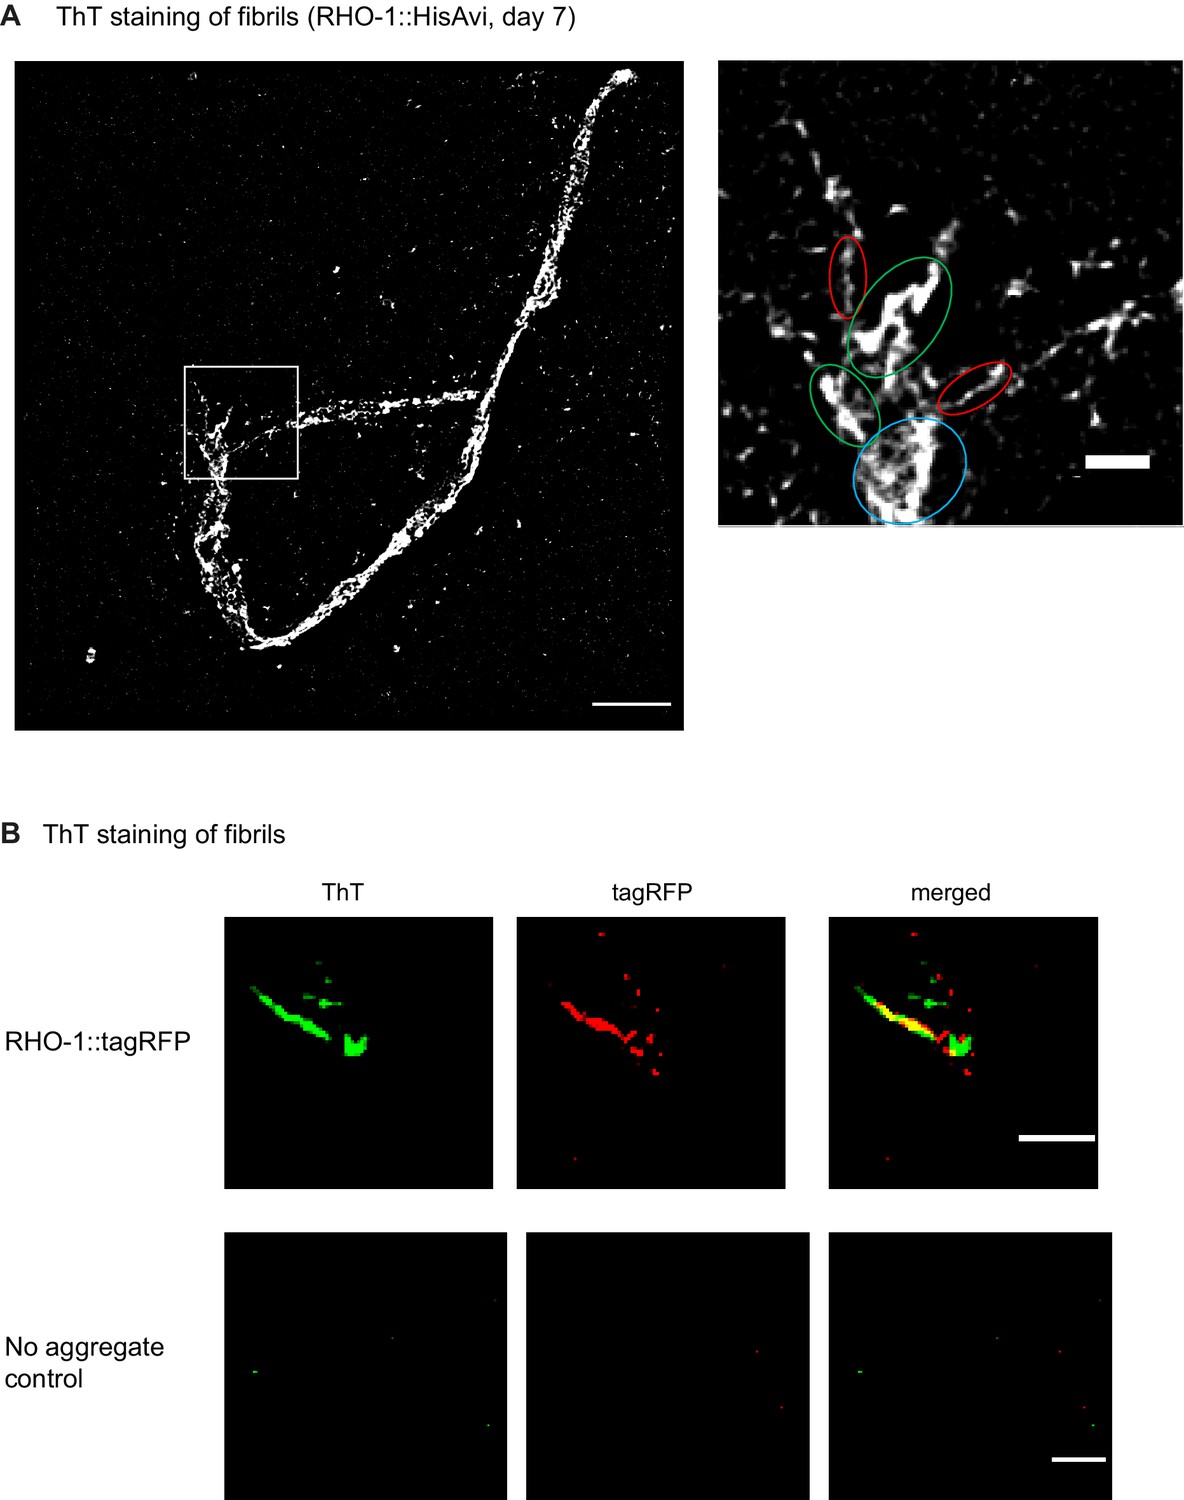
Structured illumination microscopy reveals that RHO-1 forms ThT-positive fibril structures in vivo.
(A) Left image: SIM image of RHO-1 fibrils isolated by affinity purification from transgenics expressing RHO-1::HisAvi at day 7 and labeled using the amyloid dye ThT. Right image: Zoomed in image of left image highlighting the fibril bundles formed by RHO-1 in vivo. Circled in red, single fibrils; in green, fibril bundles and in blue, fibril clusters. Scale bars: 5 and 1 µm, respectively. (B) Two-color SIM images of RHO-1 fibrils extracted from transgenics expressing RHO-1::tagRFP (day 2). Fibrils were stained with ThT prior to imaging. Left image: SIM image of ThT-positive RHO-1::tagRFP fibrils. Central image: SIM image of the same fibril as shown in left but upon tagRFP excitation. Right image: Overlay of ThT and tagRFP channels displays co-localization of ThT and RFP of extracted RHO-1::tagRFP fibrils. Lower panel: imaging of control extracts from young animals (sterile fem-1(-) mutants). Scale bar: 1 µm.
Figure 3 with 3 supplements
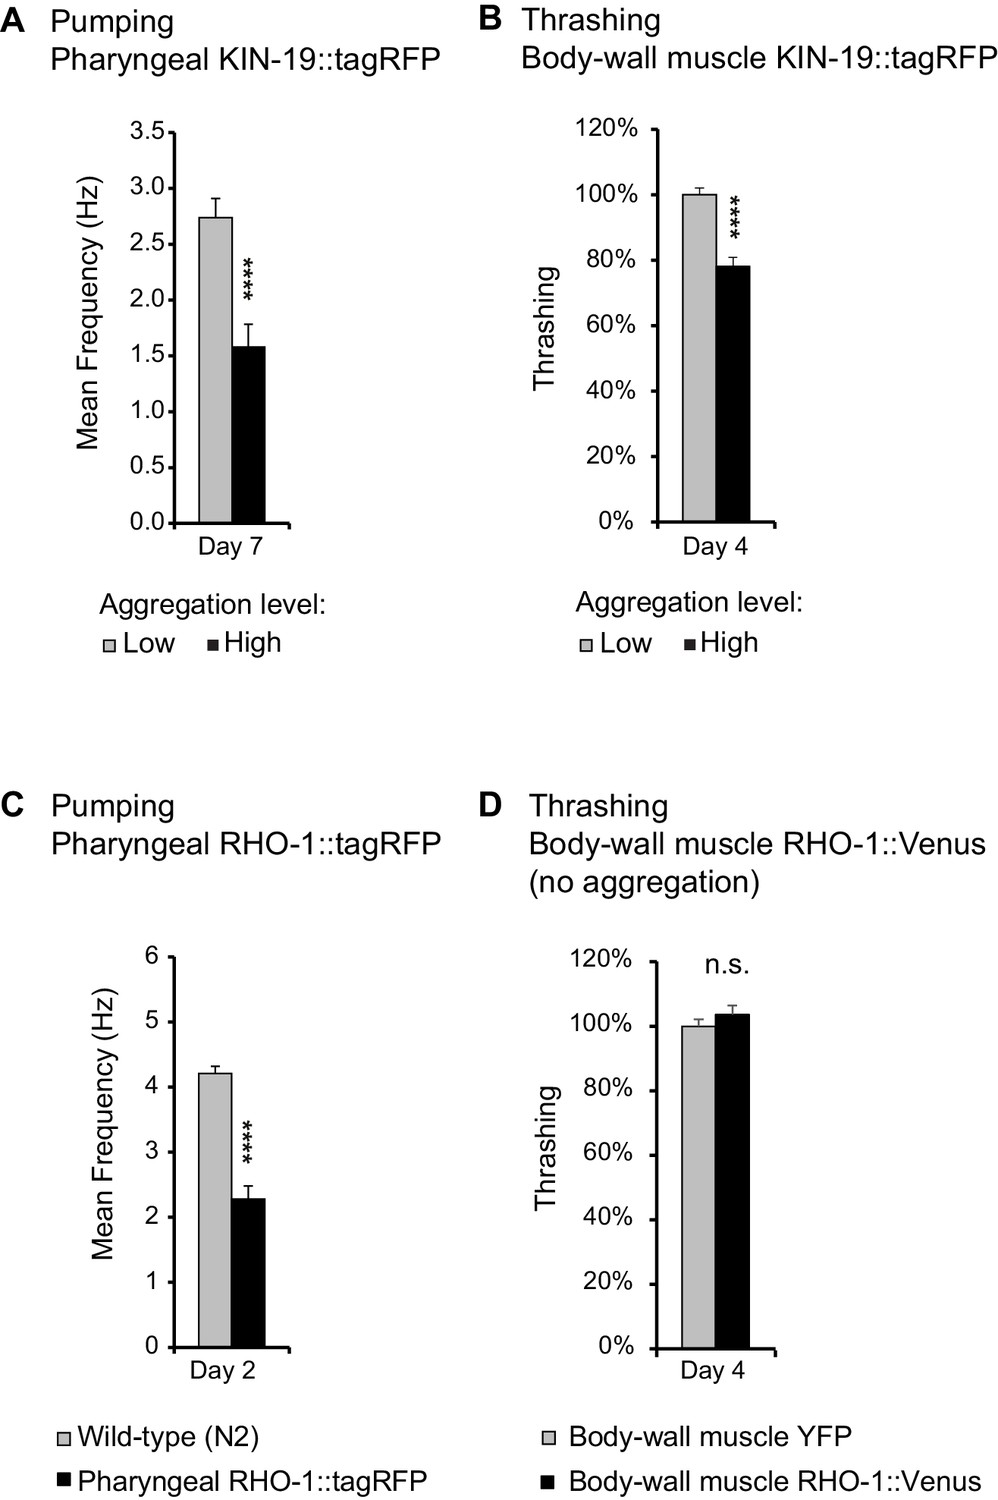
Age-dependent protein aggregation impairs pharyngeal and body-wall muscle function.
(A) Aged animals with high levels of pharyngeal KIN-19 aggregation have reduced pharyngeal pumping. N = 23–28 animals analyzed per group. T-test: p<0.0001. (B) Aged animals with high levels of KIN-19 aggregation in the body-wall muscle display reduced thrashing. Mean body bends per seconds are set to 100% in animals with low aggregation. Mann-Whitney test: p<0.0001. (C) Young animals with RHO-1 aggregation in pharynx have impaired pharyngeal pumping. N = 26–27 animals analyzed per group. T-test: p<0.0001. (D) Overexpression of RHO-1 without aggregation in the body-wall muscles does not influence thrashing. Mean body bends per seconds are set to 100% in Punc-54::yfp transgenic animals. Mann-Whitney test: non-significant. SEM represented, independent biological repeats in Supplementary file 1 and Source data 1.
Figure 3—figure supplement 1
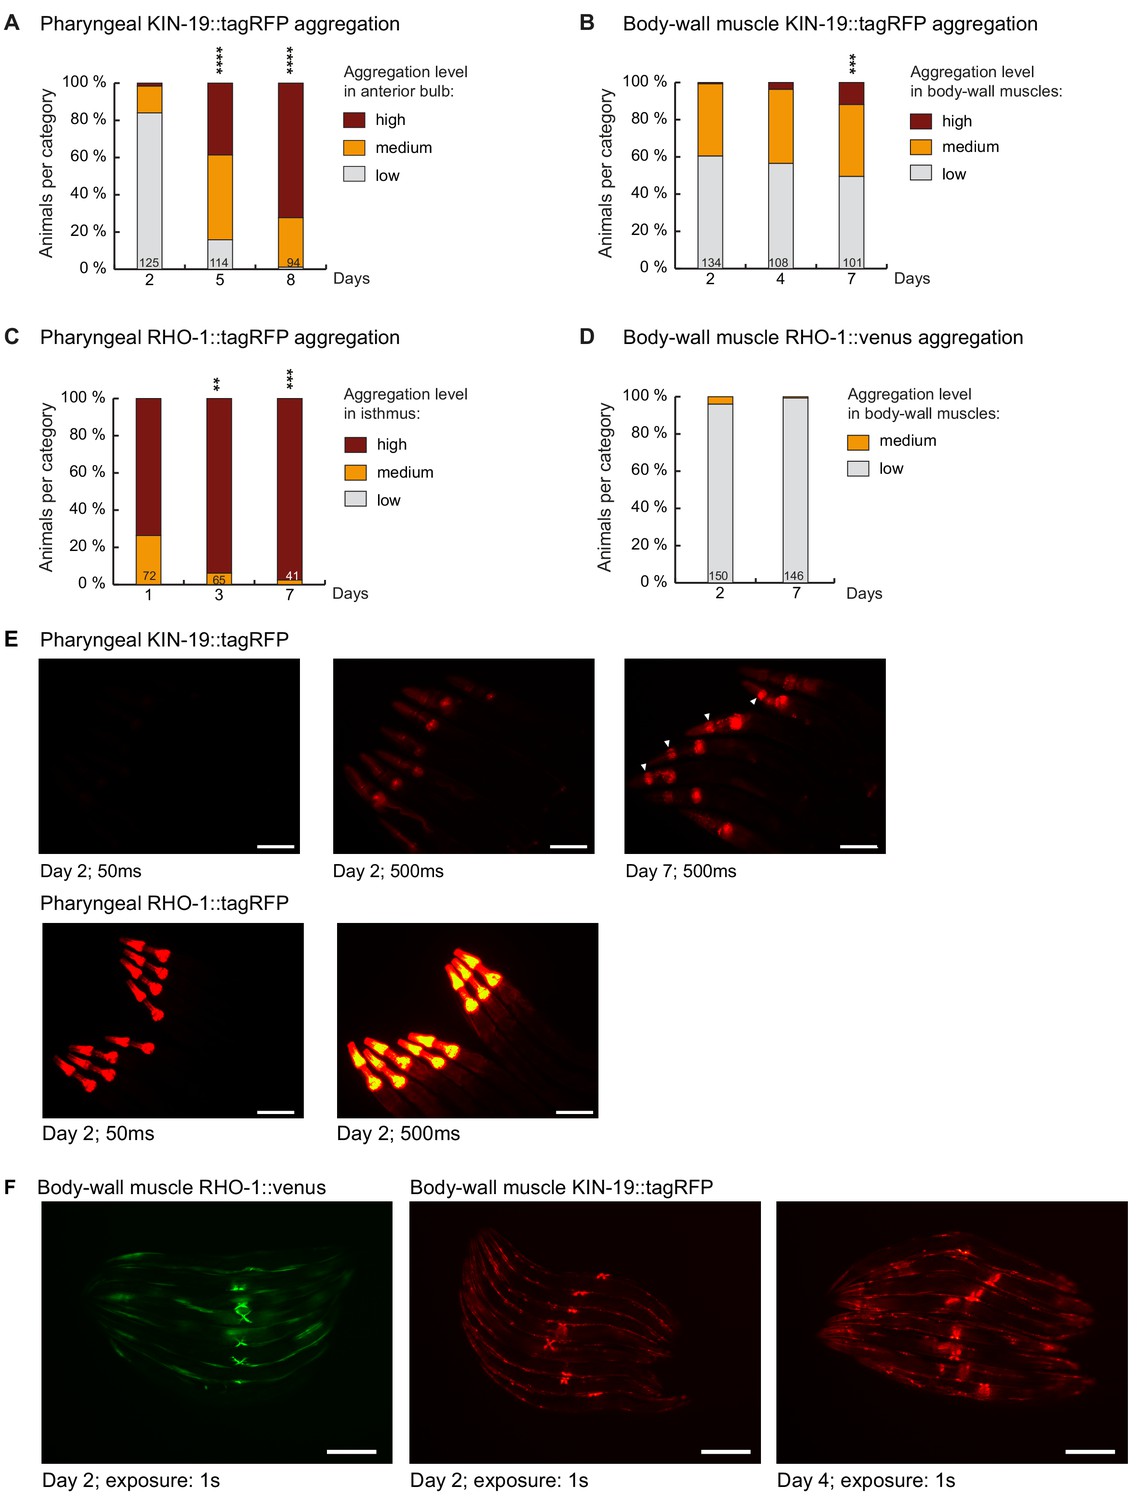
Markers for age-dependent protein aggregation.
(A) Increased pharyngeal KIN-19 aggregation with age in animals expressing Pkin-19::KIN-19::tagRFP. (B) Increased body-wall muscle KIN-19 aggregation with age in animals expressing Pmyo-3::KIN-19::tagRFP. (C) Increased pharyngeal RHO-1 aggregation with age in animals expressing Pmyo-2::RHO-1::tagRFP. Already young adults display abundant RHO-1 aggregation. (D) Absence of RHO-1 aggregation in the majority of animals expressing Punc-54::RHO-1::Venus. Numbers of worms indicated in the bars. Significance calculated low +medium versus high aggregation levels compared to day 2 of adulthood; Fisher’s exact test: **p<0.01, ***p<0.001, ****p<0.0001. See Source data 1. (E) RHO-1::tagRFP aggregates abundantly at day 2 compared to KIN-19::tagRFP. Fluorescent micrograph of the upper body region of animals expressing Pkin-19::KIN-19::tagRFP or Pmyo-2::RHO-1::tagRFP. Days of adulthood and exposure times displayed under images. Arrow heads highlight animals with high levels of KIN-19 aggregation in anterior bulb. Scale bar: 100 μm. (F) KIN-19::tagRFP but not RHO-1::Venus aggregates in body-wall muscle (small puncta). Fluorescent micrograph of whole animals expressing Punc-54::RHO-1::Venus or Pmyo-3::KIN-19::tagRFP. Head region on the left. Days of adulthood and exposure times displayed under images. Scale bar: 200 μm.
Figure 3—figure supplement 2

KIN-19 aggregation in body-wall muscles impairs thrashing.
(A) KIN-19 aggregation in body-wall muscles impairs thrashing. Mean body bends per seconds are set to 100% in Pmyo-3::tagRFP transgenics. Mann-Whitney test: ****p<0.0001. (B) No effect on pumping detected in animals with mixed levels of KIN-19::tagRFP aggregation. N = 29–39 animals analyzed per group. T-test: non-significant. (C) Fluorescent tagRFP does not affect pharyngeal pumping in young animals. N = 26–27 animals analyzed per group. T-test: non-significant. (D) Fluorescent tagRFP does not affect pharyngeal pumping in aged animals. N = 23–26 animals analyzed per group. T-test: non-significant. SEM represented, independent biological repeats in Supplementary file 1 and Source data 1.
Figure 3—figure supplement 3
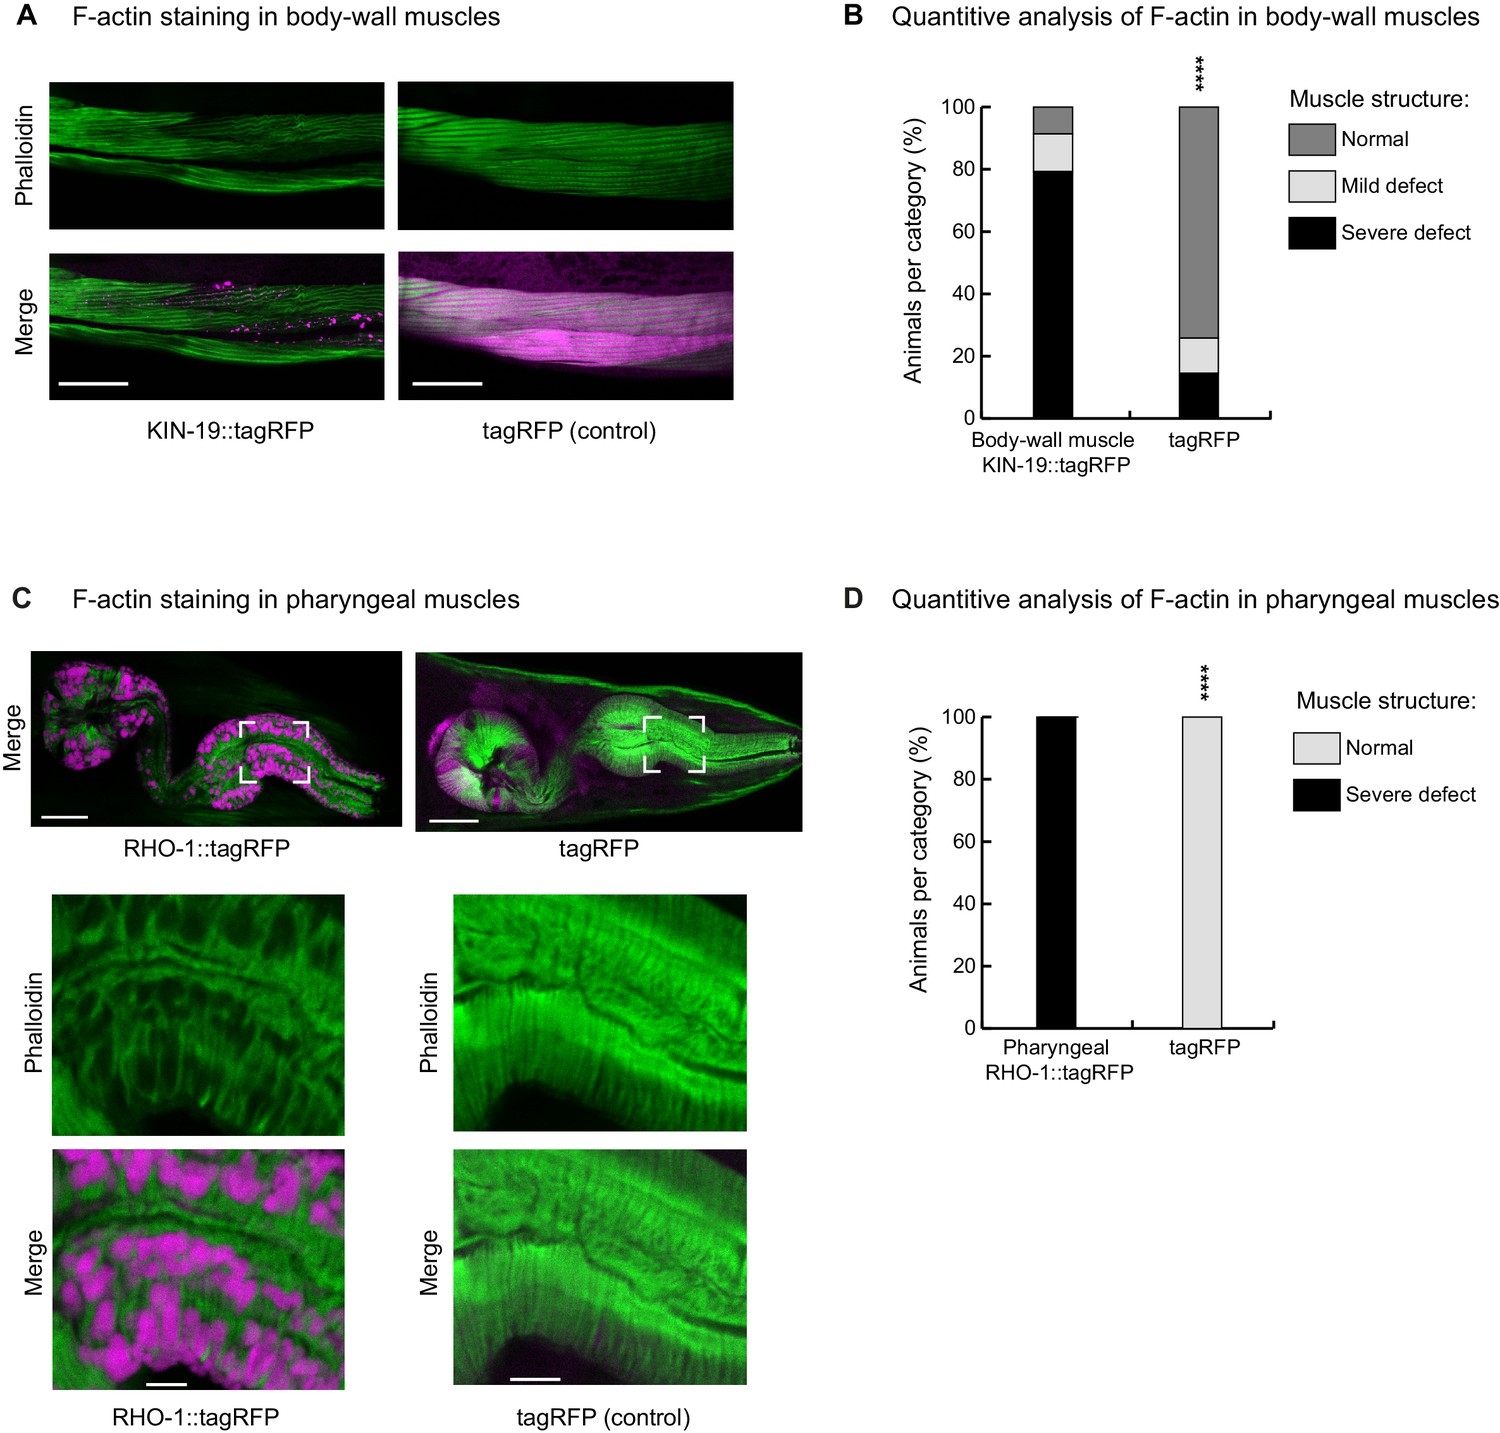
KIN-19 and RHO-1 aggregation impacts muscle structure.
(A, B) Animals with KIN-19 aggregates show defective body-wall muscle structure at day 4. (A) Representative single-plane image showing wrinkled, thinner and faded actin filaments in the presence of KIN-19 aggregates. Top panel: F-actin staining with phalloidin (green). Bottom panel: Merged image with KIN-19 aggregates (magenta). Scale bar 30 µm. (B) Quantification of the decline in body-wall muscle structure with KIN-19 aggregation. Fisher’s exact test: ****p<0.0001. See Source data 1. (C, D) Animals with RHO-1 aggregates show defective pharyngeal muscle structure at day 2. (C) Representative single-plane image showing holes in the actin filaments in the presence of RHO-1 aggregates. Top: merged view of pharynx (RHO-1::tagRFP, tagRFP in magenta and F-actin staining with phalloidin in green); Bottom: zoom into boxed area. Scale bar: 15 µm, zoom: 3 µm. (D) Quantification of defective pharyngeal muscle structure with RHO-1 aggregation. Fisher’s exact test: ****p<0.0001. See Source data 1.
Tables
Key resources table
| Reagent type (species) or resource | Designation | Source or reference | Identifiers | Additional information |
|---|---|---|---|---|
| Gene (C. elegans) | kin-19 | Wormbase | WBGene00002202 | |
| Gene (C. elegans) | rho-1 | Wormbase | WBGene00004357 | |
| Strain (E. coli) | OP50-1 | Caenorhabditis genetic center (CGC) | RRID:WB-STRAIN:OP50-1 | Streptomycin resistant strain of OP50 |
| Genetic reagent (C. elegans) | muEx473[Pkin-19:: kin-19::tagrfp + Ptph-1::gfp] | David et al., 2010 | RRID:WB-STRAIN:CF3166 | N2 background |
| Genetic reagent (C. elegans) | muEx512[Pkin-19:: tagRFP + Ptph-1::GFP] | David et al., 2010 | CF3317 | N2 background |
| Genetic reagent (C. elegans) | muIs209[Pmyo-3::kin-19:: tagrfp + Ptph-1::gfp] | David et al., 2010 | CF3649 | N2 background |
| Genetic reagent (C. elegans) | muIs210[Pmyo-3:: tagrfp + Ptph-1::GFP] | David et al., 2010 | CF3650 | N2 background |
| Genetic reagent (C. elegans) | muEx587[Pkin-19:: kin-19::meos2 + Punc-122::gfp] | This paper | CF3706 | N2 background |
| Genetic reagent (C. elegans) | uqIs9[Pmyo-2::rho-1:: tagrfp + Ptph-1::gfp] | This paper | DCD13 | N2 background |
| Genetic reagent (C. elegans) | uqEx4[Pmyo-3::kin-19::meos2] | This paper | DCD69 | N2 background |
| Genetic reagent (C. elegans) | uqEx[Pmyo-2::rho-1:: meos2 + Punc-122:: gfp + cb-unc-119(+)] | This paper | DCD83 | injected into EG6699 containing ttTi5605II; unc-119(ed3)III |
| Genetic reagent (C. elegans) | uqEx22[Punc-54::rho-1::venus] | This paper | DCD127 | N2 background |
| Genetic reagent (C. elegans) | uqIs12[Pmyo-2::rho-1::venus] | This paper | DCD146 | N2 background |
| Genetic reagent (C. elegans) | uqEx37[Pkin-19:: kin-19::venus + Punc-122::gfp] | Lechler et al., 2017 | DCD179 | N2 background |
| Genetic reagent (C. elegans) | uqIs22 [Pkin19::kin19:: hisavi + Pkin19::birAtagrfp] | This paper | DCD242 | fem-1(hc17ts) IV background |
| Genetic reagent (C. elegans) | uqIs19 [Pmyo2::rho1:: hisavi + Pmyo2::birAtagrfp] | This paper | DCD243 | fem-1(hc17ts) IV background |
| Genetic reagent (C. elegans) | uqEx49[Pkin-19::meos] | This paper | DCD245 | N2 background |
| Genetic reagent (C. elegans) | uqEx51[Pmyo-2::venus] | This paper | DCD248 | N2 background |
| Genetic reagent (C. elegans) | rmIs126[Punc-54::YFP] | https://doi.org/10.1073/pnas.152161099 | RRID:WB-STRAIN:AM134 | N2 background |
| Genetic reagent (C. elegans) | fem-1(hc17ts)IV | CGC | WB Cat# BA17, RRID:WB-STRAIN:BA17 | |
| Recombinant DNA reagent | tagRFP | Evrogen, pTagRFP-N, FP142 | ||
| Recombinant DNA reagent | pKA1062 containing mEOS2 | Other | Kaveh Ashrafi, UCSF, USA | |
| Antibody | Phalloidin-iFluor 488 conjugate | ABD-23115, AAT Bioquest, Biomol, Germany | ‘1:50’ | |
| Chemical compound, drug | X34 | SML1954, Sigma- Aldrich, Germany | 1 mM final | |
| Chemical compound, drug | thioflavin T | #ab120751, abcam, UK | 50 µM | |
| Commercial assay or kit | 5-Hydroxytryptamine creatinine sulfate complex | H7752, Sigma-Aldrich, Germany | 10 µM | |
| Commercial assay or kit | Nickel Sepharose 6 Fast Flow beads from HisTrap FF Crude column | GE Healthcare, Uppsala, Sweden |
Additional files
-
Supplementary file 1
Pharyngeal pumping and thrashing repeats.
- https://doi.org/10.7554/eLife.43059.015
-
Supplementary file 2
Parameters for thrashing analysis.
- https://doi.org/10.7554/eLife.43059.016
-
Source data 1
Analysis of protein aggregation and measures of muscle function in C. elegans.
- https://doi.org/10.7554/eLife.43059.014
-
Transparent reporting form
- https://doi.org/10.7554/eLife.43059.017
Download links
A two-part list of links to download the article, or parts of the article, in various formats.
Downloads (link to download the article as PDF)
Open citations (links to open the citations from this article in various online reference manager services)
Cite this article (links to download the citations from this article in formats compatible with various reference manager tools)
Intrinsically aggregation-prone proteins form amyloid-like aggregates and contribute to tissue aging in Caenorhabditis elegans
eLife 8:e43059.
https://doi.org/10.7554/eLife.43059


