Structure of a bacterial ATP synthase
- The Hospital for Sick Children Research Institute, Canada
- The University of Toronto, Canada
- Tokyo Institute of Technology, Japan
- Kyoto-Sangyo University, Japan
Figures
Figure 1 with 5 supplements
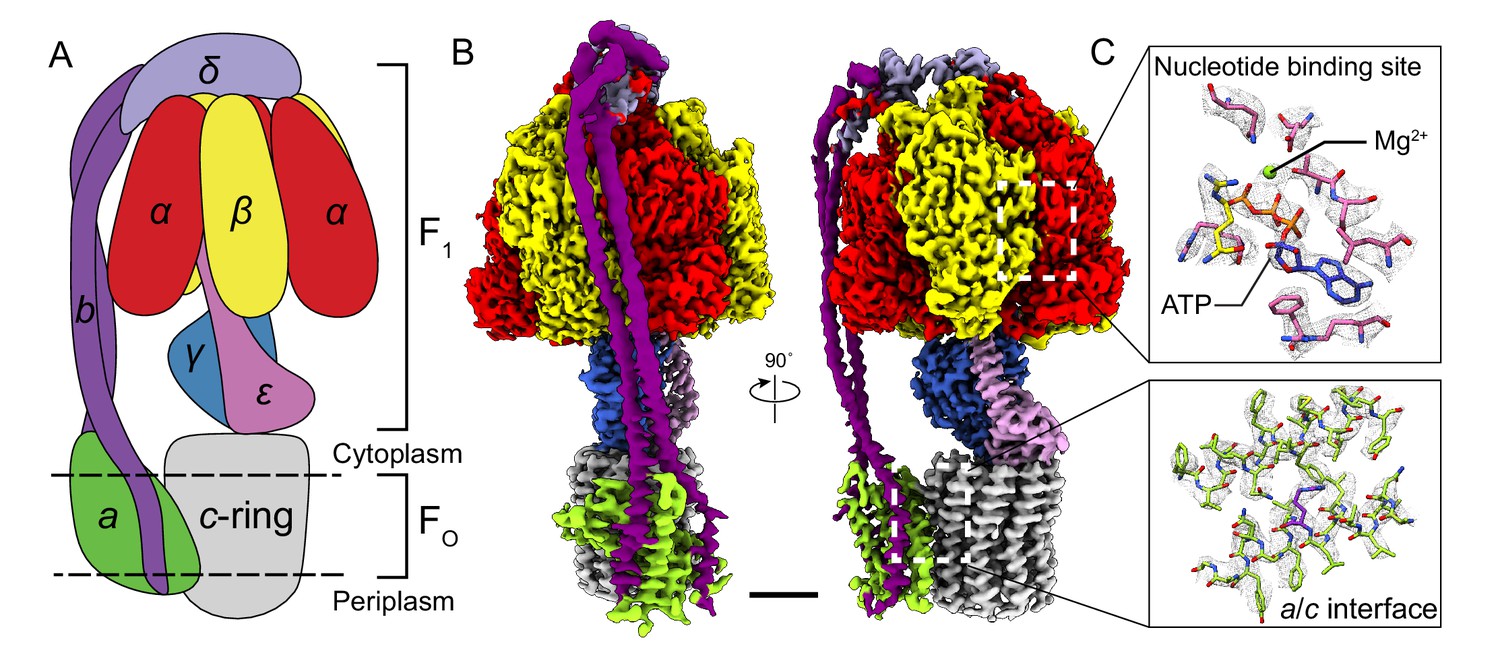
Overall structure of Bacillus PS3 ATP synthase.
(A) Cartoon of ATP synthase. (B) Cryo-EM map of ATP synthase with subunits coloured the same as the cartoon. (C) Example map density that allowed construction of an atomic model. Scale bar, 30 Å.
Figure 1—figure supplement 1
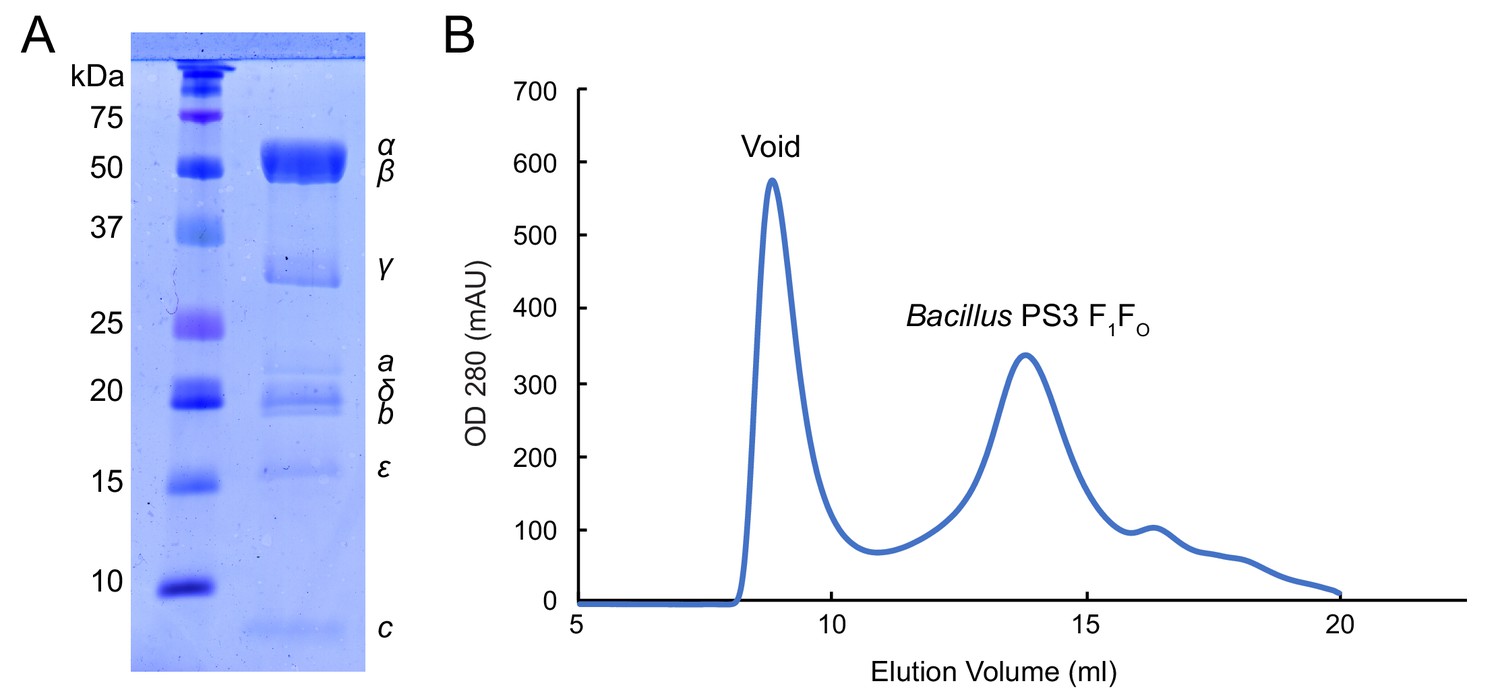
Bacillus PS3 ATP synthase purification.
(A) SDS-PAGE of GDN solubilized Bacillus PS3 ATP synthase. (B) Size-exclusion chromatography of Bacillus PS3 ATP synthase.
Figure 1—figure supplement 2

Cryo-EM image processing.
(A) Example micrograph of Bacillus PS3 ATP synthase. (B) Representative 2D class averages of Bacillus PS3 ATP synthase. (C) Image processing workflow.
Figure 1—figure supplement 3
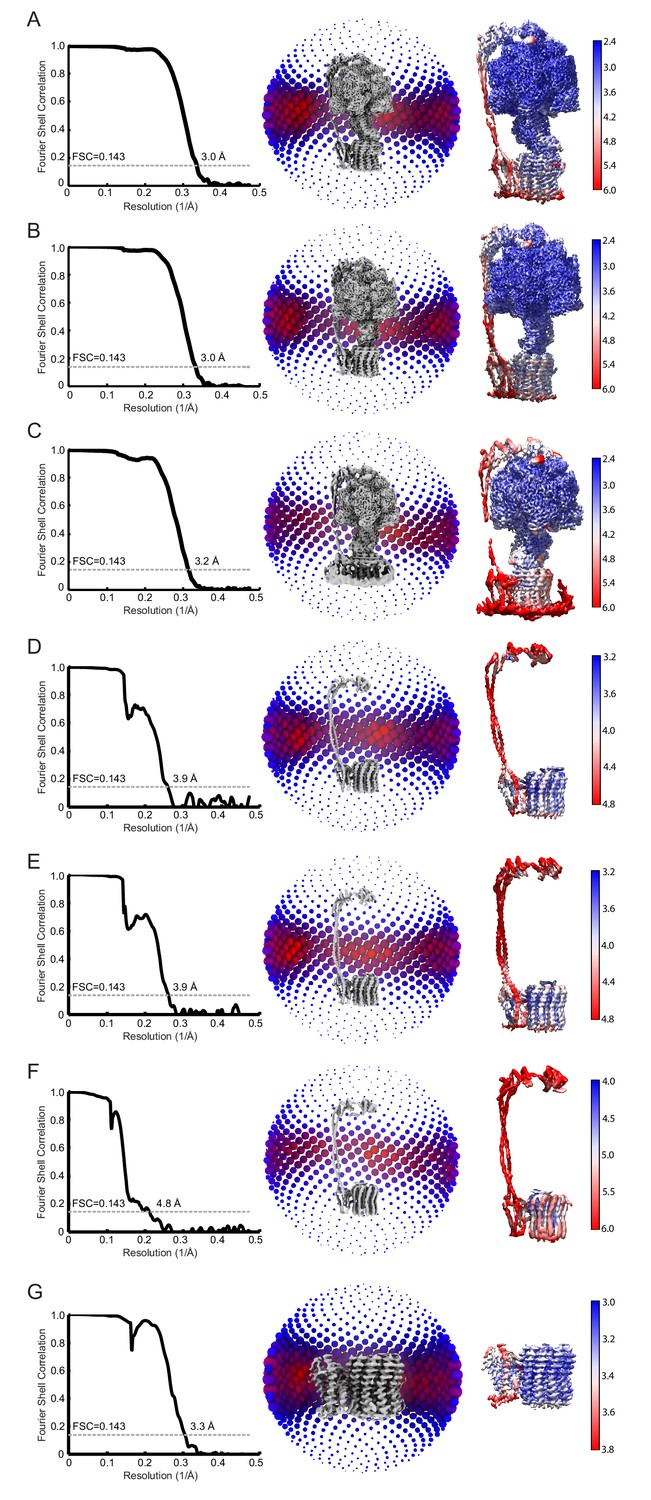
FSC, orientation distribution, and local resolution of the cryo-EM maps used to build atomic models.
(A to C) Full maps of Bacillus PS3 ATP synthase class 1, 2, and 3. (D to F) Focused refinement maps of class 1, 2 and 3 including subunit δ and the FO subunits. (G) Focused refinement map of the membrane-bound region only.
Figure 1—figure supplement 4
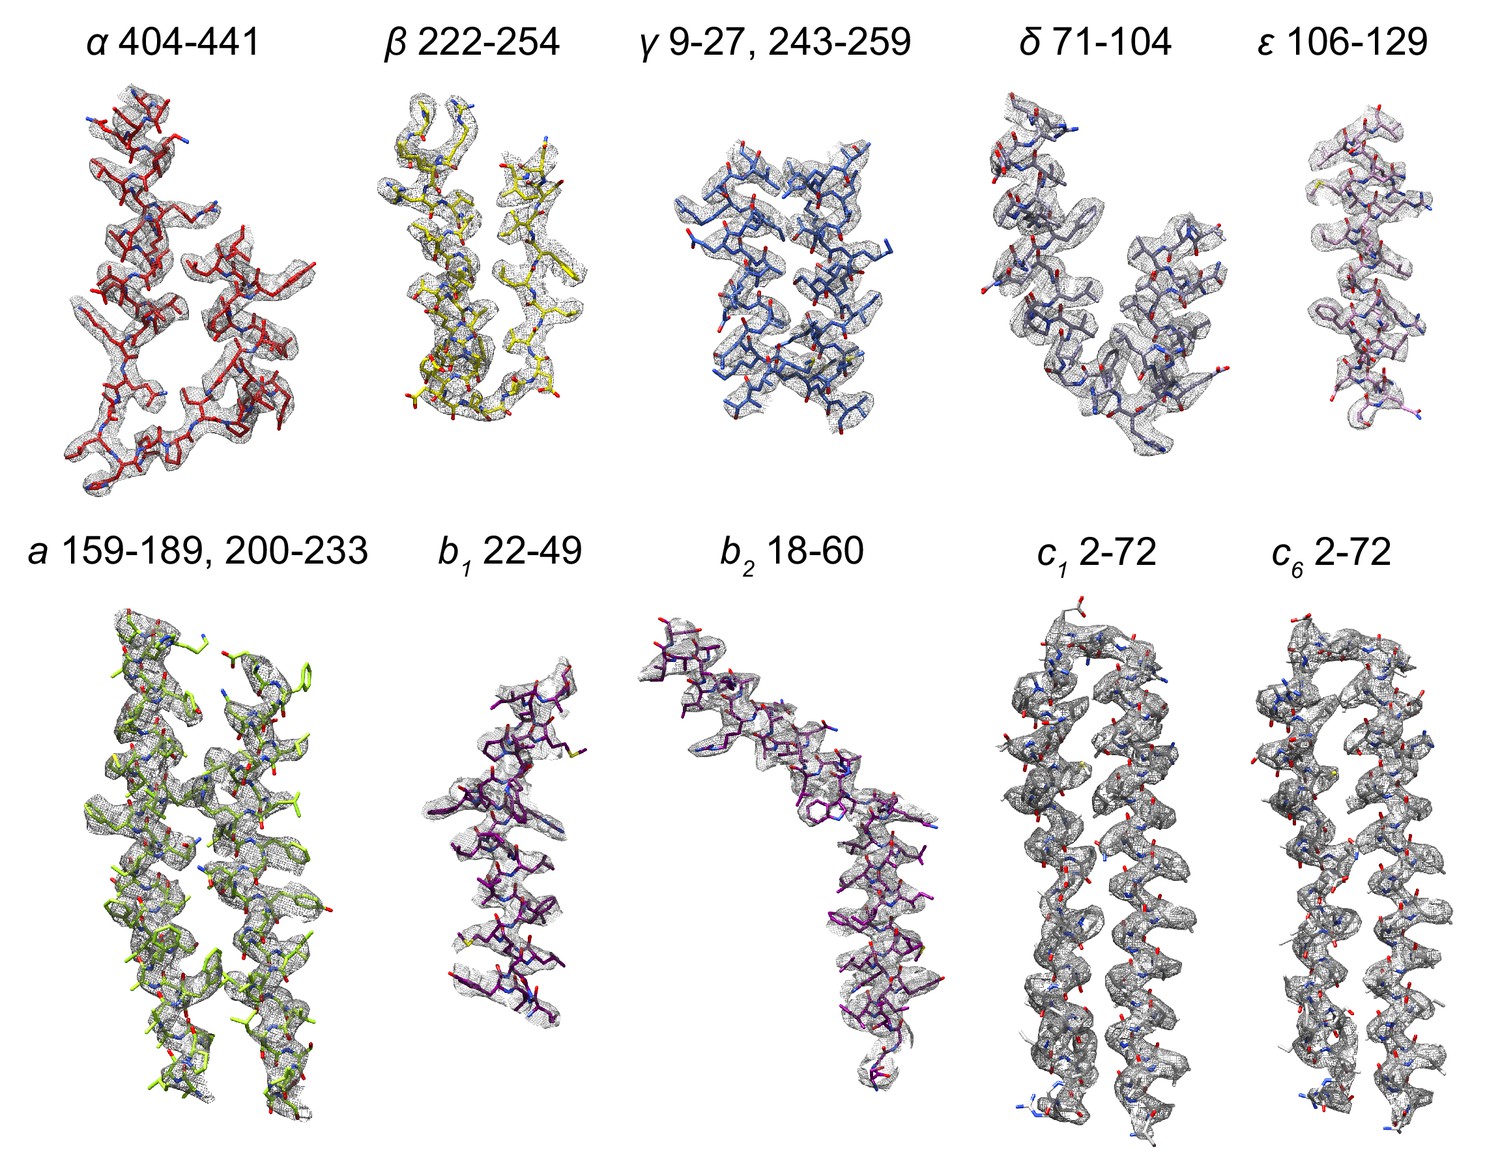
Examples of atomic models from subunits built in the experimental cryo-EM maps.
https://doi.org/10.7554/eLife.43128.006
Figure 1—figure supplement 5

Comparison of Bacillus PS3 subunits ab2 with corresponding structures from spinach chloroplast and E. coli.
Overlay of Bacillus PS3 ATP synthase subunits ab2 with spinach chloroplast ATP synthase subunit abb’ PDB 6FKF (Hahn et al., 2018) (A) and E.coli ATP synthase subunits ab2 PDB 5T4O (Sobti et al., 2016) (B).
Figure 2
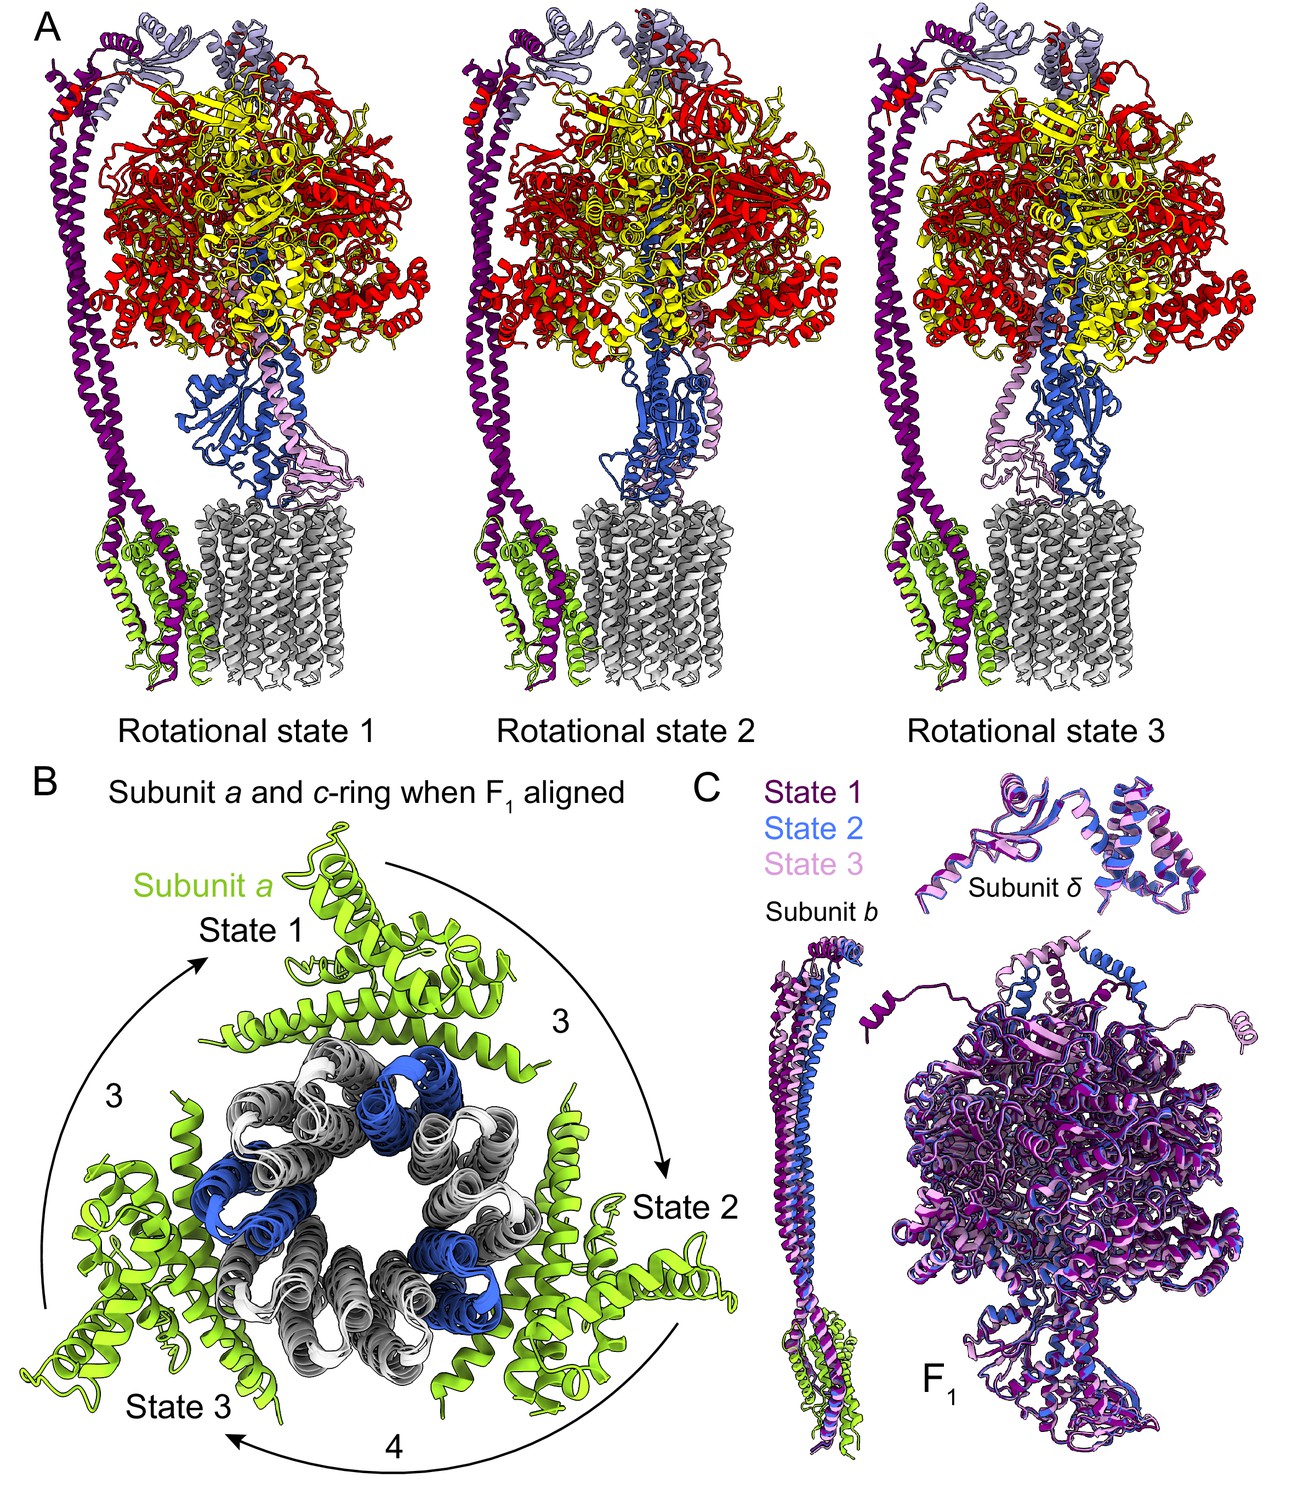
Rotational states of ATP synthase.
(A) Atomic models of the three rotational states of Bacillus PS3 ATP synthase with subunits coloured the same as in Figure 1. (B) Top view of the c-ring and subunit a of the three rotational states from the cytoplasm when the F1 regions of the three states are aligned. Rotation steps of the complex between states are ~3, 4, and 3 c-subunits. (C) Comparison of the atomic models of subunits b, δ, and other F1 region subunits in the different rotational states. The b subunits appear to be the most flexible part of the enzyme.
Figure 3

Inhibition of ATP hydrolysis by subunit ε.
(A) Comparison of βDP (blue) with βE (pink, top) and βTP (light purple, bottom). βDP is forced to adopt an open conformation by subunit ε (dashed box). (B) Comparison of subunits γ (pink) and ε (blue) of ATP synthases from Bacillus PS3 (top) and E. coli (bottom, PDB 3OAA (Cingolani and Duncan, 2011)). The dashed box shows additional interaction between subunits ε and γ in the E. coli complex. (C) Cross-section through the catalytic F1 region of the Bacillus PS3 ATP synthase. Subunit ε (pink) in the rotor is blocked from rotating in the direction of ATP hydrolysis (clockwise) by βTP but is free to rotate in the direction of ATP synthesis (counterclockwise).
Figure 4 with 3 supplements
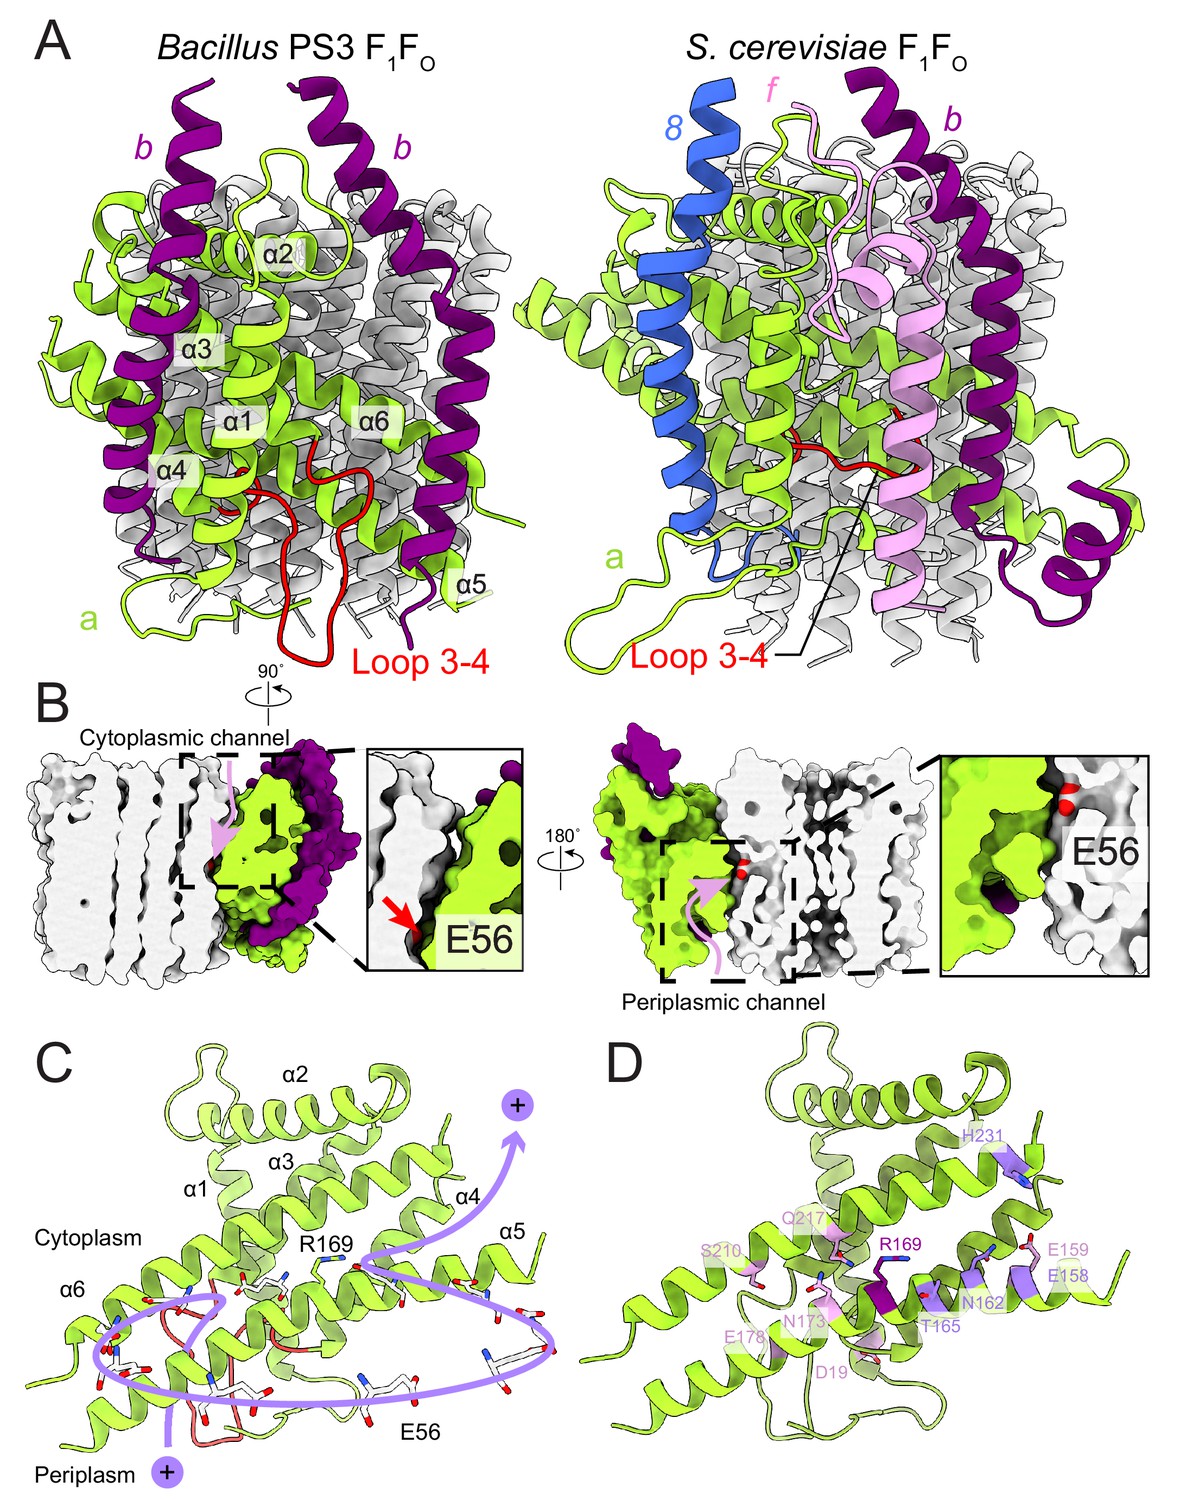
FO region subunits and proton translocation in Bacillus PS3 ATP synthase.
(A) Comparison of the FO regions from Bacillus PS3 (left) and S. cerevisiae (right). (B) Cross sections through a surface representation of the FO region (simulated with rolling of a 1.4 Å sphere (Goddard et al., 2018)) show the cytoplasmic (left) and periplasmic (right) proton half-channels. (C) Proton translocation pathway of Bacillus PS3 ATP synthase. During ATP synthesis, a proton enters the complex via the periplasmic half-channel, passing between α-helices 5 and 6 of subunit a to bind to the Glu 56 residue of a subunit c. The proton then rotates with the c-ring until it reaches the cytoplasmic half-channel formed between subunit a and the c-ring. In the cytoplasmic half-channel, the proton is released from the Glu residue due to its interaction with the positively charged Arg 169 of subunit a. A Glu 56 residue from each protomer of the c-ring is shown. (D) Subunit a of Bacillus PS3 ATP synthase. Arg 169 is in purple, important residues for proton translocation identified by mutagenesis in E. coli ATP synthase are in pink, and other residues that appears to contribute to proton transfer in the cytosolic proton half-channel are in light purple.
Figure 4—figure supplement 1
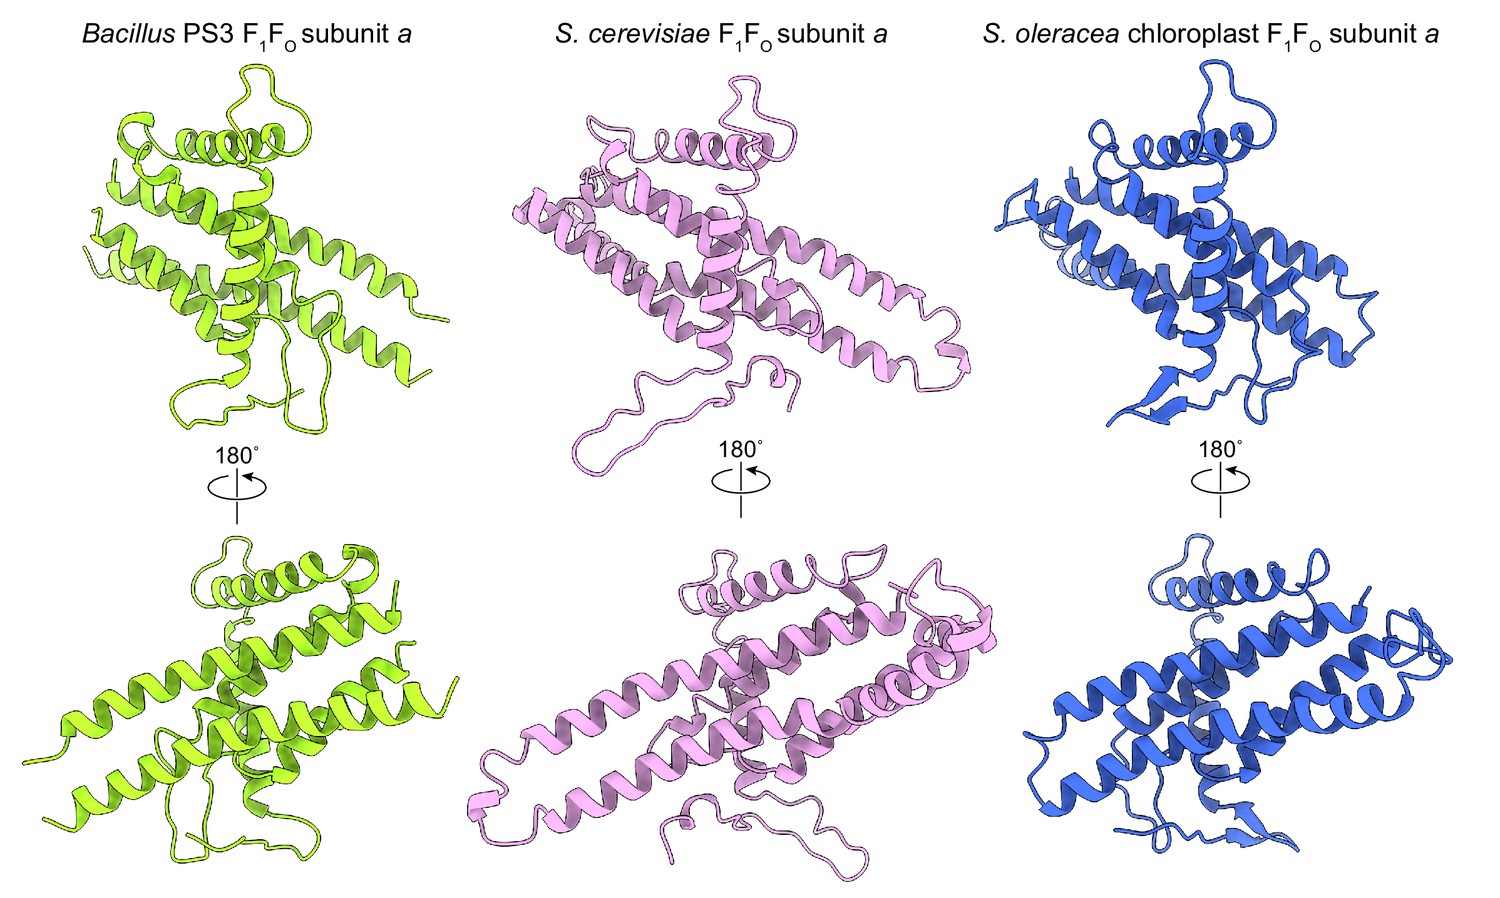
Comparison of subunit a structures from different organisms.
(A) Bacillus PS3 ATP synthase. (B) S. cerevisiae mitochondrial ATP synthase (PDB 6B2Z (Guo et al., 2017)). (C) S. oleracea chloroplast ATP synthase (PDB 6FKF (Hahn et al., 2018)).
Figure 4—figure supplement 2
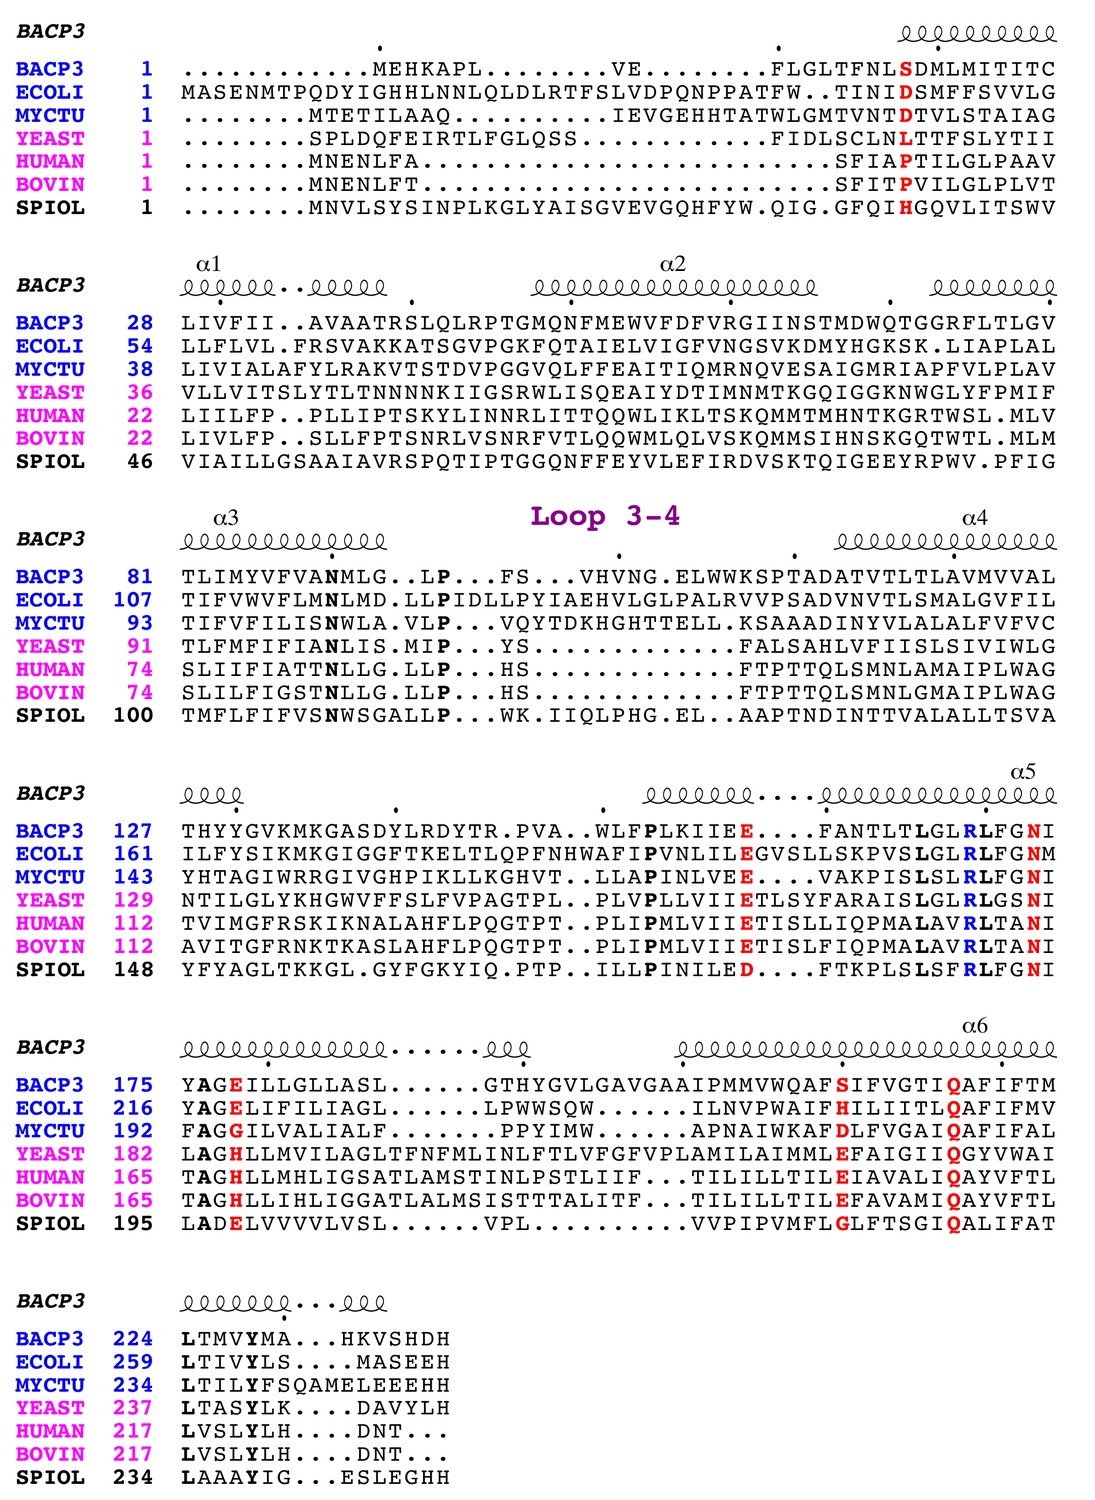
Multiple sequence alignment of subunit a.
Sequences are from bacteria (blue), mitochondria (pink), and chloroplast (black), including Bacillus PS3 (BACP3), E. coli (ECOLI), Mycobacterium tuberculosis (MYCTU), S. cerevisiae (YEAST), Homo sapiens (HUMAN), Bos taurus (BOVINE), and Spinacia oleracea (SPIOL). The functionally important Arg residues for proton translocation are in blue. Other important residues for proton translocation identified by mutagenesis in E. coli ATP synthase are in red. Strictly conserved residues are in bold. Figure was generated with ESPript 3.0 (Robert and Gouet, 2014).
Figure 4—figure supplement 3
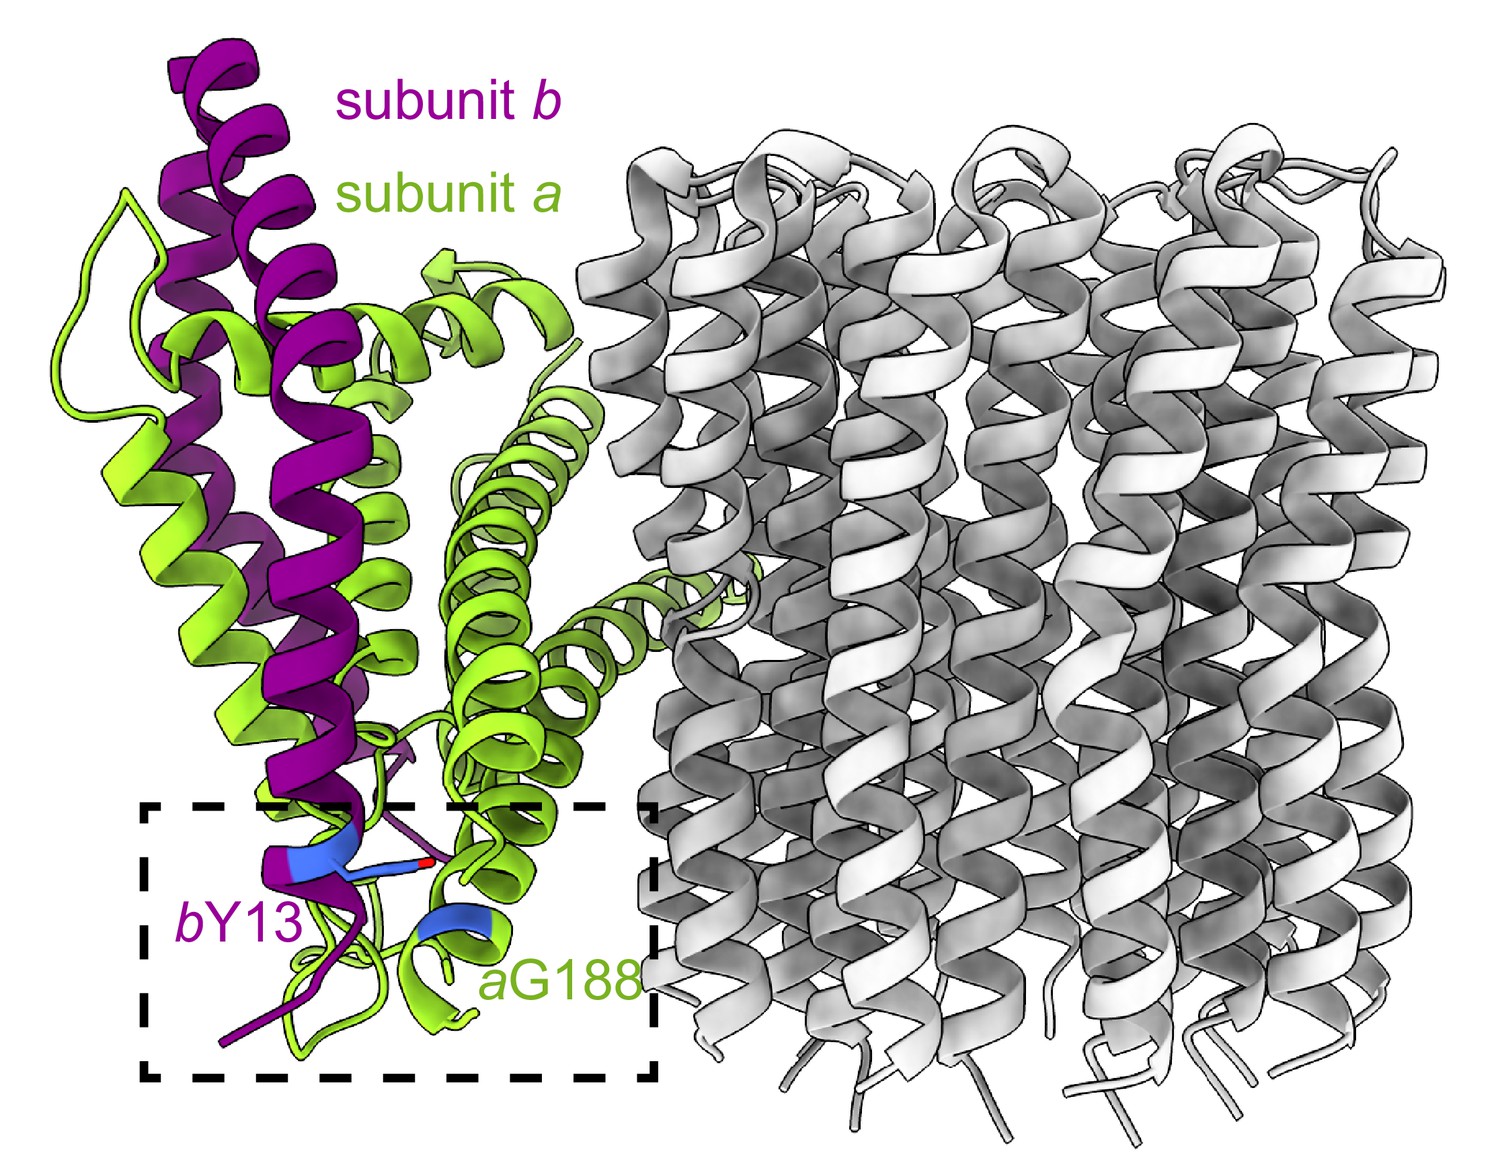
Positions of subunit b Tyr 13 and subunit a Gly 188.
Side view of the FO subunits. The residues of interest are inside the dashed box and are coloured in blue.
Videos
Video 1
Atomic models of the Bacillus PS3 ATP synthase in three rotational states.
https://doi.org/10.7554/eLife.43128.009Additional files
-
Supplementary file 1
Cryo-EM data acquisition, processing, atomic model statistics, and map/model depositions.
(A) Cryo-EM data acquisition and image processing. (B) Map and model statistics. (C) Residues included in atomic models. (D) Deposited maps and associated coordinate files.
- https://doi.org/10.7554/eLife.43128.015
-
Transparent reporting form
- https://doi.org/10.7554/eLife.43128.016
Download links
A two-part list of links to download the article, or parts of the article, in various formats.
Downloads (link to download the article as PDF)
Open citations (links to open the citations from this article in various online reference manager services)
Cite this article (links to download the citations from this article in formats compatible with various reference manager tools)
Structure of a bacterial ATP synthase
eLife 8:e43128.
https://doi.org/10.7554/eLife.43128


