Associations between sounds and actions in early auditory cortex of nonhuman primates
- Special Lab Primate Neurobiology, Leibniz Institute for Neurobiology, Germany
- Center for Behavioral Brain Sciences, Otto-von-Guericke-University, Germany
- Leibniz Institute for Neurobiology, Germany
Figures
Figure 1 with 1 supplement
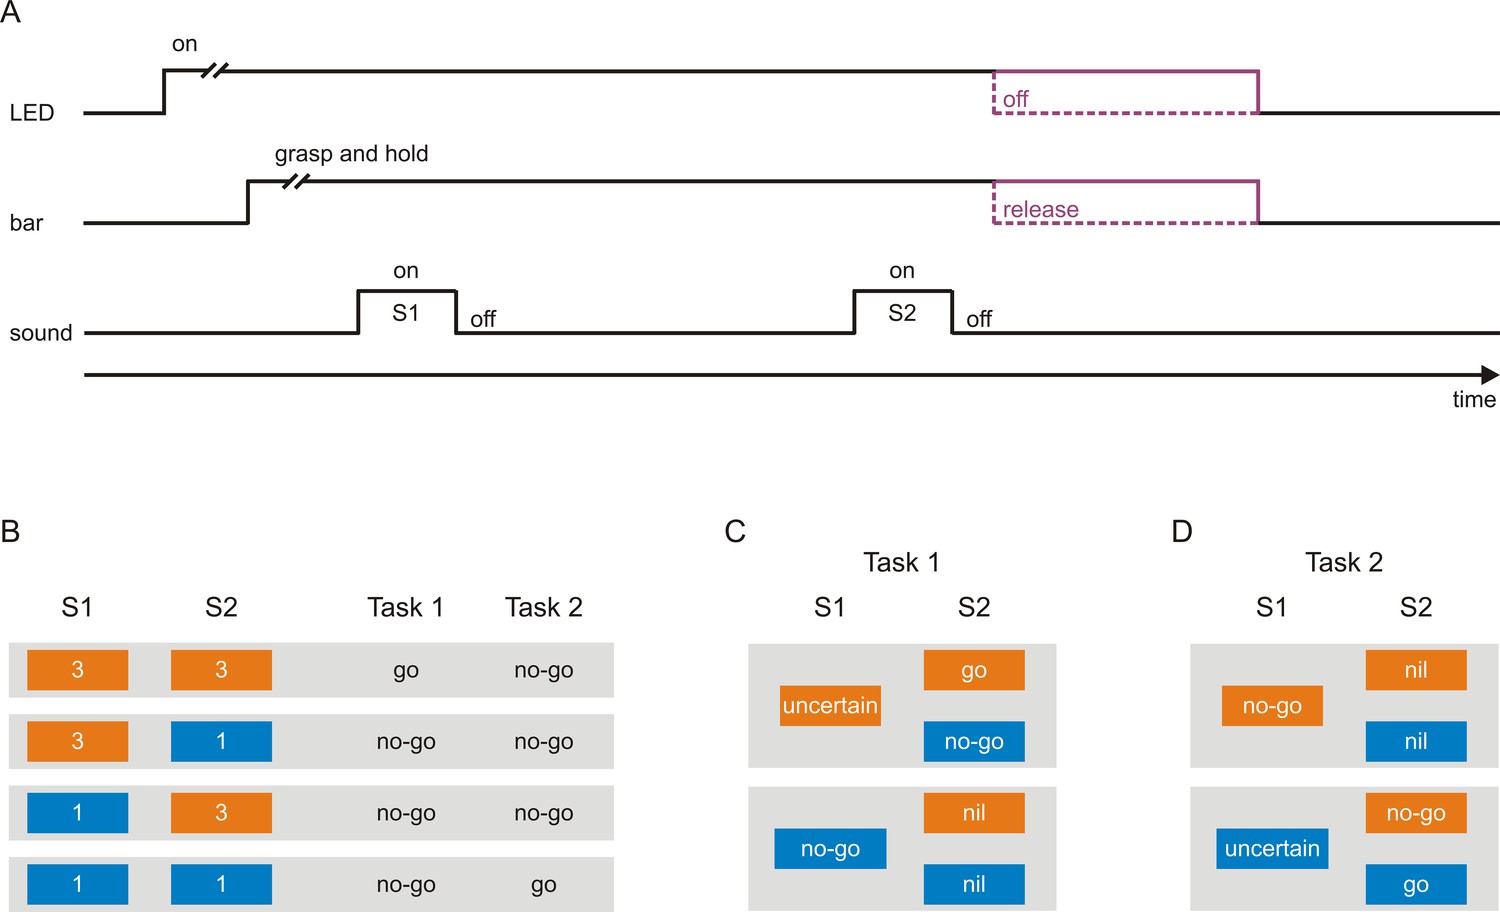
Scheme of the tasks used to investigate neuronal representations of sensorimotor associations in early auditory cortex.
(A) A trial started with the illumination of a light-emitting diode (LED), after which the monkeys had to grasp and to hold a touch bar for some time. This triggered the presentation of a sequence of two tones, S1 and S2, separated by a delay. The monkeys were required to either release the bar within a specific interval after S2 (go response) or to continue holding the bar and thus not to release the bar within this interval (no-go response). Bar release caused the LED to turn off. The monkeys were rewarded with a small amount of water for correct go responses and correct no-go responses. (B) Each tone could have a frequency of either 3 kHz (orange boxes) or 1 kHz (blue boxes), resulting in the four possible sequences 3–3, 3–1, 1–3, and 1–1. In Task 1, the go response was required for the sequence 3–3 and the no-go response for the other sequences. In Task 2, the go response was required for the sequence 1–1 and the no-go response for the other sequences. The monkeys were cued which task to perform in a trial, with a green LED located to the monkey’s right for Task 1 and with a red LED located to the monkey’s left for Task 2. (C–D) Sensorimotor associations of S1s and S2s in Task 1 (C) and Task 2 (D) from the perspective of an ideal observer. At the start of a given trial, the observer could not know which motor response would be required to obtain a reward, and identification of the frequency of S1 was a necessary first step towards resolving this uncertainty. However, in Task 1, when S1 was 3 kHz, identification of S1 was not sufficient and S1 therefore could not signal the required motor response (S1-uncertain). The sufficient information was provided by S2, with the go response signaled by S2 when it was 3 kHz (S2-go) and the no-go response when it was 1 kHz (S2-no-go). When S1 was 1 kHz, identification of S1 was both necessary and sufficient for resolving the uncertainty and therefore S1 could signal the required motor response (S1-no-go). In this case, identification of S2 was not necessary for resolving the uncertainty and S2 was therefore not needed to signal the motor response (S2-nil). In Task 2, in trials where S1 was 1 kHz, S1 could not signal the required motor response (S1-uncertain) and S2 signaled the go response when it was also 1 kHz (S2-go) and the no-go response when it was 3 kHz (S2-no-go). In trials where S1 was 3 kHz, S1 could signal the required motor response (S1-no-go) and S2 was not needed to signal the motor response (S2-nil).
Figure 1—figure supplement 1
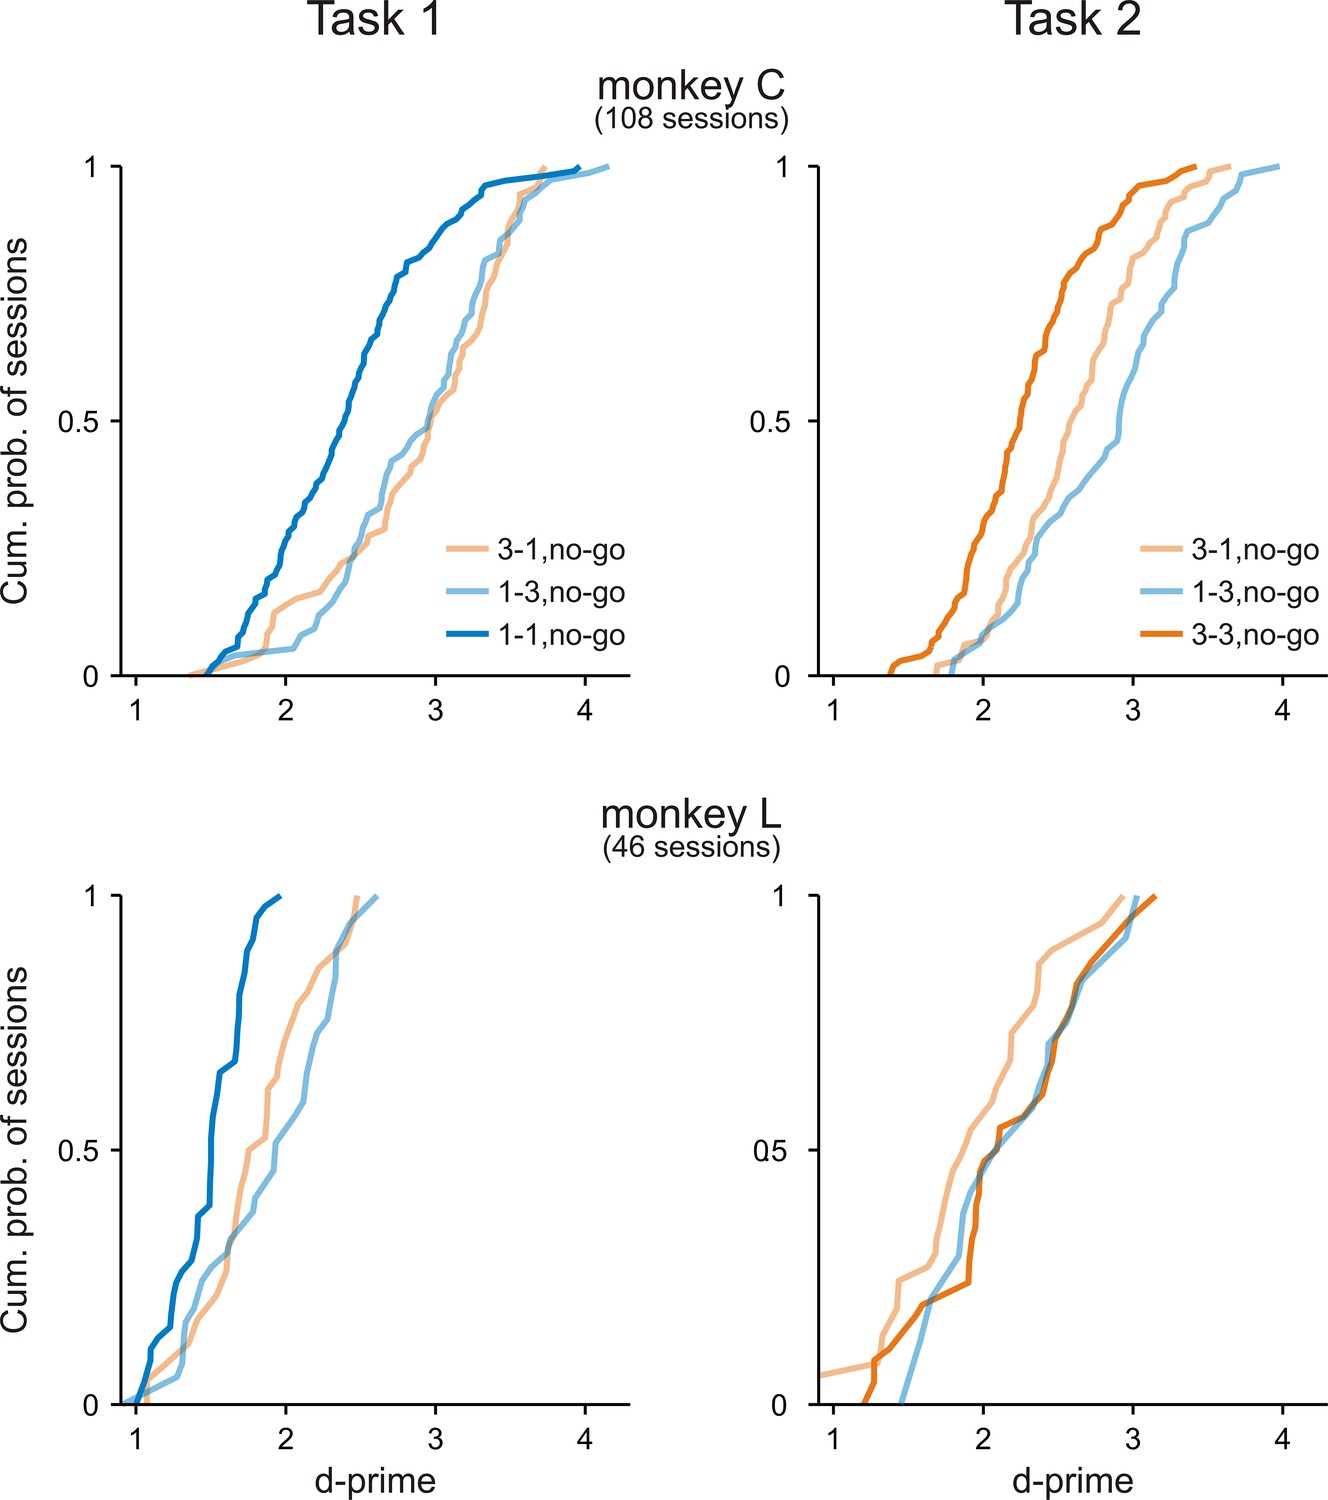
Both monkeys discriminated between the go sequence and each of the no-go sequences.
Cumulative distributions of d-prime values in Task 1 and Task 2 across all experimental sessions for monkey C and monkey L. In both tasks, d-prime values were calculated between the go sequence and each of the three no-go sequences. Note that nearly all d-prime value were >1.
Figure 2 with 5 supplements
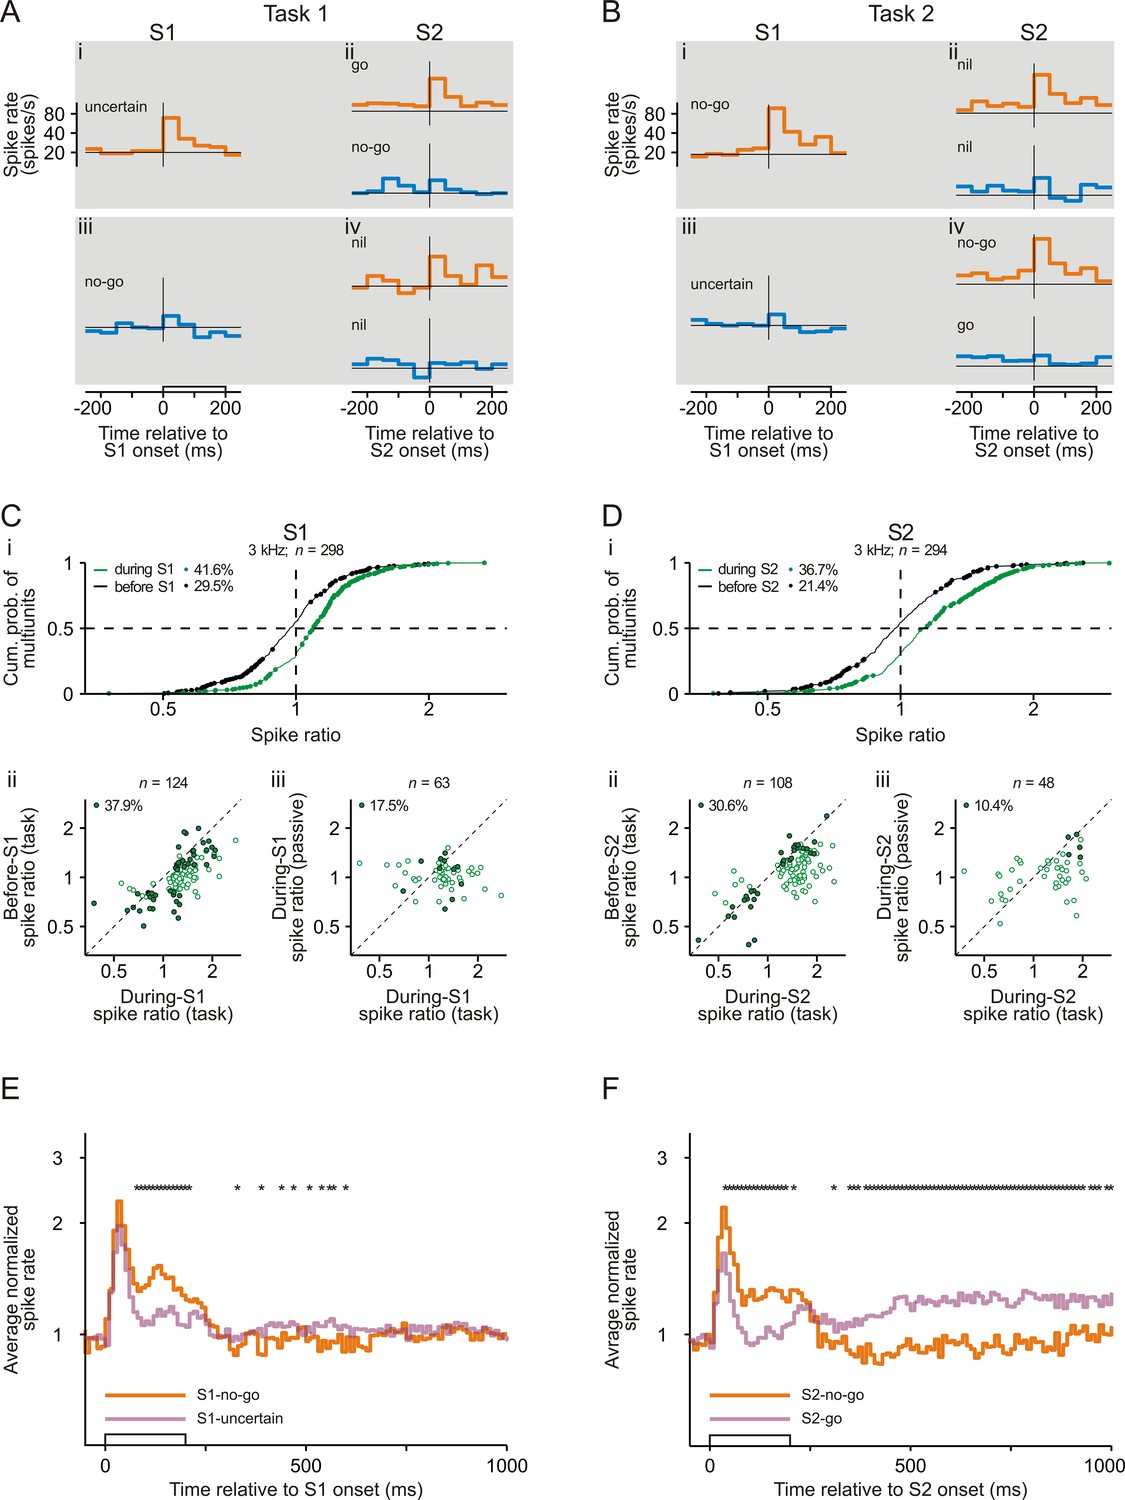
Representation of sensorimotor associations in the spiking activity in early auditory cortex.
(A–B) Spike rates of an example multiunit in auditory cortex to S1 and S2 in Task 1 (A) and Task 2 (B). Orange and blue traces represent spike rates to tones of 3 kHz and of 1 kHz, respectively. Each trace shows the spike rate averaged across trials from 250 ms before tone onset to 50 ms after tone offset. The open bars on the abscissae mark the timing and the 200 ms duration of the tones. The horizontal lines represent a spike rate of 20 spikes/s. Note that the ordinates have logarithmic scaling. The sensorimotor associations of S1s and S2s are also provided. (C) Larger spike responses to S1-no-go than to S1-uncertain when the frequency of the tones was 3 kHz. (i) Cumulative distribution of during-S1 (green) and before-S1 (black) spike ratios for all 298 multiunits recorded from the two monkeys. During-S1 spike ratios were the ratios of the mean spike rates during S1-no-go in Task 2 to the mean spike rates during S1-uncertain in Task 1. Before-S1 spike ratios were the ratios computed from the mean spike rates during the corresponding periods directly before the S1s. Ratios significantly different from 1 are marked by dots, and the proportions of multiunits with such ratios are provided. The horizontal dashed line marks the cumulative probability of 0.5 and the vertical dashed line the ratio of 1. (ii) Larger during-S1 spike ratios than before-S1 spike ratios. The analysis was limited to the 124 multiunits having significant during-S1 spike ratios (green dots in panel i). The open dots mark multiunits with significant during-S1 ratios only and the filled dots mark multiunits with significant during-S1 and before-S1 ratios. The proportion of multiunits with significant during-S1 and before-S1 ratios is provided. The diagonal marks cases where the two ratios were equal. Note that the axes have logarithmic scaling. (iii) Larger during-S1 spike ratios during task performance than in the passive condition. This comparison was limited to the 63 multiunits that exhibited significant during-S1 spike ratios during task performance and that were tested also in the passive condition. The open dots mark multiunits with significant ratios during task performance only and the filled dots mark those with significant ratios both during task performance and in the passive condition. Other conventions are equivalent to those of panel Cii. (D) Larger spike responses to S2-no-go than to S2-go when the frequency of the tones was 3 kHz. The organization of the panel and other conventions are equivalent to those of panel C. During-S2 spike ratios were the ratios of the mean spike rates during S2-no-go in Task 2 to the mean spike rates during S2-go in Task 1. Before-S2 spike ratios were the ratios computed from the mean spike rates during the corresponding periods directly before the S2s. (E) The average normalized spike rates to S1-no-go (orange trace) and S1-uncertain (purple trace) of the 124 multiunits with significant during-S1 spike ratios for the 3 kHz tone, shown from 50 ms before S1 onset to 800 ms after S1 offset. They were obtained by geometrically averaging the spike rates after normalizing each rate to baseline (the mean spike rate during the 250 ms period directly before S1). Note the logarithmic scaling of the ordinate. The stars above the traces mark a significant difference (p<0.05) between the two traces. (F) The average normalized spike rates to S2-no-go (orange trace) and to S2-go (purple trace) of the 108 multiunits with significant during-S2 spike ratios for the 3 kHz tone. Other conventions are equivalent to those of panel E.
Figure 2—figure supplement 1
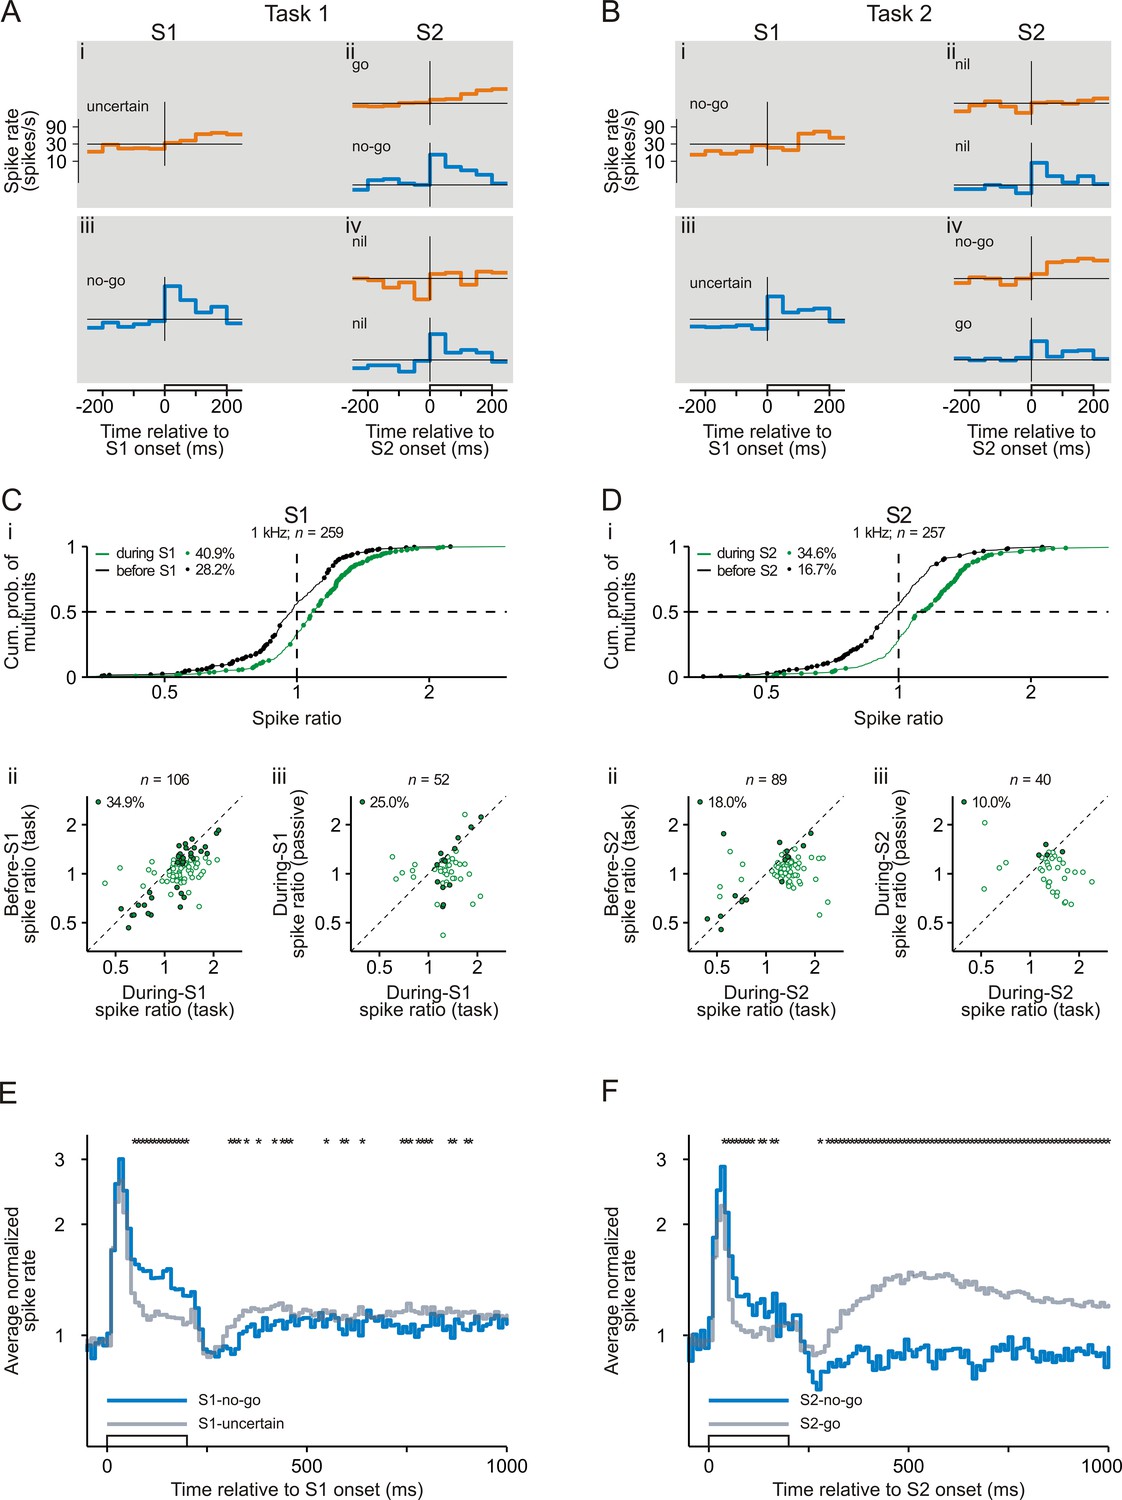
Representation of sensorimotor associations in early auditory cortex revealed by comparing the spike responses to the tones with a frequency of 1 kHz.
The organization of the figure and all other conventions are identical to those of Figure 2. Note that the spike ratio was the ratio of the mean spike rate in Task 1 to that in Task 2.
Figure 2—figure supplement 2
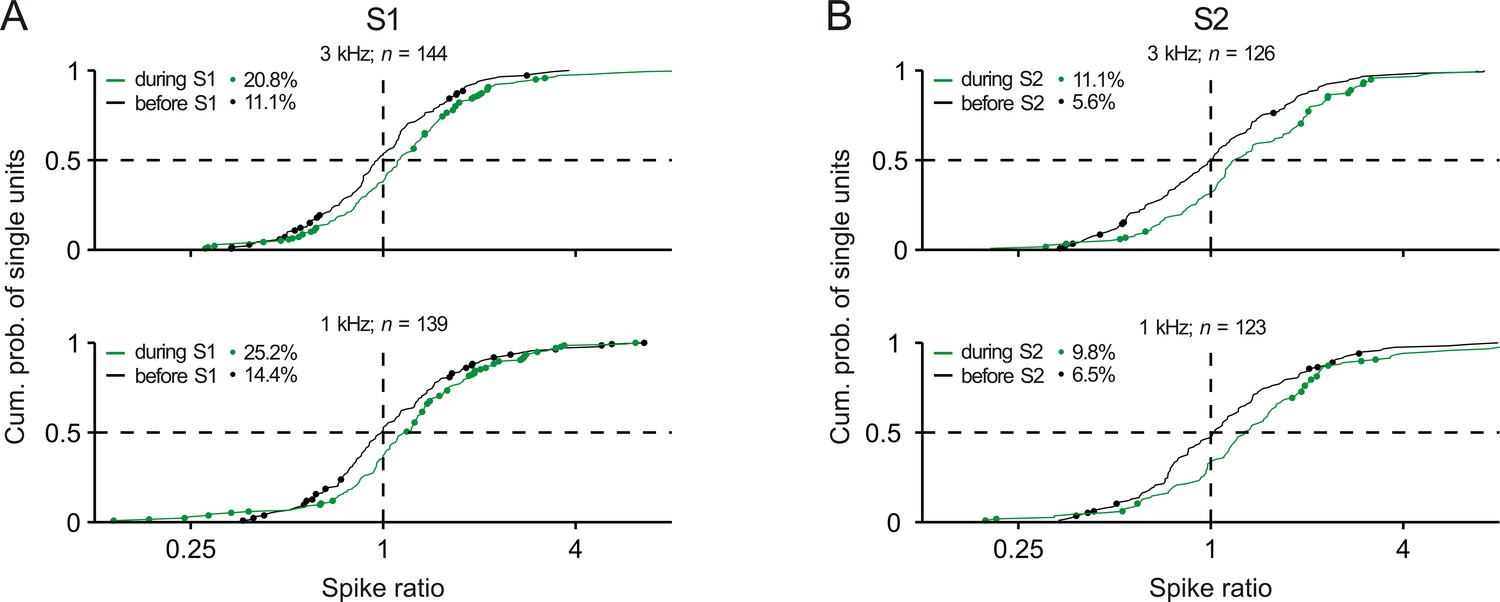
Distributions of the spike ratios of single units in early auditory cortex.
Conventions in panels A and B are equivalent to those of Figure 2Ci and 2Di, respectively.
Figure 2—figure supplement 3
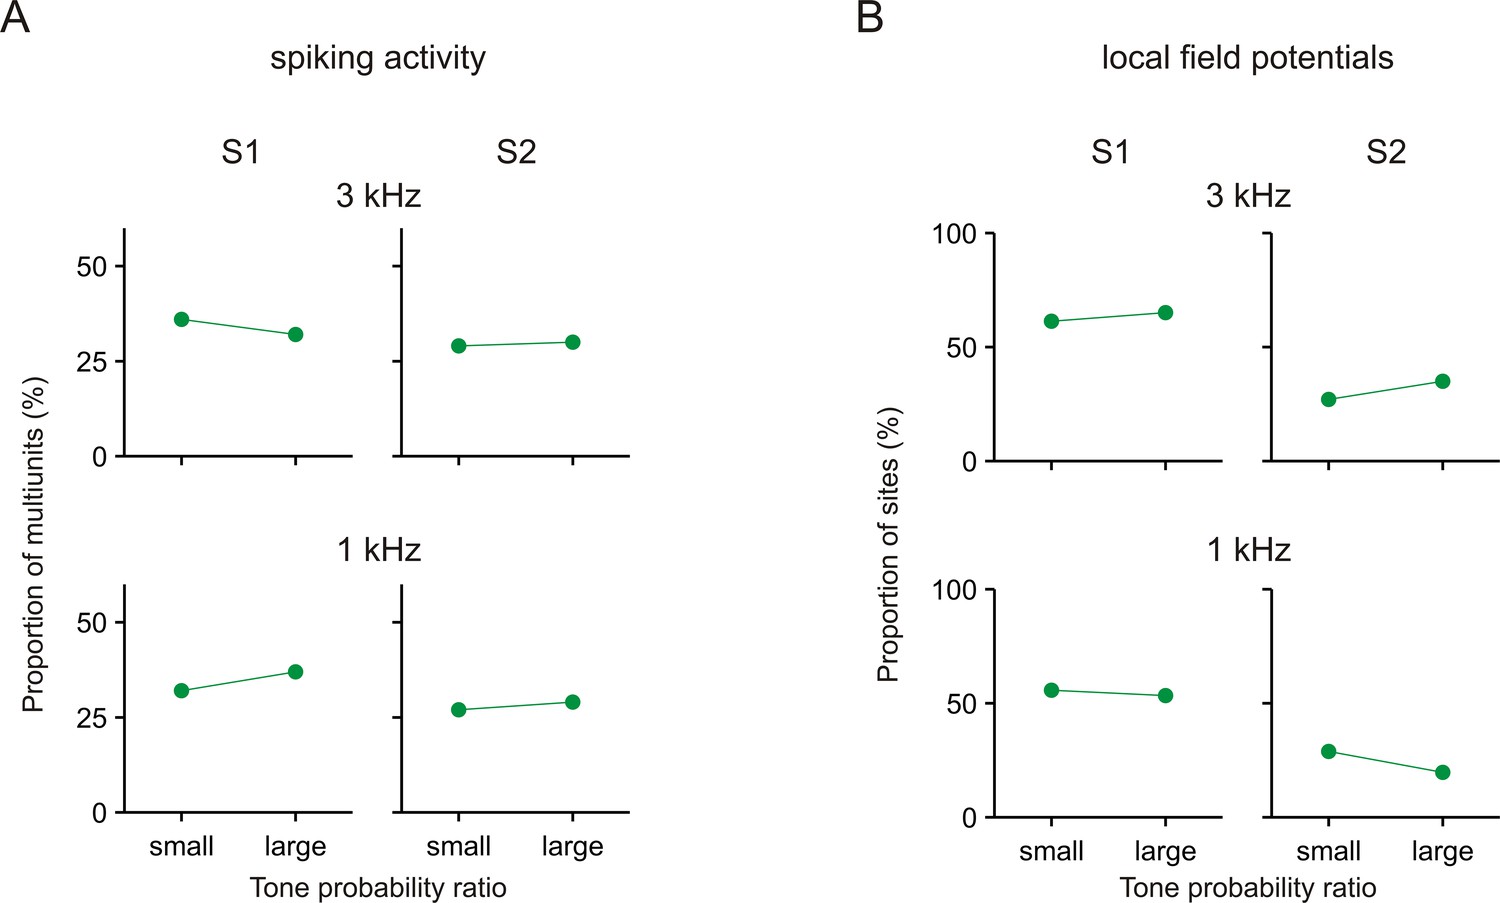
No consistent effects of tone probability on the differences in the neuronal responses between Task 1 and Task 2.
Each panel shows the proportion of multiunits or sites with significant during-S1 ratios >1 or during-S2 ratios >1 in experimental sessions with small or large ratios of tone probability between the two tasks (small ratios: range ~2–2.7, geometric mean ~2.4; large ratios: range ~2.7–5, geometric mean ~3.1). Results are shown separately for the spiking activity (A) and the local field potentials (B) and separately for the 3 kHz and 1 kHz tone.
Figure 2—figure supplement 4
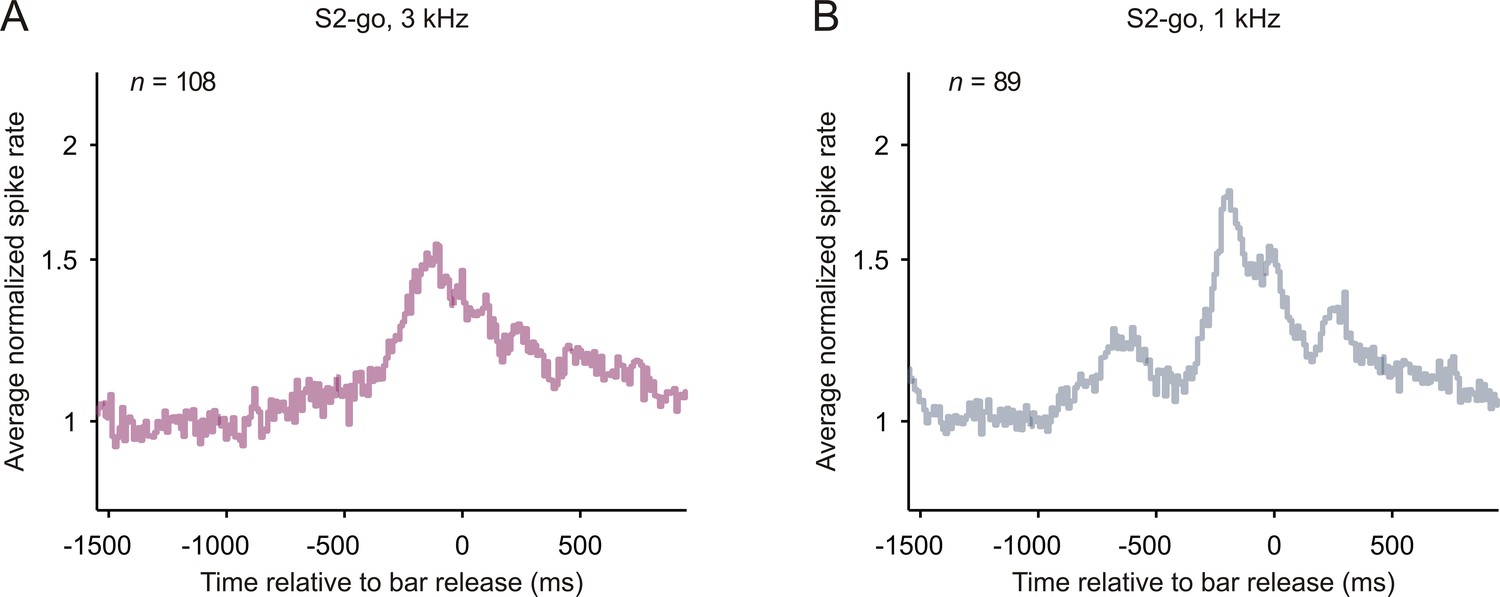
Spiking activity related to bar release in early auditory cortex.
The average normalized spike rates with reference to the time of bar release after S2-go, shown separately for the 3 kHz (A) and 1 kHz tone (B).
Figure 2—figure supplement 5
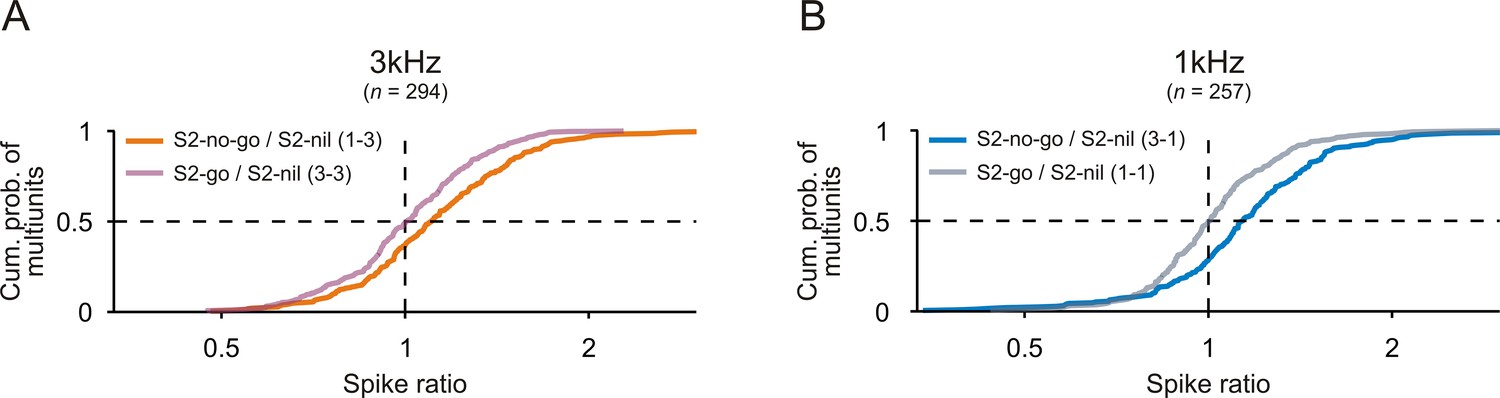
Comparison of spike rates to S2 when S2 was needed to signal a motor response or not.
Cumulative distributions of spike ratios during S2 presentation for all multiunits recorded from the auditory cortex of the two monkeys. A spike ratio was the ratio of the mean spike rate during S2-no-go to that during S2-nil (S2-no-go/S2-nil) or the ratio of the mean spike rate during S2-go to that during S2-nil (S2-go/S2-nil). Data are shown separately for the 3 kHz (A) and 1 kHz tone (B).
Figure 3 with 2 supplements
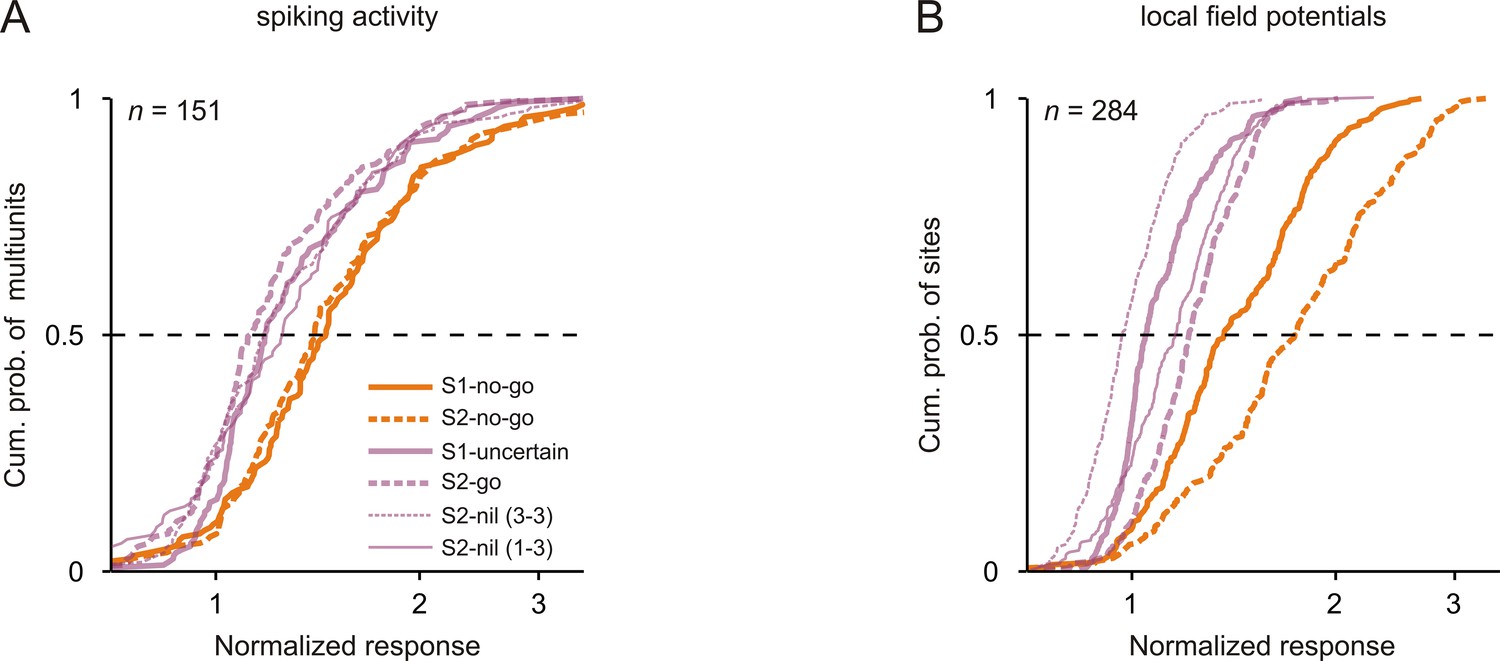
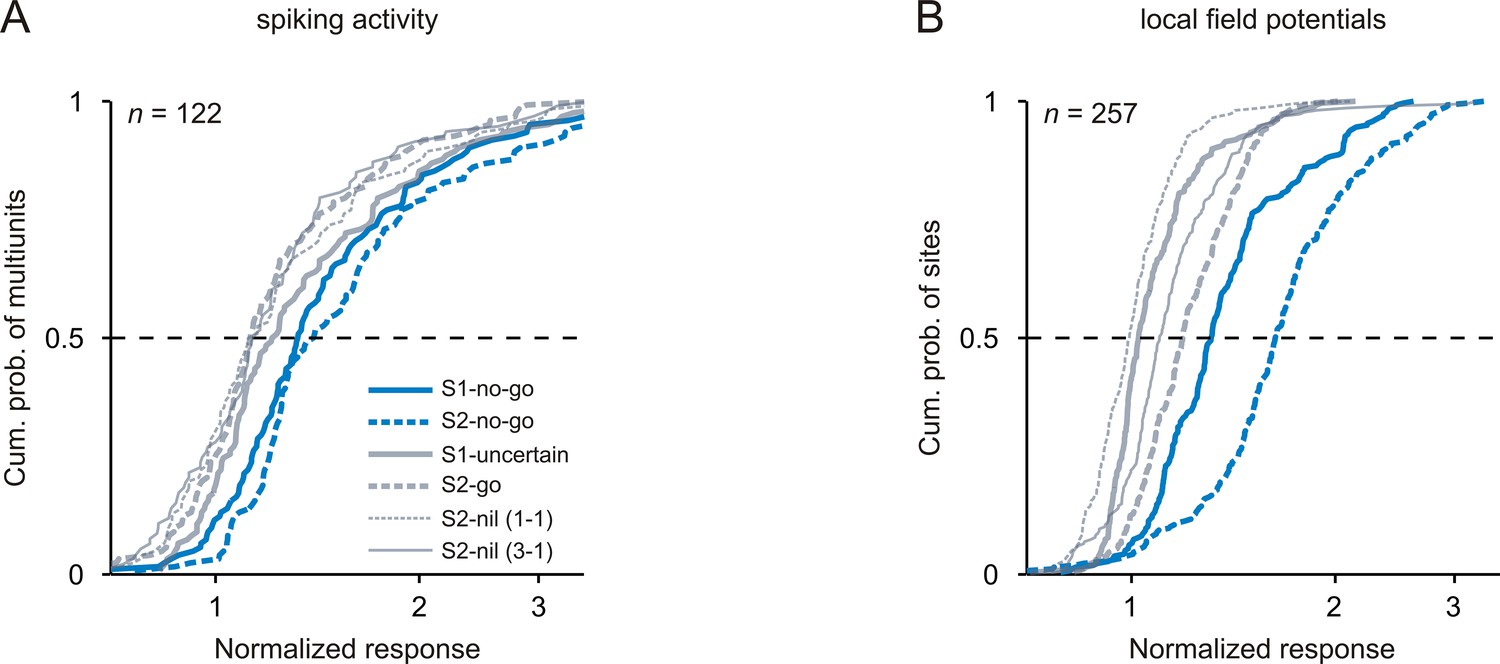
Neuronal responses were strongest to tones that signaled the no-go response.
Cumulative distributions of the normalized neuronal responses to the 3 kHz tone in the six conditions (different sensorimotor associations and positions) for spiking activity (A) and local field potentials (B). For each tone, the normalized neuronal response was calculated as the mean activity during the 250 ms period after tone onset, normalized to the mean activity during the 250 ms period directly before the tone.
-
Figure 3—source data 1
P values of statistical comparisons of the median spike responses to the tones.
The table shows the p value of each comparison.
- https://doi.org/10.7554/eLife.43281.013
-
Figure 3—source data 2
P values of statistical comparisons of the median local field potential responses to the tones.
Conventions are equivalent to those of Figure 3—source data 1.
- https://doi.org/10.7554/eLife.43281.014
Figure 3—figure supplement 1
Strongest neuronal responses to 1 kHz tones that signaled the no-go response.
The organization of the figure and all other conventions are identical to those of Figure 3.
Figure 3—figure supplement 2
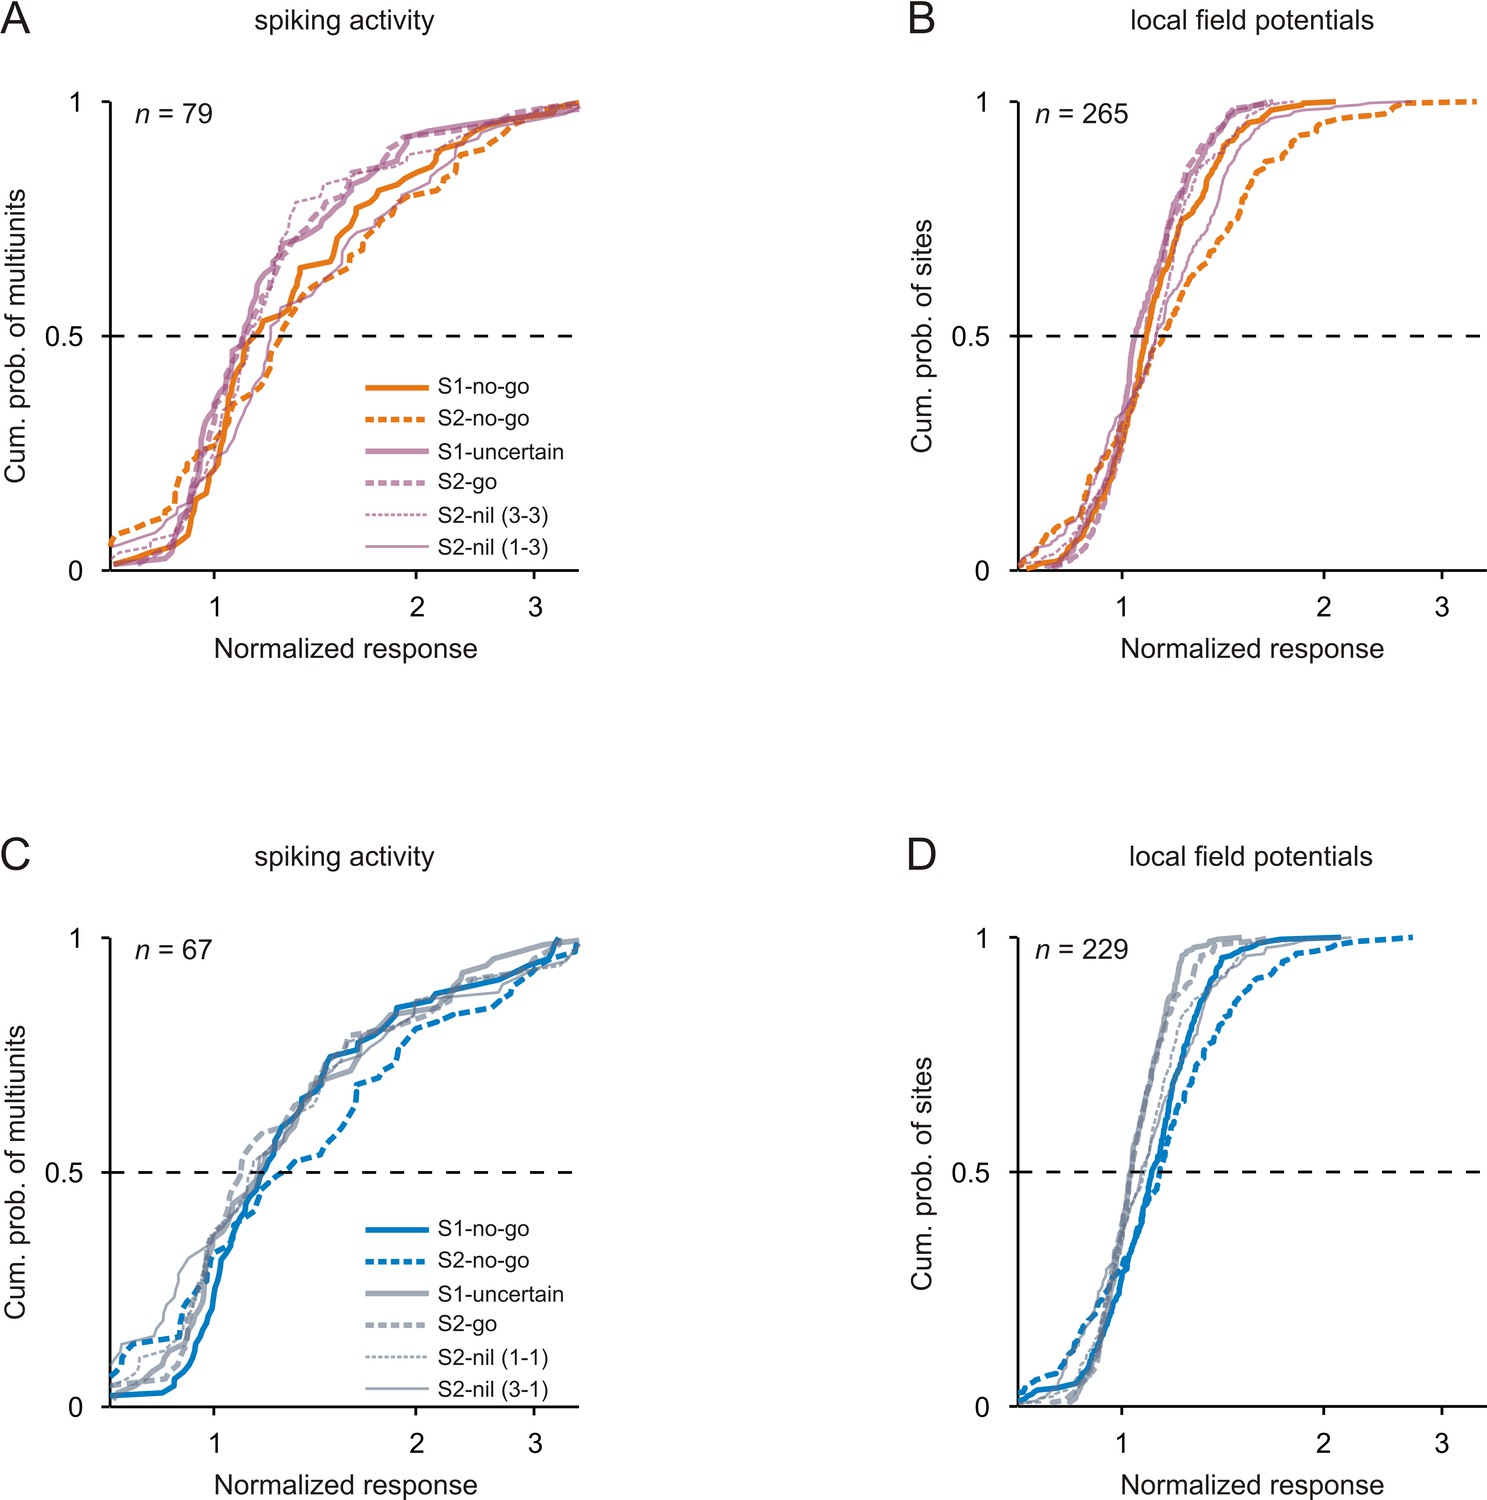
Comparison of neuronal responses to tones of the same frequency in the passive condition.
Conventions in A-B are equivalent to those of Figure 3 and conventions in C-D equivalent to those of Figure 3—figure supplement 1.
Figure 4
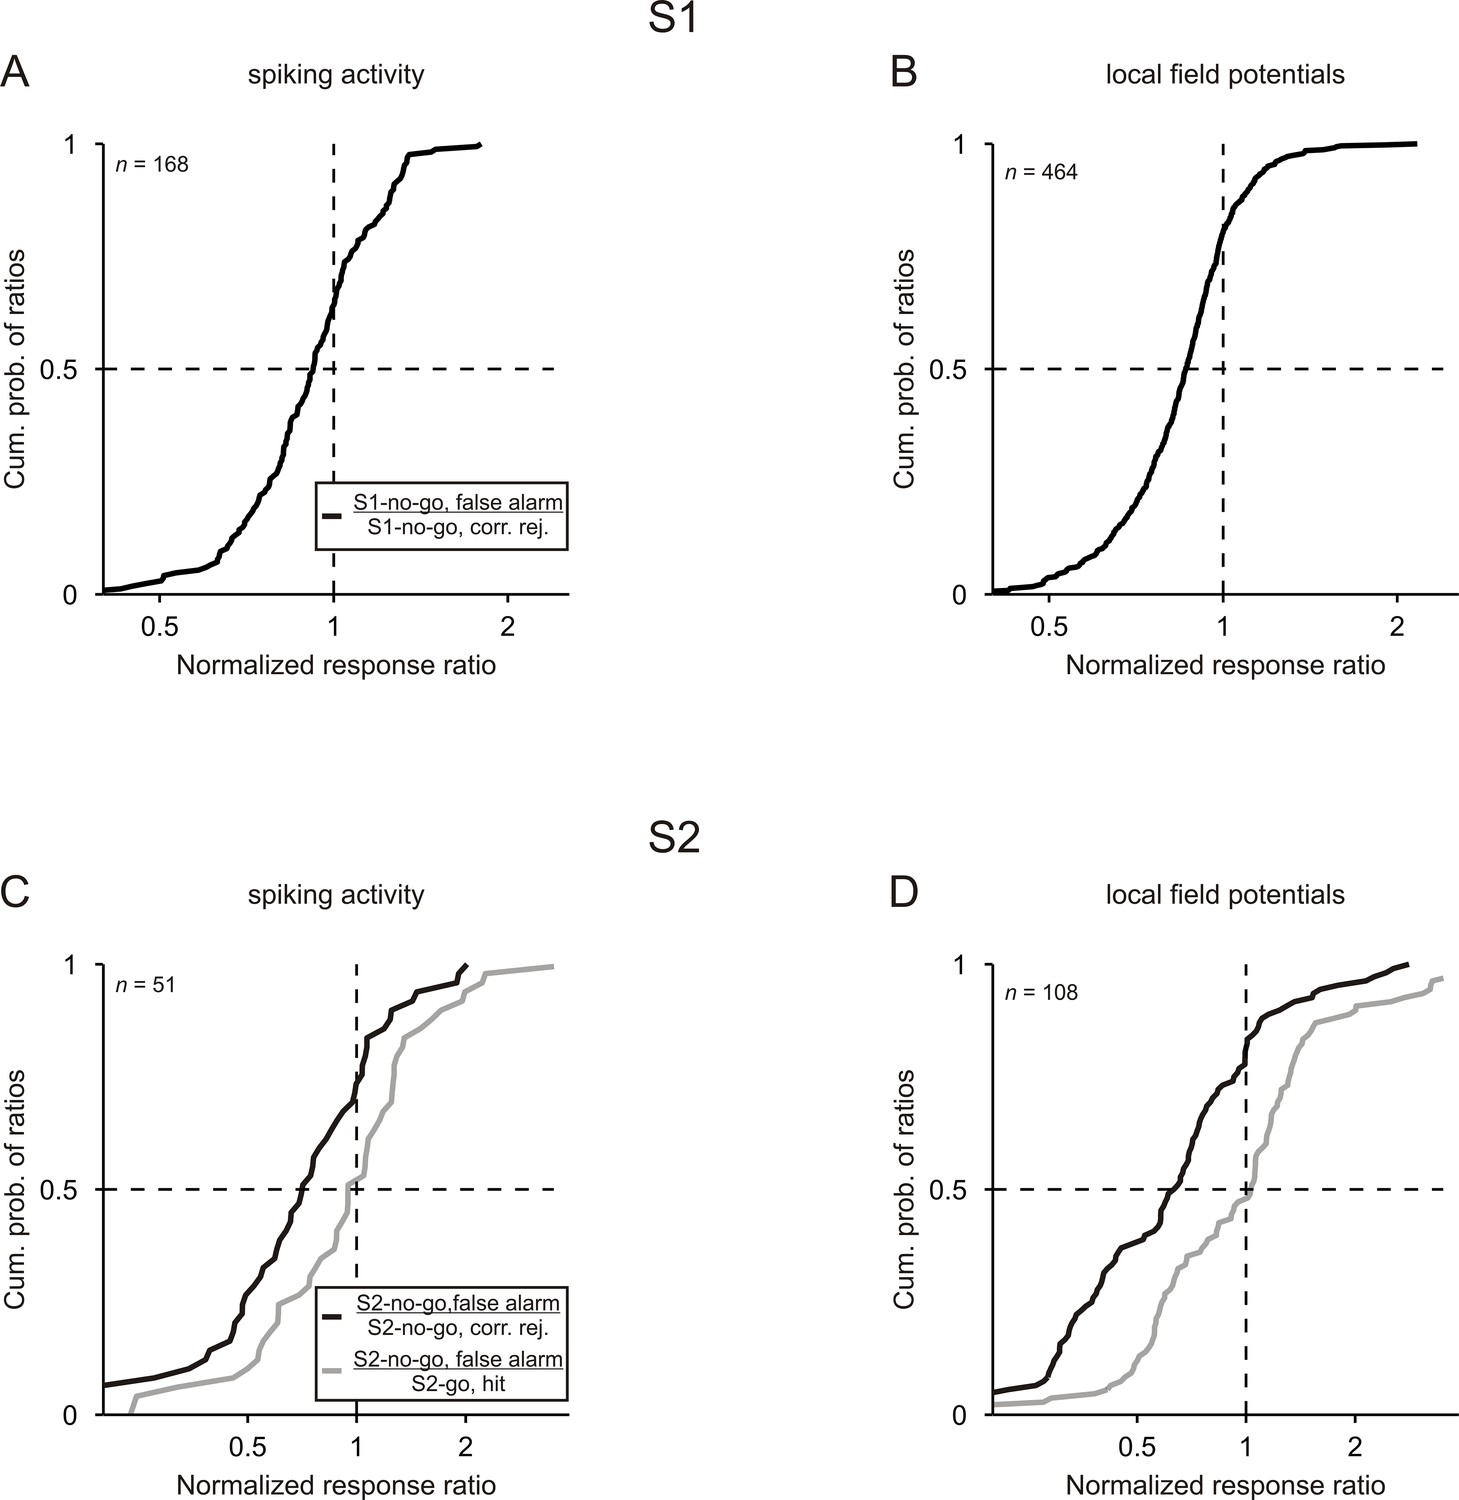
Neuronal responses are related to the behavioral performance of monkeys.
Cumulative distributions of the ratios computed between the normalized responses to a given tone in false-alarm trials and in correct trials. For both S1 and S2, ratios were computed between the no-go tone in false-alarm trials and in correct trials (black curves). For S2, ratios were also computed between the no-go tone in false-alarm trials and the go tone in correct trials (gray curves). Results obtained from the 3 kHz and 1 kHz tone were pooled.
Figure 5 with 1 supplement

Representation of sensorimotor associations in the local field potentials in early auditory cortex.
(A, B) The averaged local field potentials (LFPs) for an example site in auditory cortex of monkey L while she correctly performed Task 1 (A) and Task 2 (B). The horizontal lines represent an amplitude of 0 mV. Note that the ordinates in panels A and B have linear scaling. The organization of the figure and other conventions are equivalent to those of Figure 2.
Figure 5—figure supplement 1
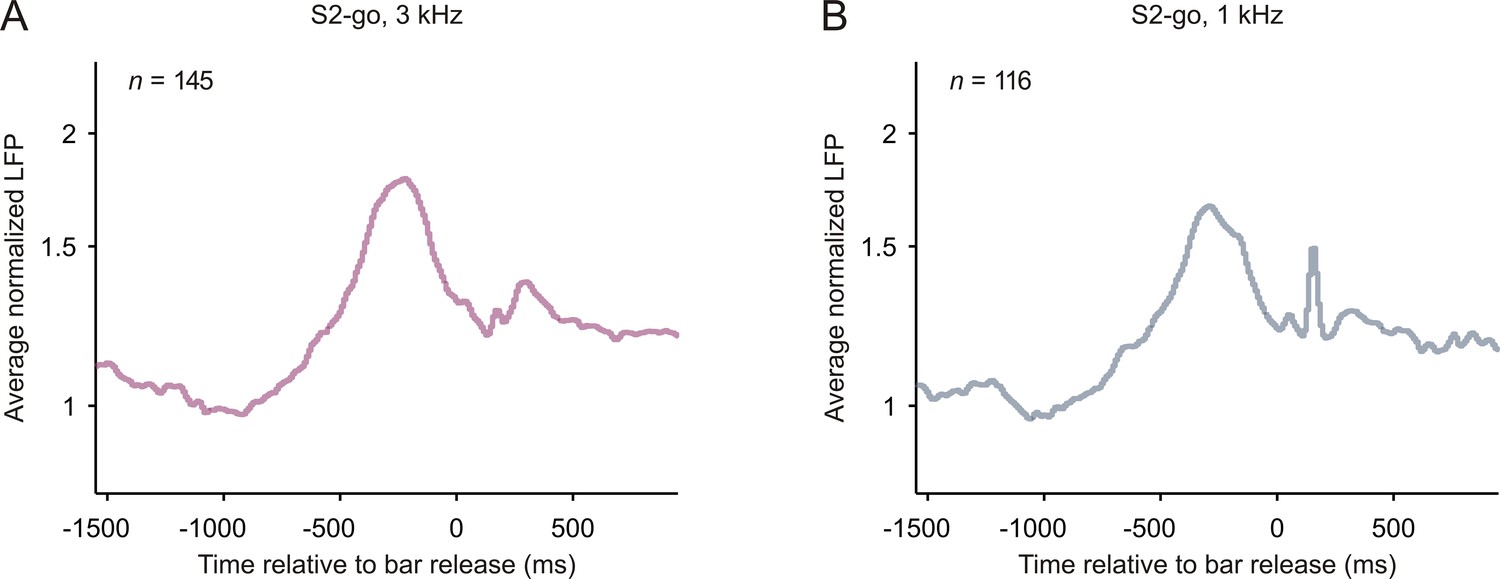
Local field potentials related to bar release in early auditory cortex.
The organization of the figure and all other conventions are identical to those of Figure 2—figure supplement 4. The peaks of the average normalized responses shortly (~150 ms) after the bar release may be related to LED off.
Additional files
-
Transparent reporting form
- https://doi.org/10.7554/eLife.43281.018
Download links
A two-part list of links to download the article, or parts of the article, in various formats.
Downloads (link to download the article as PDF)
Open citations (links to open the citations from this article in various online reference manager services)
Cite this article (links to download the citations from this article in formats compatible with various reference manager tools)
Associations between sounds and actions in early auditory cortex of nonhuman primates
eLife 8:e43281.
https://doi.org/10.7554/eLife.43281


