The impact of measles immunization campaigns in India using a nationally representative sample of 27,000 child deaths
- St. Michael’s Hospital, University of Toronto, Canada
- King George’s Medical University, India
- Government of India, India
- School of Public Health, Post Graduate Institute of Medical Education and Research, India
- Indian Council of Medical Research, India
Figures
Figure 1 with 2 supplements
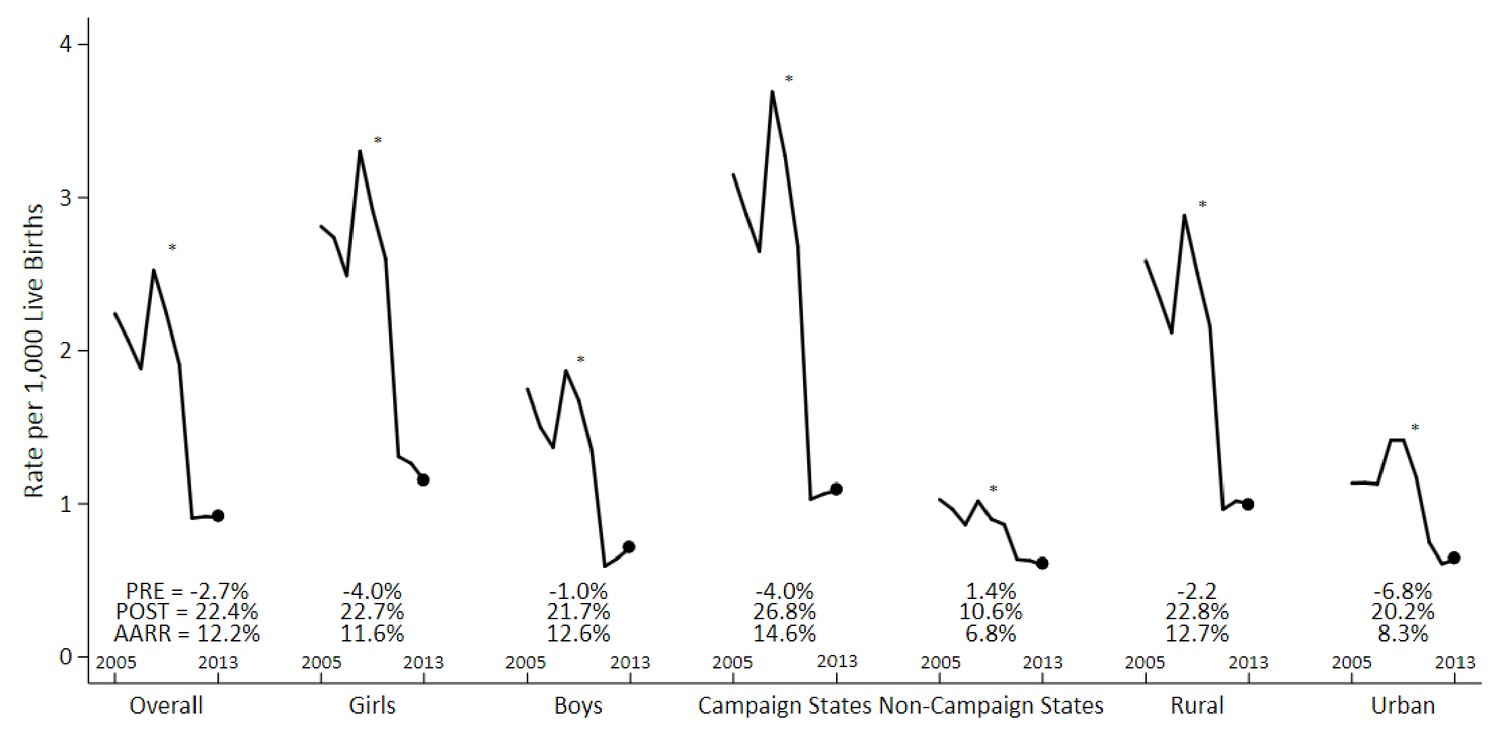
Measles mortality rates and average annual rate reduction among 1–59 month-old children by sex, campaign states, and residence, India, 2005–2013.
The measles case definition attributed a death to measles if at least one physician assigned measles as the cause of death or if the respondent reported the deceased child to have a history of measles (using the local language term). Mortality rates were calculated using 3 year moving averages of weighted proportions applied to UN deaths and live births estimates for India. Campaign states include: Arunachal Pradesh, Assam, Bihar, Chhattisgarh, Gujarat, Haryana, Jharkhand, Madhya Pradesh, Manipur, Meghalaya, Nagaland, Rajasthan, Tripura, and Uttar Pradesh. Non-campaign states include all other states and union territories. * indicates the year 2010. PRE = average annual rate reduction pre-intervention. POST = average annual rate reduction post-intervention. AARR = average annual rate reduction overall.
-
Figure 1—source data 1
Child measles mortality rates.
- https://doi.org/10.7554/eLife.43290.009
Figure 1—figure supplement 1
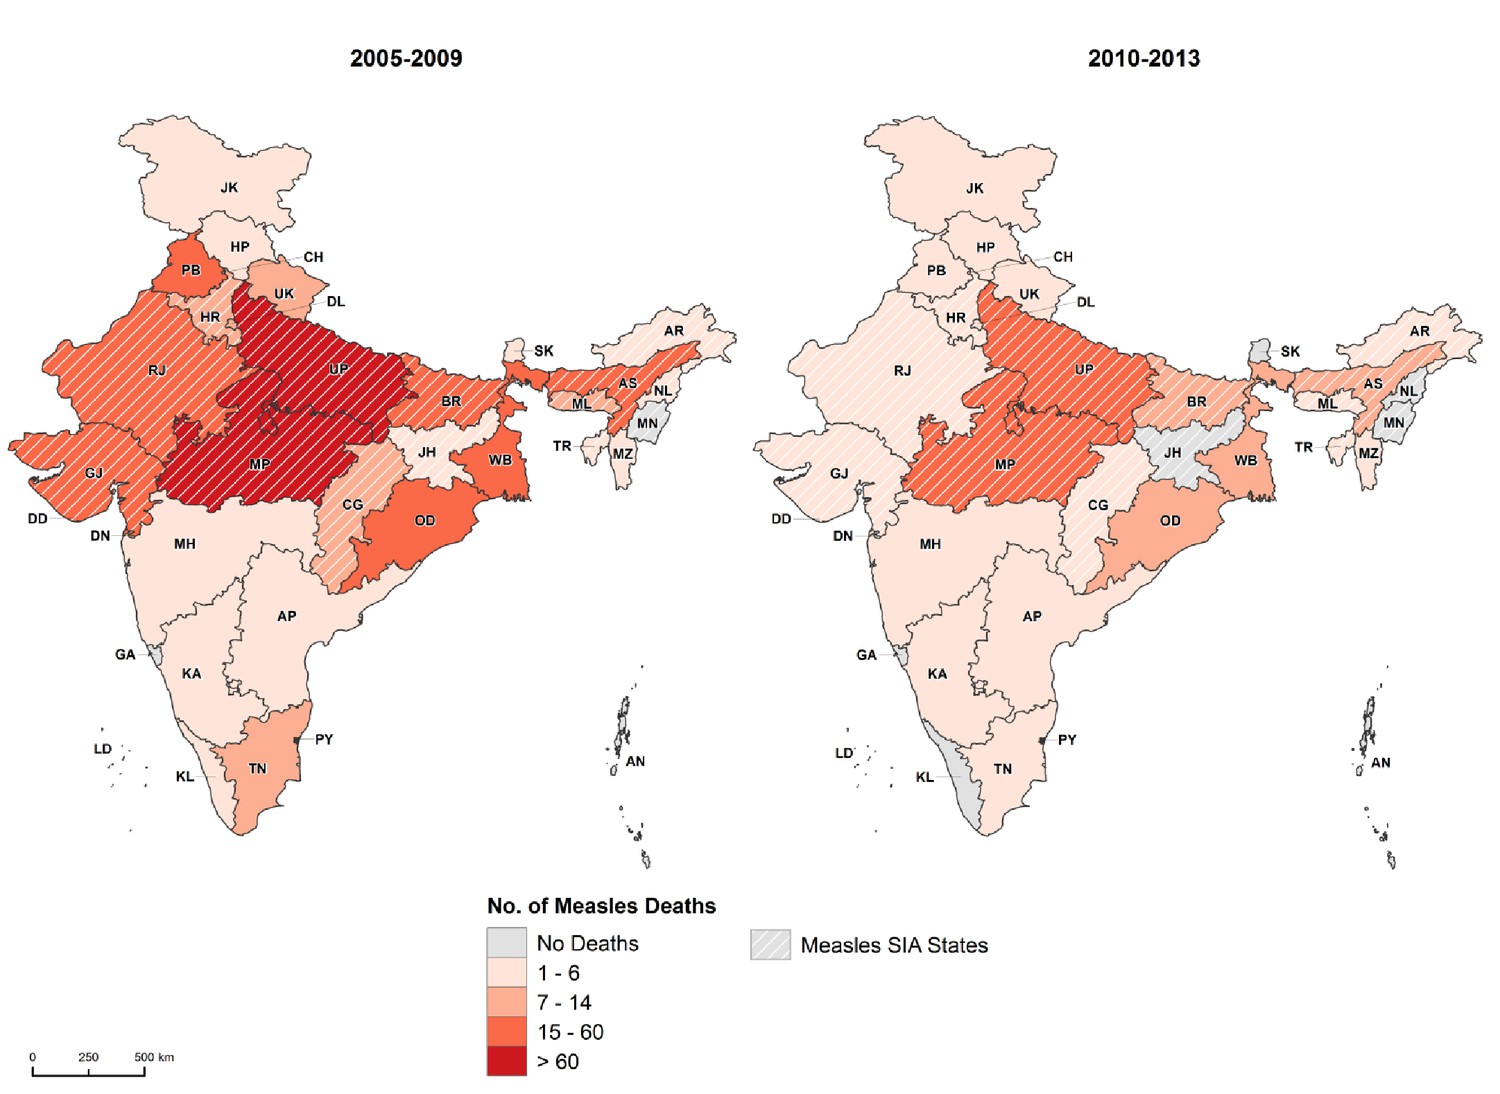
State-level distribution of 1–59 month measles deaths before and after measles campaign launch, India, 2005–2013.
Cross-hatched regions represent campaign states. AN = Andaman and Nicobar Islands. AP = Andhra Pradesh. AR = Arunachal Pradesh. AS = Assam. BR = Bihar. CH = Chandigarh. CG = Chhattisgarh. DD = Daman and Diu. DN = Dadra and Nagar Haveli. DL = Delhi. GA = Goa. GJ = Gujarat. HP = Himachal Pradesh. HR = Haryana. JH = Jharkhand. JK = Jammu and Kashmir. KA = Karnataka. KL = Kerala. LD = Lakshadweep. MH = Maharashtra. ML = Meghalaya. MN = Manipur. MP = Madhya Pradesh. MZ = Mizoram. NL = Nagaland. OD = Odisha. PB = Punjab. PY = Puducherry. RJ = Rajasthan. SK = Sikkim. TN = Tamil Nadu. TR = Tripura. UP = Uttar Pradesh. UT = Uttarakhand. WB = West Bengal. National Health Mission states represent 18 states identified as having poor health infrastructure and low public health spending including: Arunachal Pradesh, Assam, Bihar, Chhattisgarh, Himachal Pradesh, Jharkhand, Jammu and Kashmir, Manipur, Mizoram, Meghalaya, Madhya Pradesh, Nagaland, Odisha, Rajasthan, Sikkim, Uttarakhand, Uttar Pradesh, and Tripura. Empowered Action Group (EAG) states represent eight poor states lagging in socioeconomic indicators in India including: Bihar, Chhattisgarh, Jharkhand, Madhya Pradesh, Odisha, Rajasthan, Uttarakhand, and Uttar Pradesh.
-
Figure 1—figure supplement 1—source data 1
State-level distribution of 1-59 month measles deaths.
- https://doi.org/10.7554/eLife.43290.007
Figure 1—figure supplement 2
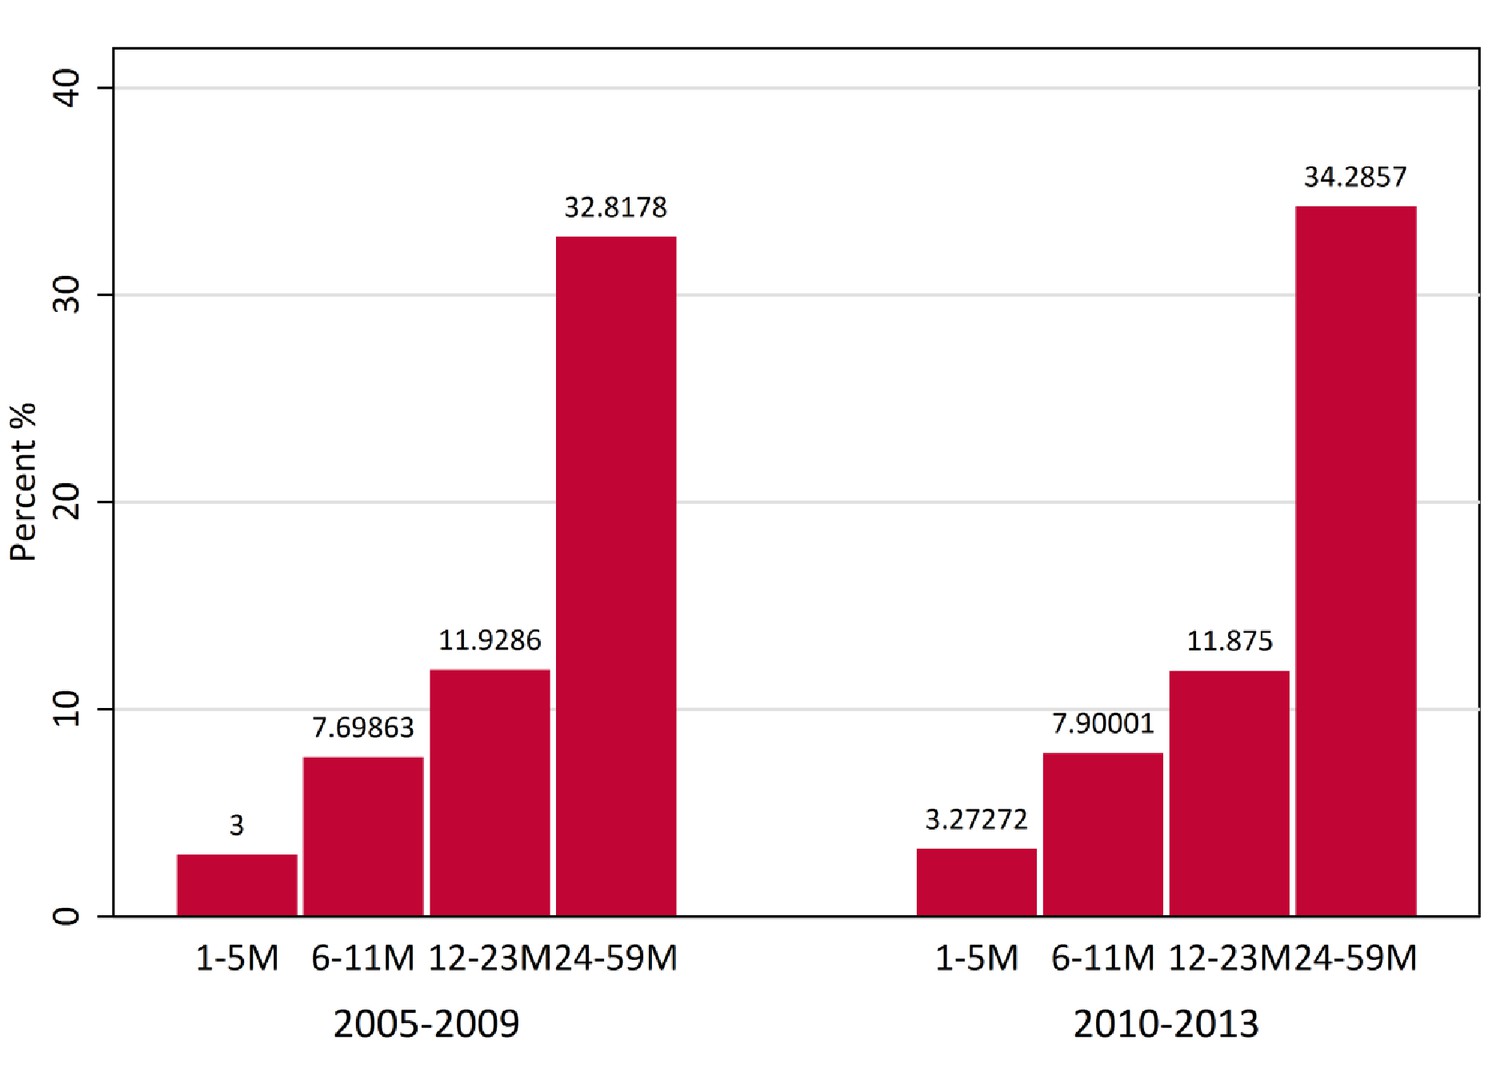
Proportion of measles deaths by age at death (months) among children aged 1–59 months, 2005–2009 versus 2010–2013, India.
https://doi.org/10.7554/eLife.43290.008
Figure 2

Interrupted time-series analysis on measles, pneumonia, and diarrhoea mortality (black) and control mortality (white) among 1–59 month-old children during the measles campaign in India, 2005–2013.
Refer to Figure 1 for the definition of measles deaths. Control deaths were selected based on comparability of their pre-intervention trends to trends for measles. For measles in campaign states and non-campaign states, control deaths were injuries, non-communicable diseases, or congenital anomalies. For pneumonia (n = 4,403) and diarrhoea (n = 3,468) deaths in campaign states, control deaths were non-communicable diseases or congenital anomalies. Difference in slope represents the difference in pre-post trends between the measles and control deaths. Difference in level represents the difference between the level of measles and control mortality rates immediately following campaign launch. We observed no significant difference when comparing pre-intervention trends for the control deaths to the deaths from measles, pneumonia, or diarrhoea in the campaign states, or to measles deaths in the non-campaign states (p>0.1 for all four comparisons).
-
Figure 2—source data 1
Child measles, pneumonia, and diarrhoea mortality rates in campaign states.
- https://doi.org/10.7554/eLife.43290.013
Figure 3
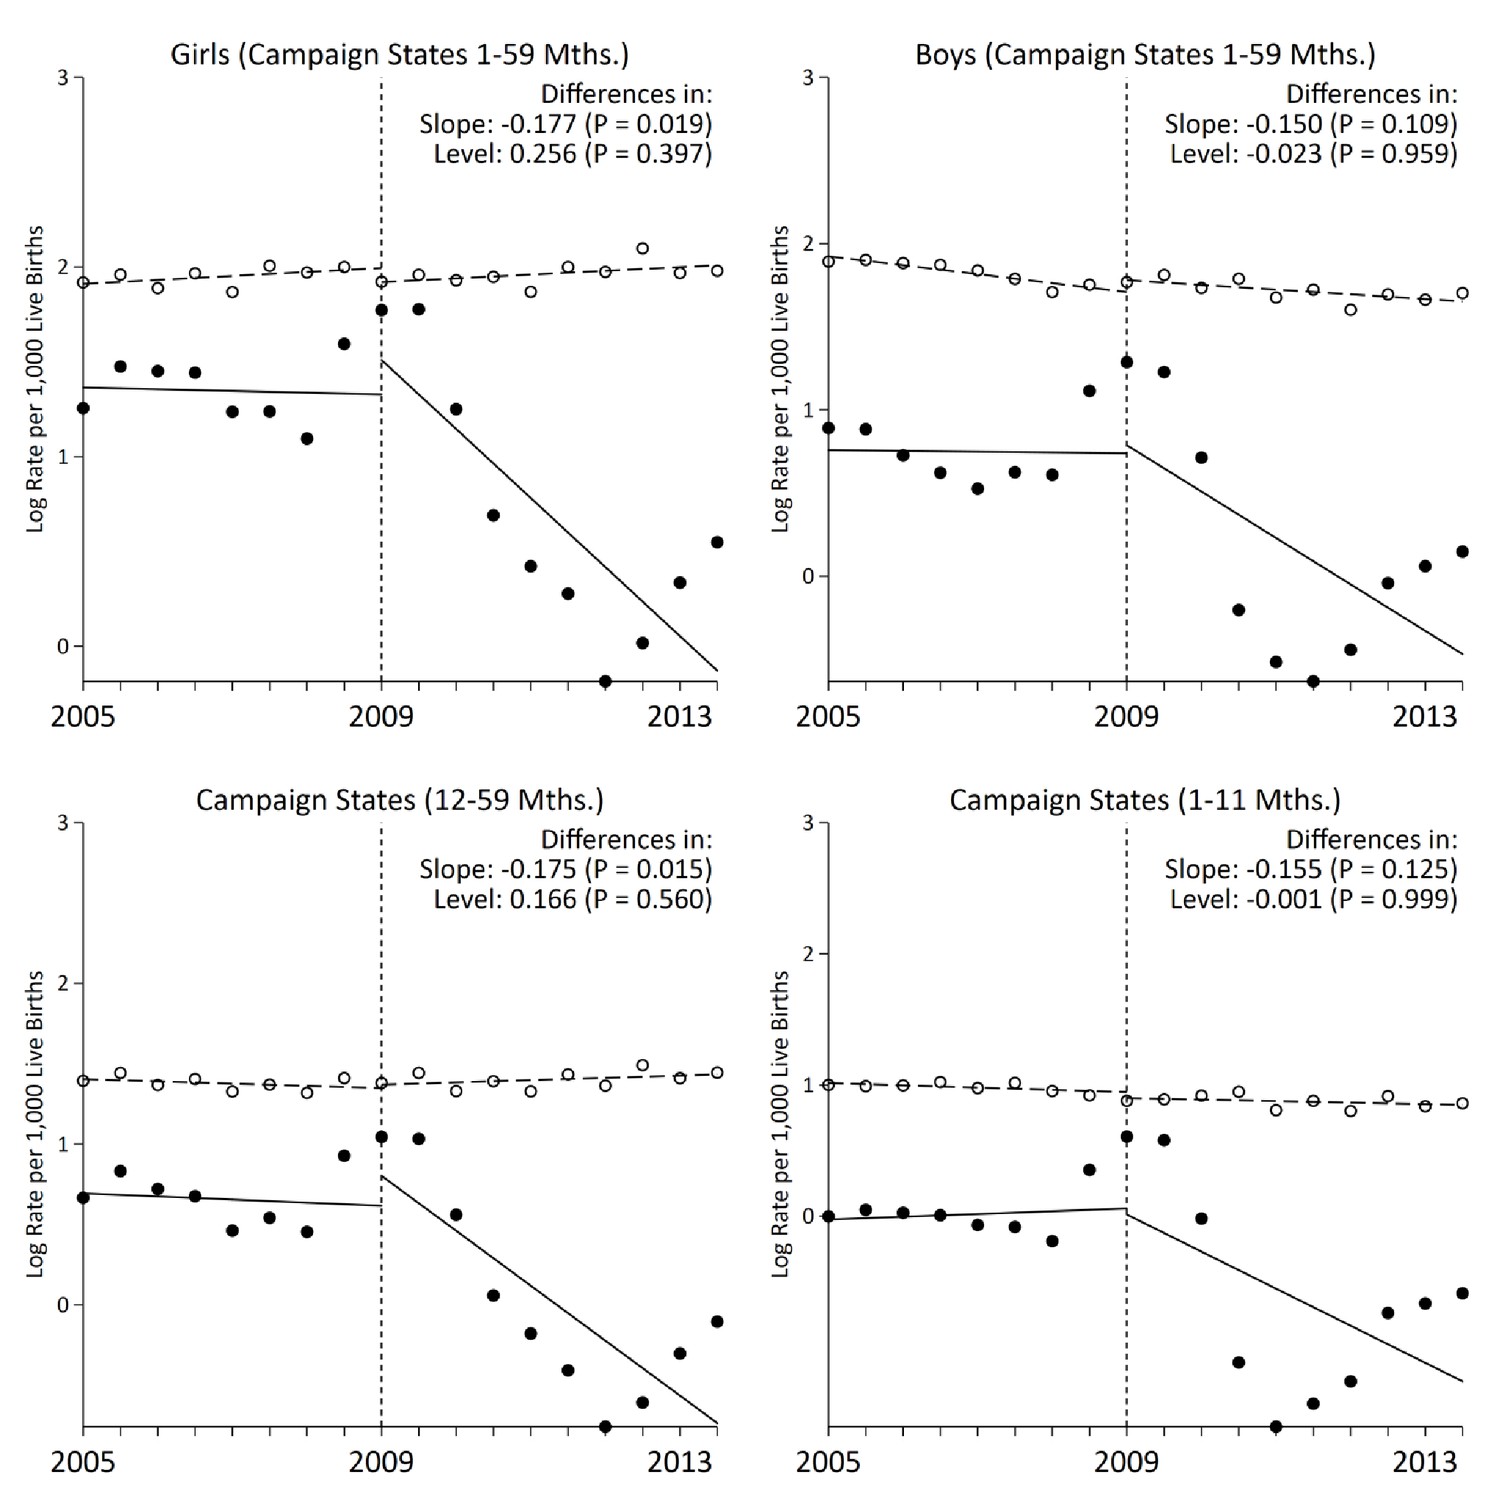
Stratified analysis of interrupted time-series models on measles mortality (black) versus control mortality (white) among 1–59 month-old children, India.
The measles case definition attributed a death to measles if at least one physician assigned measles as the cause of death or if the respondent reported the deceased child to have a history of measles (using the local language term). Control deaths were selected based on comparability of pre-intervention trends to trends for measles. Control deaths were injuries, non-communicable diseases, or congenital anomalies.
-
Figure 3—source data 1
Child measles mortality rates in campaign states by age and sex.
- https://doi.org/10.7554/eLife.43290.015
Figure 4
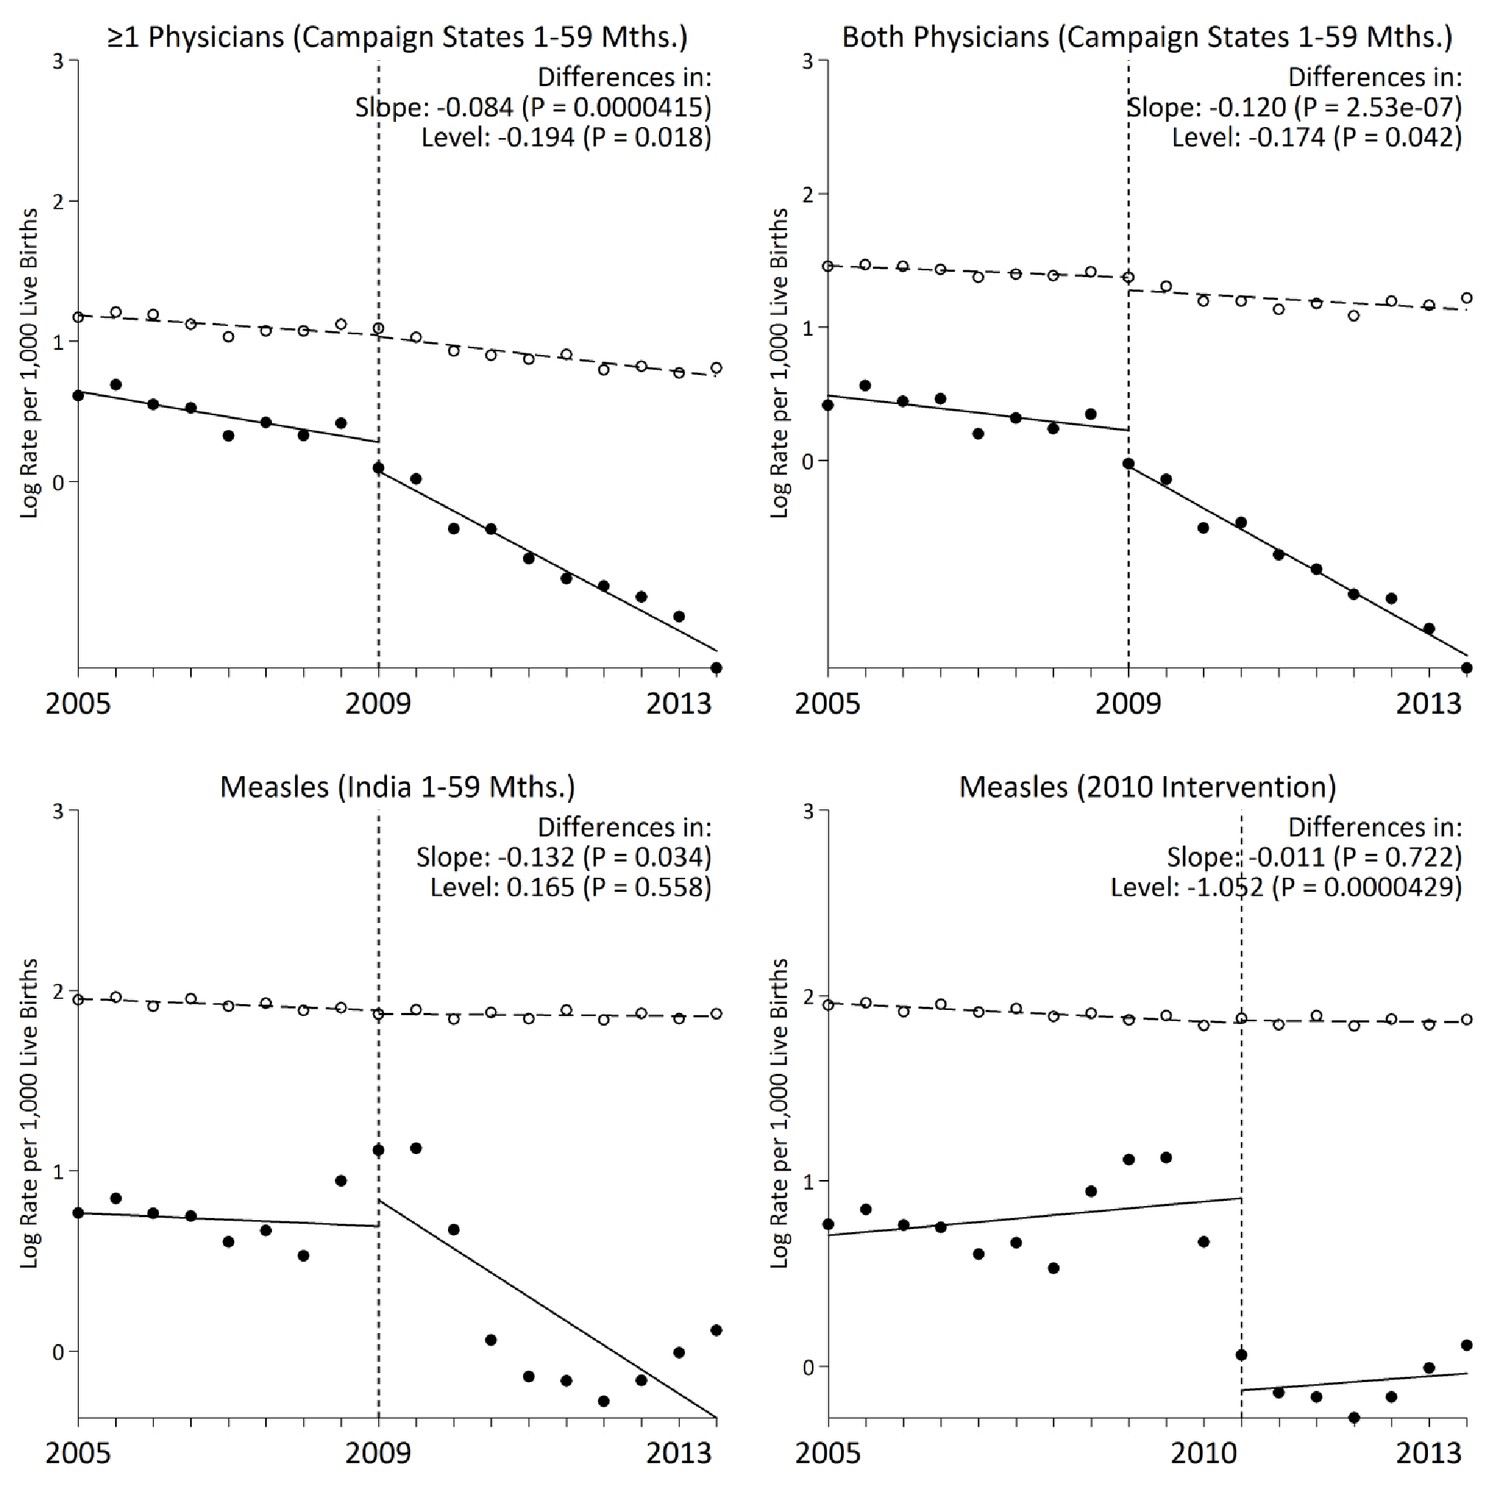
Interrupted time-series models on measles mortality (black) versus control mortality (white) among 1–59 month-old children using alternate measles definitions, India.
We present two narrower measles definitions of one or more physician coding and both physician coding of measles. All other control deaths were injuries, non-communicable diseases, or congenital anomalies. Control deaths were selected based on comparability of pre-intervention trends to trends for measles. For both physicians and at least one physician coding measles, control deaths were congenital anomalies or non-communicable diseases. We observed no significant difference when comparing pre-intervention trends for the control deaths to those for case deaths based on the narrower definitions of at least one physician coding measles and both physicians coding measles (p>0.4 for both comparisons).
-
Figure 4—source data 1
Child measles mortality rates by case definition.
- https://doi.org/10.7554/eLife.43290.018
Figure 5

National coverage estimates of child immunization, maternal literacy, and oral rehydration supplementation by measles campaign states, India, 2005–2013.
Estimates were obtained from the National Family Health Survey and the District Level Household and Facility Survey through 2002 to 2014. Measles vaccination coverage was defined as the percentage of children aged 12 to 23 months receiving any measles vaccine from routine immunization. The difference-in-difference test reports the change in coverage estimates before and after campaign launch in campaign states versus non-campaign states. We observed no significant change in coverage estimates between campaign states versus non-campaign states for maternal literacy and diarrhoea treatment-seeking (data not shown).
Figure 6

Multilevel logistic regression analysis of measles mortality among 1–59 month children, India, 2005–2013.
N = number of observations; n = number of measles deaths. Living in a campaign district was assigned based on the individual’s date of birth and the month when a particular district launched campaigns. The models were fitted with random intercepts by state and district and were adjusted for urban/rural residence, measles vaccination coverage, vitamin A supplementation, oral rehydration supplementation, maternal literacy, pneumonia treatment-seeking, and diarrhoea treatment-seeking. Effect estimates are weighted by their inverse-variance. There was significant variation in measles mortality odds across districts (τ = 0.094) and across states (τ = 0.147). Residual heterogeneity between regions remained significant after adjustment – the median odds ratio was 1.28 at the district level and 1.43 at the state level, while the intra-class correlation was 6.8% at the district level and 4.2% at the state level.
Figure 7

Distribution of 1–59 month measles mortality risk (relative to all-cause mortality) by sex, India, 2005–2013.
We fitted maps using a generalized linear geostatistical model with integrated nested Laplace approximations adjusted for children living in campaign districts and urban/rural residence. * denotes campaign states. AN = Andaman and Nicobar Islands. AP = Andhra Pradesh. AR* = Arunachal Pradesh. AS* = Assam. BR* = Bihar. CH = Chandigarh. CG* = Chhattisgarh. DD = Daman and Diu. DN = Dadra and Nagar Haveli. DL = Delhi. GA = Goa. GJ* = Gujarat. HP = Himachal Pradesh. HR* = Haryana. JH* = Jharkhand. JK = Jammu and Kashmir. KA = Karnataka. KL = Kerala. LD = Lakshadweep. MH = Maharashtra. ML* = Meghalaya. MN* = Manipur. MP* = Madhya Pradesh. MZ = Mizoram. NL* = Nagaland. OD = Odisha. PB = Punjab. PY = Puducherry. RJ* = Rajasthan. SK = Sikkim. TN = Tamil Nadu. TR* = Tripura. UP* = Uttar Pradesh. UT = Uttarakhand. WB = West Bengal. Refer to Figure 1—figure supplement 1 for the description of NHM and EAG states.
Tables
Table 1
Measles deaths among 1–59-month children by campaign states, India, 2005–2013.
https://doi.org/10.7554/eLife.43290.003| Child Characteristics | Campaign States (n = 1,195) | Non-campaign States (n = 443) | ||||
|---|---|---|---|---|---|---|
| 2005–9/2010–13 | 2005–9/2010–13 | |||||
| Study Deaths | % | Crude OR (95% CI) | Study Deaths | % | Crude OR (95% CI) | |
| Age Groups | ||||||
| 1 to 11 Months | 374/68 | 36/33 | Ref | 159/63 | 49/48 | Ref |
| 12 to 59 Months | 627/126 | 64/67 | 1.6 (1.5, 1.9) | 151/70 | 51/52 | 1.3 (1.0, 1.5) |
| Sex | ||||||
| Male | 415/86 | 41/41 | Ref | 142/54 | 45/43 | Ref |
| Female | 586/108 | 59/59 | 1.1 (0.8, 1.6) | 168/79 | 55/57 | 1.2 (0.8, 1.9) |
| Residence | ||||||
| Urban | 116/30 | 12/14 | Ref | 69/28 | 33/29 | Ref |
| Rural | 885/164 | 88/86 | 0.7 (0.5, 1.1) | 241/105 | 67/71 | 1.1 (0.6, 1.8) |
| National Health Mission (NHM) | ||||||
| Other States | 148/35 | 8/11 | Ref | 211/99 | 77/81 | Ref |
| NHM States | 853/159 | 92/89 | 0.8 (0.5, 1.2) | 99/34 | 23/19 | 0.7 (0.4, 1.2) |
| Empowered Action Group (EAG) | ||||||
| Richer States | 195/46 | 9/11 | Ref | 236/105 | 80/83 | Ref |
| Poorer States | 806/148 | 91/89 | 0.8 (0.5, 1.1) | 74/28 | 20/17 | 0.9 (0.5, 1.4) |
| Family Reported Child Had History of Measles† | ||||||
| Yes | 783/132 | 79/64 | 3.0 (1.7, 5.1) | 235/101 | 76/76 | 0.7 (0.2, 1.8) |
| No | 48/24 | 4/13 | Ref | 23/7 | 7/5 | Ref |
| Missing | 170/38 | 17/23 | 52/25 | 17/19 | ||
| Child Received ≥ 1 Dose of Measles Vaccine‡ | ||||||
| Yes | 346/91 | 34/47 | 0.4 (0.3, 0.6) | 144/66 | 48/51 | 0.9 (0.6, 1.5) |
| No | 509/75 | 51/38 | Ref | 125/54 | 39/40 | Ref |
| Missing | 146/28 | 15/15 | 41/13 | 13/9 | ||
| History of Rash | ||||||
| Yes | 866/159 | 86/78 | 1.4 (0.9, 2.1) | 275/119 | 87/89 | 1.1 (0.5, 2.2) |
| No | 126/32 | 13/21 | Ref | 30/14 | 11/11 | Ref |
| Missing | 9/3 | 1/1 | 5/0 | 2/0 | ||
| History of Fever | ||||||
| Yes | 761/135 | 75/69 | 1.2 (0.8, 1.8) | 214/98 | 72/74 | 0.7 (0.4, 1.2) |
| No | 209/46 | 22/24 | Ref | 84/28 | 25/21 | Ref |
| Missing | 31/13 | 3/7 | 12/7 | 3/5 | ||
-
The measles case definition attributed a death to measles if at least one physician assigned measles as the cause of death or if the respondent reported the deceased child to have a history of measles (using the local language term).
† Respondents were asked whether the child had any skin diseases or rash, followed by whether this was measles using the local term.
-
‡ Respondents were asked whether the child was immunized and, if so, whether they received an injection for measles using the local term.
-
Table 1—source data 1
Sample characteristics.
- https://doi.org/10.7554/eLife.43290.004
Table 2
Average annual rate reduction of 1–59-month measles mortality by measles campaign states versus non-campaign states, big states in India, 2005–2013.
https://doi.org/10.7554/eLife.43290.010| Big States in India | AARR (95% CI) |
|---|---|
| Campaign States | 14.6 (5.3, 23.0) |
| Assam | 1.7 (–0.6, 3.9) |
| Bihar | 12.2 (–1.5, 24.1) |
| Chhattisgarh | 16.9 (1.0, 30.3) |
| Gujarat | 13.6 (1.2, 24.4) |
| Haryana | 2.8 (–3.3, 8.5) |
| Jharkhand | 8.2 (–24.9, 32.4) |
| Madhya Pradesh | 19.9 (6.6, 31.3) |
| Rajasthan | 16.8 (4.6, 27.3) |
| Uttar Pradesh | 18.8 (14.5, 22.8) |
| Non-Campaign States | 6.8 (3.8, 9.7) |
| Andhra Pradesh | 12.9 (0.3, 24.0) |
| Himachal Pradesh | –7.7 (–32.8, 12.7) |
| Jammu and Kashmir | 2.6 (–3.4, 8.2) |
| Karnataka | 16.2 (7.9, 23.8) |
| Maharashtra | –3.3 (–13.8, 6.2) |
| Odisha | 6.0 (–0.8, 12.4) |
| Punjab | 7.5 (–0.6, 14.9) |
| Tamil Nadu | 6.2 (–2.5, 14.2) |
| Uttarakhand | 7.9 (–13.1, 25.0) |
| West Bengal | 7.5 (2.7, 12.1) |
| India (Overall) | 12.2 (4.7, 19.0) |
-
AARR = average annual rate reduction. States with AARR containing zero in the 95% confidence interval were considered to have no significant change in AARR of measles mortality. In campaign states, the pre-intervention AARR is −4.0% (-42.0%, 24.0%) and the post-intervention AARR is 26.8% (-1.1%, 47.0%). In non-campaign states, the pre-intervention AARR is 1.4% (-18.6%, 18.1%) and the post-intervention AARR is 10.6% (2.5%, 18.1%).
-
Table 2—source data 1
Average annual rate reduction of measles mortality.
- https://doi.org/10.7554/eLife.43290.011
Table 3
Changes in slope and level of measles mortality log rates before and after campaign launch, India, 2005–2013.
https://doi.org/10.7554/eLife.43290.016| Change in slope before campaign launch | Change in slope after campaign launch | Adjusted change in level | Adjusted change in slope | P-value of adjusted change in slope | |
|---|---|---|---|---|---|
| India | –0.009 (–0.056, 0.038) | –0.125 (–0.251, 0.001) | 0.165 (–0.405, 0.736) | –0.132 (–0.252,–0.011) | 0.034 |
| Girls | –0.005 (–0.298, 0.684) | –0.135 (–0.240,–0.031) | 0.204 (–0.291, 0.700) | –0.135 (–0.227,–0.043) | 0.006 |
| Boys | –0.014 (–0.071, 0.044) | –0.112 (–0.272, 0.049) | 0.058 (–0.673, 0.788) | –0.125 (–0.278, 0.029) | 0.107 |
| 12-to-59-months | –0.011 (–0.060, 0.038) | –0.124 (–0.243,–0.024) | 0.148 (–0.288, 0.584) | –0.139 (–0.235,–0.043) | 0.006 |
| 1-to-11-months | 0.001 (–0.042, 0.044) | –0.129 (–0.296, 0.038) | 0.162 (–0.653, 0.977) | –0.127 (–0.287, 0.032) | 0.113 |
| Campaign States | –0.004 (–0.065, 0.056) | –0.157 (–0.320, 0.007) | 0.121 (–0.592, 0.835) | –0.164 (–0.320,–0.008) | 0.040 |
| Girls | –0.004 (–0.062, 0.053) | –0.178 (–0.330,–0.025) | 0.256 (–0.362, 0.873) | –0.177 (–0.307,–0.047) | 0.019 |
| Boys | –0.002 (–0.083, 0.079) | –0.137 (–0.331, 0.057) | –0.023 (–0.915, 0.870) | –0.150 (–0.336, 0.036) | 0.109 |
| 12-to-59-months | –0.010 (–0.070, 0.051) | –0.161 (–0.306,–0.016) | 0.166 (–0.432, 0.763) | –0.175 (–0.314,–0.036) | 0.015 |
| 1-to-11-months | 0.011 (–0.048, 0.069) | –0.152 (–0.361, 0.058) | –0.001 (–0.355, 0.046) | –0.155 (–0.355, 0.046) | 0.125 |
| Non-campaign States | –0.027 (–0.041,–0.014) | –0.040 (–0.090, 0.010) | 0.193 (–0.094, 0.481) | –0.037 (–0.088, 0.015) | 0.157 |
-
Data are ordinary least-squares regression models adjusted for time fixed effects and time interactions. Estimates are given with 95% confidence intervals. Refer to Figure 2 and Table 5 for the description of measles and control deaths definition. Campaign states include: Arunachal Pradesh, Assam, Bihar, Chhattisgarh, Gujarat, Haryana, Jharkhand, Madhya Pradesh, Manipur, Meghalaya, Nagaland, Rajasthan, Tripura, and Uttar Pradesh. Non-campaign states include all other states and union territories. For India and campaign states, change in slope is adjusted for trends in control conditions of injuries, non-communicable diseases, or congenital anomalies. Control groups are selected based on comparison of pre-intervention trends for each non-measles cause of death to that of measles and selecting those groups who show no significant change in pre-intervention slope. The adjusted change in level represents the difference in the level between measles and control in the six months immediately following campaign launch. The adjusted change in slope is a difference-in-difference slope representing the difference between the treatment and control group's differences in their pre-intervention and post-intervention trends.
Table 4
Deaths averted among 1–59-month-old children following measles campaign launch, India.
https://doi.org/10.7554/eLife.43290.022| Expected 2013 rate per 1,000 live births | Observed 2013 rate per 1,000 live births | Deaths without intervention, 2010–2013 (000 s) | Deaths averted, 2010- 2013 (000s) | Percent averted (%) | |
|---|---|---|---|---|---|
| India | 1.84 | 0.69 | 73–143 | 41–56 | 39–57% |
| Campaign States | 2.77 | 0.76 | 63–111 | 38–44 | 40–60% |
| Girls | 3.63 | 0.88 | 31–61 | 16–21 | 34–52% |
| Boys | 2.05 | 0.63 | 32–50 | 22–23 | 46–69% |
| Non-campaign States | 0.66 | 0.53 | 10–32 | 3–12 | 30–38% |
-
Data are ordinary least-squares regressions models adjusted for time fixed effects and time interactions. The expected rates were extrapolated by extending the pre-intervention trend to the end of the time series and then applied to the estimated UN live births at 2013 to estimate the potential magnitude of the intervention effects. National estimates are derived from the summation of stratified models. The range represents the upper and lower bounds on the basis of one or more physician coding including family reporting the child to have a history of measles (using the local language term) and only one or more physician coding, respectively.
Table 5
ICD-10 codes used to define measles and other causes of death.
https://doi.org/10.7554/eLife.43290.023| Disease | ICD-10 code range |
|---|---|
| Measles | B01, B05 |
| Diarrhoea | A00-A09 |
| Pneumonia | A37, H65-H68, H70, H71, J00-J06, J09-J18, J20-J22, J32, J36, J85, J86, P23, U04 |
| Injuries | S00-S99, T00-T71, T73-T75, T78-T98, V01-V06, V09-V99, W00-W46, W49-W60, W64-W70, W73-W81, W83-W94, W99, X00-X06, X08-X52, X57-X99, Y00-Y36, Y40-Y66, Y69-Y91, Y97, Y98 |
| Congenital anomalies | Q00-Q07, Q10-Q18, Q20-Q28, Q30-Q45, Q50-Q56, Q60-Q87, Q89-Q93, Q95, Q96-Q99 |
| Non-communicable diseases | C00-C26, C30-C34, C37-C41, C43-C58, C60-C85, C88, C90-C97, D01-D07, D09-D48, D55-D77, D80-D84, D86, D89, E03-E07, E10-E16, E20-E32, E34, E35, E65-E68, E70-E80, E83-E90, F00-F07, F09-F25, F28-F34, F38-F45, F48, F50-F55, F59-F66, F68-F73, F78-F84, F88-F95, F98, F99, G10-G13, G20-G26, G30-G32, G35-G37, G40, G41, G43-G47, G50-G64, G70-G73, G80-G83, G90-G99, H00-H06, H11, H13, H15-H22, H25-H28, H30-H36, H40 H42, H43-H55, H57-H59, H61, H62, H69, H72-H75, H80-H83, H90-H95, I00-I02, I05-I13, I15, I20-I28, I31, I34-I38, I42-I52, I60-I74, I77-I89,I95, I97-I99, J30, J31, J33-J35, J37-J47, J60, J64, J66-J70, J80-J82,J84, J90-J96, J98, J99, K00, K03, K06-K14, K20-K23, K25-K31,K35-K38, K40-K46, K50-K52, K55-K60, K62, K63, K70-K77, K80, K82, K83, K85-K87, K90-K93, L05, L10-L14, L20-L30, L40-L45, L50-L60, L62-L68, L70-L75, L80-L95, L97-L99, M02, M03, M05-M25, M30-M36, M40-M43, M45-M51, M53, M54, M61-M63, M65-M68, M70-M73,M75-M77, M79-M85, M87-M96, M99, N00-N08, N11-N23, N25-N29,N31-N33, N35-N37, N39, N40, N42-N48, N50, N51, N60, N62-N64, N75-N77, N80-N99, P04, P08, P51, P53-P60, P70-P72, P74-P76, P78, P80, P81, P83, P92-P94, R00, R01, R03-R05, R06, R11-R23, R26, R27, R29-R36, R39-R49, R55, R56, R59, R63, R70-R74, R76, R77, R80-R82, R84-R87, R90, R91 |
-
The measles case definition attributed a death to measles if at least one physician coded measles as the cause of death; or that the living respondent reported the child to have a history of measles (using the local language term. Control deaths were final codes of injury, non-communicable disease, or congenital anomaly.
Table 6
Multilevel models for measles mortality among 1–59-month children, India, 2005–2013.
https://doi.org/10.7554/eLife.43290.024| N = 26,505 | Model 1 | Model 2 | Model 3 | Model 4 | Model 5 | Model 6 |
|---|---|---|---|---|---|---|
| Level 1 (Individual/Child) | ||||||
| 12–59 months (v. 1–11 months) | --- | 1.50 (1.34, 1.69) | --- | --- | 1.56 (1.38, 1.75) | 1.48 (1.33, 1.42) |
| Female (v. Male) | --- | 1.28 (1.16, 1.42) | --- | --- | 1.28 (1.15, 1.41) | 1.28 (1.15, 1.42) |
| Born ≥ 2009 (v. < 2009) | --- | 0.74 (0.66, 0.84) | --- | --- | 0.80 (0.70, 0.91) | 0.80 (0.70, 0.91) |
| Rural (v. Urban) | --- | 1.04 (0.89, 1.21) | --- | --- | 1.05 (0.90, 1.22) | 1.04 (0.89, 1.21) |
| Antibiotics (v. No) | --- | 1.15 (0.96, 1.38) | --- | --- | 1.14 (0.95, 1.37) | --- |
| Missing/Unknown | --- | 0.89 (0.76, 1.04) | --- | --- | 0.88 (0.75, 1.03) | --- |
| Received at Least One Measles Vaccine (v. No) | --- | 1.03 (0.91, 1.15) | --- | --- | 1.03 (0.92, 1.16) | --- |
| Missing/Unknown | --- | 0.87 (0.73, 1.03) | --- | --- | 0.87 (0.75, 1.03) | --- |
| Level 2 (District) | ||||||
| Living in Measles Campaign District (v. No) | --- | --- | 0.54 (0.39, 0.75) | --- | 0.57 (0.40, 0.80) | 0.57 (0.40, 0.80) |
| Level 3 (State) | ||||||
| Measles Vaccination (%) | --- | --- | --- | 0.97 (0.94, 1.00) | 0.96 (0.92, 0.99) | 0.96 (0.92, 0.99) |
| Vitamin A Supplementation (%) | --- | --- | --- | 0.99 (0.97, 1.02) | 0.99 (0.97, 1.01) | 0.99 (0.97, 1.01) |
| Oral Rehydration Supplementation (%) | --- | --- | --- | 0.97 (0.94, 0.99) | 0.97 (0.94, 0.99) | 0.97 (0.94, 0.99) |
| Maternal Literacy (%) | --- | --- | --- | 0.97 (0.94, 0.99) | 0.97 (0.95, 1.00) | 0.97 (0.95, 1.00) |
| Diarrhoea Treatment-seeking (%) | --- | --- | --- | 1.00 (0.99, 1.03) | 1.01 (0.98, 1.03) | 1.00 (0.98, 1.03) |
| Pneumonia Treatment-seeking (%) | --- | --- | --- | 1.06 (1.02, 1.10) | 1.07 (1.02, 1.11) | 1.07 (1.02, 1.11) |
| Measures of Variation | ||||||
| Area-level Variance (SE) | ||||||
| District | 0.09 (0.03) | 0.14 (0.05) | 0.09 (0.03) | 0.07 (0.03) | 0.07 (0.03) | 0.07 (0.03) |
| State | 0.15 (0.06) | 0.09 (0.03) | 0.16 (0.06) | 0.15 (0.06) | 0.15 (0.06) | 0.14 (0.07) |
| Median Odds Ratio | ||||||
| District | 1.34 | 1.34 | 1.34 | 1.44 | 1.28 | 1.28 |
| State | 1.44 | 1.42 | 1.46 | 1.30 | 1.44 | 1.43 |
| Intra-class Correlation (%) | ||||||
| District | 6.83 | 6.46 | 7.02 | 6.33 | 6.10 | 5.99 |
| State | 4.17 | 3.83 | 4.39 | 4.28 | 4.14 | 4.06 |
-
All models are fitted with random intercepts at the district and state level. Model 1 is a null model containing no predictors in order to assess variance and clustering. Model 2 includes only individual-level characteristics. Models 3 and 4 include only district- and state-level predictors, respectively. Model 5 includes all predictors. Model 6 includes only the relevant predictors from the previous model.
Additional files
-
Transparent reporting form
- https://doi.org/10.7554/eLife.43290.025
Download links
A two-part list of links to download the article, or parts of the article, in various formats.
Downloads (link to download the article as PDF)
Open citations (links to open the citations from this article in various online reference manager services)
Cite this article (links to download the citations from this article in formats compatible with various reference manager tools)
The impact of measles immunization campaigns in India using a nationally representative sample of 27,000 child deaths
eLife 8:e43290.
https://doi.org/10.7554/eLife.43290


